microfluidic based human blood plasma separation
TRANSCRIPT

Graduate Theses, Dissertations, and Problem Reports
2012
Microfluidic Based Human Blood Plasma Separation Microfluidic Based Human Blood Plasma Separation
Ruizhi Zhong West Virginia University
Follow this and additional works at: https://researchrepository.wvu.edu/etd
Recommended Citation Recommended Citation Zhong, Ruizhi, "Microfluidic Based Human Blood Plasma Separation" (2012). Graduate Theses, Dissertations, and Problem Reports. 3349. https://researchrepository.wvu.edu/etd/3349
This Thesis is protected by copyright and/or related rights. It has been brought to you by the The Research Repository @ WVU with permission from the rights-holder(s). You are free to use this Thesis in any way that is permitted by the copyright and related rights legislation that applies to your use. For other uses you must obtain permission from the rights-holder(s) directly, unless additional rights are indicated by a Creative Commons license in the record and/ or on the work itself. This Thesis has been accepted for inclusion in WVU Graduate Theses, Dissertations, and Problem Reports collection by an authorized administrator of The Research Repository @ WVU. For more information, please contact [email protected].

Microfluidic Based Human Blood Plasma Separation
Ruizhi Zhong
Thesis Submitted to the
Benjamin M. Statler College of Engineering and Mineral Resources at
West Virginia University
in partial fulfillment of the requirements for the degree of
Master of Science
in
Mechanical Engineering
Yuxin Liu, Ph.D., Advisor and Chair
Nianqiang Wu, Ph.D., Co-Advisor
Ismail Celik, Ph.D.
Department of Mechanical and Aerospace Engineering
Morgantown, West Virginia
2012
Keywords: Microfluidics; human blood; active separation; passive separation

ABSTRACT
Microfluidic Based Human Blood Plasma Separation
Ruizhi Zhong
Microfluidic based biotechnologies have been widely applied for biological and
biomedical research and applications because the physical scales of microfluidics are
suitable for biological cells and provide the ability and flexibility to control
spatiotemporal biochemical parameters. The current efforts for biosensor technologies
are aiming to develop detection technologies directly from small volumes of the
human fluids, such as blood, urea, and saliva, for accurate, fast, and affordable
detection and analysis.
Human blood provides information and supports the functioning of human body, such
as nourishing tissues, regulating organs activities and defending harmful material.
Blood components are the prime interests for biosensor applications in medicine
research. Separation of different blood components, such as plasma, red blood cells,
or white blood cells, is important for specific downstream detections (such as cancer
diagnosis and biohazard detections) by preventing contamination of the plasma from
blood cells’ DNA. Conventional methods for blood separation include flow cytometry,
centrifugation and filtration. However, high levels of skills, large volumes of samples
and long processing time are usually required in these methods. Microfluidic methods
for blood separation can provide advantages over these conventional methods, such as
small blood volume handling, easy fabrication, fast processing, and miniaturized and
portable devices for point-of-care analysis.
In this thesis work, we investigated two different microfluidic approaches for human
blood separation: 1) Hydrodynamic bifurcation law based continuous blood
separation. The bifurcation law, centrifugation force and Fåhræus–Lindqvist effect
were employed in the approach. By using the COMSOL Multiphysics simulation, we
optimized the device design, and the efficiency of blood separation of the microfluidic
device was conducted using samples with different hematocrit levels and running
velocities. A series of experiments were performed to investigate and quantify the two
effects. The experimental results showed that the multiple bifurcation devices can
provide plasma separation with high separation efficiency and yield. Electrophoresis
analysis was used to examine major protein components in the separated plasma from
microfluidic devices compared with that separated by a conventional centrifuge
method and showed that the major proteins presented in both testing groups. 2)
Membrane based passive blood separation. In this approach, a microfluidic capillary
pump and a commercial VividTM
plasma separation membrane were integrated to
separate, collect and deliver the separated plasma from a finger-prick whole blood.

The plasma released from the membrane was collected and drawn into the
microfluidic capillary pump for further downstream detection. It was demonstrated
that the membrane can separate plasma depending on the natural forces of capillary
action without any active pumping or electricity to operate.
Our microfluidic plasma separators are expected to be integrated with other sensing
elements into a reliable, cost-effective and field-deployable biosensor for detection of
heavy metals and biomarkers from a small volume of human blood. In this regard, an
integration lab-on-a-chip microfluidic system needs to be further investigated, in
which on-chip valves and fluid controls will be used for the system integration.

iv
ACKNOWLEDGEMENTS
I would like to express my gratitude to my research advisor Dr. Yuxin Liu for
providing me the opportunity to do research under her guidance. I am sincerely
grateful to my committee members for their support and guidance on my research.
Special thanks to all members in Dr. Liu’s group for their help in my research. Thanks
to WVU Shared Research Facilities (Cleanroom facilities) and Microfluidic
Integrative Cellular Research on Chip Laboratory (MICRoChip Lab) at WVU. The
research work is supported by National Science Foundation grant EPS-1003907.
v
TABLE OF CONTENTS
ABSTRACT ................................................................................................................... ii
ACKNOWLEDGEMENTS .......................................................................................... iv
LIST OF FIGURES ..................................................................................................... vii
LIST OF TABLES ........................................................................................................ ix
CHAPTER 1: Introduction ........................................................................................... ix
1.1 Importance for Human Blood Analysis ................................................................... 1
1.2 Research and Clinical Needs for Blood Plasma Separation .................................... 2
1.3 Conventional Approaches ........................................................................................ 3
1.4 Microfluidics and the Advantages ........................................................................... 5
1.5 Summary .................................................................................................................. 7
CHAPTER 2: Literature Review ................................................................................... 9
2.1 Conventional Methods ............................................................................................. 9
2.1.1 Flow Cytometry ............................................................................................. 9
2.1.2 Filtration ....................................................................................................... 10
2.1.3 Centrifugation .............................................................................................. 12
2.2 Micro-scale Technologies for Blood Processing ................................................... 14
2.2.1 Mechanical Force Based Blood Separation ................................................. 14
2.2.2 Dielectrophoresis Based Blood Separation .................................................. 16
2.2.3 Optical Interaction Based Blood Separation ................................................ 17
2.2.4 Magnetic Based Blood Separation ............................................................... 18
2.2.3 Biomedical Interaction Based Blood Separation ......................................... 19
2.3 Summary of the Microfluidic Methods.................................................................. 19
CHAPTER 3: Principles for Microfluidic Based Plasma Separation .......................... 23
3.1 Hydrodynamics of Blood Cells .............................................................................. 23
3.2 Bifurcation Law (Zweifach–Fung Effect) ............................................................. 24
3.3 Centrifuge Force .................................................................................................... 26
3.4 Fahraeus-Lindqvist Effect ...................................................................................... 28
CHAPTER 4: Microfluidic Device Design and Fabrication ....................................... 29
4.1 Single Bifurcation Microfluidic Device................................................................. 29
4.2 Fabrication ............................................................................................................. 30
4.3 Blood and Device Preparation ............................................................................... 32
4.4 Results and Limitations.......................................................................................... 33
Chapter 5: Microfluidic Multiple Bifurcation Device and COMSOL Simulation ...... 36
5.1 Multiple Bifurcation Device Design ...................................................................... 36
5.2 COMSOL Multiphysics Simulation ....................................................................... 38
5.2.1 Implementation of the Simulation ............................................................... 39
5.3 Computational Results ........................................................................................... 41
5.3.1 Reynolds Number ........................................................................................ 41
5.3.2 Flow Velocity Profile ................................................................................... 42
5.3.3 Velocity in the Daughter Channels .............................................................. 44

vi
5.3.4 Flow Rate Ratios .......................................................................................... 44
CHAPTER 6: Experimental Results of Multiple Bifurcation Device ......................... 48
6.1 Experimental Procedures ....................................................................................... 48
6.2 Results .................................................................................................................... 49
6.3 Hydrodynamic Effects on Blood Separation ......................................................... 51
6.4 Hematocrit Level Effect ......................................................................................... 53
6.5 Running Speed Effect ............................................................................................ 54
6.6 Electrophoresis Results .......................................................................................... 55
CHAPTER 7: Microfluidic Membrane Based Plasma Separation .............................. 58
7.1 Introduction ............................................................................................................ 58
7.2 Vivid Plasma Separation Membrane ...................................................................... 61
7.3 The Darcy’s Law .................................................................................................... 63
7.4 Device Fabrication ................................................................................................. 64
7.5 Experimental Results ............................................................................................. 66
7.6 Conclusions ............................................................................................................ 67
CHAPTER 8: Conclusions and Future Work .............................................................. 68
8.1 Conclusions ............................................................................................................ 68
8.2 Future Work ........................................................................................................... 69
References .................................................................................................................... 72
vii
LIST OF FIGURES
Figure 1.1 Schematic of blood components ................................................................... 1
Figure 1.2 Illustration of heavy metal hazards to human body ...................................... 2
Figure 1.3 (a) Flow cytometer. (b) Centrifuge. (c) Continuous renal replacement
machine. ......................................................................................................................... 4
Figure 1.4 Centrifuged plasma ....................................................................................... 5
Figure1.5 A microfluidic biosensor device for cancer detection ................................... 6
Figure 2.1 Schematic diagram of the flow cytometer .................................................. 10
Figure 2.2 (a) The side view and the top view of a microfluidic filtration system. (b)
The microfluidic filtration device ................................................................................ 11
Figure 2.3 A microfluidic centrifuge device ................................................................ 13
Figure 2.4 (a) Offset array of simple microposts set across a 500-mm-wide silicon
channel. (b) Array of complex microposts separated by 7-mm-wide tortuous channels.
...................................................................................................................................... 15
Figure 2.5 Obstacle array designs for trapping cells .................................................... 15
Figure 2.6 Schematic diagram of a flow separator ...................................................... 16
Figure 2.7 Schematic design of an integrated microfluidic sorting system ................. 17
Figure 2.8 (a) Schematic diagram of a continuous magnetic separator having one inlet
and three outlets. (b) Cross-section view of the separator in the paramagnetic capture
mode. ............................................................................................................................ 18
Figure 2.9 A microfluidic lysis device ......................................................................... 19
Figure 3.1 (a) Schematic diagram for interpreting the bifurcation law. (b) An
illustration of critical streamline. ................................................................................. 25
Figure 3.2 Schematic diagram for an example with a 100% separation ...................... 26
Figure 3.3 Microfluidic bend channel structure for assisting blood separation ........... 27
Figure 4.1 The schematic design for microfluidic single bifurcation device .............. 29
Figure 4.2 Schematic process for microfluidic device fabrication .............................. 31
Figure 4.3 The picture shows a syringe loaded with blood hooked on a syringe pump
...................................................................................................................................... 33
Figure 4.4 Results of single bifurcation device A) Design 1 for the microfluidic device.
The frame represents the blood plasma separation region in B, C, and D. B)-D) show
the blood separation at different time as indicated in the figures. The blood flow rate
was kept at3µl/min and the red dashed curve indicated the path of blood cells in the
wider channel. .............................................................................................................. 34
Figure 5.1 The schematic design for microfluidic multiple bifurcation device ........... 36
Figure 5.2 Reynolds numbers in the main channel and the daughter channels ........... 42
Figure 5.3 (a) Velocity filed of the multiple bifurcation device; (b) A detail view at the
first bifurcation............................................................................................................. 43
Figure 5.4 Flow velocities of the daughter channels ................................................... 44
Figure 5.5 The critical streamline of (a) Cell-to-vessel diameter ratio is of the order of
one; and (b) Cell-to-vessel diameter ratio is over the order of one. ............................ 46
viii
Figure 6.1 (a) The schematic of experimental setup. (b) Experimental setup for blood
separation with real-time monitoring. .......................................................................... 49
Figure 6.2 (a) Plasma separation at 1st and 2nd bifurcation. (b) Plasma separation at
3rd and 4th bifurcation. (c) Plasma separation at 5th and 6th bifurcation. .................. 50
Figure 6.3 A) A microfluidic device. B) Blood separation in the microfluidic device. C)
Higher magnification showing blood separation in the device. ................................... 52
Figure 6.4 (a) Hematocrit level effects on the separation efficiency. (b) Hematocrit
level effects on the plasma separation yield................................................................. 53
Figure 6.5 Separation efficiency at different running speeds when the hematocrit level
was kept as 15%. .......................................................................................................... 55
Figure 6.6 Microfluidic separated blood plasma (hematocrit level: 15%) .................. 56
Figure 6.7 Electrophoresis analysis of (a) centrifuged plasma and (b) microfluidic
separated plasma. ......................................................................................................... 57
Figure 7.1 Clamping of the membrane between two PDMS layers ............................ 59
Figure 7.2 (a) Schematic design of crossed microfluidic channels separated by a
nanometer-diameter capillary array interconnect. (b) Schematic design of a parallel
channel system. ............................................................................................................ 60
Figure 7.3 Photograph of a microchip with crossed microchannels and a nanofluidic
membrane ..................................................................................................................... 61
Figure 7.4 Vivid plasma separation membrane ............................................................ 62
Figure 7.5 High quality plasma generation using vivid plasma membrane ................. 63
Figure 7.6 Working mechanism of Darcy’s law in two dimensions ............................ 63
Figure 7.7 Schematic fabrication process of the microfluidic membrane based device
...................................................................................................................................... 65
Figure 7.8 Microfluidic device pattern of membrane based blood plasma separation 65
Figure 7.9 The membrane based device....................................................................... 66
Figure 7.10 The picture shows the plasma separation using a membrane based device
...................................................................................................................................... 66
Figure 8.1 Lab on a Chip ............................................................................................. 69
Figure 8.2 (a) Photograph of an array of complementary organic inverters on 1 mm
thick transparent PDMS. (b) The detailed view of inverter device. (c) Schematic
design of the complementary inverter stack directly prepared on PDMS. .................. 70
Figure 8.3 An integrated microfluidic electrochemical sensor based on planar
electrodes. .................................................................................................................... 71

ix
LIST OF TABLES
Table 3.1 Illustration of the different regimes of cell behavior in a microchannel with
dimensions below 300 µm ........................................................................................... 23
Table 5.1 Flow rate ratios at bifurcations for Newtonian and Non-Newtonian fluid .. 39
Table 5.2 Flow rate ratio chart ..................................................................................... 45
1
CHAPTER 1: Introduction
1.1 Importance for Human Blood Analysis
Human blood provides information and supports the functioning of human body, such
as nourishing tissues, regulating organs activities and defending harmful materials. As
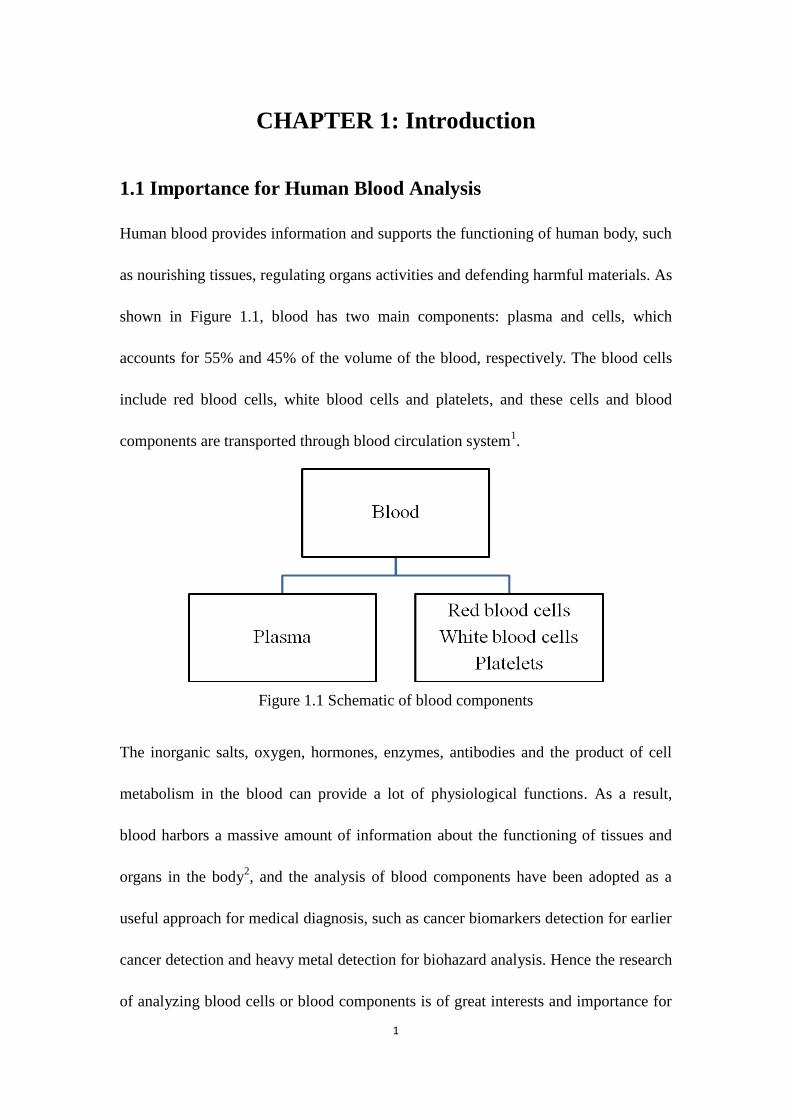
shown in Figure 1.1, blood has two main components: plasma and cells, which
accounts for 55% and 45% of the volume of the blood, respectively. The blood cells
include red blood cells, white blood cells and platelets, and these cells and blood
components are transported through blood circulation system1.
Figure 1.1 Schematic of blood components
The inorganic salts, oxygen, hormones, enzymes, antibodies and the product of cell
metabolism in the blood can provide a lot of physiological functions. As a result,
blood harbors a massive amount of information about the functioning of tissues and
organs in the body2, and the analysis of blood components have been adopted as a
useful approach for medical diagnosis, such as cancer biomarkers detection for earlier
cancer detection and heavy metal detection for biohazard analysis. Hence the research
of analyzing blood cells or blood components is of great interests and importance for
2
biomedical research.
1.2 Research and Clinical Needs for Blood Plasma Separation
Blood components are the prime interests for biosensor applications in medicine
research. Separation of different blood components, such as plasma, red blood cells,
or white blood cells, is important for specific downstream detections, such as by
preventing contamination of the plasma from blood cells’ DNA. Thus, the extraction
of plasma from whole blood is the first step in many biological assay protocols and
critical important in medical diagnostics.
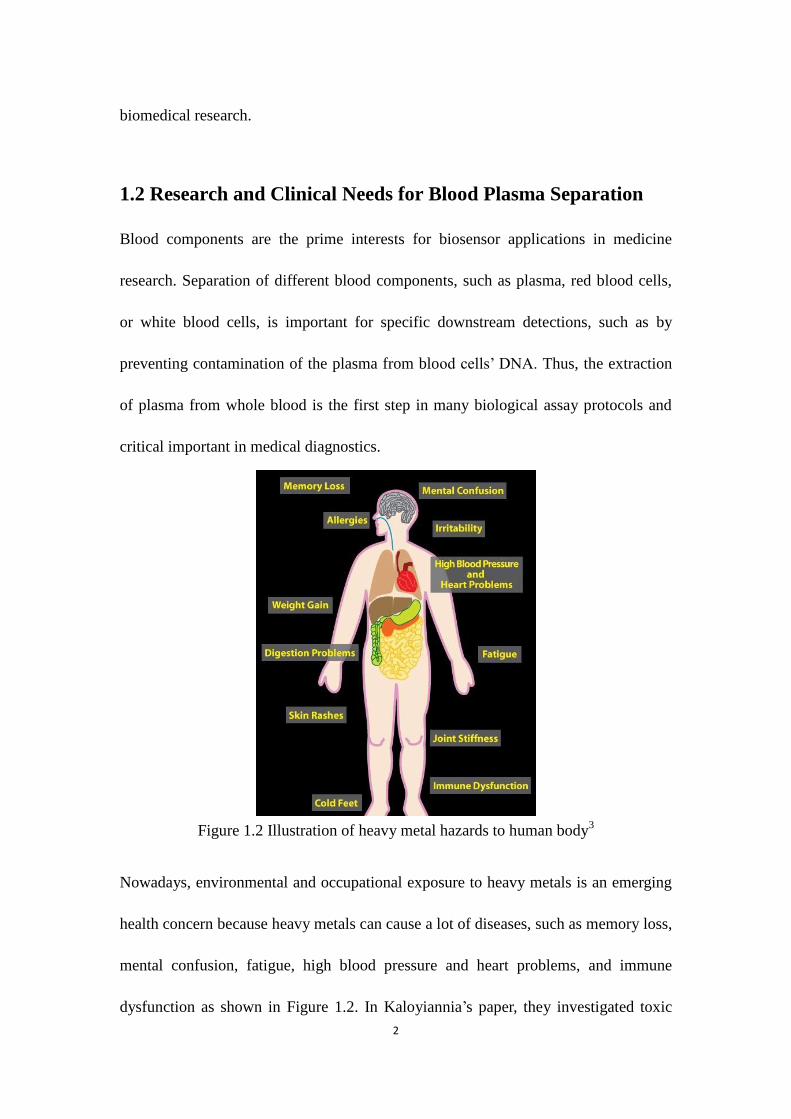
Figure 1.2 Illustration of heavy metal hazards to human body3
Nowadays, environmental and occupational exposure to heavy metals is an emerging
health concern because heavy metals can cause a lot of diseases, such as memory loss,
mental confusion, fatigue, high blood pressure and heart problems, and immune
dysfunction as shown in Figure 1.2. In Kaloyiannia’s paper, they investigated toxic
3
compounds, such as heavy metals (zinc and cadmium) and organic pollutants in
mussel haemolymph, and provided valuable information for environmental
monitoring4.
In order to take further measurements to treat diseases caused by heavy metals, it is
important to firstly detect heavy metals and determine their concentrations from real
world samples. In human blood, the heavy metals exist as ions and conjugated with
proteins in blood plasma, and the existence of blood cells can influence the results of
detection. Because of these, in most cases, the initial step for heavy metal detection is
to get purified plasma by eliminating or reducing the influence of cells by the
separation of plasma from other blood cells.
1.3 Conventional Approaches
Conventional methods for cell identification and plasma separation include flow
cytometer, centrifugation and filtration. Figure 1.3 shows the pictures of those
conventional machines for blood plasma separation, which are flow cytometer,
centrifuge and renal replacement machine, respectively. For flow cytometer, detailed
information of working mechanism will be discussed in the next chapter.
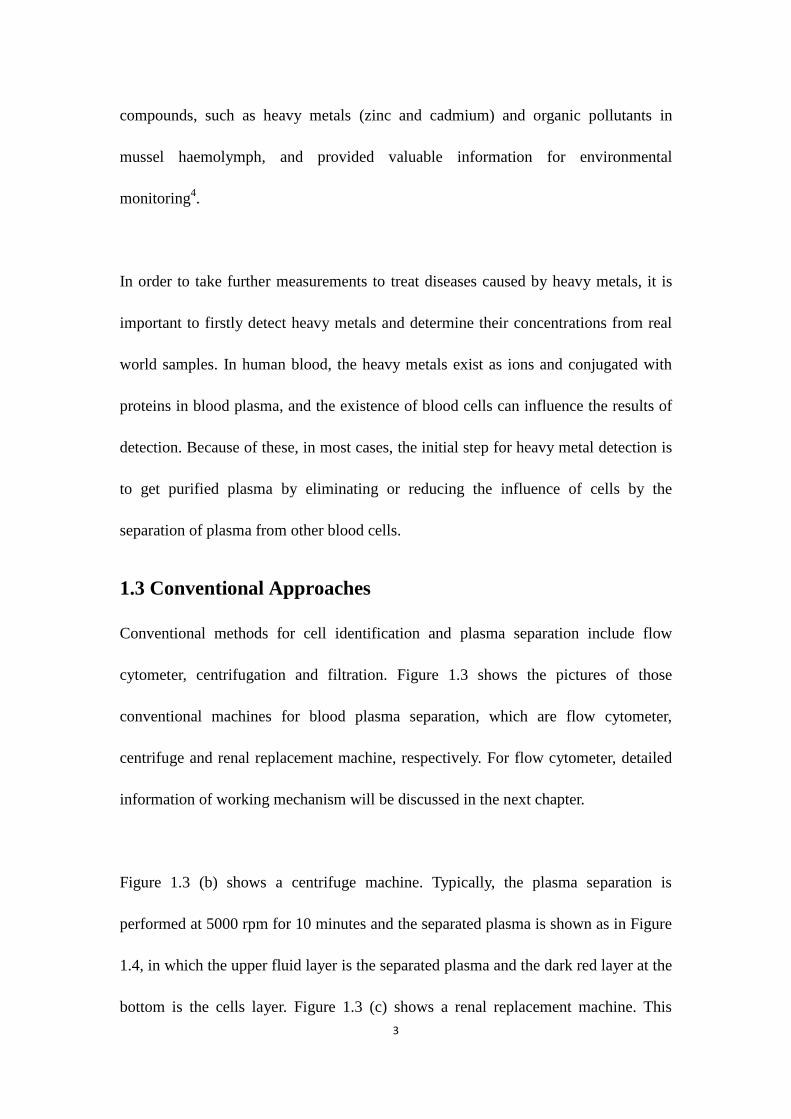
Figure 1.3 (b) shows a centrifuge machine. Typically, the plasma separation is
performed at 5000 rpm for 10 minutes and the separated plasma is shown as in Figure
1.4, in which the upper fluid layer is the separated plasma and the dark red layer at the
bottom is the cells layer. Figure 1.3 (c) shows a renal replacement machine. This

4
machine is based on filtration method and used in medical or clinical lab for obtaining
larger volumes of plasma.
Figure 1.3 (a) Flow cytometer. (b) Centrifuge. (c) Continuous renal replacement
machine.
Although the conventional methods are very powerful for plasma separation and most
commonly used in research and clinical labs, especially for processing larger volumes
of blood. However, those methods have many limitations for needs requiring fast
processing and small sample volumes. In addition, the machine operations and result
analysis need high levels of skills. For example, the flow cytometer is expensive and
hard for maintenance. For centrifugation, cell damage is the main concern because
hemolysis occurs during high speed centrifugation5. For filtration, the clog is a
problem which always presents. Additionally, all these methods require external
powers and are not suitable for personal use. All of these are difficultly making some
medical detections in developing counties or rural areas.
a)
b)
c)
5
Figure 1.4 Centrifuged plasma
1.4 Microfluidics and the Advantages
Microfluidic based biotechnologies have been widely applied for biological and
biomedical research and applications because the physical scales of microfluidics are
suitable for biological cells and provide the ability and flexibility to control
spatiotemporal biochemical parameters. One of current efforts for biosensor
technologies aims to develop sensing technology directly using small volumes of the
human fluids, such as blood, urea, and saliva, for accurate, fast, and affordable
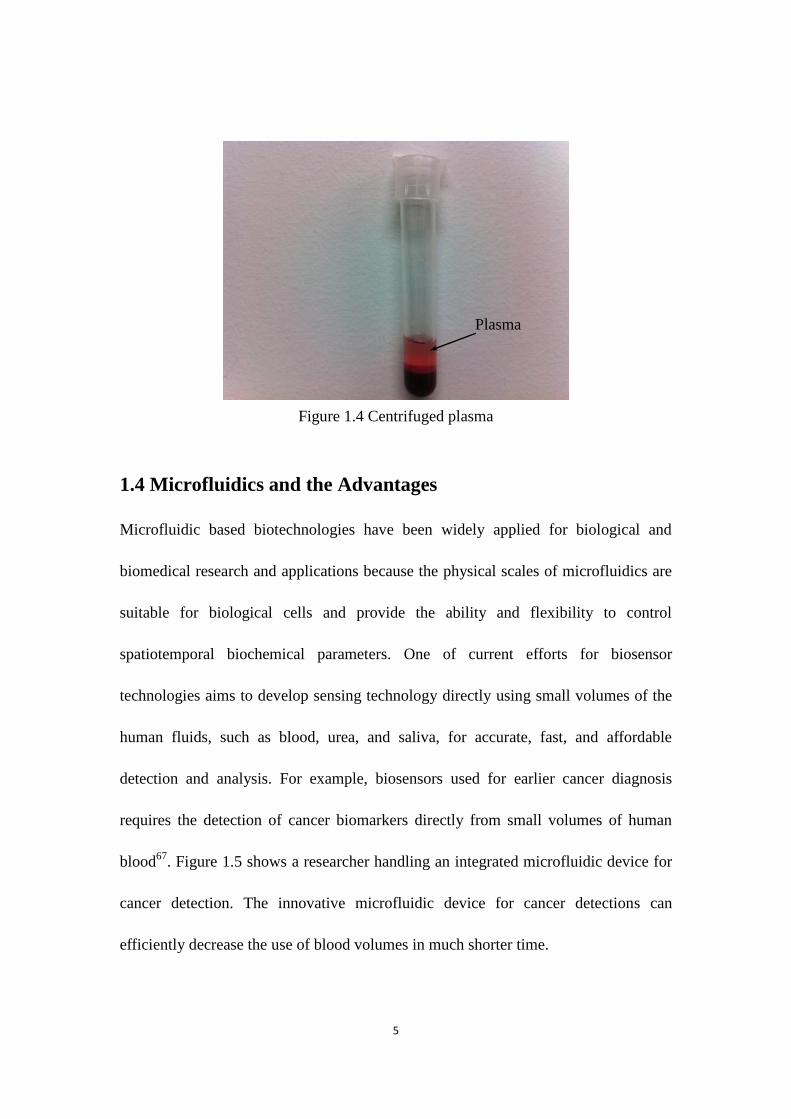
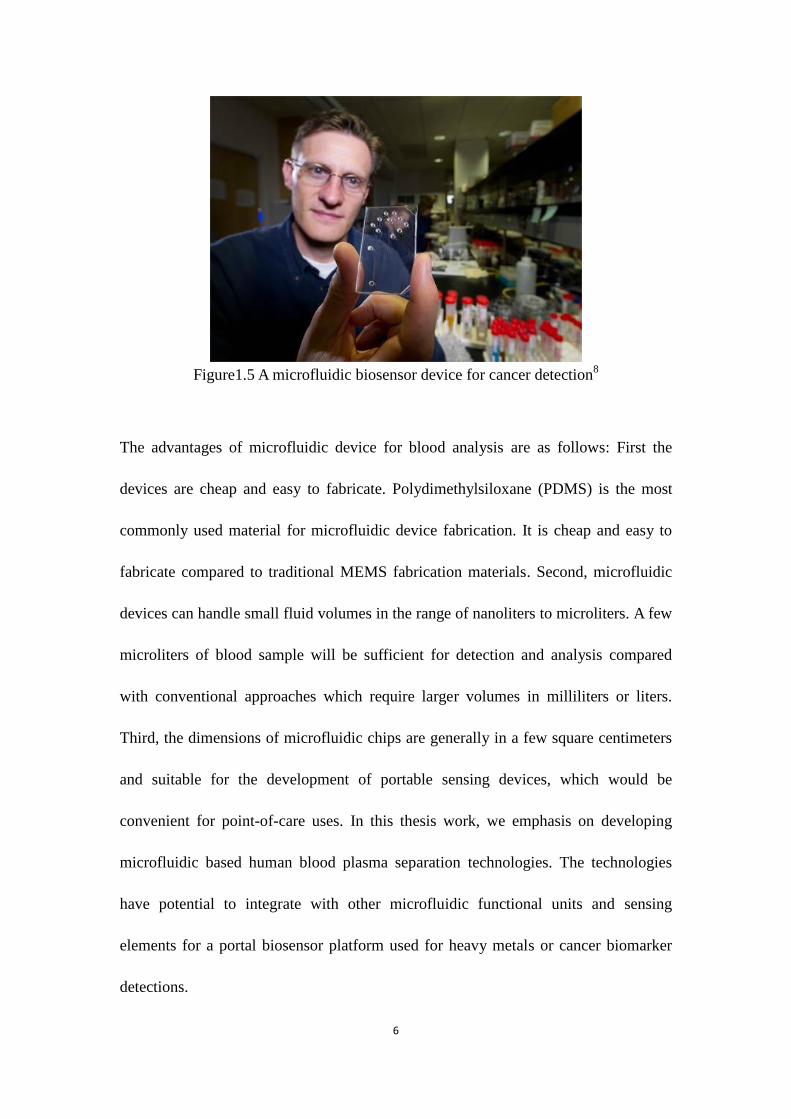
detection and analysis. For example, biosensors used for earlier cancer diagnosis
requires the detection of cancer biomarkers directly from small volumes of human
blood67
. Figure 1.5 shows a researcher handling an integrated microfluidic device for
cancer detection. The innovative microfluidic device for cancer detections can
efficiently decrease the use of blood volumes in much shorter time.
Plasma
6
Figure1.5 A microfluidic biosensor device for cancer detection
8
The advantages of microfluidic device for blood analysis are as follows: First the
devices are cheap and easy to fabricate. Polydimethylsiloxane (PDMS) is the most
commonly used material for microfluidic device fabrication. It is cheap and easy to
fabricate compared to traditional MEMS fabrication materials. Second, microfluidic
devices can handle small fluid volumes in the range of nanoliters to microliters. A few
microliters of blood sample will be sufficient for detection and analysis compared
with conventional approaches which require larger volumes in milliliters or liters.
Third, the dimensions of microfluidic chips are generally in a few square centimeters
and suitable for the development of portable sensing devices, which would be
convenient for point-of-care uses. In this thesis work, we emphasis on developing
microfluidic based human blood plasma separation technologies. The technologies
have potential to integrate with other microfluidic functional units and sensing
elements for a portal biosensor platform used for heavy metals or cancer biomarker
detections.

7
1.5 Summary
In this introduction chapter, the importance of blood analysis and blood plasma
separation techniques were introduced.
In the chapter 2, detail information for conventional methods for human blood plasma
separation was discussed. Compared to these methods, microfluidic methods in our
research have the advantages of small blood volume handling, low cost, easy
fabrication, and portable.
Chapter 3 introduced the mechanisms for microfluidic blood plasma separation. By
combining three important hydrodynamic effects - bifurcation law, centrifugation
force and Fåhræus–Lindqvist effect - we designed two types of microfluidic
bifurcation devices.
In chapter 4, we exploited a COMSOL Multiphysics model to simulate the fluid flow
in the microfluidic bifurcation devices. Detail simulation implementation was
introduced.
Chapter 5 is the experimental section. The experimental setup, conditions and results
for blood plasma separation were discussed in this chapter. The electrophoresis
analysis of centrifuged plasma (control) and microfluidic separated plasma (test)
showed that the microfluidic separated plasma has the same blood plasma

8
components as compared with that in the control group.
In chapter 6, we developed a membrane based plasma separation technique. Vivid
Plasma Separation Membrane from Pall life Science Corporation was directly
incorporated into a microfluidic capillary device.
Chapter 7 summarized our work and provided information regarding to the future
direction. The microfluidic plasma separation device developed in this thesis research
can be integrated with other microfluidic units for a portal and functional
lab-on-a-chip device.
9
CHAPTER 2: Literature Review
2.1 Conventional Methods
As introduced in Chapter 1, conventional methods for cell identification and plasma
separation include flow cytometer, centrifugation and filtration. The separation
mechanism of flow cytometer, centrifugation, and filtration are introduced in this
chapter. In addition, microfluidic techniques combined with filtration and
centrifugation approaches are introduced.
2.1.1 Flow Cytometer
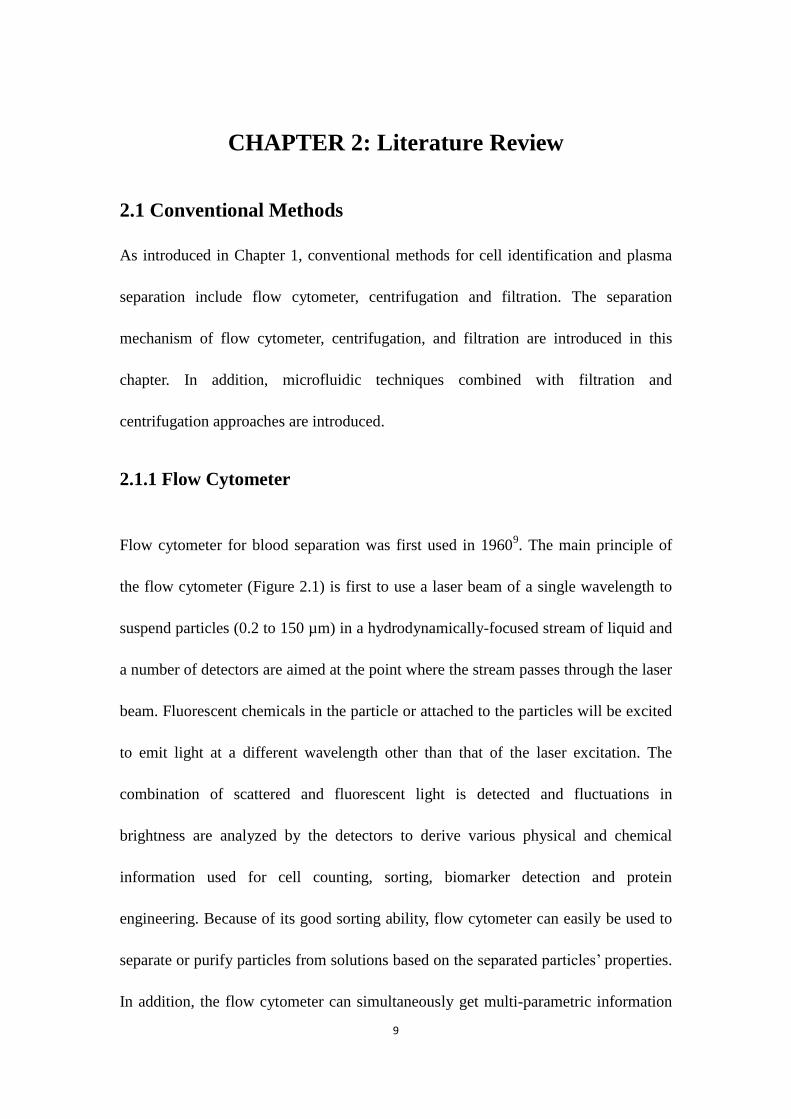
Flow cytometer for blood separation was first used in 19609. The main principle of
the flow cytometer (Figure 2.1) is first to use a laser beam of a single wavelength to
suspend particles (0.2 to 150 µm) in a hydrodynamically-focused stream of liquid and
a number of detectors are aimed at the point where the stream passes through the laser
beam. Fluorescent chemicals in the particle or attached to the particles will be excited
to emit light at a different wavelength other than that of the laser excitation. The
combination of scattered and fluorescent light is detected and fluctuations in
brightness are analyzed by the detectors to derive various physical and chemical
information used for cell counting, sorting, biomarker detection and protein
engineering. Because of its good sorting ability, flow cytometer can easily be used to
separate or purify particles from solutions based on the separated particles’ properties.
In addition, the flow cytometer can simultaneously get multi-parametric information
10
from up to thousands of particles in seconds.
Figure 2.1 Schematic diagram of the flow cytometer10
In Terstappen’s paper, they used high-resolution flow cytometer to identify and
characterize the plasma cells from normal human bone marrow. The low frequency of
the plasma cells and the lack of specific cell surface antigens are significant
impediments for an accurate identification of plasma cells11
. For this method,
although it can reach fine details and high throughput, and also represent today’s
golden standard in cell identification and separation, the sophistication of this
technique makes it challenging to be used as a convenient and portable way for blood
separation. Additionally, this technique requires high levels of skill and professional
handling in the lab.
2.1.2 Filtration
11
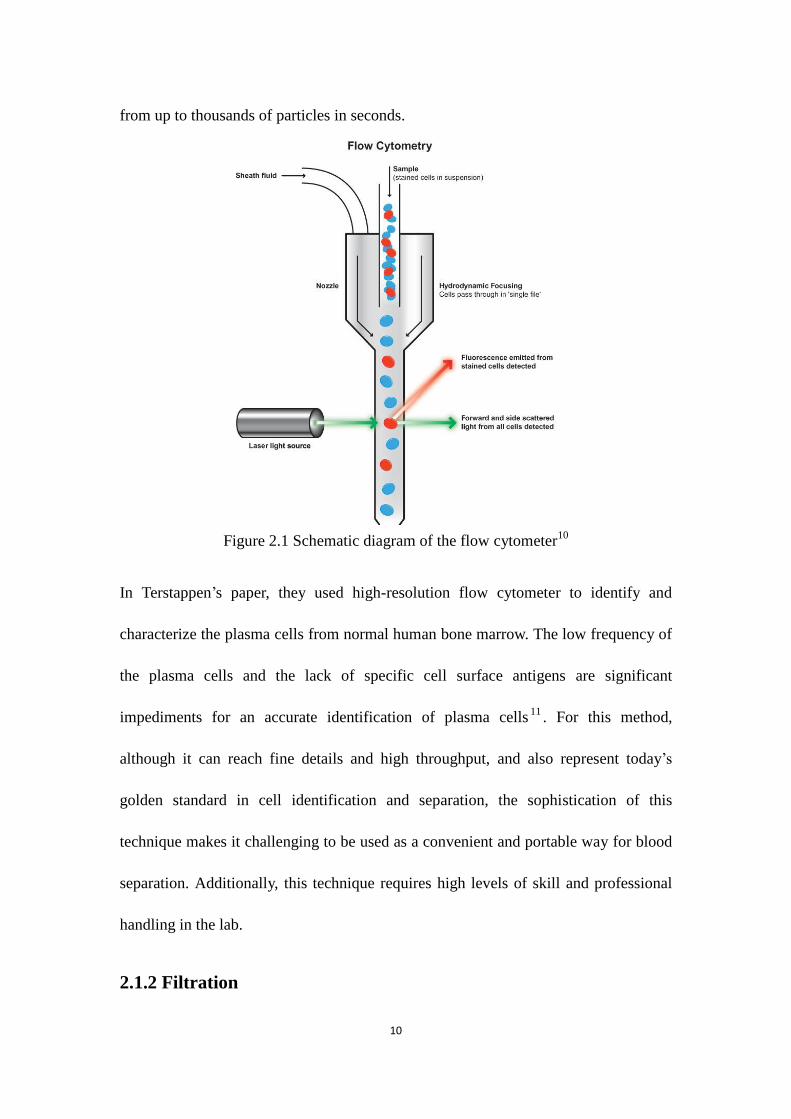
Filtration technique is another common method applied for blood separation. Moorthy
et al. presented a porous filter which was embedded with a composition of a
pre-polymer mixture. Their approach allowed for the filtration of cells with sizes
larger than 3 μm in diameters12
. The porous filter was fabricated inside the channel by
incorporating a photo-initiator as a part of the pre-polymer composition. Figure 2.2 (a)
shows the configuration of filtration system. The microfluidic device with separation
region is shown in Figure 2.2 (b). The cross section between filter channel and main
channel was the separating region for blood plasma.
Figure 2.2 (a) The side view and the top view of a microfluidic filtration system.
(b) The microfluidic filtration device12
.
In order to demonstrate the separation of porous filter for different sized particles,
they used a mixture of 45 μm and 3 μm fluorescently-labeled beads flowing through
the microfluidic device. The results showed that larger beads were held against the
filter while the smaller beads can pass through the porous filter. The porosity of filter
a)
b)
12
can be modified by varying the emulsion composition, material properties and the
applied polymerization method. Hence various sized porosities of filters can be in-situ
fabricated for filtration of particles with different diameters. However, this device was
easily clogged because the filter’s filtration capacity was limited by the size and
volume holding of the filter. For example, for a cross section area of 1cm × 150 μm,
about 20 μl of diluted blood can be separated.
Due to its clog problem and particle trapping capacities, filtration method is not
desirable for continuous separation of blood. However, for acquiring specific volumes
of plasma, it can be used as a good solution. The dimensions of the device can be
designed and calculated for the volume of needed plasma which was based on the
Darcy’s law which will be introduced in the Chapter 7 for a membrane based plasma
separation.
2.1.3 Centrifugation
Centrifugation is a process that involves the use of the centrifugal force for the
sedimentation of mixtures with a centrifuge and is commonly used in industry and in
laboratory settings requiring different particle-solution separations.
Ducree and Madou presented a rotating disk to extract blood plasma by applying the
centrifuge force in the device13,14
. (Figure 2.3) A spinning speed with the frequency at
40 Hz was applied on a rotating disk for 20 s. About 2 μl plasma (5 μl of whole blood
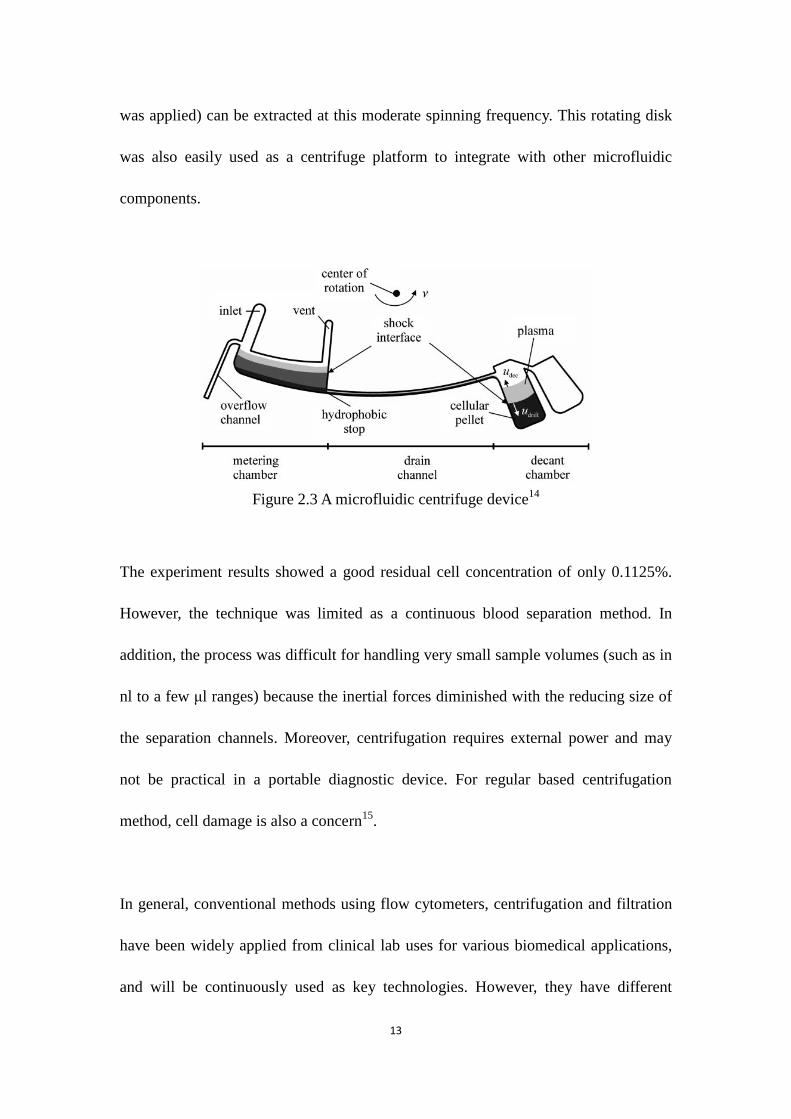
13
was applied) can be extracted at this moderate spinning frequency. This rotating disk
was also easily used as a centrifuge platform to integrate with other microfluidic
components.
Figure 2.3 A microfluidic centrifuge device14
The experiment results showed a good residual cell concentration of only 0.1125%.
However, the technique was limited as a continuous blood separation method. In
addition, the process was difficult for handling very small sample volumes (such as in
nl to a few μl ranges) because the inertial forces diminished with the reducing size of
the separation channels. Moreover, centrifugation requires external power and may
not be practical in a portable diagnostic device. For regular based centrifugation
method, cell damage is also a concern15
.
In general, conventional methods using flow cytometers, centrifugation and filtration
have been widely applied from clinical lab uses for various biomedical applications,
and will be continuously used as key technologies. However, they have different

14
limitations which prevent them for being directly adapted as point-of-care biosensing
technologies, such as requiring high level of skills to operate, external power supplies,
long processing time, large volumes of solutions, and larger equipment not portable
for on-site analysis. Addressing above challenges can benefit from microfluidics and
lab-on-a-chip technologies, which can provide new separation and analysis methods,
such as miniaturization of current bulk assays, using small volumes of samples, gentle
manipulation, precise controlling microenvironment, and parallel operation and highly
integration.
2.2 Micro-scale Technologies for Blood Processing
Microscale technologies and microfluidics have be applied in many biological and
chemistry analysis, such as blood cells applications and plasma separation based on
the different blood cells, their sizes and various densities, electrical permittivity,
dielectric characteristics and adhesiveness. These small-scale techniques have been
applied for the chip based blood separation and greatly benefit the biosensor
development.
2.2.1 Mechanical Force Based Blood Separation
Based on the sizes of particles or cells, the micro-scaled devices can be designed to
achieve the separation of blood by applying different mechanical forces. For example,
it is easy to apply centrifuge forces on the cells to get the sediment.
15
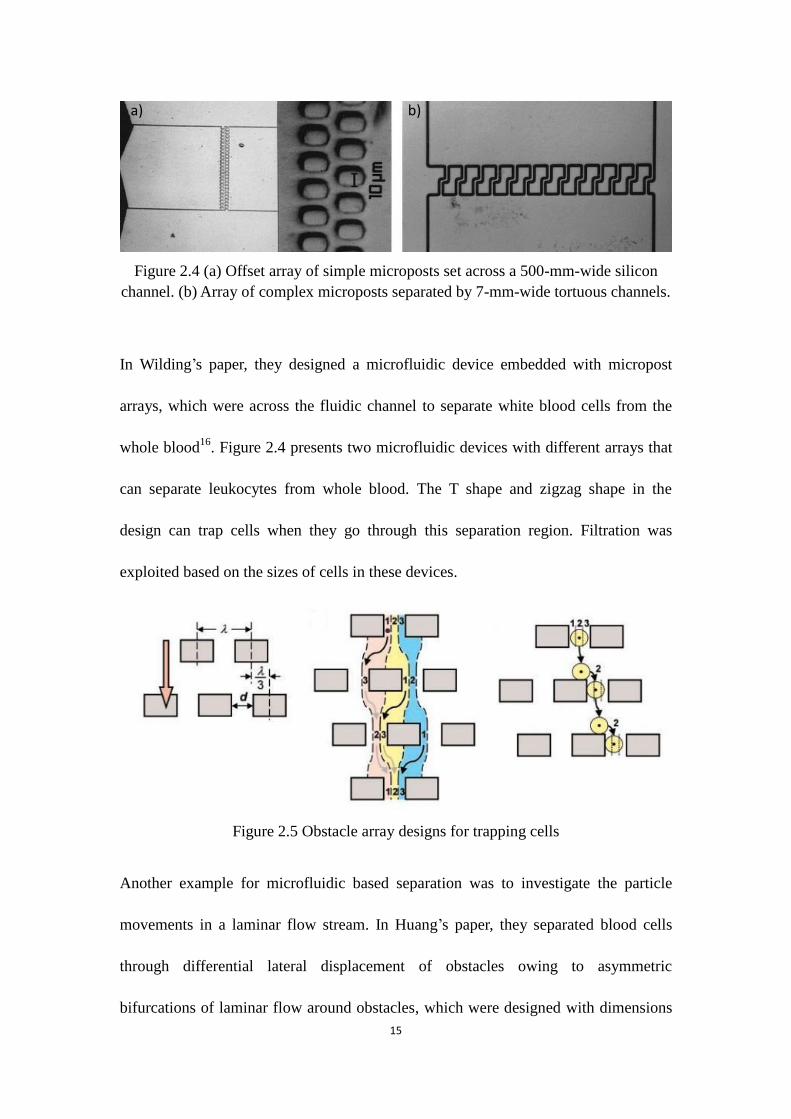
Figure 2.4 (a) Offset array of simple microposts set across a 500-mm-wide silicon
channel. (b) Array of complex microposts separated by 7-mm-wide tortuous channels.
In Wilding’s paper, they designed a microfluidic device embedded with micropost
arrays, which were across the fluidic channel to separate white blood cells from the
whole blood16
. Figure 2.4 presents two microfluidic devices with different arrays that
can separate leukocytes from whole blood. The T shape and zigzag shape in the
design can trap cells when they go through this separation region. Filtration was
exploited based on the sizes of cells in these devices.
Figure 2.5 Obstacle array designs for trapping cells
Another example for microfluidic based separation was to investigate the particle
movements in a laminar flow stream. In Huang’s paper, they separated blood cells
through differential lateral displacement of obstacles owing to asymmetric
bifurcations of laminar flow around obstacles, which were designed with dimensions
a) b)

16
comparable to the sizes of the particles17
. Figure 2.5 shows the obstacles design which
can separate the particles as they passing through the structure.
2.2.2 Dielectrophoresis Based Blood Separation
Human cells can be polarized when they are exposed to an electric field.
Dielectrophoresis, a phenomenon in which force can be exerted on a dielectric
particle when it is subjected to a non-uniform electric field, can be applied to induce
cell motions and separate them when they flow through the electric fields. There are
several factors that influence the polarization, like bi-lipid membrane characteristics,
internal structure, sizes of nucleus, and frequencies of alternative electric fields. For
micro-scale technology, low voltages can be conveniently applied through the
microchannels by the integration of electrodes and the microfluidic device.
Figure 2.6 Schematic diagram of a flow separator
In Hughes’s paper, the authors presented a flow separator that can separate two kinds
of particles using an electrode array18
. (Figure 2.6) There were two kinds of particles,

17
which were light and dark particles. When the dark particles were trapped by positive
dielectrophoresis, the light particles flew through the chamber and exit. Then the
electric field was removed and the dark particles were release from the trap for
collection. By this method, the mixture of particles can be separated through a
separation chamber consisting of an electrode array at the bottom of the chamber.
2.2.3 Optical Interaction Based Blood Separation
The optical interaction by using a laser tweezer has been applied for blood separation
devices. This technology avoids the mechanical touch between cells and surfaces.
However, due to its trapping characteristics, only one cell at a time could be
manipulated. In order to process a large quantity of cells in parallel, high throughput
type devices should be developed.
Figure 2.7 Schematic design of an integrated microfluidic sorting system19
In Applegate’s paper, they presented an integrated optical platform for cells and other
particles sorting in microfluidic devices19
. Figure 2.7 shows the schematic design of

18
the system based on optical waveguide integration with a diode laser bar trapping.
The microchannel and contents were imaged using a charge-coupled device (CCD)
camera connected to a monitor and a camcorder to capture the images. Two lasers
exciting appropriate wavelengths were utilized for the separation of two dyed
particles.
2.2.4 Magnetic Based Blood Separation
Red blood cells (RBCs) and white blood cells (WBCs) behavior differently under a
magnetic field, in which RBCs and WBCs can be separated from each other in high
magnetic gradients.
Figure 2.8 (a) Schematic diagram of a continuous magnetic separator having one inlet
and three outlets. (b) Cross-section view of the separator in the paramagnetic capture
mode20
.
In Takayasu’s paper, they used above introduced magnetic configuration to separate
red blood cells from whole blood20
. As show in Figure 2.8, the magnetic system had
one inlet and three outlets for the cells flowing through. By controlling the flow
speeds of the blood, cells and plasma can be separated into different outlets. The
separation system combined magnetic force and gravity force. In the paper, they also
discussed the separation of white blood cells and plasma by changing of the magnetic
19
system.
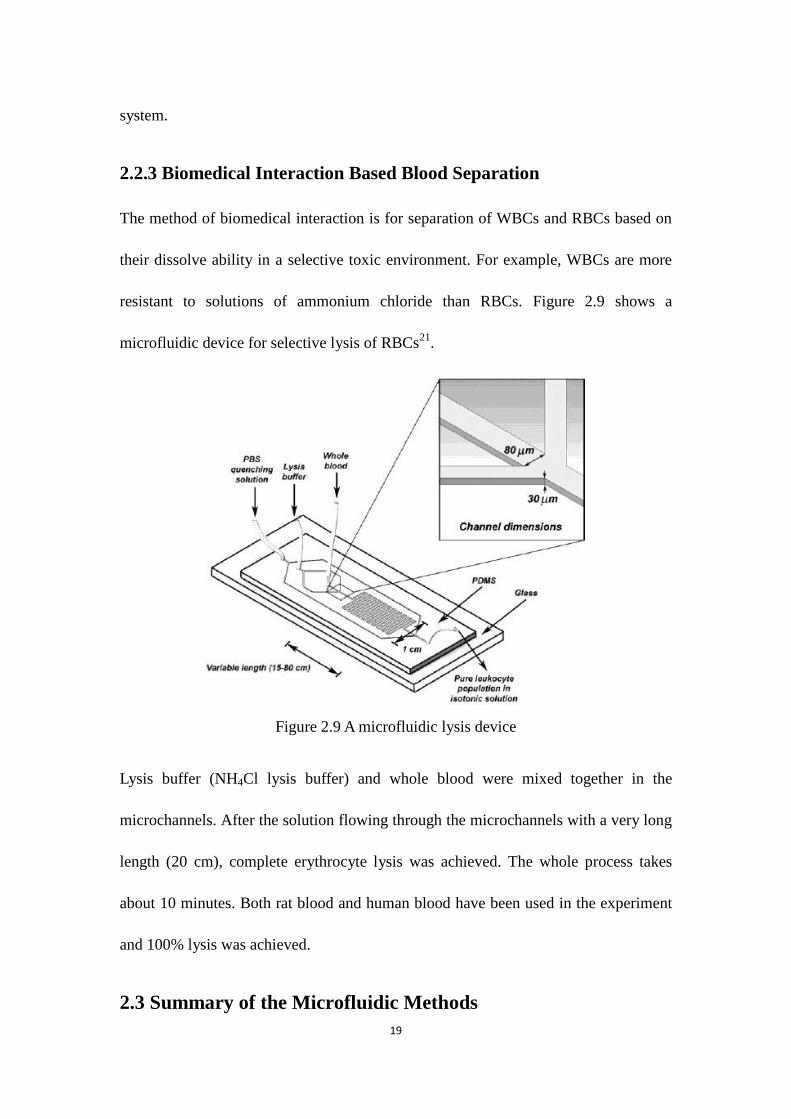
2.2.3 Biomedical Interaction Based Blood Separation
The method of biomedical interaction is for separation of WBCs and RBCs based on
their dissolve ability in a selective toxic environment. For example, WBCs are more
resistant to solutions of ammonium chloride than RBCs. Figure 2.9 shows a
microfluidic device for selective lysis of RBCs21
.
Figure 2.9 A microfluidic lysis device
Lysis buffer (NH4Cl lysis buffer) and whole blood were mixed together in the
microchannels. After the solution flowing through the microchannels with a very long
length (20 cm), complete erythrocyte lysis was achieved. The whole process takes
about 10 minutes. Both rat blood and human blood have been used in the experiment
and 100% lysis was achieved.
2.3 Summary of the Microfluidic Methods

20
In above sections, we introduced microscale separation technologies, and the
examples showed that microfluidics have been applied with many other different
separation mechanisms involving mechanical forces, optical interactions, fluid
dynamics, and chemicals.
The history of microfluidics can be traced back to earlier of 1950s. The efforts to
dispense small volumes of liquids in the nanoliter and sub nanoliter ranges were
developed and as the foundation for today’s ink-jet technology. Today, the impact of
microfluidic technologies has dramatically increased during the past two decades.
Microfluidics has been applied to many different areas, such as biotechnology and
biosensor, diagnostics, medical applications, and pharmaceutical industries. More and
more microfluidic components have been developed for fluid transport, metering,
mixing22
, valves23
, pumping24
, concentration or separation of molecules within very
small volumes of fluids in the last two decades.
Blood cell analysis for infectious diseases, cancers, and inflammatory responses can
be conveniently done at homes or in doctors’ offices for rapid and accurate diagnosis
and prognosis. Microfluidics and miniaturized lab-on-a-chip (LOC) devices would be
attractive approaches in these medical needs for blood analysis. In drug delivery,
microfluidic devices may redefine the entrance criteria for clinical trials and test of
these criteria in a time- and cost-effective way2.

21
The microfluidic based methods have many advantages. 1) Miniaturization of current
bulk assays. Unlike traditional methods, several microliters of samples would be
enough for the detection. 2) It can prevent or reduce the cell damage. Traditional
methods, like centrifugation or filtration, can introduce blood hemolysis during
operation because of intense external forces or resistances, which can cause the
rupturing of erythrocytes and releasing of some components into the surrounding
fluids. 3) Microfluidics is highly integrated. As we mentioned above, many different
micro components are available for integrate functional units together in a very small
chip (such as several square centimeters) to achieve complex tasks. 4) It is low cost
and easy to fabricate. PDMS is primary material and commonly used for microfluidic
device fabrication. PDMS has many advantages, such as inert, non-toxic,
non-flammable and biocompatible. 5) Microfluidics can provide a faster and
automatic processing approach compared with other methods. Traditional methods
require high levels of skills to handle the machines and long processing time.
Microfluidic method is faster and easily used as portable analysis technique.
The microfluidic method we used for blood separation applied with several
hydrodynamic effects, such as the bifurcation law, centrifugation force and
Fåhræus–Lindqvist effect. The main principle for the blood separation is the
bifurcation law. It reveals that the cell behavior when they flow through a bifurcation
region in a microchannel. Centrifugation force is also applied in our design to form
cell-free layer in the bifurcation region and increase the separation rate. The

22
Fåhræus–Lindqvist effect deals with the viscosity change due to the change of
channel diameters. We combined these three hydrodynamic effects to maximize the
separation efficiency and plasma yield.
In the Chapter 7, we investigated membrane based microfluidic plasma separation.
The advantages of this method are 1) passive plasma separation, 2) no extra power
required, 3) avoid complex microchannel designs, and 4) achieve high plasma
separation efficiency and yield. It is similar to filtration method as we discussed above.
In general, we fabricate two layers of PDMS channels and bonded them together
embedded with the membrane in between. Because of the resistance property, the
varied porosity of the membrane, and capillary driven force, the membrane can trap
the blood cells and the plasma can be extracted.

23
CHAPTER 3: Principles for Microfluidic Based
Plasma Separation
3.1 Hydrodynamics of Blood Cells
RBCs can behave differently and change their morphologies within the fluids with
varying Reynolds numbers (Re) and different degrees of shear forces. There are
generally three types of movements for the cells in microchannel, including
tank-treading, swinging and tumbling as listed in the following Table 3.125
.
Table 3.1 Illustration of the different regimes of cell behavior in a microchannel with
dimensions below 300 µm
Movement of cells Reynolds numbers Viscosity ratio Predominant force
Tank-treading Very low(<1) Low Viscous lift force
Swinging Low Medium Transition regime
Tumbling Very low to low (~1) High Inertial lift force
The above table shows different movements of the cells and their corresponding
responses to the different ranges of Re, viscosity ratio and predominant forces. The
viscosity ratio is the ratio between the inner fluid of RBCs and the surrounding media
solution. For tank-treading movement, the cell membrane can rotate around its center
of the mass, and the cell maintains a stationary orientation with the flow26
. At a
relatively high Re and viscosity ratio within the laminar regime, RBCs can flip around

24
themselves, and this movement is often referred as tumbling. The third movement as
mention above is swinging, which is a transitional regime. In this situation, the cell
tank-treads but undergoes oscillations around its stationary orientation27
. The cell
keeps a fixed orientation with the tank-treading regime. Research of these cell
movements is of great helpful to design the patterns of microfluidic devices used for
the blood cell separation.
3.2 Bifurcation Law (Zweifach–Fung Effect)
An important regulation principle related to blood cells’ behavior inside a
microfluidic channel is the bifurcation law, which was derived from in vivo
microcirculation. When the blood cells flow through a bifurcating region of the blood
vessel, they have a tendency to travel into the daughter vessel which has a higher flow
rate and leave very few cells flowing into a lower flow rate vessel28
.
Figure 3.1 (a) shows a schematic diagram for interpreting the bifurcation law. A blood
cell enters the microchannel from the left side and reaches to a bifurcation region
where two downstream branch channels meet. Due to their geometric difference, these
two daughter channels have different flow rates. We assume the upper branching
channel has higher flow rate than the lower branching channel. According to the
bifurcation law, this cell will flow into the upper channel. The pressure gradient in the
upper channel is usually higher than that in the lower channel, which results in an
asymmetric distribution of the shear rate along the microchannel at the bifurcation
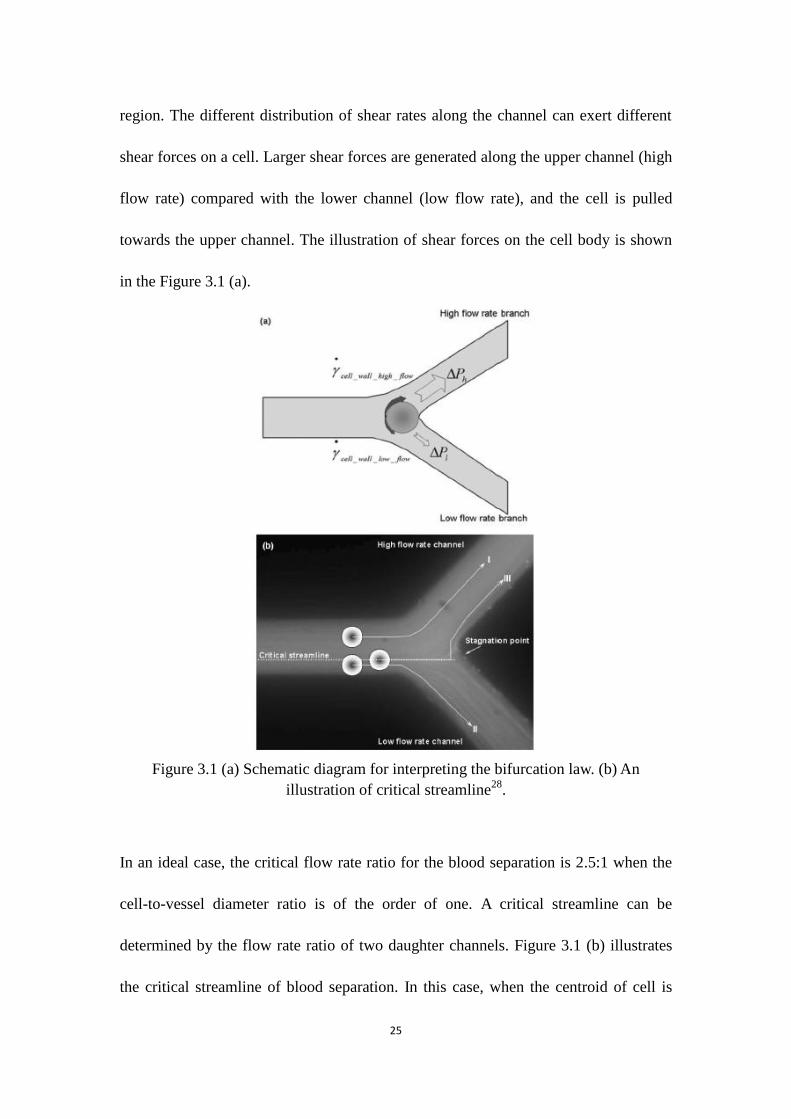
25
region. The different distribution of shear rates along the channel can exert different
shear forces on a cell. Larger shear forces are generated along the upper channel (high
flow rate) compared with the lower channel (low flow rate), and the cell is pulled
towards the upper channel. The illustration of shear forces on the cell body is shown
in the Figure 3.1 (a).
Figure 3.1 (a) Schematic diagram for interpreting the bifurcation law. (b) An
illustration of critical streamline28
.
In an ideal case, the critical flow rate ratio for the blood separation is 2.5:1 when the
cell-to-vessel diameter ratio is of the order of one. A critical streamline can be
determined by the flow rate ratio of two daughter channels. Figure 3.1 (b) illustrates
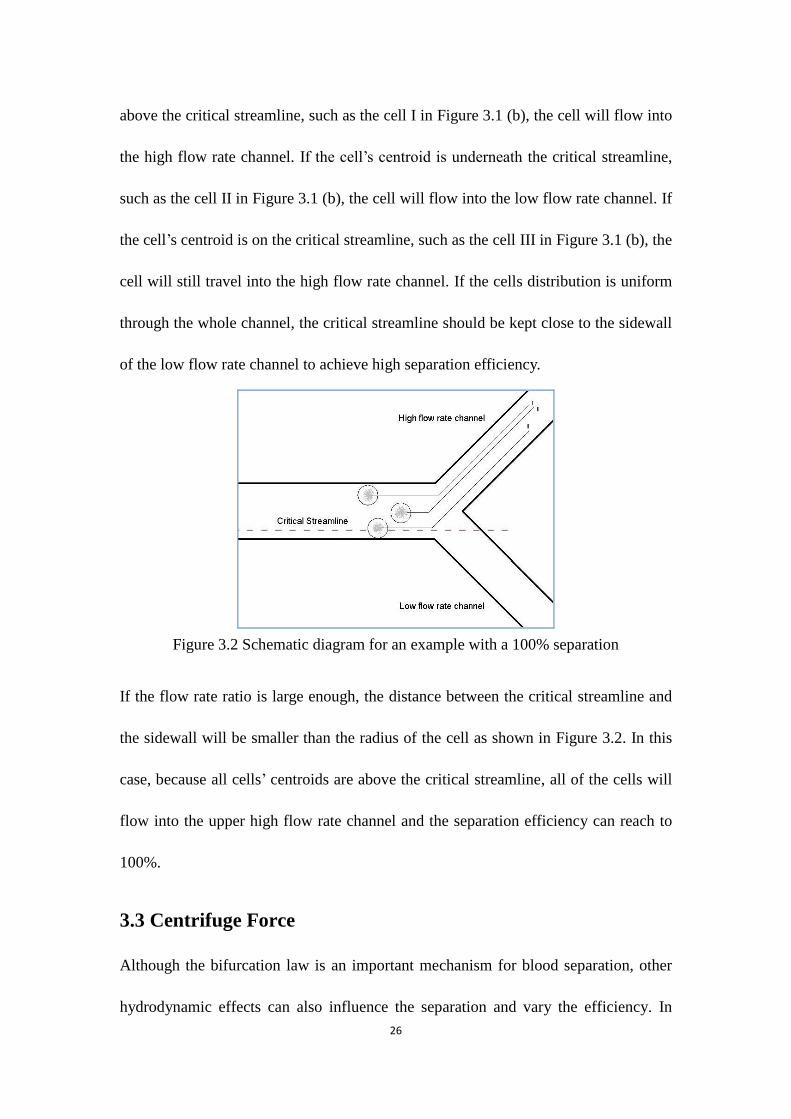
the critical streamline of blood separation. In this case, when the centroid of cell is
26
above the critical streamline, such as the cell I in Figure 3.1 (b), the cell will flow into
the high flow rate channel. If the cell’s centroid is underneath the critical streamline,
such as the cell II in Figure 3.1 (b), the cell will flow into the low flow rate channel. If
the cell’s centroid is on the critical streamline, such as the cell III in Figure 3.1 (b), the
cell will still travel into the high flow rate channel. If the cells distribution is uniform
through the whole channel, the critical streamline should be kept close to the sidewall
of the low flow rate channel to achieve high separation efficiency.
Figure 3.2 Schematic diagram for an example with a 100% separation
If the flow rate ratio is large enough, the distance between the critical streamline and
the sidewall will be smaller than the radius of the cell as shown in Figure 3.2. In this
case, because all cells’ centroids are above the critical streamline, all of the cells will
flow into the upper high flow rate channel and the separation efficiency can reach to
100%.
3.3 Centrifuge Force
Although the bifurcation law is an important mechanism for blood separation, other
hydrodynamic effects can also influence the separation and vary the efficiency. In

27
Menz’s paper, a bend channel structure in a microchannel can assist the plasma
separation as shown in the Figure 3.329,30
.
Figure 3.3 Microfluidic bend channel structure for assisting blood separation
This separation unit consists of a simple microchannel design with a branching
channel followed after a bending channel structure. The device has one inlet reservoir
for the blood input, one outlet reservoir for the separated plasma and another outlet
reservoir for the blood cells collection. The bend channel was designed to close to the
bifurcation region and apply centrifugation forces on blood cells. In this case, before
blood cells flew through the bifurcation region, the bend structure exerted
centrifugation forces on the blood cells and forced the cells to travel along the outer
side of the main channel. The fluid with a cell-free layer was generated along the
inner side of the channel and thus improved the separation efficiency.
They also examined the effects of the bend channel positions relative to the
bifurcation on the separation efficiency. The results showed that the separation
efficiency slightly increased when the angles of the bending structure was increased
because larger centrifuge forces were exerted on cells. In our microfluidic device
28
design, we also considered to use the bend channel structure to improve the separation
efficiency.
3.4 Fåhræ us–Lindqvist Effect
Fåhræus–Lindqvist effect is also an important factor that needs to be considered for
designing the microfluidic device for blood cell separation. The Fåhræus–Lindqvist
effect is an effect that the viscosity of the blood can change with the vessels’
diameters as the blood flows through, such as the blood viscosity is decreased as the
vessel's diameter decreases. This is because erythrocytes move over the center of the
vessel, leaving plasma at the wall of the vessel31
. In other means, the
Fåhræus–Lindqvist effect states that the viscosity of the blood is not a constant
quantity, but depends on the diameters of the vessels32
, especially when the vessels’
diameters are ranging from 10 µm to 300 µm.
For our microfluidic device, the channel dimensions are varied from 20 µm to 200 µm,
Fåhræus–Lindqvist effect should be considered regarding to the separation efficiency.
In addition, in numerical simulation, the fluid property, such as the viscosity, should
be considered for approximate to the real blood flow situations.

29
CHAPTER 4: Microfluidic Device Design and
Fabrication
4.1 Single Bifurcation Microfluidic Device
A good understanding of the hydrodynamic laws and effects (Chapter 3) for
separation of blood cells is very important for designing the microfluidic device. In
order to maximize the efficiency of the blood plasma separation, we considered the
bifurcation law and Fåhræus–Lindqvist effect and applied a bending structure for the
generation of centrifugation force.
Figure 4.1 The schematic design for microfluidic single bifurcation device
As shown in Figure 4.1, a single bifurcation microfluidic device was designed for the
blood separation. This design was inspired from the design in Huang’s paper
especially for the bifurcation region33
. The curvature structure, also working as a
constriction channel, and expansion channels were exploited in the device design as
shown in the bifurcation region (dotted frame in Figure 4.1). The device had one
Bifurcation region
Blood outlet
Cell flow channel
Plasma
channel
Blood inlet
30
blood inlet and two outlets, in which one was for the plasma output and the other was
for the blood cells’ collection. The whole size of the pattern was about 5 mm × 10
mm. The width of main channel (Cell flow channel) was 200 µm and the daughter
channel (Plasma channel) was 40 µm. For the constriction region, the width of
constriction channel was 50 µm. The radius of the curvature channel was 400 µm.
4.2 Fabrication
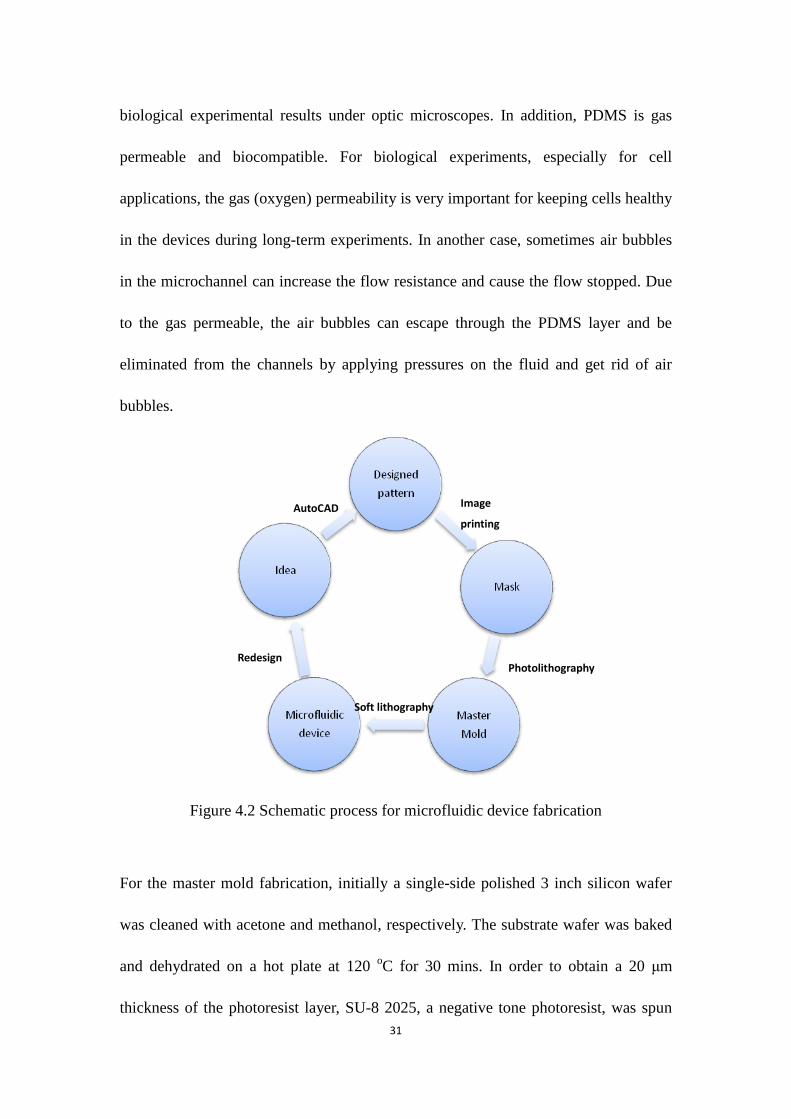
The basic idea of microfluidic device fabrication is to transfer the designed patterns
which were drawn in the AutoCAD to actual structures. First, specific microfluidic
channels were drawn in an AutoCAD file, and the designed patterns were printed onto
a mask, which had clear and dark regions according to the design. Second, the mask
patterns were transferred into a solid master mold by photolithography process. The
detailed fabrication steps were discussed in the following sections. Finally, this master
mold fabricated by photolithography was used to replicate the device into a polymer
material by soft lithography. PDMS elastomer is one of the most commonly used
materials for this soft lithography process. (Figure 4.2)
PDMS has many advantages. PDMS is much cheaper than traditional
microfabrication materials, such as glass and silicon. The soft lithography
micro-molding processes are simple and rapid compared with conventional
microfabrication procedures, such as etching, deposition and bonding approaches34
.
PDMS is transparent and has very good optical properties for the observation of
31
biological experimental results under optic microscopes. In addition, PDMS is gas
permeable and biocompatible. For biological experiments, especially for cell
applications, the gas (oxygen) permeability is very important for keeping cells healthy
in the devices during long-term experiments. In another case, sometimes air bubbles
in the microchannel can increase the flow resistance and cause the flow stopped. Due
to the gas permeable, the air bubbles can escape through the PDMS layer and be
eliminated from the channels by applying pressures on the fluid and get rid of air
bubbles.
Figure 4.2 Schematic process for microfluidic device fabrication
For the master mold fabrication, initially a single-side polished 3 inch silicon wafer
was cleaned with acetone and methanol, respectively. The substrate wafer was baked
and dehydrated on a hot plate at 120 oC for 30 mins. In order to obtain a 20 μm
thickness of the photoresist layer, SU-8 2025, a negative tone photoresist, was spun
AutoCAD Image
printing
Photolithography
Soft lithography
Redesign

32
onto the wafer at 4000 rpm for 30 secs. After the spin coating, the wafer was soft
baked on the hot plate at 65 oC for 3 mins and 95
oC for 7 mins, respectively. Then,
the resist layer was exposed by a UV flood exposure system (OAI model 150) at an
energy density of 15 mw/cm2
for 15 secs. The exposed resist was post-baked on the
hot plate at 65 oC for 2 mins and 95
oC for 5 mins, respectively. After the post
exposure baking, the resist was developed by SU-8 developer for 5min. The final step
was the hard baking of the developed structures at 160 oC for 30 mins to assist the
resist adhesion to the substrate. The pattern on the substrate was used as the master
mold for soft lithographic replication of the PDMS devices.
For the microfluidic device fabrication and soft lithography process, PDMS solutions
were prepared at the ratio of 10:1 (base:curing agent) and cast onto the master mold.
The PDMS layer together with the master mold were baked at 60 °C for 3 hrs to cure
the PDMS, and then, the PDMS layer was peeled from the mold and holes were
punched through the inlets and outlets. The punched PDMS layer was treated with 30
secs oxygen plasma and bonded with a pre-cleaned glass slide to completely seal the
channel. The fabricated device was ready for the experiment.
4.3 Blood and Device Preparation
Whole blood was purchased from Innovative research, Inc., MI, USA and
Ethylenediaminetetraacetic acid (EDTA) was used as an anticoagulant to keep the
blood from clogging. First, the blood was diluted with 1X phosphate buffered saline
(PBS) to various hematocrit levels from 15% to 45%. For the hematocrit level of 45%,
33
the blood was still kept as a whole blood condition without any dilution. Before the
experiment, the tubing and microfluidic device were pre-wetted using 1% bovine
serum albumin (BSA) solution for 1 hour at room temperature. The BSA solution can
keep the blood from clogging inside of the microchannels.
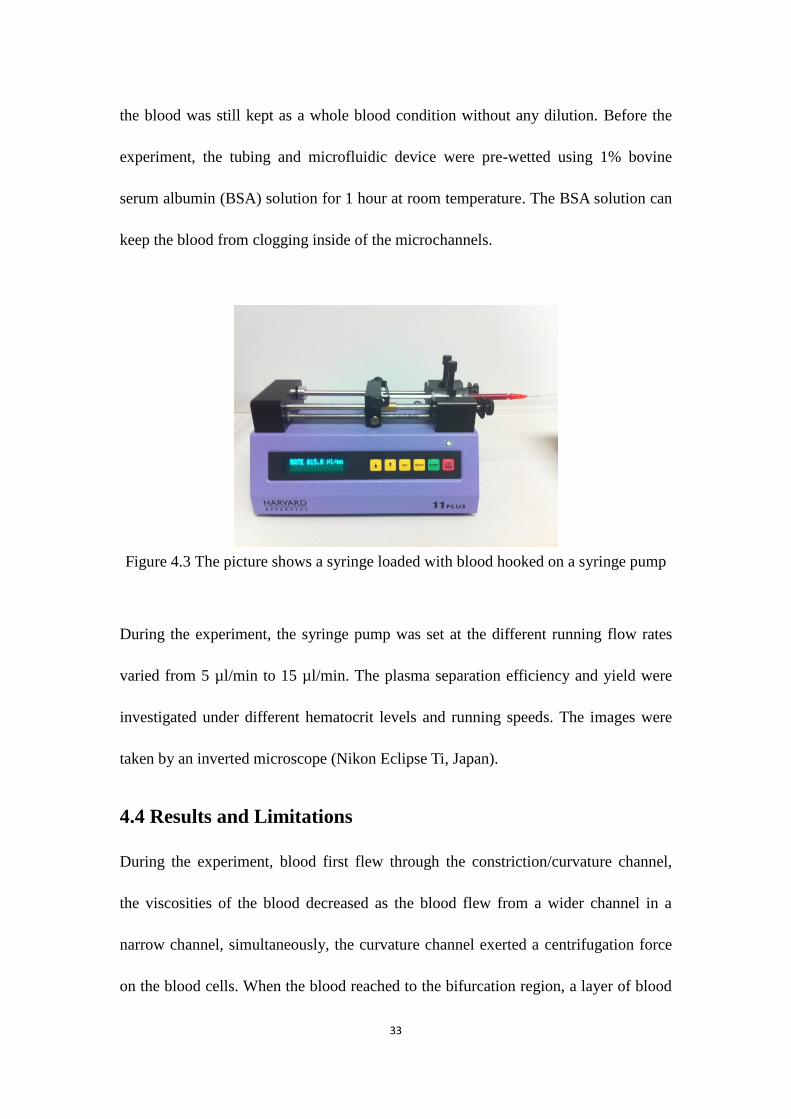
Figure 4.3 The picture shows a syringe loaded with blood hooked on a syringe pump
During the experiment, the syringe pump was set at the different running flow rates
varied from 5 µl/min to 15 µl/min. The plasma separation efficiency and yield were
investigated under different hematocrit levels and running speeds. The images were
taken by an inverted microscope (Nikon Eclipse Ti, Japan).
4.4 Results and Limitations
During the experiment, blood first flew through the constriction/curvature channel,
the viscosities of the blood decreased as the blood flew from a wider channel in a
narrow channel, simultaneously, the curvature channel exerted a centrifugation force
on the blood cells. When the blood reached to the bifurcation region, a layer of blood
34
cells flew along the outer edge of the channel and a layer of plasma was along the
inner edge of the channel. In addition, the decreased blood viscosity in the curvature
channel would assist the cells moving towards the outer edge of the channel because it
was relative easier for the cells to overcome the viscosity force. Because of this
phenomenon, most cells continuously flew through the main channel and plasma was
separated and collected through the output of the narrow daughter channel.
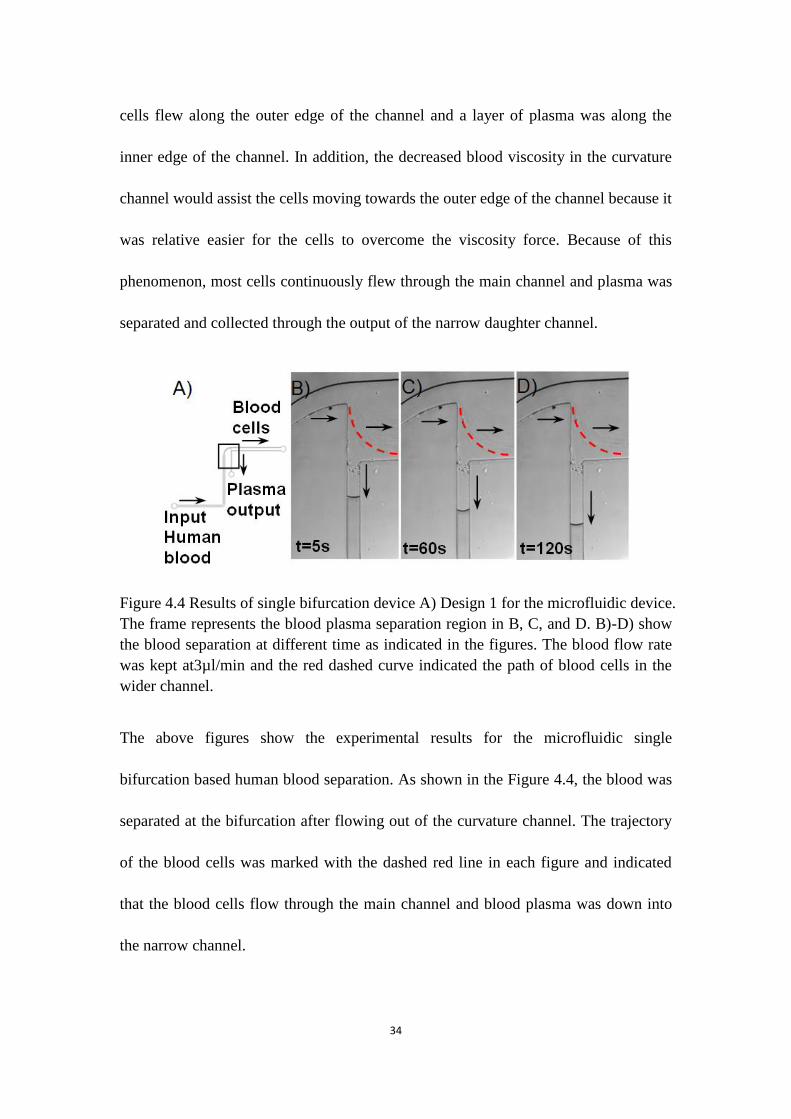
Figure 4.4 Results of single bifurcation device A) Design 1 for the microfluidic device.
The frame represents the blood plasma separation region in B, C, and D. B)-D) show
the blood separation at different time as indicated in the figures. The blood flow rate
was kept at3µl/min and the red dashed curve indicated the path of blood cells in the
wider channel.
The above figures show the experimental results for the microfluidic single
bifurcation based human blood separation. As shown in the Figure 4.4, the blood was
separated at the bifurcation after flowing out of the curvature channel. The trajectory
of the blood cells was marked with the dashed red line in each figure and indicated
that the blood cells flow through the main channel and blood plasma was down into
the narrow channel.

35
However, we found several limitations for the single bifurcation device for the blood
separation. The first problem was that the blood was hard to flow through the outlet
when the device was not pre-wetted. We can solve the problem by pre-wetting the
device. Another limitation was that the plasma yield was relative low. After
calculation, the yield of this single bifurcation was about 5% - 8%. In order to
increase the plasma yield and the separation efficiency, we designed the multiple
bifurcations device pattern assisted by a COMSOL simulation model, which was
discussed in the following chapters.
36
Chapter 5: Microfluidic Multiple Bifurcation Device
and COMSOL Simulation
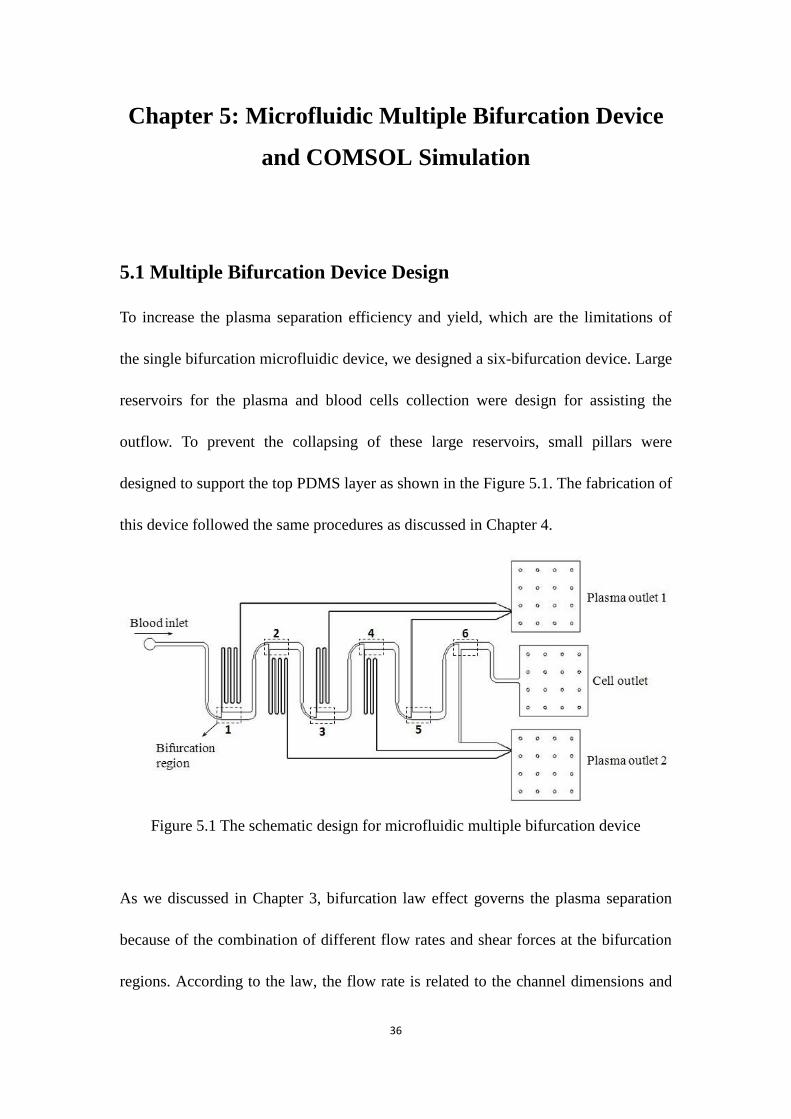
5.1 Multiple Bifurcation Device Design
To increase the plasma separation efficiency and yield, which are the limitations of
the single bifurcation microfluidic device, we designed a six-bifurcation device. Large
reservoirs for the plasma and blood cells collection were design for assisting the
outflow. To prevent the collapsing of these large reservoirs, small pillars were
designed to support the top PDMS layer as shown in the Figure 5.1. The fabrication of
this device followed the same procedures as discussed in Chapter 4.
Figure 5.1 The schematic design for microfluidic multiple bifurcation device
As we discussed in Chapter 3, bifurcation law effect governs the plasma separation
because of the combination of different flow rates and shear forces at the bifurcation
regions. According to the law, the flow rate is related to the channel dimensions and

37
the pressure differences along the channel. As indicated in Equation 5.1, Q is the flow
rate of the fluid. The relation between the pressure difference and the flow rate is
(5.1)
Where is the pressure difference and R is the resistance. For rectangular channel,
the resistance is a function of channel parameters as indicated in Equation 5.2:
(5.2)
Where L, w, h is the length, width and height of the channel, respectively, and μ is the
fluid viscosity. For a multiple bifurcation device, the flow rate ratio of each
bifurcation can be modified by changing the dimensions of main channel and each
daughter channels, such as the channel widths and lengths, which result the changes
of channel resistances. If the flow rate ratio at each bifurcation was kept as the similar
value, the separation efficiency would be expected to be similar.
In addition, the bending structure introduces centrifuge forces which can exert on the
cells in assisting to create a cell-free plasma layer. The Fåhræus–Lindqvist effect
results in viscosity changes in the microchannels with different widths. For the
multiple bifurcation channel design, we considered those effects and addressed the
problems found during the experiments with the single bifurcation device. We design
several different multiple bifurcation devices with different channel dimensions at the
bifurcations in considering of the different flow rate ratios. Although the
photolithography and soft lithography techniques provide flexible and fast fabrication

38
approaches, it is still challenging to test each device by experiment, which is time
consuming and costly.
A simplified COMSOL Multiphysics simulation model was developed to examine the
flow velocities and flow rate ratios. Different bifurcation pattern designs with varied
dimensions were simulated before we went further for microfabrication and blood
separation experiments. By using the COMSOL simulation, it is convenient for us to
optimize the design instead of performing too many experimental tests. The detail of
the COMSOL simulation was discussed in the following sections.
5.2 COMSOL Multiphysics Simulation
COMSOL Multiphysics Software (Version 4.0.0.982, COMSOL Inc. USA) is a finite
element analysis, solver and simulation software / FEA Software package for various
physics and engineering applications, especially for coupled phenomena
and multiphysics35
.
COMSOL has an interface to AutoCAD and it is convenient to import the designed
pattern drawn in AutoCAD into the COMSOL platform. Users can directly modify the
pattern in AutoCAD without rebuilding the model in the COMSOL. The COMSOL
has many toolboxes, such as structure mechanics module, acoustic module and other
modules for multiphysical problems. We used the computational fluid dynamics (CFD)
module to build the model. This module contains different fluid flow definitions, such

39
as laminar flow, turbulent flow, swirl flow and other hydrodynamic flows. The
Reynolds numbers for microfluidics are always falling into a small range, which is
typically small than 1 based on the channel dimensions. The fluid flow in our device
was assumed as laminar flows.
5.2.1 Implementation of the Simulation
Blood is normally considered as a Non-Newtonian fluid, because of a nonlinear
relationship between stress and rate of strain. In Xue's paper, they developed both
models for Newtonian and Non-Newtonian fluids by simulating horse blood
(Newtonian fluid) and human blood (Non-Newtonian fluid). From their results, the
flow rate ratios of newtonian fluid was twice of that for the nonnewtionian fluid as
shown in Table 5.136
. Their model includes 15 bifurcations.
Table 5.1 Flow rate ratios at bifurcations for Newtonian and Non-Newtonian fluid
Some other groups have been considering blood as a Newtonian fluid to simplify the
40
simulation. In this manner, the viscosities and velocities of the blood as well as the
shear stresses in the main channel and daughter channels would be assumed the same.
In Yang's paper, the blood is assumed to be a homogenous Newtonian fluid because
blood behaves as a Newtonian fluid in high shear rate conditions28
. We admitted that
a Non-Newtonian fluid model can simulate the results more accurately. However, to
simply the simulation, we considered the blood as a Newtonian fluid as reasonable
according to other’s previous work. A comprehensive simulation model is beyond the
scope of this thesis work. In this case, we set the fluid viscosity to be 0.0035 pa•s both
in the main channel and daughter channels. The simulation procedures are listed in the
following:
1. The fluid dynamics analysis considers the solution of the 2D Navier-Stokes
equations in a stationary case and the fluid flow is a laminar flow.
2. Import the designed paattern in AutoCAD into the COMSOL.
3. Set the initial conditions and boundary conditions of the model. For initial
conditions, the input fluid velocity was set as 0.05m/s, which equals to 360 µl/min
for the flow rate. The flow velocity can be changed to examine the influnce of
velocity on the flow rate ratios. The output pressure was set as the atmopheric
pressure. The flow was considered as an incompressible flow. The viscosity and
the density of blood was set as 0.0035 pa•s and 1060 kg/m3, respectively.
4. The meshing was realized using the free triangular function that automatically
created an unstructured triangular mesh of the subdomain. Free triangular function

41
has the flexibility to automatically control the number, size, and distribution of
elements based on the available computing capability of the working computer.
The total subdomain elements used in the simulation were set as 53,750 with the
maximum element size of 8 µm. In order to get more accurate results at the
bifurcation regions, resolution of curvature was adjusted to give a finer mesh
along curved boundaries.
5. The laminar flow model and nonlinear solver were used in the convergence study.
6. After the convergence study, the velocity field in the pattern can be derived.
Based on the velocity field, Reynolds numbers and the flow rate ratios can be
obtained.
5.3 Computational Results
5.3.1 Reynolds Number
In fluid mechanics, the Reynolds number is a dimensionless number that gives a
measurement of the ratio between inertial forces and viscous forces, and consequently
quantifies the relative importance of these two forces in a given flow condition. The
Reynolds numbers for microfluidics are typically very low, usually less than 1, which
means the flow is completely a laminar flow. We first calculated the Reynolds
numbers of the main channel and six daughter channels, respectively. The results of
Reynolds numbers in the daughter channels were much lower than that of the main
channel as shown in Figure 5.2. The equation for the Reynolds number is

42
(5.3)
In which, ρ is the density of the fluid (kg/m³), v is the mean velocity, L is a
characteristic linear dimension, and μ is the dynamic viscosity of the fluid.
Figure 5.2 Reynolds numbers in the main channel and the daughter channels
As shown in the Figure 5.2, the first column represents Reynolds number in the main
channel and it value was 0.51. Columns from 2 to 7 represent Reynolds numbers for
the six bifurcations, respectively, as indicated in the figure. These values were in the
range from 0.01 to 0.02. The Reynolds number in the main channel was one order
magnitude larger than those of the daughter channels. The results quantitatively
indicated the completely laminar flow in our device.
5.3.2 Flow Velocity Profile
Follow the steps in the previous section, we also ran the simulation to get the velocity
field in the multiple bifurcation device. The simulation results were shown in Figure
5.3. Figure 5.3 (b) shows a close view of the first bifurcation. The velocity in the
Main channel
No. 1 No. 2 No. 3 No. 4 No. 5 No. 6
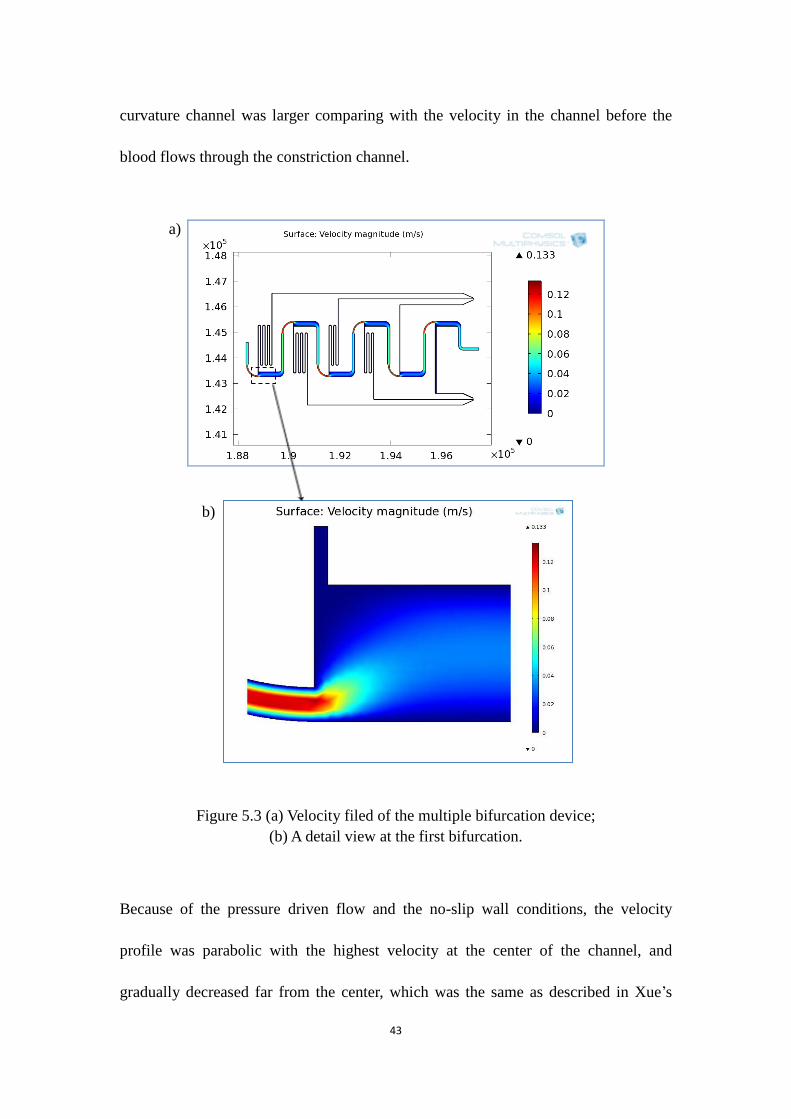
43
curvature channel was larger comparing with the velocity in the channel before the
blood flows through the constriction channel.
Figure 5.3 (a) Velocity filed of the multiple bifurcation device;
(b) A detail view at the first bifurcation.
Because of the pressure driven flow and the no-slip wall conditions, the velocity
profile was parabolic with the highest velocity at the center of the channel, and
gradually decreased far from the center, which was the same as described in Xue’s
a)
b)
44
paper36
.
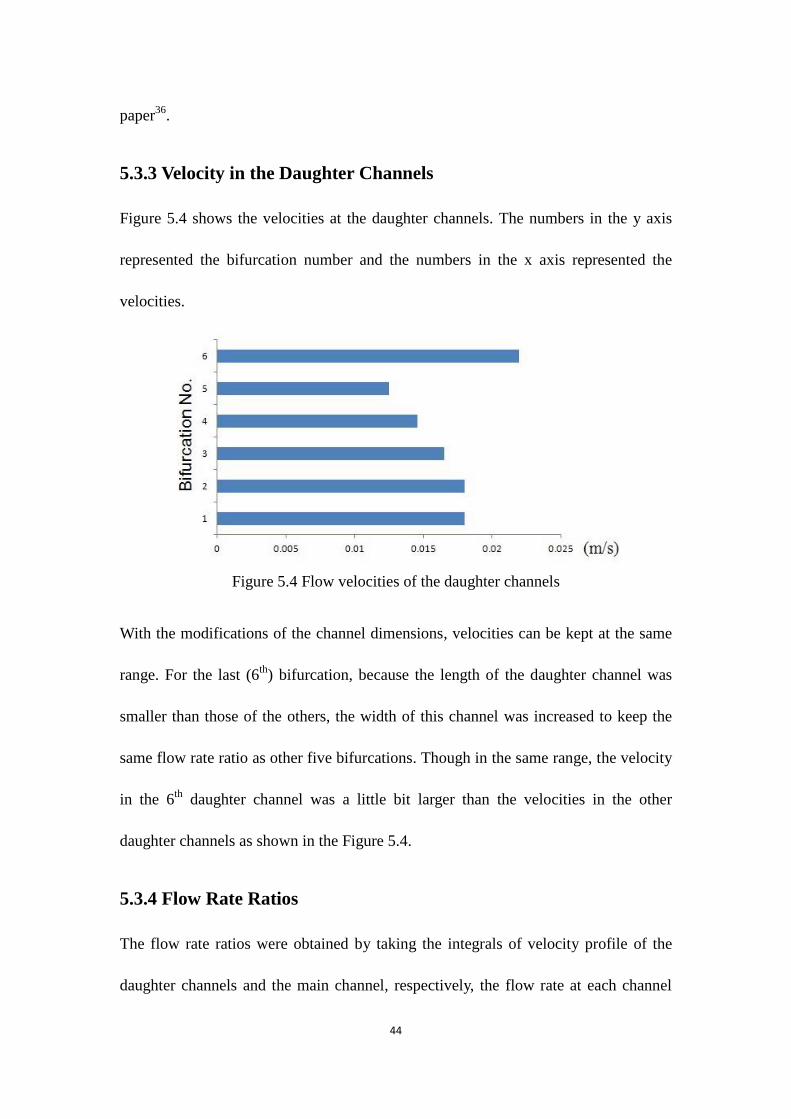
5.3.3 Velocity in the Daughter Channels
Figure 5.4 shows the velocities at the daughter channels. The numbers in the y axis
represented the bifurcation number and the numbers in the x axis represented the
velocities.
Figure 5.4 Flow velocities of the daughter channels
With the modifications of the channel dimensions, velocities can be kept at the same
range. For the last (6th
) bifurcation, because the length of the daughter channel was
smaller than those of the others, the width of this channel was increased to keep the
same flow rate ratio as other five bifurcations. Though in the same range, the velocity
in the 6th
daughter channel was a little bit larger than the velocities in the other
daughter channels as shown in the Figure 5.4.
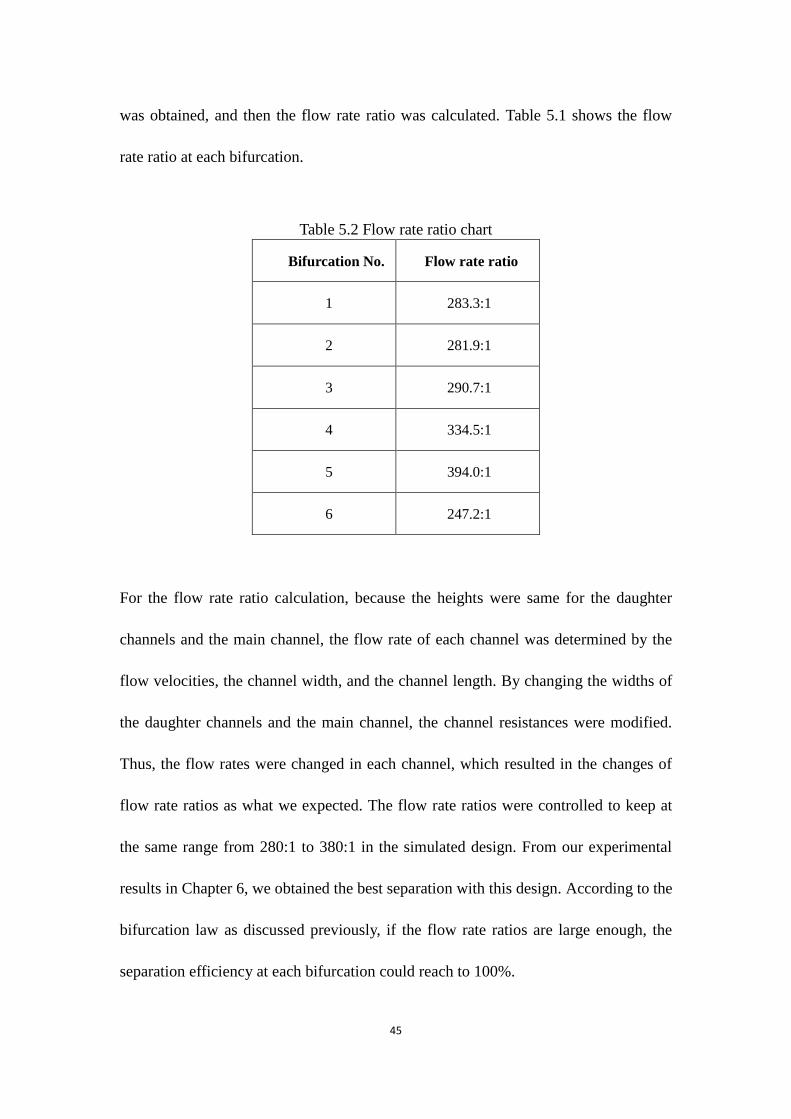
5.3.4 Flow Rate Ratios
The flow rate ratios were obtained by taking the integrals of velocity profile of the
daughter channels and the main channel, respectively, the flow rate at each channel
45
was obtained, and then the flow rate ratio was calculated. Table 5.1 shows the flow
rate ratio at each bifurcation.
Table 5.2 Flow rate ratio chart
Bifurcation No. Flow rate ratio
1 283.3:1
2 281.9:1
3 290.7:1
4 334.5:1
5 394.0:1
6 247.2:1
For the flow rate ratio calculation, because the heights were same for the daughter
channels and the main channel, the flow rate of each channel was determined by the
flow velocities, the channel width, and the channel length. By changing the widths of
the daughter channels and the main channel, the channel resistances were modified.
Thus, the flow rates were changed in each channel, which resulted in the changes of
flow rate ratios as what we expected. The flow rate ratios were controlled to keep at
the same range from 280:1 to 380:1 in the simulated design. From our experimental
results in Chapter 6, we obtained the best separation with this design. According to the
bifurcation law as discussed previously, if the flow rate ratios are large enough, the
separation efficiency at each bifurcation could reach to 100%.

46
Figure 5.5 The critical streamline of (a) Cell-to-vessel diameter ratio is of the order of
one; and (b) Cell-to-vessel diameter ratio is over the order of one.
Some other group has shown that the separation efficient could reach to 100% when
the flow ratio was 6:1. In that case, the cell-to-vessel diameter ratio was of the order
of one. 100% separation efficiency occurred when all the cells moved above the
critical streamline (Figure 5.5 (a)). In our design, the diameter of main channel was
200 μm and was over the order of one compared to the cell diameter (RBC: 6-8 μm),
thus the cell-to-vessel diameter ratio was much smaller. In order to keep 100%
separation efficiency, the flow rate ratio at each bifurcation were increased and the
critical streamline was close to the sidewall of the channel (Figure 5.5 (b)).
In summary, regarding to the bifurcation effects, a simplified model was developed
and mainly used to examine the flow conditions (laminar flow, flow velocities, and
flow rate ratio) in the designed the devices. However, we kept in mind that the
bifurcation effects together with many other factors, such as the fluid properties
(Non-Newtonian and Newtonian fluids), viscosity and its changes in different
microchannels (Fåhræus–Lindqvist effect), the centrifuge forces generated by the
a) b)

47
curvature channel, affect the real experiment for the blood separation. A
comprehensive model, however which beyonds the scope of this thesis research, is
desired for considering all these factors together. In Chapter 6, we compared the
centrifuge force effect in different designed channels, and showed that the centrifuge
forces can assistant the plasma separation and increase the yield.
48
CHAPTER 6: Experimental Results of Multiple
Bifurcation Device
6.1 Experimental Procedures
The blood preparation followed the same procedures for single bifurcation channel.
Whole blood with EDTA as an anticoagulant was diluted with 1X PBS to various
hematocrit levels from 15% to 45%. The tubing and microfluidic device were
pre-wetted using 1% BSA solution for 1 hour at room temperature.
Similar to the operation procedures for single bifurcation device, the diluted blood
was injected into the inlet and flew through the main channel and passed six
bifurcations, respectively. A constriction/curvature changed the blood viscosity and
exerted centrifuge forces on the cells to assist the separation as discussed previously.
After flowing through these bifurcation regions, the plasma was separated into each
daughter channel. The plasma from each daughter channel was merged together and
outflew into the two reservoirs for collection. The separated blood cells will outflow
into the central reservoir.
Fig. 6.1 (a) and Figure 6.1 (b) showed the schematic set-up and experimental set-up,
respectively, including a syringe pump, a syringe with the diluted blood, the
fabricated microfluidic device which was put under the Nikon microscope, and a
computer with Nikon Element software for time-lapse imaging recording. At first, the
blood was driven by the syringe pump into the microfluidic device through the
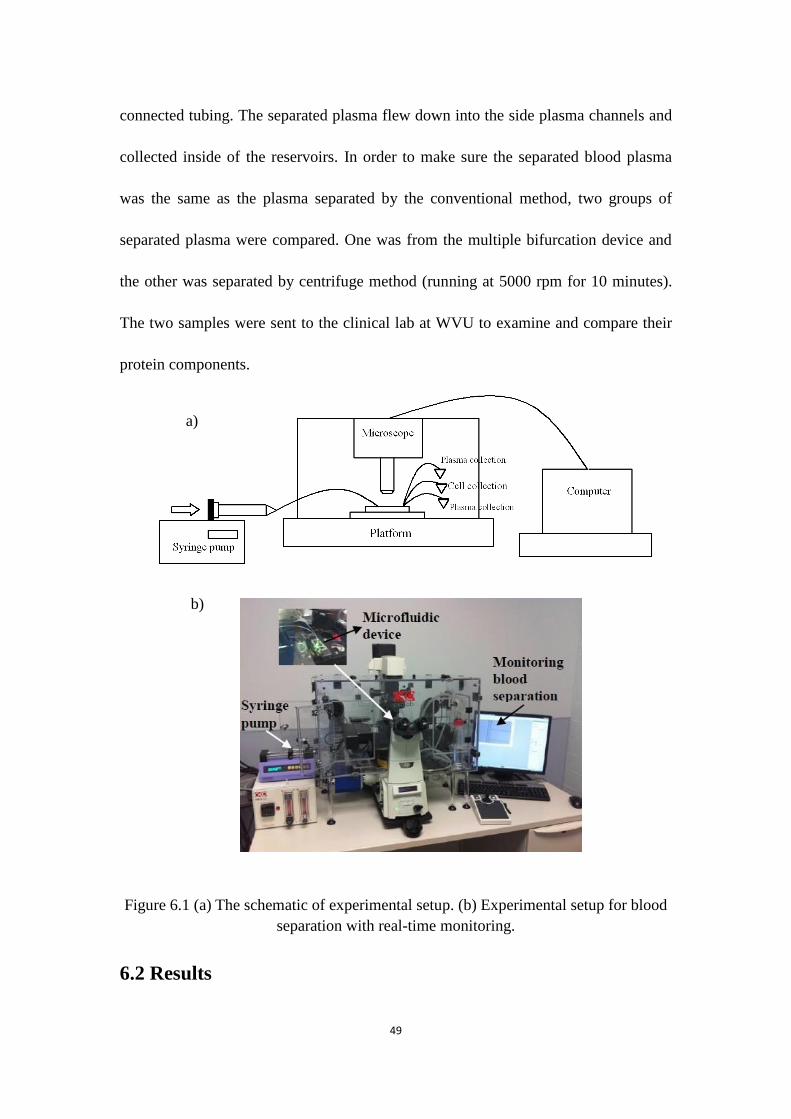
49
connected tubing. The separated plasma flew down into the side plasma channels and
collected inside of the reservoirs. In order to make sure the separated blood plasma
was the same as the plasma separated by the conventional method, two groups of
separated plasma were compared. One was from the multiple bifurcation device and
the other was separated by centrifuge method (running at 5000 rpm for 10 minutes).
The two samples were sent to the clinical lab at WVU to examine and compare their
protein components.
Figure 6.1 (a) The schematic of experimental setup. (b) Experimental setup for blood
separation with real-time monitoring.
6.2 Results
b)
a)

50
The images were taken by the inverted microscope (Nikon Eclipse Ti, Japan) as
shown in the Figure 6.2 (a, b, c). These pictures showed that the blood separation at
six bifurcations, respectively.
Figure 6.2 (a) Plasma separation at 1st and 2nd bifurcation. (b) Plasma separation at
3rd and 4th bifurcation. (c) Plasma separation at 5th and 6th bifurcation.
The red color shown in the pictures represents the blood cells, which were flowing in
the main microchannel. Under the influence of centrifugation forces, the cells flew

51
close to the outer edge of the main channel wall at the bifurcation region. The blood
cells’ trajectories were clearly observed and the cells were separated at each
bifurcation region. Majority of the blood cells flew through the main channel and
leave the cell free plasma flew into the daughter channels.
The flow rates of the blood were set from 5 μl/min to 25 μl/min. We examined the
flow rates’ influence on the blood plasma separation efficiency. In addition, the blood
samples with different hematocrit levels were varied from 15 % to 45% to test the
effects on the separation. The results showed that both running flow rates and
hematocrit levels of the blood affect the separation efficiency and yield. We discussed
this in more details in the following sections.
6.3 Hydrodynamic Effects on Blood Separation
As discussed in chapter 3, three hydrodynamic effects were applied in the device
design. Because of the geometry difference of the main channel and the daughter
channels (mainly the width of main channel was larger than the width of the daughter
channels), the flow rate in the main channel was larger than the flow rate in the
daughter channel, which was also validated by the COMSOL simulation. According
to the bifurcation law, most cells flew through the main channel.
In the separation region, the curvature channel exerted a centrifuge force on the blood
cells. The centrifuge force changes as the radius of the curvature channel changes.
After the cells flew through this channel, they had the tendency to go through the

52
outer edge of the main channel and leave the cell-free plasma flew into the daughter
channels. The separation efficiently was increased with the modification of curvature
channels.
Based on the Fåhræus–Lindqvist effect, the viscosities of the blood solutions in the
main channel and curvature channels were different because of the different channel
widths. The viscosity in the main channel was larger compared with the fluid
viscosity in the curvature channel. However, because of the limited resource to
measure the viscosity inside the microfluidic channel during the experiment, we have
not been able to quantify the accurate viscosity effects on the separation.
Figure 6.3 A) A microfluidic device. B) Blood separation in the microfluidic device. C)
Higher magnification showing blood separation in the device.
We also tested a bifurcation microfluidic device without considering the centrifuge
force. As shown in the Figure 6.3, the plasma was successfully separated through the
bifurcation, however, the plasma yield was extremely low. The results helped to
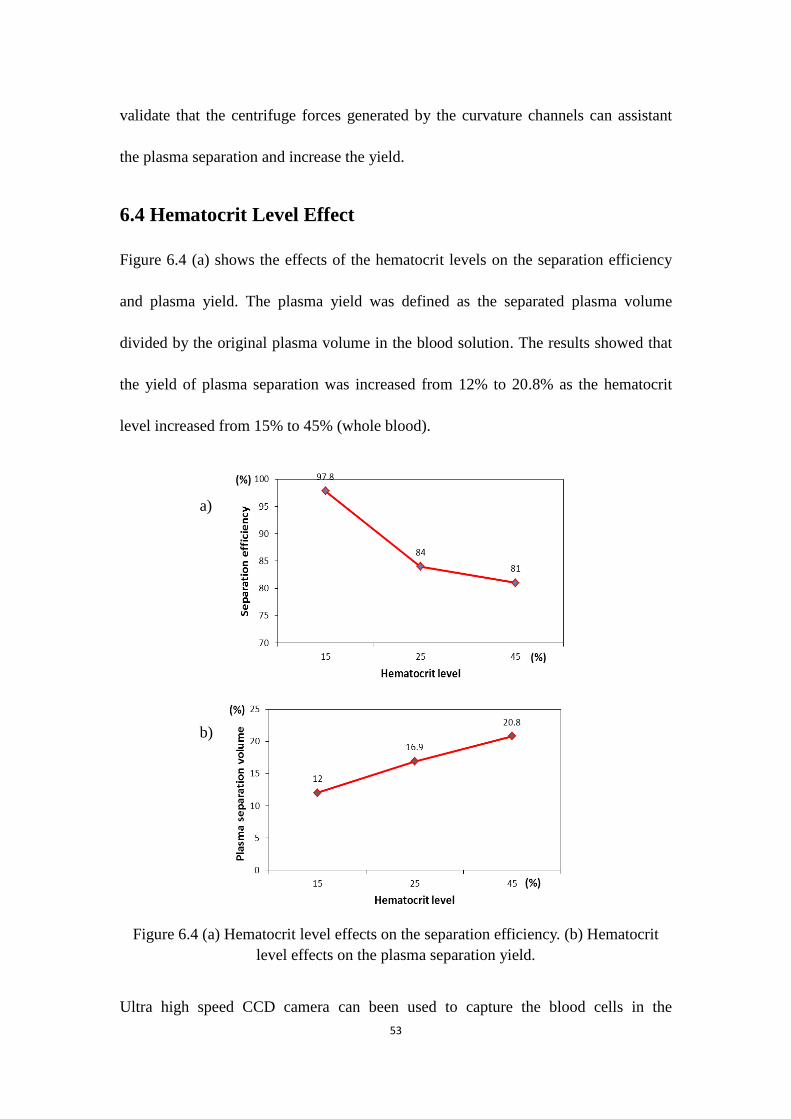
53
validate that the centrifuge forces generated by the curvature channels can assistant
the plasma separation and increase the yield.
6.4 Hematocrit Level Effect
Figure 6.4 (a) shows the effects of the hematocrit levels on the separation efficiency
and plasma yield. The plasma yield was defined as the separated plasma volume
divided by the original plasma volume in the blood solution. The results showed that
the yield of plasma separation was increased from 12% to 20.8% as the hematocrit
level increased from 15% to 45% (whole blood).
Figure 6.4 (a) Hematocrit level effects on the separation efficiency. (b) Hematocrit
level effects on the plasma separation yield.
Ultra high speed CCD camera can been used to capture the blood cells in the
b)
a)
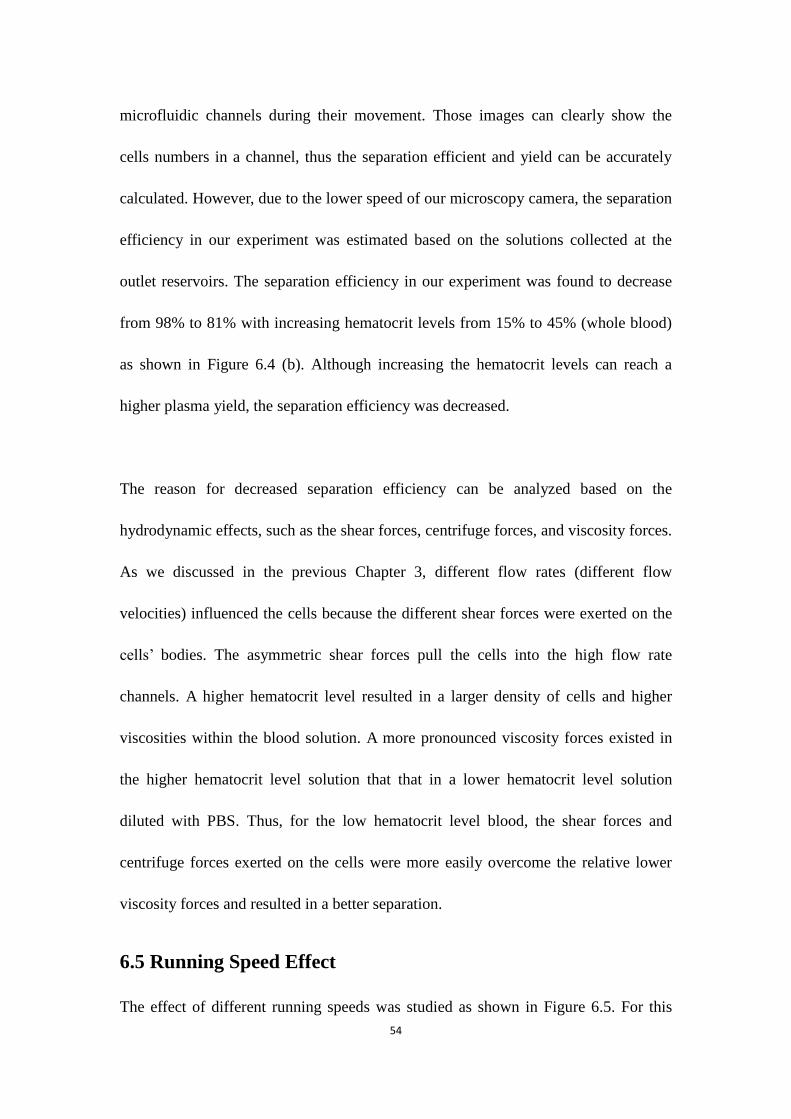
54
microfluidic channels during their movement. Those images can clearly show the
cells numbers in a channel, thus the separation efficient and yield can be accurately
calculated. However, due to the lower speed of our microscopy camera, the separation
efficiency in our experiment was estimated based on the solutions collected at the
outlet reservoirs. The separation efficiency in our experiment was found to decrease
from 98% to 81% with increasing hematocrit levels from 15% to 45% (whole blood)
as shown in Figure 6.4 (b). Although increasing the hematocrit levels can reach a
higher plasma yield, the separation efficiency was decreased.
The reason for decreased separation efficiency can be analyzed based on the
hydrodynamic effects, such as the shear forces, centrifuge forces, and viscosity forces.
As we discussed in the previous Chapter 3, different flow rates (different flow
velocities) influenced the cells because the different shear forces were exerted on the
cells’ bodies. The asymmetric shear forces pull the cells into the high flow rate
channels. A higher hematocrit level resulted in a larger density of cells and higher
viscosities within the blood solution. A more pronounced viscosity forces existed in
the higher hematocrit level solution that that in a lower hematocrit level solution
diluted with PBS. Thus, for the low hematocrit level blood, the shear forces and
centrifuge forces exerted on the cells were more easily overcome the relative lower
viscosity forces and resulted in a better separation.
6.5 Running Speed Effect
The effect of different running speeds was studied as shown in Figure 6.5. For this

55
testing, the hematocrit level was kept at the same level of 15%. The running speeds
were varied from 5 µl/min to 25 µl/min in the experiment.
Figure 6.5 Separation efficiency at different running speeds when the hematocrit level
was kept as 15%.
As shown in this figure, the running speed at 15 µl/min showed the best separation
efficiency as compared with other running speeds. Under lower flow rates, the shear
forces exerted on the cells in the microchannel were not enough to drive the cells into
the high flow rate channel, thus some of the cells flew into the plasma channel. Under
higher running speeds, our results showed different phenomena compared with others.
In Yang’s paper, they found that the separation efficiency has the positive relationship
with the running speeds28
. More experiments should be performed to average the
results for a solid conclusion.
6.6 Electrophoresis Results
In order to make sure that the microfluidic separated plasma has the same protein
components as the plasma separated by conventional methods (centrifugation), we
compared the plasma separated by both methods. The plasma as the control group

56
(Figure 1.4) was extracted by the centrifuge method running at 5000 rpm for 10
minutes. Figure 6.6 shows the separated plasma (test group) collected by the multiple
bifurcation microfluidic device. The separation was done at the flow rate of 20 µl/min
as the hematocrit level was kept at 15%.
Figure 6.6 Microfluidic separated blood plasma (hematocrit level: 15%)
The microfluidic separated plasma sample and centrifuged plasma sample were sent
to WVU Clinical lab for the electrophoresis analysis. The electrophoresis analysis is
an experimental process that blood plasma is placed on a special paper treated with
agarose gel and exposed to an electric field to separate the proteins based on their
sizes and electrical charges. Figure 6.7 (a) and (b) show the electrophoresis analysis
based on the centrifuged plasma and microfluidic separated plasma.
As shown in figures, compared with the referece group, the plasma separated by our
microfluidic device consist of major proteins in human blood plasma, including
albumin, alpha 1, alpha 2, beta, fibrinogen (human plasma indicator), and gamm. The

57
Figure 6.7 Electrophoresis analysis of (a) centrifuged plasma and (b) microfluidic
separated plasma.
concentration of each protein were varified and shown to have a similar values as
those presented in the control group. This demonstrates that the microfluidic separated
plasma is almost the same as the plasma separated by the conventional method.
a) b)
58
CHAPTER 7: Microfluidic Membrane Based Plasma
Separation
7.1 Introduction
There has been tremendous interest in the past decade using nanoporous or
microporous membranes as functional units in biosensor development. These
membrane-based technologies offer multiple advantages in sensing because of the
nanoporosity or microporosity of the membranes that enables size-based trapping of
biomolecules or particles. The membrane can be manufactured using standard
processes with appropriate quality control for realizing some specifications, such as
biocompatible and surface functions37
.
Several approaches have been investigated for integration of the membrane within the
microfluidic devices. Generally, it can be categorized into four methods: 1) Direct
integration of commercial membranes; 2) Fabrication the membrane together with the
chip fabrication process; 3) In-situ preparation of the membrane; and 4) Bulk
materials functioned as a membrane38
.
The first method is the most straight-forward, which is also the method used in our
microfluidic membrane based device fabrication. This method simply uses clamping
or gluing. Membrane can be easily prepared in-house in some cases, or directly
purchased from a commercial supplier. Modifications can be applied to functionalize
the membrane, such as by immobilization with trypsin39
, bovine serum albumin
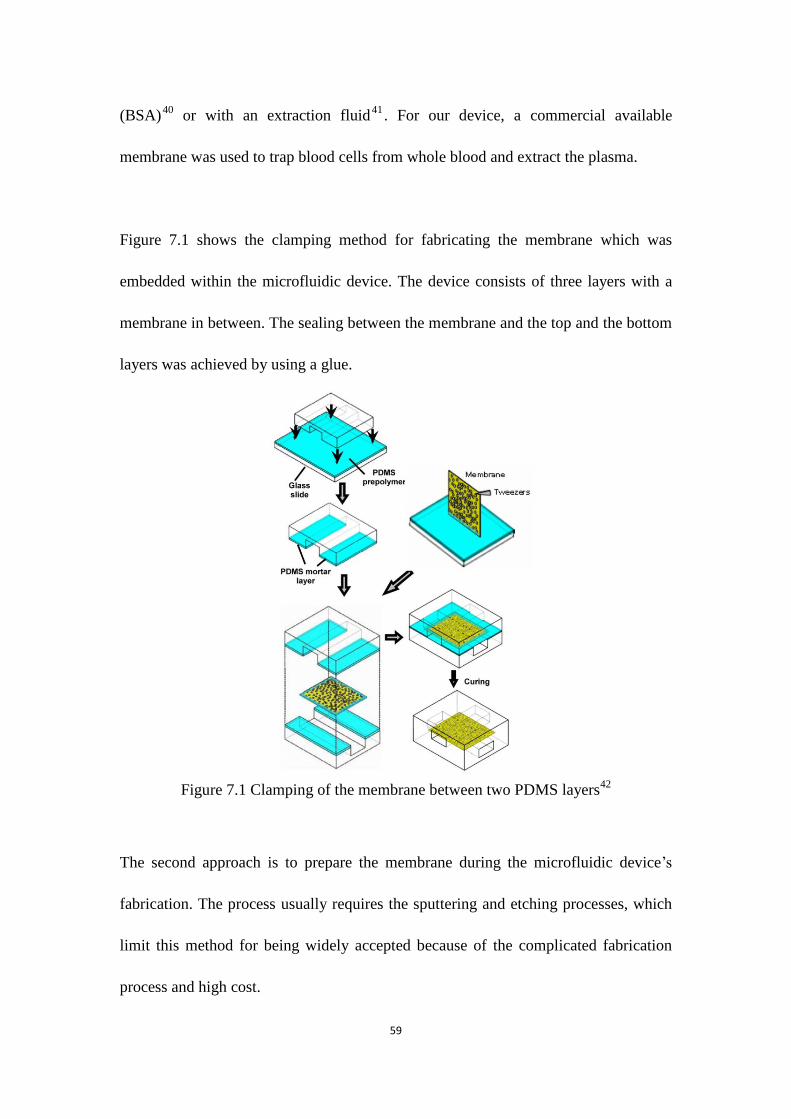
59
(BSA)40
or with an extraction fluid41
. For our device, a commercial available
membrane was used to trap blood cells from whole blood and extract the plasma.
Figure 7.1 shows the clamping method for fabricating the membrane which was
embedded within the microfluidic device. The device consists of three layers with a
membrane in between. The sealing between the membrane and the top and the bottom
layers was achieved by using a glue.
Figure 7.1 Clamping of the membrane between two PDMS layers42
The second approach is to prepare the membrane during the microfluidic device’s
fabrication. The process usually requires the sputtering and etching processes, which
limit this method for being widely accepted because of the complicated fabrication
process and high cost.

60
The third method is in situ preparation of membrane. Moorthy and Beebe fabricated a
porous membrane in the microfluidic channel by emulsion photo polymerization12
.
The last method is to choose a material that can be functioned as a membrane, such as
PDMS. The advantages of PDMS have been discussed in Chapter 4. In Jong’s paper,
they used PDMS as the membrane43
. Eight PDMS layers were built to integrate with
an oxygen chamber. The permeability of PDMS is used to supply oxygen to cells.
Water and carbon dioxide can also be exchanged through the membrane.
Figure 7.2 (a) Schematic design of crossed microfluidic channels separated by a
nanometer-diameter capillary array interconnect. (b) Schematic design of a parallel
channel system.
In Kuo’s paper, they used nanofluidic membrane to build a microfluidic separation
system44
. Figure 7.2 (a) shows the schematic design of this system, which was a
crossed microfluidic separation system. The diameters of cylinder pores in the
membrane were varied from 15 nm to 200 nm. The authors also developed a parallel
channel system as shown in Figure 7.2 (b). Figure 7.3 shows the picture of the
microfluidic separation device. The white rectangle shown in the device was the
polycarbonate track-etched (PCTE) membrane (200 nm diameter pores).
a) b)

61
Figure 7.3 Photograph of a microchip with crossed microchannels and a nanofluidic
membrane
7.2 Vivid Plasma Separation Membrane
For our microfluidic device we used Vivid Plasma separation membrane from Pall
Life Science Corporation. It is a highly efficient membrane for one-step plasma
separation from whole blood without the use of centrifugation. The patented Vivid
Plasma Separation membrane is specifically engineered and optimized for the
generation of high quality plasma for use in downstream diagnostic assays.
Constructed of asymmetric polysulfone, the membrane efficiently captures the
cellular components of whole blood resulting in plasma that contains minimal cellular
contaminants. The asymmetric structure of the membrane gently captures the cellular
components without lysis which is a contrast from glass fiber media that often shears
and lyses cells leading to contamination of the plasma45
.
In summary, the membrane can 1) Achieve high quality plasma in less than two
minutes with ≥ 80% plasma yield; 2) Hemolysis levels significantly lower than
Membrane
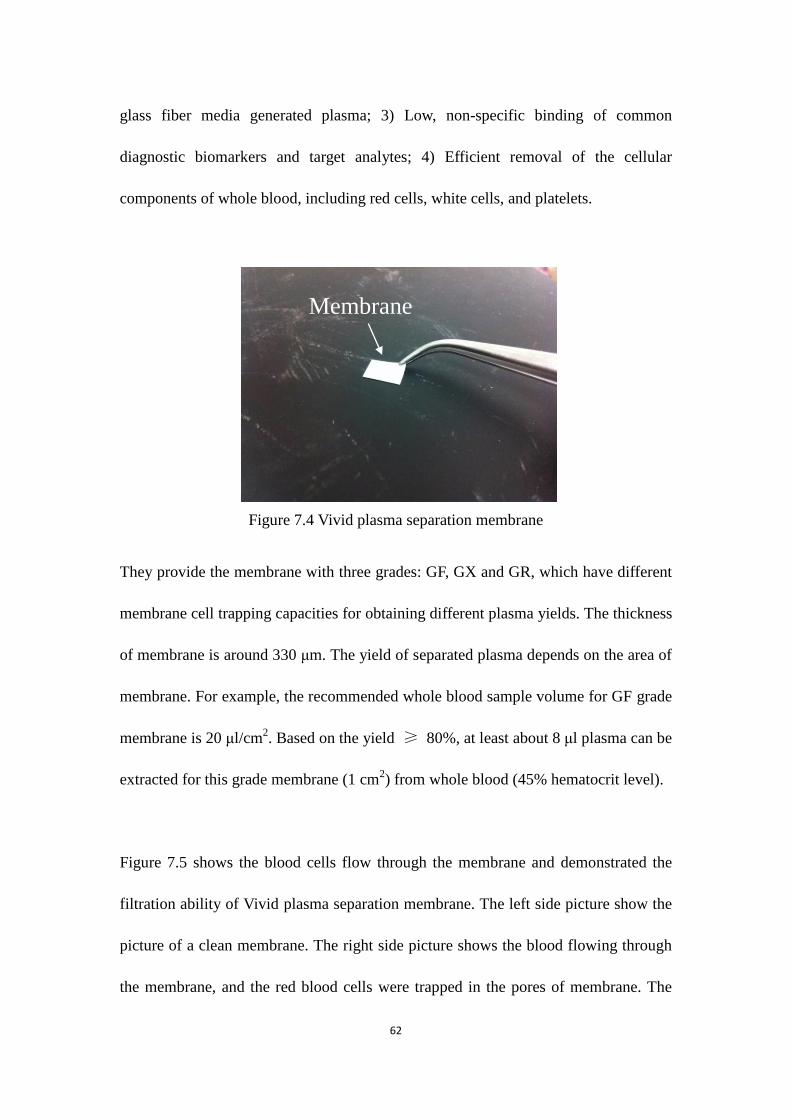
62
glass fiber media generated plasma; 3) Low, non-specific binding of common
diagnostic biomarkers and target analytes; 4) Efficient removal of the cellular
components of whole blood, including red cells, white cells, and platelets.
Figure 7.4 Vivid plasma separation membrane
They provide the membrane with three grades: GF, GX and GR, which have different
membrane cell trapping capacities for obtaining different plasma yields. The thickness
of membrane is around 330 μm. The yield of separated plasma depends on the area of
membrane. For example, the recommended whole blood sample volume for GF grade
membrane is 20 μl/cm2. Based on the yield ≥ 80%, at least about 8 μl plasma can be
extracted for this grade membrane (1 cm2) from whole blood (45% hematocrit level).
Figure 7.5 shows the blood cells flow through the membrane and demonstrated the
filtration ability of Vivid plasma separation membrane. The left side picture show the
picture of a clean membrane. The right side picture shows the blood flowing through
the membrane, and the red blood cells were trapped in the pores of membrane. The
Membrane
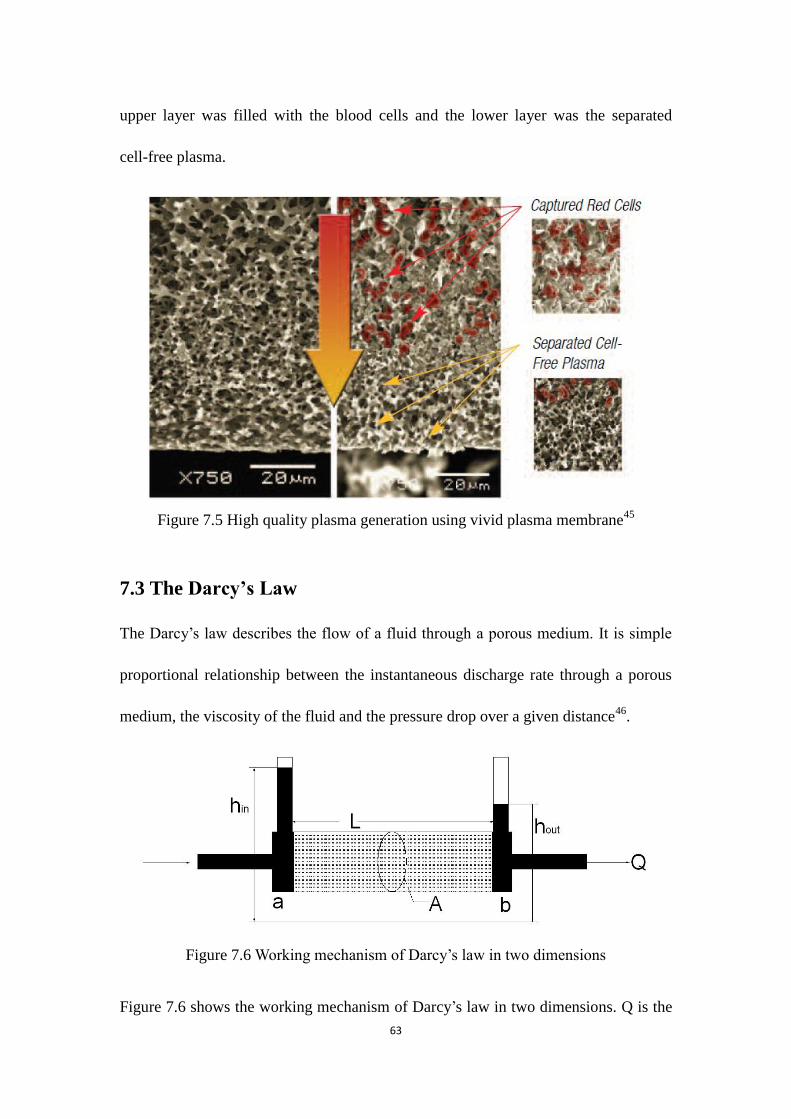
63
upper layer was filled with the blood cells and the lower layer was the separated
cell-free plasma.
Figure 7.5 High quality plasma generation using vivid plasma membrane45
7.3 The Darcy’s Law
The Darcy’s law describes the flow of a fluid through a porous medium. It is simple
proportional relationship between the instantaneous discharge rate through a porous
medium, the viscosity of the fluid and the pressure drop over a given distance46
.
Figure 7.6 Working mechanism of Darcy’s law in two dimensions
Figure 7.6 shows the working mechanism of Darcy’s law in two dimensions. Q is the
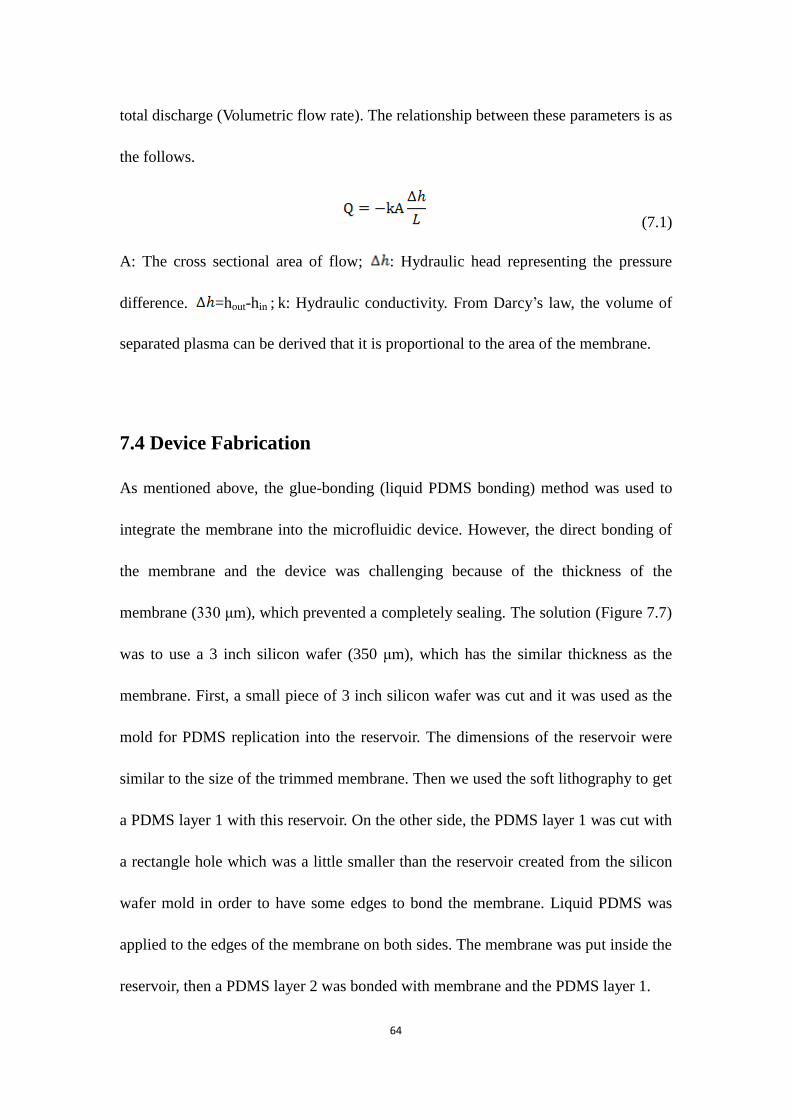
64
total discharge (Volumetric flow rate). The relationship between these parameters is as
the follows.
(7.1)
A: The cross sectional area of flow; : Hydraulic head representing the pressure
difference. =hout-hin ; k: Hydraulic conductivity. From Darcy’s law, the volume of
separated plasma can be derived that it is proportional to the area of the membrane.
7.4 Device Fabrication
As mentioned above, the glue-bonding (liquid PDMS bonding) method was used to
integrate the membrane into the microfluidic device. However, the direct bonding of
the membrane and the device was challenging because of the thickness of the
membrane (330 μm), which prevented a completely sealing. The solution (Figure 7.7)
was to use a 3 inch silicon wafer (350 μm), which has the similar thickness as the
membrane. First, a small piece of 3 inch silicon wafer was cut and it was used as the
mold for PDMS replication into the reservoir. The dimensions of the reservoir were
similar to the size of the trimmed membrane. Then we used the soft lithography to get
a PDMS layer 1 with this reservoir. On the other side, the PDMS layer 1 was cut with
a rectangle hole which was a little smaller than the reservoir created from the silicon
wafer mold in order to have some edges to bond the membrane. Liquid PDMS was
applied to the edges of the membrane on both sides. The membrane was put inside the
reservoir, then a PDMS layer 2 was bonded with membrane and the PDMS layer 1.
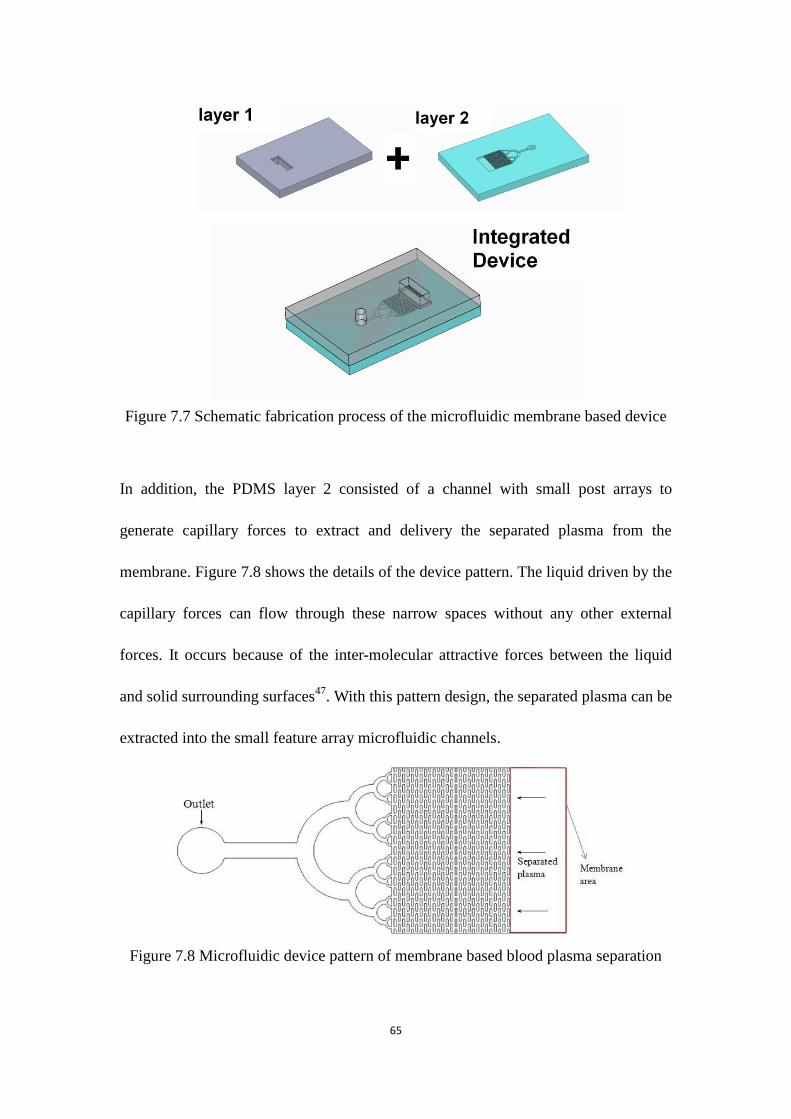
65
Figure 7.7 Schematic fabrication process of the microfluidic membrane based device
In addition, the PDMS layer 2 consisted of a channel with small post arrays to
generate capillary forces to extract and delivery the separated plasma from the
membrane. Figure 7.8 shows the details of the device pattern. The liquid driven by the
capillary forces can flow through these narrow spaces without any other external
forces. It occurs because of the inter-molecular attractive forces between the liquid
and solid surrounding surfaces47
. With this pattern design, the separated plasma can be
extracted into the small feature array microfluidic channels.
Figure 7.8 Microfluidic device pattern of membrane based blood plasma separation

66
Figure 7.9 The membrane based device
7.5 Experimental Results
Before the experiment, the device was put in a oxygen plasma cleaner for oxygen
plasma treatment for 90 seconds. Then the diluted blood was loaded into the inlet. The
device was put under the microscope for observation. Figure 7.10 shows the blood
separation using the membrane based device. The dark area in right of the figure was
the membrane area. The separated plasma flew from the right to the left, and the
separated plasma can continuously flow through the post array channel to the outlet.
Figure 7.10 The picture shows the plasma separation using a membrane based device
Membrane
Membrane area
Separated plasma
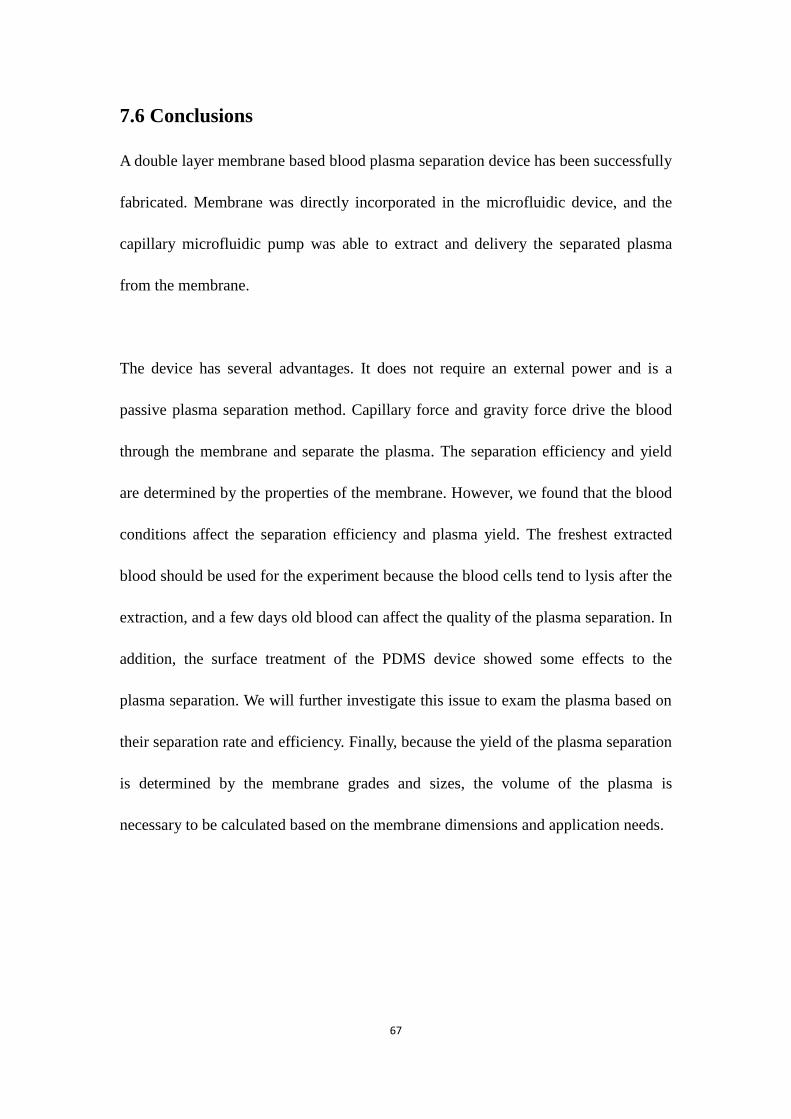
67
7.6 Conclusions
A double layer membrane based blood plasma separation device has been successfully
fabricated. Membrane was directly incorporated in the microfluidic device, and the
capillary microfluidic pump was able to extract and delivery the separated plasma
from the membrane.
The device has several advantages. It does not require an external power and is a
passive plasma separation method. Capillary force and gravity force drive the blood
through the membrane and separate the plasma. The separation efficiency and yield
are determined by the properties of the membrane. However, we found that the blood
conditions affect the separation efficiency and plasma yield. The freshest extracted
blood should be used for the experiment because the blood cells tend to lysis after the
extraction, and a few days old blood can affect the quality of the plasma separation. In
addition, the surface treatment of the PDMS device showed some effects to the
plasma separation. We will further investigate this issue to exam the plasma based on
their separation rate and efficiency. Finally, because the yield of the plasma separation
is determined by the membrane grades and sizes, the volume of the plasma is
necessary to be calculated based on the membrane dimensions and application needs.
68
CHAPTER 8: Conclusions and Future Work
8.1 Conclusions
In this thesis work, we developed both active and passive microfluidic based human
blood plasma separation devices. In Chapter 3, 4, 5 and 6, we discussed the
hydrodynamic effects for microfluidic plasma separation and special channel designs.
Then COMSOL simulation was applied for the optimization of the design and
assistance to verify the design. In chapter 7, we developed the microfluidic membrane
based device for blood plasma separation. The following conclusions were drawn
from the results of this research:
1. Both active and passive microfluidic blood plasma separation devices were
successfully fabricated.
2. Several hydrodynamic effects were applied in the microfluidic continuous plasma
separation, which are bifurcation law, centrifuge force and Fåhræus–Lindqvist
effect.
3. COMSOL simulation is convenient for us to optimize the design.
4. Hematocrit levels affect the separation efficiency and plasma yield.
5. The plasma separation rate of the device can reach up to 98 % and plasma yield
can reach to 20 %.
6. The electrophoresis results showed that the microfluidic separated plasma has the
same protein components as the plasma separated by centrifugation.

69
7. Small blood handling, high plasma yield and separation efficiency can be obtained
by the continuous active microfluidic blood plasma separation techniques.
8. The microporosity of the Vivid membrane efficiently enables the trapping of
blood cells from the whole blood. The size of the membrane determines the
plasma yield.
9. Small blood handling and extra power free are the benefits for the passive
membrane based microfluidic plasma separation.
8.2 Future Work
We have developed the microfluidic devices for separating the plasma from the whole
human blood. In addition, we are developing PDMS on-chip microvalve technologies
in our lab and are working to integrate the microfluidic plasma separation unit with a
multiplex heavy metal sensor into a Lab-on-a-Chip (LOC) device. LOC is a technique
to perform chip-scale assays driven by microfluidics to automate and 'streamline'
different chemical or biological processes (Figure 8.1).
Figure 8.1 Lab on a Chip
48
The applications of LOCs include many aspects. In Chin’s paper, they investigated the

70
past studies and future opportunities of LOCs for the global health49
. In their review,
they discussed communicable and non-communicable diseases, such as HIV/AIDS,
malaria, measles, cancer, respiratory diseases, and diabetes mellitus. These diseases
would expect to be detected by LOCs in the near future, and some LOCs have been
available for simple operation and rapid detection.
In Figeys’s paper, they revealed the revolution of LOCs in biological and medical
sciences50
. They pointed out that the miniaturization of devices can efficiently reduce
the cost for device fabrication and reagents consumption. In human genome project,
LOCs could integrate with excitation source, pressure source or control circuitry for
identifying DNA. In the future, novel materials and fabrication processes will likely
be used for next generation of microfabricated devices.
Figure 8.2 (a) Photograph of an array of complementary organic inverters on 1 mm
thick transparent PDMS. (b) The detailed view of inverter device. (c) Schematic
design of the complementary inverter stack directly prepared on PDMS.
LOCs are now extending their abilities to new areas. In Graz’s paper, they built an
organic circuit on a new class of substrate, silicone elastomers51
. Figure 8.2 show the
photograph and schematic of this device. This device demonstrated the feasibility of

71
organic electronics on plastic. In the future, many these electronic LOCs will be
created for a variety of applications.
Figure 8.3 An integrated microfluidic electrochemical sensor based on planar
electrodes.
A microfluidic LOC electrochemical sensor platform has been demonstrated by our
group and this work is collaborated with Dr. Wu’s group at WVU. (Figure 8.3) The
figure shows the LOC includes a microfluidic mixer and the sensor electrodes. The
microfluidic blood separation unit will be integrated with the LOC. This LOC device
could expect to offer many advantages, such as small blood volume handling, fast and
effective detection, and portable for point-of-care applications.

72
REFERENCES
1 J. Witnesses. Position Overview. Bloodless Medicine & Surgery, 2007.
<http://www.pennmedicine.org/health_info/bloodless/000206.html>
2 M. Toner, D. Irimia. Blood-on-a-Chip. Annual Review Biomedical Engineering, 7,
77-103, 2005.
3 Extreme Health USA Corporation. Kelation Therapy.
<http://www.kelation-therapy.com/>
4 M. Kaloyianni, S Dailianis, E. Chrisikopoulou, A. Zannous, S. Koutsogiannaki, D.
Alamdari, G. Koiakos, V. Dimitriadis. Oxidative Effects of Inorganic and Organic
Contaminants on Haemolymph of Mussels. Comparative Biochemistry and
Physiology. 149, 631-639, 2009.
5 A. Sallam, N. Hwang. Human Red Blood Cell Hemolysis in a Turbulent Shear-flow:
Contribution of Reynolds Shear Stresses. Biorheology, 21, 783-797, 1984.
6 M. Kersaudy-Kerhoas, D. Kavanagh, R. Dhariwal, C. Campbell, M. Desmulliez.
Validation of a Blood Plasma Separation System by Biomarker Detection. Lab Chip,
10, 1587-1595, 2010.
7 E. Stern, A. Vacic, N. K. Rajan, J.M. Criscione, J. Park, B. R. Ilic, D. J. Mooney, M.
A. Reed, T. M. Fahmy, Label-free biomarker detection from whole blood. Nature
Nanotechnology, 5, 138-141, 2010.
8 W. Yang. New Biomedical Microdevice Detects Cancer Faster & With Less Pain.
<http://therohanaurora.com/new-biomedical-microdevice-detects-cancer-faster-with-l
ess-pain/>
9 H. Shapiro. Practical Flow Cytometry. New Jersey: John Wiley & Sons, Inc., fourth
edition, 2005.
10
Abcam Corporation. Flow Cytometry Guide.
<http://docs.abcam.com/pdf/protocols/Introduction_to_flow_cytometry_May-10.pdf
>
11
L. Terstappen, S. Johnsen, M. Segers-Nolten, M. Loken. Identification and
Characterization of Plasma Cells in Normal Human Bone Marrow by
High-Resolution Flow Cytometry. Blood, 76, 1739-1747, 1990.
12
J. Moorthy, D. J. Beebe. In Situ Fabricated Filters for Microsystems. Lab Chip, 3,
62-66, 2003.
13
J. Zoval, M. Madou. Centrifuge Based Fluidic Platforms. Proceedings of the IEEE,
73
92, 776-781, 2006.
14
S. Haeberle, T. Brenner, R. Zengerle, J. Ducree. Centrifugal Extraction of Plasma
from Whole Blood on a Rotating Disk. Lab Chip, 6, 776-781, 2006.
15
N. Korin, A. Bransky, U. Dinnar. Theoretical Model and Experimental Study of
Red Blood Cell (RBC) Deformation in Microchannels. Journal of Biomechanics, 40,
2088-2095, 2007.
16
P. Wilding, L. Kricka, J. Cheng, G. Hvichia, M. Shoffner, P. Fortina. Integrated
Cell Isolation and Polymerase Chain Reaction Analysis Using Silicon Microfilter
Chambers. Analytical Biochemistry, 257, 95-100, 1998.
17
L. Huang, E. Cox, R. Austin, J. Sturm. Continuous Particle Separation Through
Deterministic Lateral Displacement. Science, 304, 987-990, 2004.
18
M. Hughes. Strategies for Dielectrophoretic Separation in Laboratory-on-a-Chip
Systems. Electrophoresis, 23, 2569-2582, 2002.
19
R. Applegate, J. Squier, T. Vestad, J. Oakey, D. Marr, P. Babo, M. Dugan, A. Said.
Microfluidic Sorting System Based on Optical Waveguide Integration and Diode
Laser Bar Trapping. Lab Chip, 6, 422-426, 2006.
20
M. Takayasu, D. Kolland, J. Minervini. Continuous Magnetic Separation of Blood
Components from Whole Blood. IEEE Transactions on Applied Superconductivity, 10,
927-930.
21
P. Sethu, M. Anahtar, L. Moldawer, R. Tompkins, M. Toner. Continuous Flow
Microfluidic Device for Rapid Erythrocyte Lysis. Analtical Chemistry, 76, 6247-6253,
2004.
22
V. Hessel, H. Lowe, F. Schonfeld. Review on Patents in Microreactor and Micro
Process Engineering. Chemical Engineering Science, 60, 2479–2501, 2005.
23
K. Oh, C. Ahn. A review of microvalves, Journal of Micromechanics and
Microengineering. 16(5), 13–39, 2006.
24
S. Shoji, M. Esashi. Microflow Devices and Systems. Journal of Micromechanics
and Microengineering, 4, 157–171, 1994.
25
M. Kersaudy-Kerhoas, R. Dhariwal, M. Desmulliez, L. Jouvet. Hydrodynamic
Blood Plasma Separation. Microfluid Nanofluid, 8, 105-114, 2010.
26
M. Abkarian, A. Viallat. Vesicles and Red Blood Cells in Shear Flow. Soft Matter,
4, 653-657, 2008.
27
M. Abkarian, M. Faivre, A. Viallat. Swinging of Red Blood Cells under Shear Flow.
Physics Review Letter, 98, 18-22, 2007.
74
28
S. Yang, A. Undar, J.D. Zahn. A Microfluidic Device for Continuous, Real Time
Blood Plasma Separation. Lab Chip, 6, 871-880, 2006.
29
C. Blattert, R. Jurischka, I. Tahhan, A. Schoth, P. Kerth, W. Menz. Microfluidic
Blood Plasma Separation Unit Based on Microchannel Bend Structures. Proceedings
of the 3rd
Annual International IEEE EMBS Special Topic, 2005.
30
C. Blattert, R. Jurischka, I. Tahhan, A. Schoth, P. Kerth, W. Menz. Separation of
Blood in Microchannel Bends. Proceedings of the 26th
Annual International
Conference of the IEEE EMBS, 2004.
31
X. Xue, M. K. Patel, M. Kersaudy-Kerhoas, C. Bailey, M. P. Y. Desmulliez, D.
Topham. Effect of Fluid Dynamics and Device Mechanism on Biofluid Behaviour in
Microchannel Systems: Modelling Biofluids in a Microchannel Biochip Separator.
2009 International Conference on Electronic Packaging Technology & High Density
Packaging (ICEPT-HDP) IEEE, 2009.
32
R. Fahraeus, T. Lindqvist. The Viscosity of the Blood in Narrow Capillary Tubes.
1930.
33
C. Huang, P. Li, C. Pai, T. Len, C. Jen. Design and Simulation of a Microfluidic
Blood-Plasma Separation Chip Using Microchannel Structures. Separation Science
and Technology, 45, 42-49, 2010. 34
B. Jo, L. Lerberghe, K. Motsegood, D. Beebe. Three-Dimensional Micro-Channel
Fabrication in Polydimethylsiloxane (PDMS) Elastomer. Journal of
Microelectromechanical Systems, 9, 76-81, 2000.
35
COMSOL Company. <http://www.comsol.com/products/multiphysics/>
36
X. Xue, M. Patel, M. Kersaudy-Kerhoas, C. Bailey, M. Desmulliez, D. Topham.
Effect of Fluid Dynamics and Device Mechanism on Biofluid Behaviour in
Microchannel Systems: Modelling Biofluids in a Microchannel Biochip Separator.
2009 International Conference on Electronic Packaging Technology & High Density
Packaging (ICEPT-HDP) IEEE, 2009.
37
S. Prasad, Y. Yadav, M. Bothara, S. Muthukumar, V. Kunduru. Microfluidic
Devices in Nanotechnology. New Jersey: John Wiley & Sons, Inc., 2010.
38
J. Jong, R. Lammertink, M. Wessling. Membranes and Microfluidics: A Review.
Lab chip, 6, 1125-1139, 2006.
39
J. Cooper, J. Chen, Y. Li, C. Lee. Membrane-Based Nanoscale Proteolytic Reactor
Enabling Protein Digestion, Peptide Separation, and Protein Identification Using
Mass Spectrometry. Analytical Chemistry, 75, 1067-1074, 2003.
40
P. Wang, J. Gao, C. Lee. High-resolution Chiral Separation Using
Microfluidics-based Membrane Chromatography. Journal of Chromatography, 942,
115-122, 2001.
75
41
X. Wang, C. Saridara, S. Mitra. Microfluidic Supported Liquid Membrane
Extraction. Analytical Chimica Acta, 543, 92-98, 2005.
42
B. Chueh, S. Takayama. Leakage-Free Bonding of Porous Membranes into
Layered Microfluidic Array Systems. Analytical Chemistry, 79, 3504, 2007. 43
J. Jong, B. ankone, R. Lammertink, M. Wessling. New Replication Technique for
the Fabrication of Thin Polymeric Microfluidic Devices with Tunable Porosity. Lab
Chip, 5, 1240-1247, 2005.
44
T. Kuo, D. Cannon, Y. Chen, J. Tulock, M. Shannon, J. Sweedler, P. Bohn.
Gateable Nanofluidic Interconnects for Multilayered Microfluidic Separation Systems.
Analytical Chemistry, 75, 1861-1867, 2003.
45
Pall Life Sciences Corporation. Vivid Plasma Separation Membrane Date Sheet.
<http://www.pall.com/pdfs/OEM-Materials-and-Devices/09.2730_VividPlasma_DS_
6pg.pdf>
46
H. Darcy. Les Fontaines Publiques de la Ville de Dijon. Dalmont, Paris.
47
Houghton Mifflin Company. Capillary Action.
<http://www.thefreedictionary.com/Capillary+force>
48
E. Oosterbroek, A. Berg. Lab-on-a-chip: Miniaturized Systems for (Bio)Chemical
analysis and synthesis. Elsevier Science, second edition. 49
C. Chin, V. Linder, S. Sia. Lab-on-a-Chip Devices for Global Health: Past Studies
and Future Opportunities. Lab Chip, 7, 41-57, 2007.
50
D. Figeys, D. Pinto. Lab-on-a-Chip: A Revolution in Biological and Medical
Sciences. Analytical Chemistry, 330-335, 2000.
51
I. Graz, S. Lacour. Complementary Organic Thin Film Transistor Circuits
4Fabricated Directly on Silicone Substrates. Organic Electronics, 11, 1815-1820,
2010.