ministry enviro-, branch...coastal area.s near the discharge end of the groundwater flow systems,...
TRANSCRIPT
p Province of Brit j .sh Colunibia
Minis t ry of t h e Enviro-, wit
Water Inirest igat ions Branch
A REVIEW OF GROUNDWTER
CONDITIONS ON GABRIOLA JSLAND
W. S . Hodge Technician .
Groundwater Sec t ion Hydro1 ogy Division
Vic to r i a , B . C . August- :L978

TABLE OF COKTENTS .-
Page
ii
- TABLE OF COhTEhTS . ., . . .. .'. . . . . , , .. , . , , . . . , , . , . , . , , , . , , . , . LIST OF FIGURES .......................................... iii
LIST OF TABLES . , . . . . + . . . , , . . , , , , , , ? , . , . . l . . . . . . . . * . , , ... , iii 1. INTRODUCTION ............................................ . 1
2 . 3 LOCATION, AREAL EXTENT AND CLIMATE . , ,'. ,. ,', . . , ,. . . . , . , , . . 3. TOPOGRAPHY AND DRAINAGE . , . . . . . . . . . . . . . . . . :. . . 9 . . . - - v t e 3
..
4. SURFICIAL DEPOSITS ................................. . . . .., 4
5 . BEDROCK GEOLOGY . . . . . . . . . . . . . . . l . , . . . . . . . . . , ~ , . ~ , . . . . . . . , . 4
4 6. BEDROCK STRATIGRAPHY ..........r.r,.r...rrrr.rr....rlr.(......~~,~.
6 . 1 Gabriola Formation . . . . . . . . . . . . . . . . , . . . . . + . . , , . . ,. . 5 5 6.2 Spray Formation ...................... .....,,........
6.3 Geoffrey Formation . , . , , . . . .. . . . . . . . . . . . . . . . . . . . . . . . . 5 6.4 Northumberland Formation . , . . . . , l . . . . . . . . . . . . . . , . . , . . 5
6 WATERSHE9 EGICINS , . > . . ,, , ., . , . . . . . . . , , , . . , , - . . , . , * . . , , . . ,
7.1 Sands Region ........................................ 8 7 . 2 Lock Bay Region ........................................ 11 7.3 Desca~lso Bay Region ............................... 13 7.4 Gabriola Region .......................... ,..,..,.... 15 7.5 S i l v a Bay Region .................................... 1 7 7.6 North Degnen Bay Region . . . , . , , . . l . . . . . . . . . . . , . . . . . , . 18 7.7 West Degnen Bay Region .............................. 19 7.8 20
22 7.10 Northumberlad Channel Region . . , , . , . . , . . , , . . . . . !, . , . 23 7.11 South Descanso Bay Region ........................... 24
7.
Fa lse Narrows Regions , . , ... . . . . . . . . . . !. ,. , , . . . . . , .. . 7.9 .Ho.gga~ Lake Regi.on . . , . , . , , . . , . . . , . , . , , , . , . . * . . . * . . , ,
8 . GROUNDWATER QUALITY , . ,, , .. . . ,. , , . , , . ,, . .. , .. . , , ,. , . .. , ,. 25
9. OBSERVATION WELLS ........................................... 26
9 . 1 0bserva.tion Well 7.2-1. .. . ... . , , , . . . I , .. , , , .. , .. ,. . ,. 27 9.2 28 9.3 0bserva.tion We11 7:2-3 ... ... ,. ....,.. ,.. ,....,,.. ... 25 9.4 Observation Well 72-4 ............................... 29 9.5 Observation Well 72-5 ..... q . . . . . . . . . . . . . . l , . . , . . . . . 30
Observation Well 712-2 . ., .. .,.., .. , . . , , , , , .!. ,, . . . . . ,
11. RECOMMENDATIONS . . + . , . , . . . . , . , . . . . , . . . . . . . . . . . . . - . 32
33 1 2 . REFERENCES ...............................................
ii
~ . . .. . . . . . . ..

LIS-r CF FIGIJRES
Page ---
Figure 1 - Watershed reg ion map ........................... 35
Figure 2 - Legal l oca t ion map ............................. 36
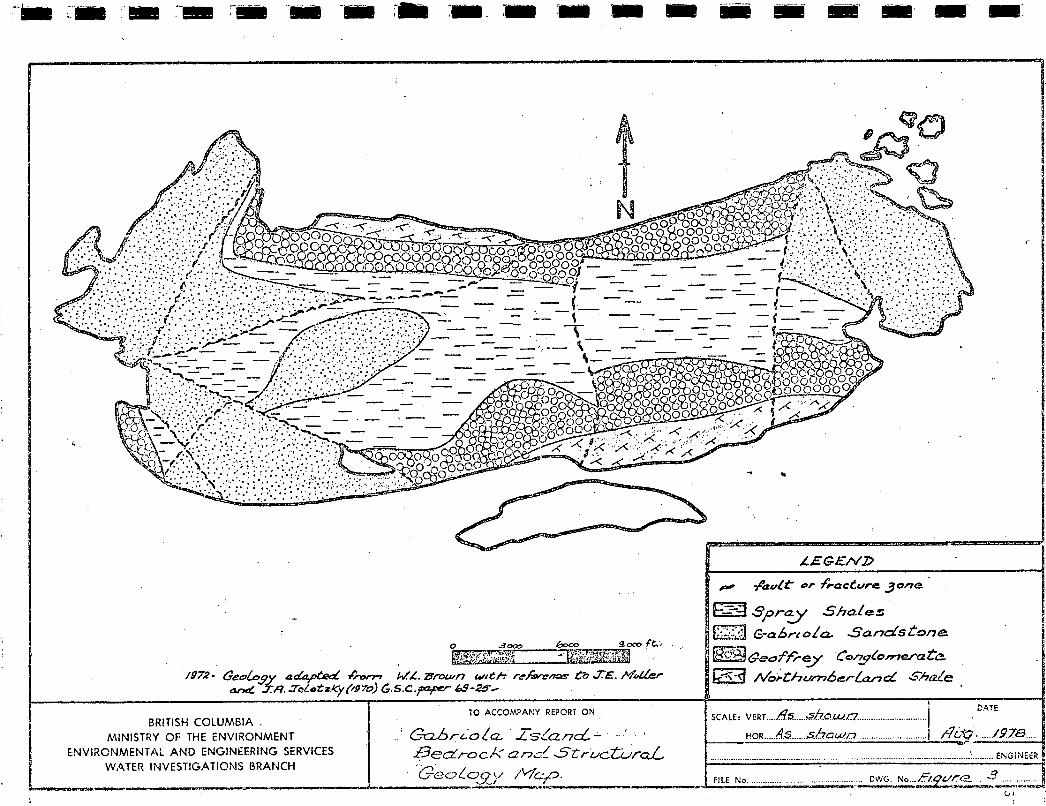
Figure 3 - Bedrock and s t r u c t u r a l geology map ............. 37
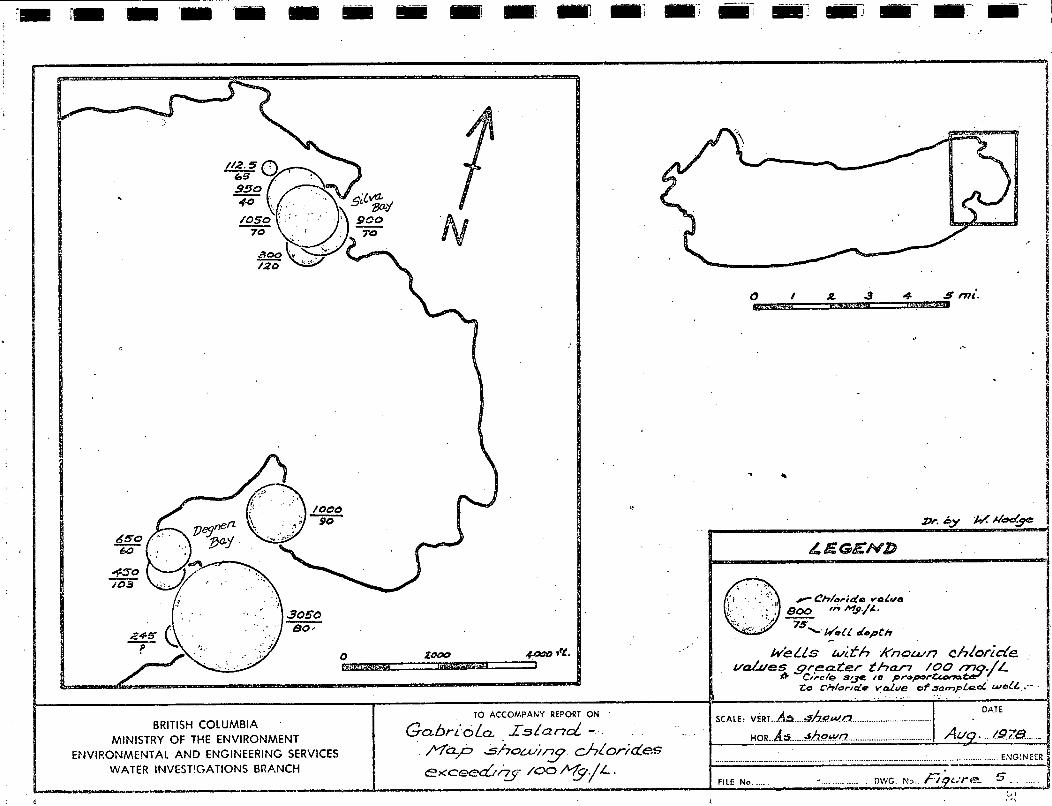
Figure 5 - Map showing ch lo r ides exceeding 100 Mg/L ....... 39
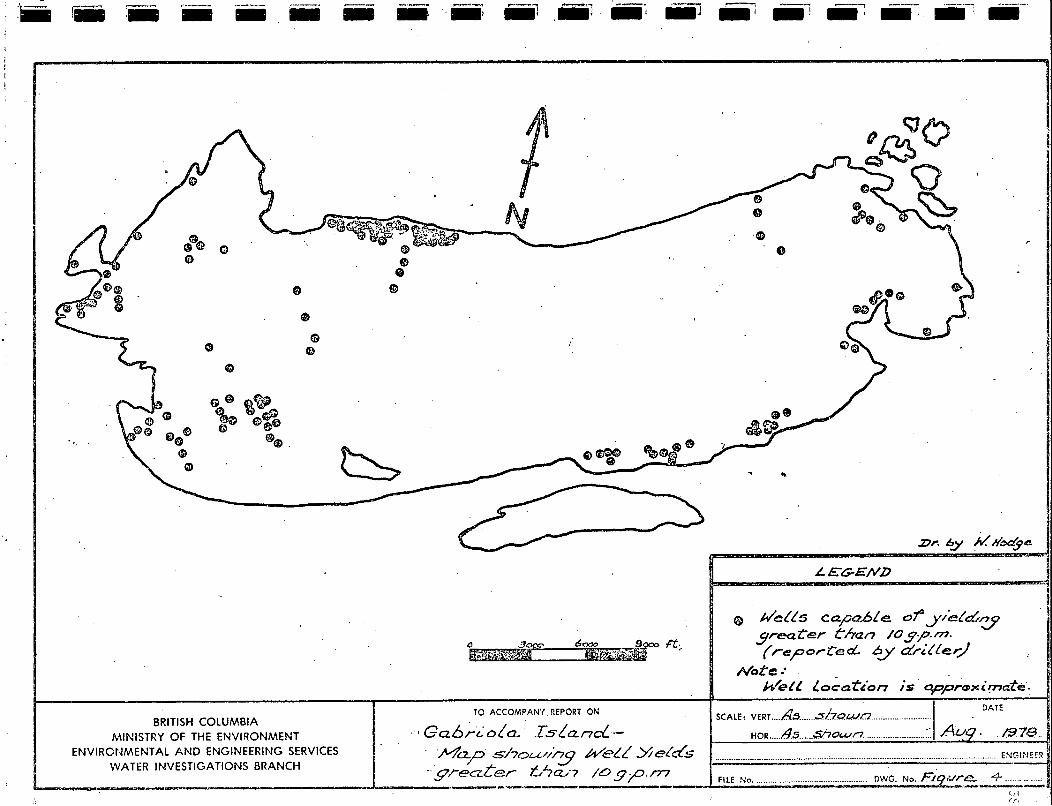
Figure 4 - Map showing well y i e l d s g r e a t e r than 10 gpm .,,. 38
Figure 6 - Map showing ch lo r ides exceeding 140 Mg/L ....... 40
Figure 7 - Water q u a l i t y comparison i n observat ion wells . . 41
Figure 8 - T.D.S. - depth r e l a t i o n s h i p i n bedrock wells ,.. 42
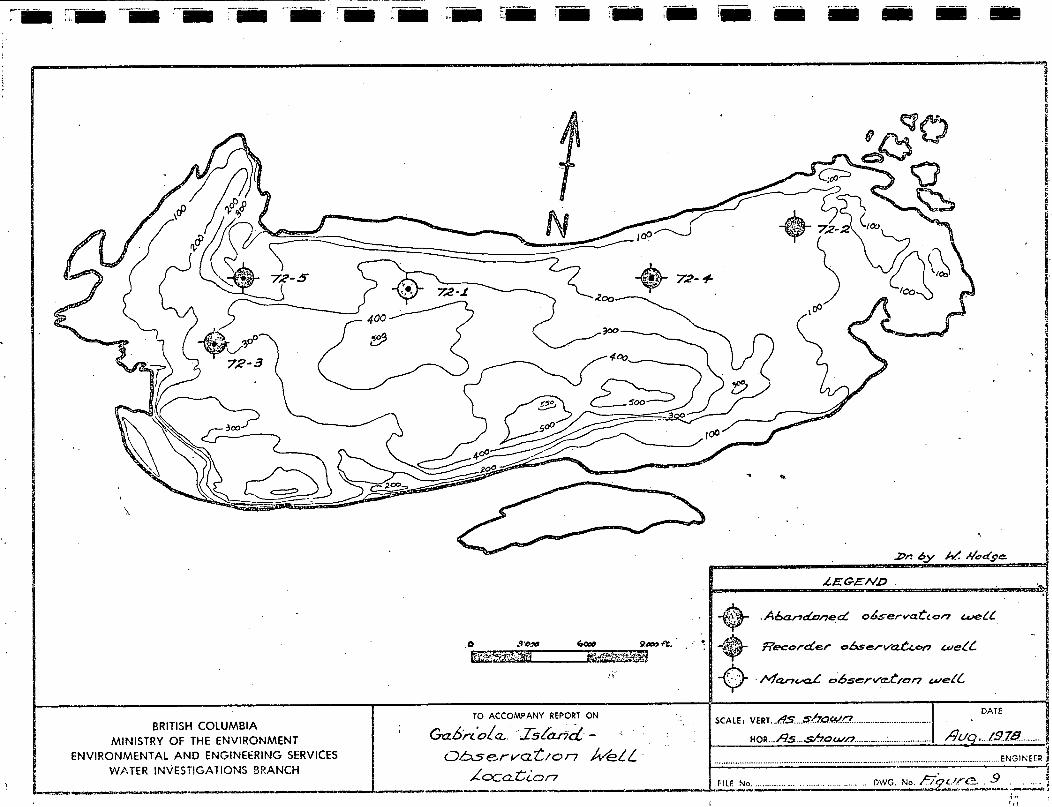
Figure 9 - Observation wcll l oca t ions ..................... 4 3
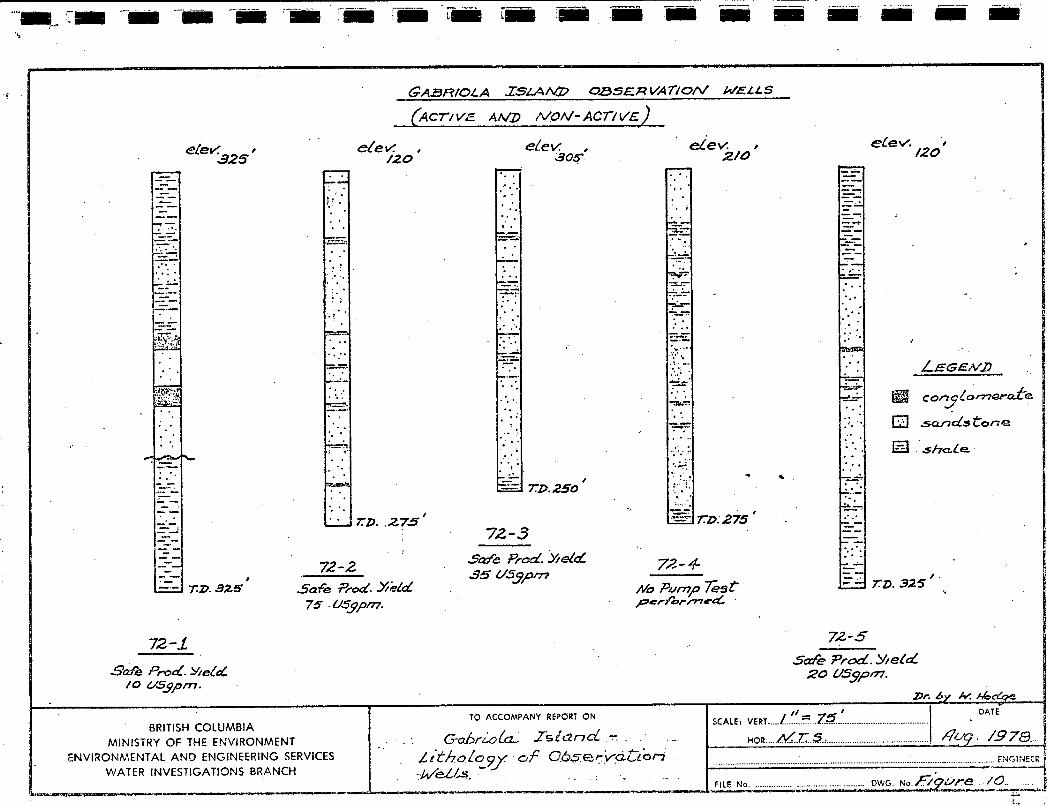
Figure 10 - Lithology of observat ion wells ................. 44
Figure 11 - Hydrographs ?:repared from observa t ion well records ........................................ 45
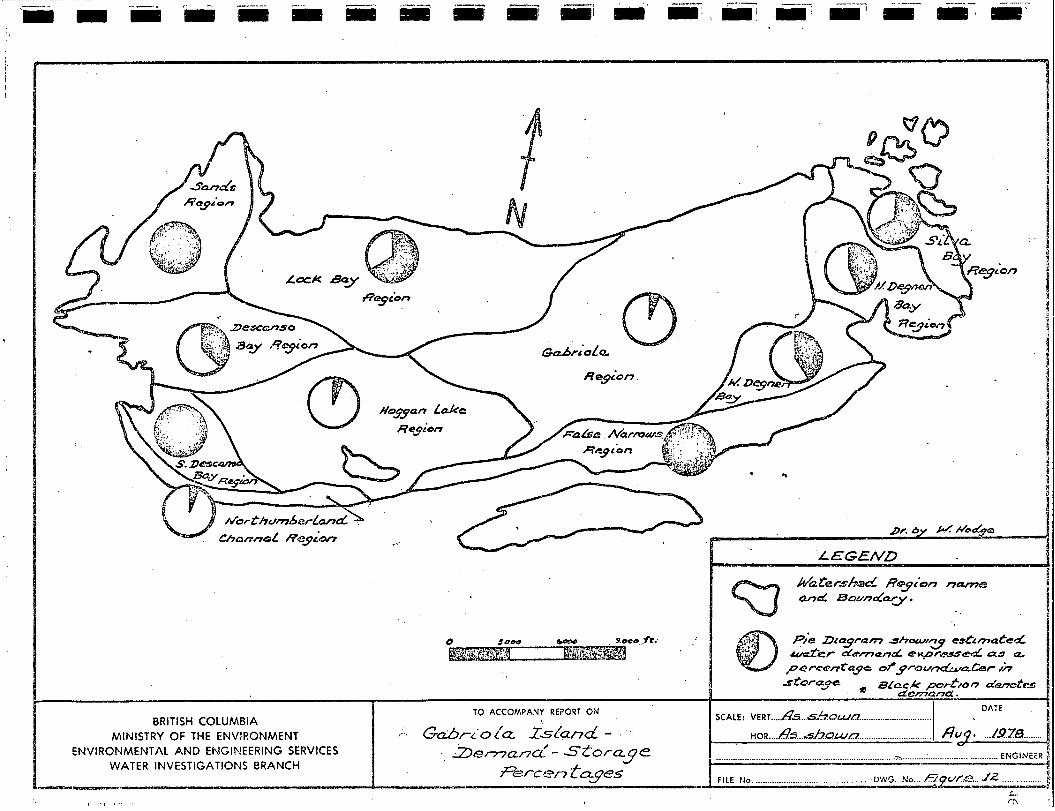
Figure 1 2 - Demand-storage percentages ..................... 46
LIST OF TABLES
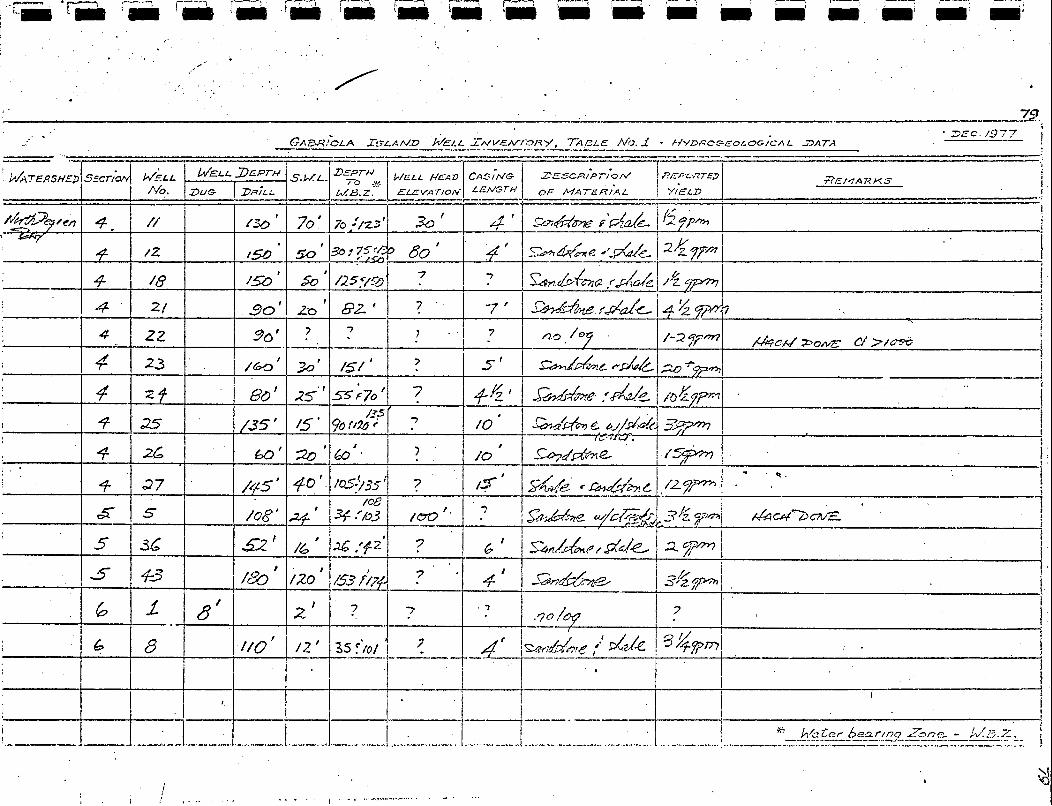
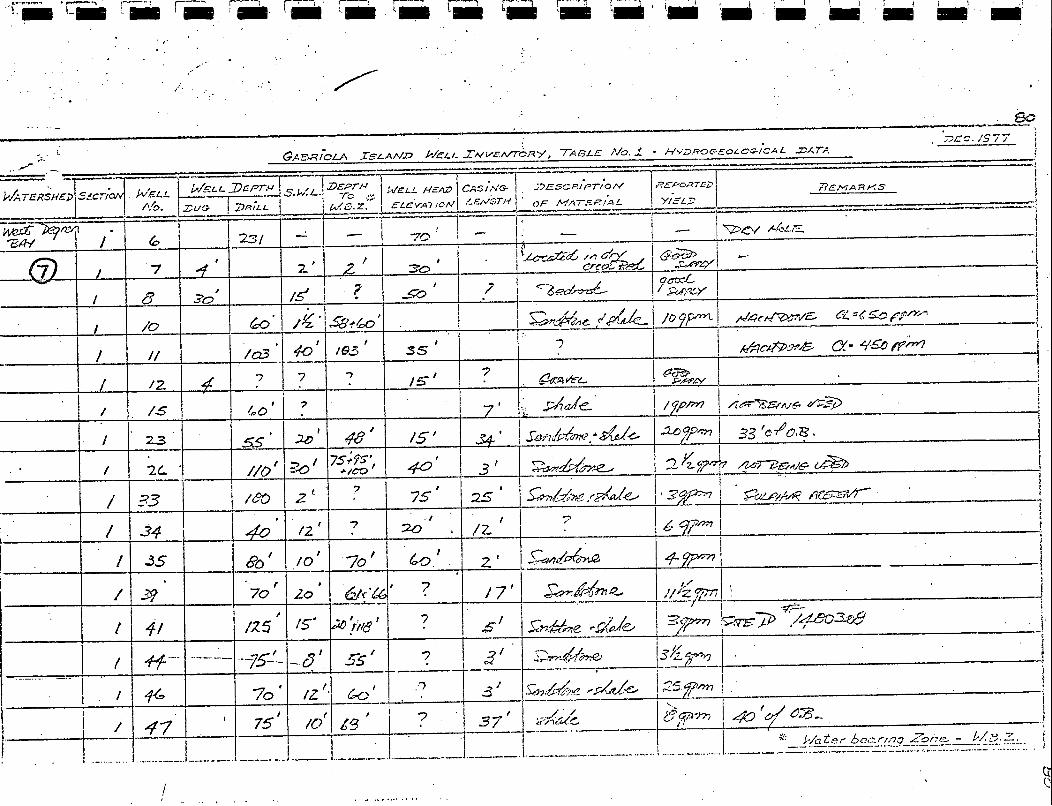
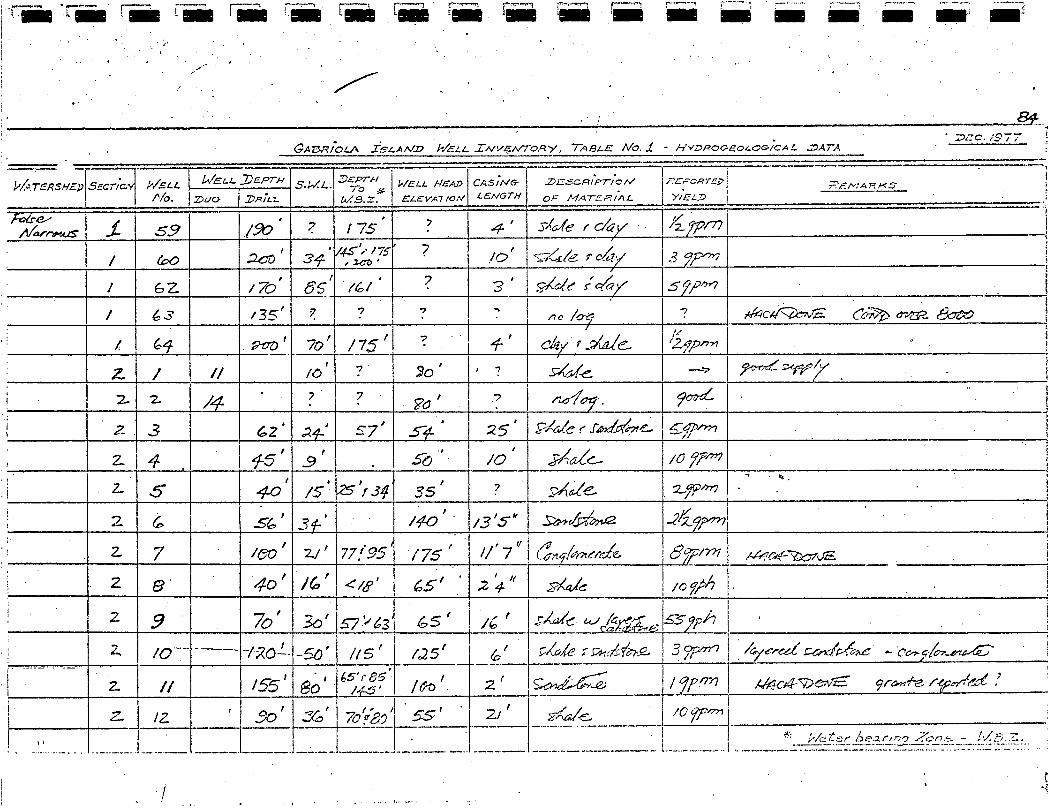
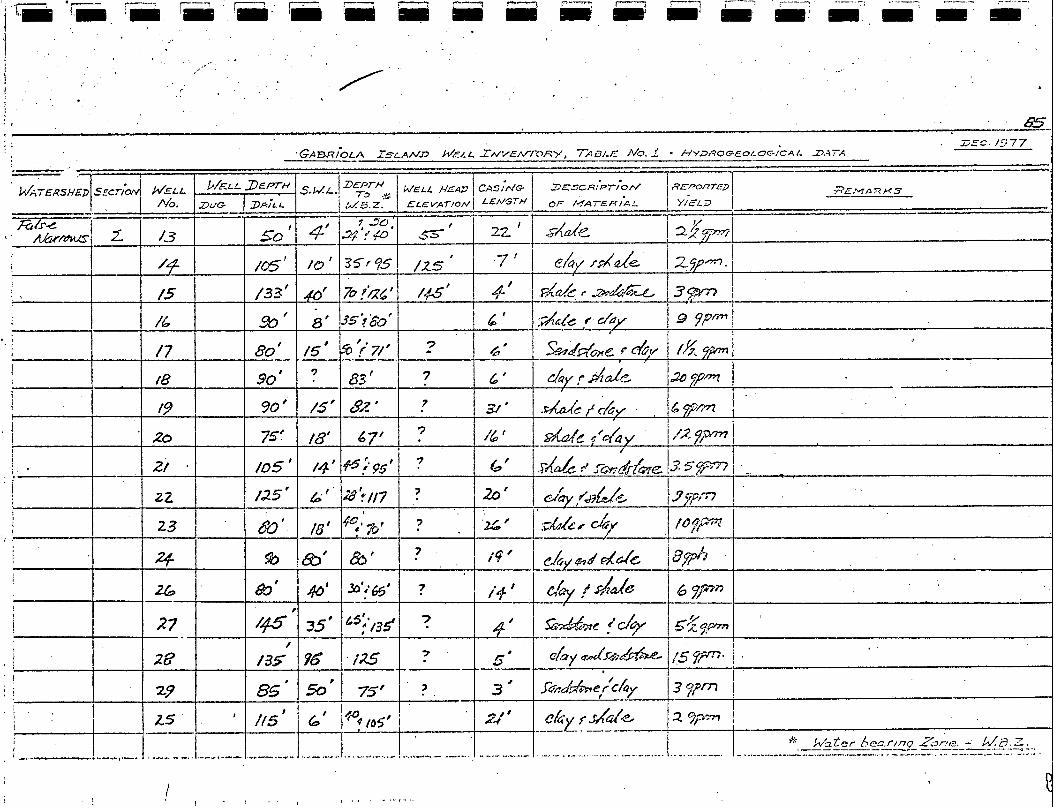
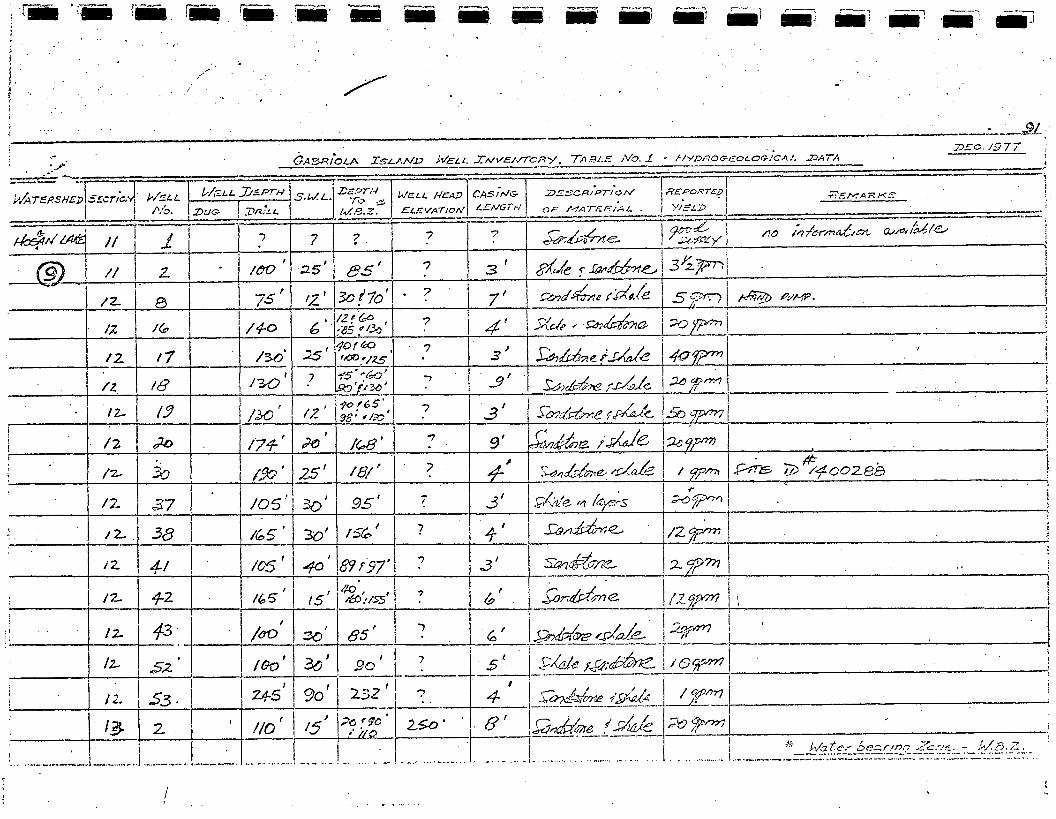
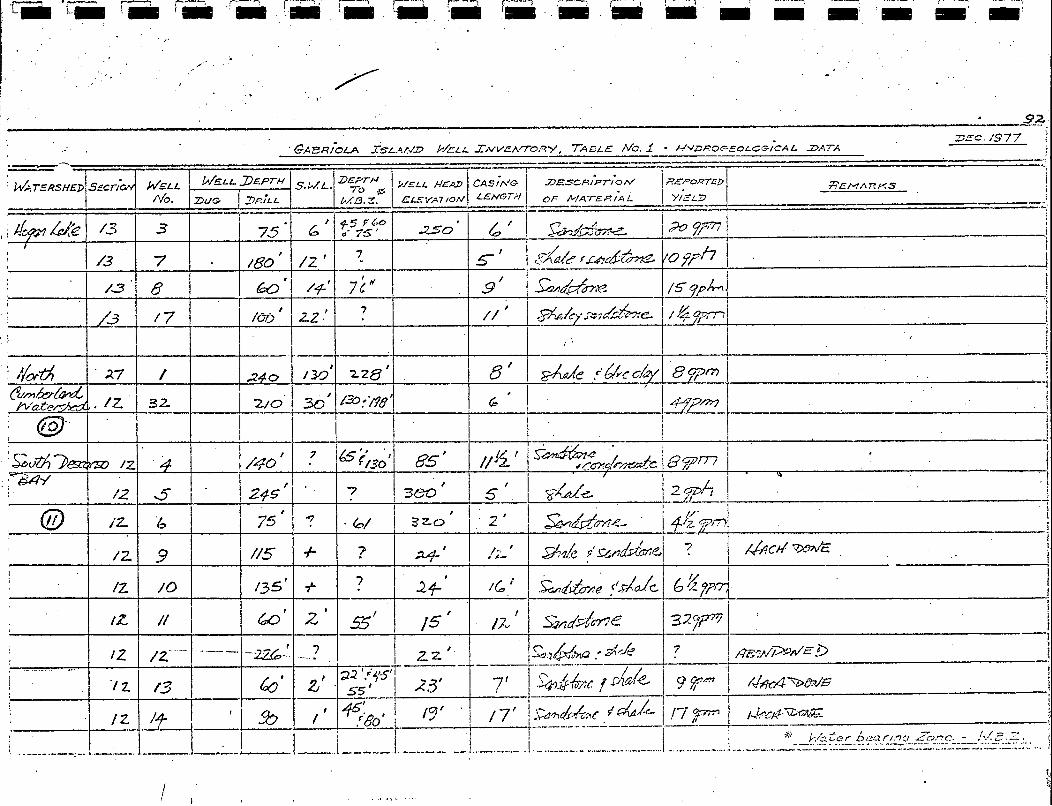
Table 1 - Gabriola I s l m d wel l inventory - hydrogeological da ta ............................................. 47
Table 2 - Quan t i t a t ive es t imates o f p re sen t groundwater use 95 versus avail : ,ble s to rage .........................
iii
. . __... ..... . . . -. -- .~

C O N D I T l O N S ON GABRIOLA I S L A N D --
1. I N T R O D U C T I O N
The Groundwater S e c t j on o f t h e Water In \ -es t iga t ions Branch, Minis t ry
o f t h e Environment, has been involved i n groundwater s t u d i e s on Gabriola Is land
s i n c e t h e sumier o f 1971. This jnvolvement h a s included t h e r e t a i n i n g o f
Robinson, Roberts , and Brown Ltd. , a groundwater consul t ing firm o f Vancouver,
t o conduct a d r i l l i n g program during t h e sumner of 1972, f o r t h e purpose of
ob ta in ing information on t h e groundwater geology and hydrology of Gabriola
I s l and . The r e s u l t s and subsequent conclusions on t h e hydrogeology of t h e
I s l and , der ived from t h i s d r i l l i n g program, 'nave been r e f e r r e d t o i n pa r t
throughout. t h i s t e x t .
Addit ional i n v e s t i g a t i o n s , inc luding some "door-to-door surveys" t o
ob ta in l o c a l groundwater information, have been conducted by t h e Groundwcter
staff during 1973 and 1974. From 1975 t o p re sen t , i nves t iga t ions have been
l imi t ed t o the c o l l e c t i o n o f water l e v e l da t a and niaintenance of two water
l eve l recordcrs i n s t a l l e d on wel l s constructed during the 1972 d r i l l i n g
program, occasional watcr w e l l sampling, well l oca t ion work by sununer s t a f f
and c o l l e c t i o n of d r i l l l o g da t a on a cont inuing once p e r yea r b a s i s .
The ob jec t ives o f t h i s p re sen ta t ion a r e as fol lows:

I.__
2
(1) t o compile and summarize a l l hydrogeological and hydrochen?ical d a t a
obtained t o date f o r p re sen ta t ion i n t o a format f o r f u t u r e re ference ;
(2) t o examine a l l groundwater information ava i l ab le and make q u a n t i t a t i v e
es t imates on groundwater usage versus groundwater i n s to rage f o r each
groundwater reg ion; and
(3) review and d i scuss water q u a l i t y and d e l i n e a t e problem a reas .
r
A t o t a l of 850 records o f wells d r i l l e d up t o October 1977 have been
reviewed. Of t h i s t o t a l , 746 well records have been summarized and t abu la t ed
(Table 1 ) . The remaining 106 records are o f wells d r i l l e d during 1977 and
t h e s e have not y e t been accura te ly loca ted i n t h e f i c l d . S i t e desc r ip t ions
given by d r i l l e r s have, however, allowed t h e w r i t e r t o roughly p l o t 8. l a rge
percentage of t h e s e we l .1~ on maps, thereby obta in ing a reasonable idea where
arid a t ishat r a t e grounclicater devclapmei;t is tak ing p l ace .
A map has been prepared showing Gabriola I s l a n d divided i n t o 11
watershed regions (Figure 1 ) .
each region has been included i n t h i s r e p o r t .
s e c t i o n s , and l o c a l p l ace namcs has been prepared (Figure 2 ) . A map has been p re -
pared showing the b a s i c c h a r a c t e r i s t i c s o f t h e bedrock geology o f Gabriola
I s l and (Figure 3 ) .
10 ga l lons p e r minute as r a t e d by the loca l d r i l l e r s (Figure 4) . Rating of t h e
wel l y i e l d i s gene ra l ly done by conducting a b a i l t e s t on t h e well . Bai l ing
time o r number of b a i l s removed i s rccorded i n r e l a t i o n t o t o t a l drawdown o f
water l e v e l .
y i e l d of each w e l l .
A d c t a i l e d d iscuss ion on t h e hydrogeology of
A l oca t ion map showing l e g a l
Maps have ,a l so been prepared showing well y i e l d s exceeding
This method gives t h e d r i l l e r a rough idea of t h e product ive
Maps showing we l l s sampled w i t h ch lo r ide va lues exceeding
3
100 mg/L have been prepared (Figures 5 , 6 ) . A Schoe l l e r p l o t h‘as been pre-
pared comparing the water q u a l i t y i n two observa t ion wel l s (Figure 7 ) .
p l o t of t o t a l d i sso lved s o l i d s versus t o t a l depth of wel l has been prepzred
t o see i f a depth-T.D.S. r e l a t i o n s h i p ex is t s (Figure 8 ) . b!aps have been pre-
pared showing t h e loca t ion and l i t ho logy of t h e f i v e obscrvat ion wells ( a c t i v e
and non-active) on Gabriola I s l and (Figures 9 , l o ) , as well as water l e v e l
p l o t s f o r observa t ion wel l s 72-1 and 72-4 (Figure 11). These observa t ion wel l s
have becn discussed i n d e t a i l i n t h i s r e p o r t . Estimated groundwater usage
A
versus a v a i l a b l e groundwater i n s to rage has been ca l cu la t ed (Table 2) with
r e l a t i o n s h i p s shown diagrammatically i n Figure 1 2 .
2 . LOCATION, AREAL EXTENT AND CLIMATE -_
Gabriola I s land i s approximately 13,000 acres i n s i z e and i s loca ted
east of Nanaimo.
Nanaimo and has a permanent populat ion of around 1,150 people (Oswald, 1978).
V i s i t o r s and par t - t ime r e s iden t s C ~ T I i nc rease t h i s number t o t h r e e L i m e s t h e
permanent populat ion during t h e summer months.
I t i s reached by a 20-minute scheduled f e r r y r i d e from
The i s land i s charac te r ized by a cool maritime cl imate with r e l a t i v e l y
warm, wet win ters and cool , dry summers. The average annual p r e c i p i t a t i o n
over t h e las t t e n years has been determined as 34 inches (B.C. Minis t ry o f
Agr icu l ture , 1977) .
3 . TOPOGRAPHY AND DRAINAGE
A s t h e s o i l cover of Gabriola I s l and averages l e s s than 6 fee t , t he
topcgraphy genera l ly ref lects the underlying bedrock s t r u c t u r e .
s u r f a c e i s genera l ly h i g h e r along t!ie southwest coas t a l r e g i o n and s lopes i n
The land

4
a nor theas t e r ly d i r e c t i o x . Tine h ighes t e l eva t ion on Gabriola I s l and i s
s l i g h t l y above 550 f e e t .
4. SURFICIAJ; DEPOSI'TS
The average depth o f overburden on Gabriola I s land i s genera l ly l e s s
than 6 f e e t .
p r a c t i c a l l y nonexis tent OK Gabriola I s l and .
S u r f i c i a l depos i t s o f s i g n i f i c a n t th ickness o r ex ten t are
Tile 1 s land is gcne ra l ly free
of g l a c i a l deb r i s , except i n some v a l l e y s where meltwater sediments have
been depos i ted . Coarse grawel and boulder depos i t s reaching th icknesses up
t o 55 feet have been deposi ted n e a r t h e sou theas t coas t of t he I s l and , west
o f Degnen Bay.
t o t h i s s p e c i f i c area.
have been completed i n t h i s m a t e r i a l .
depos i t s t o be gene ra l ly dry and wel l -drained.
S u r f i c i a l depos i t s of any s i g n i f i c a n t th ickness appear l imi t ed
A few shallow, moderately producing domestic wells
Well log d a t a has shown these grave l
5 . - BEDROCK GEOLOGY
Gabriola I s l and i s comprised o f sedinleritary rocks belonging t o t h e
Upper Cretaceous Nanaino Croup (Muller and J e l e t z k y , 1970) . and fol lowing t h e P le i s tocene , coupled with constant weathering, have foimed
t h e p re sen t topography.
interbedded sandstones and interbedded sha le s and congl , ,merates .
Erosion during
The p r i n c i p a l bedrock types of Gabriola 1s land a r e
6 . BEDROCK STRATIGRAPHY
Four s t r a t i g r a p h i c rock formations outcrop on Gabriola I s l and (Figure 5) . Addit ional , more d e t a i l e d s t r a t i g r a p h i c d iscuss ions have been made by Muller
and Je l e t zky (1970). Accordj.ng t o Muller and Je t e l zky (1970), th ree o f t h e s e

5
format ions a r e predominantly interbedded sancls tones and two a re predominantly
interbedded shales'. These f~-~r i i~a t i 011s and t h e j 3' psedominarit l i t ho logy are
l i s t e d below:
Formation - Predominant L i tho I. ogy
Gabriola sands tone S p ray s h a l e Geoffrey sandstone Northurnbe r 1 and s h a l e ~
A very b r i e f descr ipt i -on on the l i t ho logy of each foi-~nati.on from
Muller and Je l e t zky (197.0) fts as fo l lows:
6 .1 Gabriola Format.ion
The Gabriola Formation i s predominantly sandstone with some conglomcrate
lenses occurr ing l o c a l l y . The lack of ex tens ive conglomerate i s a d i s t i n c t i v e
f e a t u r e o f t h i s formati-on.
6 .2 Spray Formatior,
The lower p a r t o f t he Spray Formation c o n s i s t s l a r g e l y of s i l t s t o n e -
sha le sequences wi.th t h i n l y graded beds. Shale i s more predominant i n t h e
upper p a r t and ind iv idua l s h a l e beds a r e seve ra l fee t t h i c k , s epa ra t ed by
t h i n bottom l aye r s o f s i l t s t o n e .
6 . 3 Geoffrey Fornation
The Geoffrey Fonnation is mainly composed of sandstone and coarse
conglomerates. Cross bedding and sha le b recc ia s arc: exhibited i n t h i s forma-
t i o n and cavernous t o honeycomb weathering f e a t u r e s can be seen along t h e
c o a s t l i n e .
6 . 4 Northumberland Formation
The upper p a r t of t h e Northumberland Formation i s comprised mainly of
sha le s while t h e lower beds o f t h e Northumberland are rep laced by sandstone
6
and coarse congloinerate. This information can be seen exposed no r theas t o f
Northumberland Channel on t h e south coas t o f Gabriola Isla'nd. A t False
Narrows, between Mudge and Gabriola I s l ands s h a l e s a r e estirnated t o reach a
th ickness of 1,000 f e e t (Muller and J e l e t s k y , 1970).
7. WATERSHED REGIONS
Gabriola I s l and has been divided f o r convenience i n t o I 1 watershed
regions (Figure 1 ) . Boundaries between t h e s e reg ions gene ra l ly r ep resen t t h e
topographic d iv ides between n a t u r a l drainage bas ins .
from maps of 1" = 1,320' with contour i n t e r v a l s of 25 f e e t . They were subse-
0
Watersheds were drawn ?
quent ly reduced t o the scale shown i n Figure 1.
Maps showing pre l iminary groundwater regions have previous ly been pre-
pared (Brown and Erdnian, 1975) and a r e based p r i n c i p a l l y on the r e s u l t s and
subsequent conclusjons der ived during t h e 1972 d r i l l i n g program by Robinson,
Roberts and Brown.
def ined by topagraphy, bedrock i i t ho logy arid f a u l t a i ~ d I r a c i u r e systems on
t h e I s land , a more s impl i f i ed d i v i s i o n , a watcrshed region based p r imar i ly on
topography, has been adopted f o r t h i s r e p o r t .
Although seve ra l groundwater reg ions have previous ly been
The l a r g e s t watershed region i s t h e Gabriola region (Figure 1) ccvering
approxi.mat.ely 3,149 acres.
An esti.mate of t h e annual groundwater u s e i n each region (Table 2) was
made based on t h e number o f wells i n each region, u t i l i z i n g a demand f i g u r e of
500 ga l lons p e r day f o r each w e l l over a per iod of 100 days of l i t t l e o r no
recharge.
ab le i n s to rage f o r use on an annual. b a s i s over t h e same 100-day no recharge
per iod .
rep len ished annual ly from prec i .p i ta t ion during t h e win ter months.
recharge from p r e c i p i t a t i o n (Fowera.ker, 1974) ' was ca lcu la t ed f o r Mayne I s l and
on t h e b a s i s of 1 inch p c r y e a r . However, Faweraker found t h a t his c3.3.culations
These f i g u r e s were then compared t o t h e ' probable groundwater a v a i l -
Under n a t u r a l recharge condi t ions t h i s q u a n t i t y o f water would be
Pote i i t i a l
exceeded by 2% times the esti inatcd s torage ava i l ab le f o r groundwater wi th in the

7
f ractured. bedrock m e d i a . This l ed him t o be l i eve t h a t on an annual b a s k s to rage
and peneabj.1.it.y and - no t p r e c i p i t a t i o n , appear a s t h e more immediate 1.imiting
f a c t o r s c o n t r o l l i n g groundwatcr a v a i l a b i l i t y on t h e I s l ands , par t icu lar1 .y d u r i q
the d ry summer and f a l l per iods .
--
Recharge t o t h e groundwater regime from s e p t i c f i e l d d i sposa l systems
has no t been acccunted f o r , i n t h e recharge ca l cu la t ions o f t h i s r e p o r t .
groundwater recharge gene ra l ly t akes p l ace i n typographica l ly h igher areas o f
t h e watersheds. Since most r e s i d e n t i a l development i s concentrated along
c o a s t a l area.s nea r t h e d ischarge end o f t he groundwater flow systems, ground-
water recharge from s e p t i c f i e l d s i s no t consi.dered t o be a s i g n i f i c a n t c o n t r i -
bu t ion regi-onal ly .
expected t o discharge (seepage) i n t o t h e sea, o r be l o s t through evaporat ion
and t r a n s p i r a t i o n .
Natural
?
_ -
Much o f t h e sep t i -c e f f l u e n t i n c o a s t a l a r eas might be
Storage c o e f f i c i e n t s o f a r t e s i a n bedrock aqu i f e r s may range from lxlO-’
t o l ~ l O - ~ (W.C. Walton, 1970).
reg ions , d i f f i c u l t i e s a r i s e i n p r e d i c t i n g changes ir. s to rage i n r e l a t i o n t o ,
and loca t ion o f f a u l t zones and dens i ty o f bedrock f r a c t u r i n g . In view o f t h i s ,
a bulk s t o r a g e c o e f f i c i e n t of l ~ l O - ~ (.01%) f,as been used i r i computing ground-
water s to rage on Gabriola. I s l a n d .
computations o f groundwater s to rage 011 Mayne I s l and (Fowerakcr, 1974) . Applica-
t i o n of t h i s f i g u r e may no t be f e a s i b l e l o c a l l y where d e t a i l e d groundwater
s t u d i e s i n a s p e c i f i c a rea have proven otherwise.
The methcd of e s t ima t ing t h e demand-storage percentage o f each region
As r e l i a b l e pump t es t d a t a i s lacking i n most
This f i g u r e has previous ly been used f o r a!.l
i n t h a t groun dw a t e r
of r e s i d e n t s us ing
dence and ngt a l l
f i g u r e s may be
somewhat high. Figures above 75% may t h e r e f o r e be considered c r i t i c a l .
Following i s an example of t h e c a l c u l a t i o n s used i n determinat ion o f t h e demand-
s t o r a g e percentage f o r t h e South Descanso Bay reg ion .
(Figure 12) was
use is based on
groundwater. S
adapted from Foweraker (1974), but d i f f e r s
t h e number of we l l s r a t h e r than t h e number
nce one well may s e r v i c e more than one res
we l l s may be used, t h e est imated demand-storage percentage

Example: -
8
(1) Area of reg ion x t o t a l thickness of rock t o = Tota l volume o f rock bottom o f po tah le water- ( ac re - f ee t ) bear ing zone
(339.20 acres ) x (assume 200 f e e t ) = (67,840 ac re - f ee t )
(2) To ta l volume o f rock x s to rage c o e f f i c i e n t = Tota l potab1.e groundwater i n s to rage ( ac re - f ee t )
(67, S40 ac re - f ee t ) x (0.0031.) t = (6.78 ac re - f ee t )
( 3 ) No. o f we l l s x d a i l y use x per iod of l i t . t l e = Estimated groundwat.er i n reg ion p e r well. o r no recharge us age - from p r e c i p i t a t i o n
(49 wel l s ) x (500 gals . /day) x (100 days) = (2,40C,000 ga l lons )
(4) -___ Estimated groundwater usage -__- x 100 Total potable groundwater . i n s to rage i n U.S. ga l lons
x 100 2,400,000 6.78 x 43,560 x 7.481
= Demand-storage percentage
= 108.6%
The demand-storage f igu res should be used with r e se rva t ion as they are based
on a s i m p l i f i e d model which may be amended when more groundwater d a t a becomes
a v a i l a b l e . The f i g u r e s do, however, i d e n t i f y problem areas where groundwater
u se may be exceeding n a t u r a l recharge.
Following i s a d e t a i l e d d iscuss ion on the hydrogeological and hydro-
chemical information obtained wi th in each watershcd reg ion .
7 .1 Sands Region
Area - 864.2 acres
No. of d r i l l e d wel l s i n region - 154
No. of dug wel l s and u t i l i z e d sp r ings i n region - 21.

0 0
0 B 0 0 0 Q II 0 II I I
n
I
9
The S&?ds Region i s a h igh ly dcveloped, popular a r e a wirh many wel l s
loca ted on l o t s varying i n s i ze between 0 . 5 and 1 a c r e along c o a s t a l areas.
The average depth o f ovcrburden overlying bedrock i n t h i s region i s
approximately 6 f e e t , while t h e average well depth and y i e l d has been deteriilinzd
as 131 f e e t and l e s s than 5 ga l lons p e r a i n u t e r e spec t ive ly .
The major i ty o f d r i l l logs on record inr t h i s region show layered sand.-
s tone and sha le seo,uences.
t h e con tac t zone between these sequences, with t h e sha le layer ing being t h e
major water-bearing ma te r i a l . Clay layer ing o f varying th ickness between bed-
rock zones i.s shown i n numerous d r i l l logs ; however, thi .s ma te r i a l i s probably
i n r e a l i t y a s o f t e r sha l e . Clay f a u l t gauge may occur i n some cases ; however,
th ickness here would no t be expected t o be s i g n i f i c a n t .
The p r i n c i p a l water-bearing formation appears t o be . -.
\!,‘ell depths Tangc f j ? G m shd!.ow dug wel l s { C t o 55 f e e t deep) t o d r i l l e d
depths of 418 f ee t .
Two good q u a l i t y wells with high y i e l d p o t e n t i a l are repor ted i n
Sec t ion 2 1 and Sec t ion 22 (Figure 2 ) .
25 and 30 gal lons p e r minute, a r e r e l a t i v e l y shal:low, and a r e loca ted consider-
ably f a r in land .
region; however, hydrogen su lphide odour i s apparent i n t h e s e deeper wells.
Both r epor t e x c e l l e n t y i e l d s of between
Greater y i e l d s have been repor ted from deeper wells i n t h i s
Although t h e peninsula between Taylor and P i l o t Bay (Figure 2 ) may be
r ece iv ing some freshwater recharge from areas in land , water sampling has shown
t h e po tab le groundwater i n s to rage i s in t ruded by sea water. The peninsula i s
a low-lying bas in a rea and l imi t ed i n catchment area, severe1.y r e s t r i c t h i g
potab le groundwater recharge.

10
The p r o b a b i l i t y of obtaining a good q u a l i t y groundwater on the
peninsula i s very un l ike ly , Althocgh some moderately y i e ld ing wel l s of
5 t o l e s s than 10 gallons. p e r mjnute a r e located on the peninsula , Hach
( f ie ld chemical) analyses have shown t h i s a r ea t o be sub jec t t o sea water
encroachment. Chloride values g r e a t e r than 2,000 ppm ( p a r t s p e r mi l l ion)
have been recorded i n sorce wel l s along the c o a s t a l f r i n g e (Figure 6 ) . A l l
d r i l l e d we l l s on record loca ted on the peninsu3z a r e completed below s e a
leve l . A l l wel ls sampled on t h e peninsula have shown evidence of sea water
encroachment, and f u r t h e r groundwater development i s no t recoinmended.
The major i ty o f wel l s loca ted along Berry Point Koad between P i l o t
Bay and Orlebar Point (Figure 2) r epor t y i e l d s of l e s s than 2 ga l lons p e r
minute, although one r ecen t ly d r i l l e d flowing a r t e s i a n w e l l [ d r i l l ed J u l y
1977) s i t e d nearby a l i ne of sp r ings south of C l a r k Bay wi th in t h e boundaries
of Sect ion 2 2 (Figure 21 , has repor ted an cxce i l en t y i e l d of 25 g p m ( ac tua l
flow i s not known) from 140 f e e t below ground l e v e l , Wells under a r t e s i a n
pressure i n t h i s area have recorded ch lor ide values a s high as 1,233 mg/L
and T.D.S. values over 1,900 mg/L.
may i n d i c a t e t h e presence of a major f r ac tu red zone i n the a rea .
This f a c t coupled with t h e spr ing a c t i v i t y
From p resen t knowledge, wel l s located in land and a t h igher e l eva t ions
Cheminsa1 a n a l y s i s has shown have shown water q u a l i t y t o be of a benign type ,
water q u a l i t y t o be a s o f t , moderately mineral ized, typc groundwater.
In sununary, s ea water encroachment is evident on both t h e peninsula
between Tayloy and P i l o t Bay, and along the to t a l . c o a s t l i v e f r i n g e bordering
t h i s groundwater region. I t can be seen (Figure 6) t h a t although s a l i n e
water i s r e s t r i c t e d t o wel l s conpleted below sea l eve l around c o a s t a l a r e a s ,
, , .-
11
s a l i n i t y va lues do not necessa r i ly inc rease with increas ing depth. S a l i n i t y .
values would, however, be expcctcd t o inc rease wi th length and time of
pumping and volume of water pumped.
wells in land from Taylor Ray, ahere rock f r a c t u r i n g may be d i r e c t l y l inked
with t h e ocean, Qual i ty of well water i n topogra1)hically h igher areas in land
should be of a benign type due t o recharge from p r e c i p i t a t i o n i n t h e s e areas.
Sea water i n t r u s i o n i s evident i n some
Y
Demand-storage percentages have been c a l c u l a t e d i n Table 2 and shown r
diagrammatically i n Figure 12,
over 150 pe rcen t ,
demand of 500 g a l l o n s p e r d a y i s requi rcd of evesy well; however, i f only
one-half of t he 175 we l l s recorded i n t h i s reg ion were u t i l i z e d a t t h i s ra te ,
a demand-storage f igure over 75 percent would s t i l l i n d i c a t e a d e f i n i t e
problem a rea .
This f i g u r e shows groundwater usage t o b e
A t p r e sen t it would be u n r e a l i s t i c t o assume a cons tan t
- 7 . 2 Lock Ray Reg&
Area - 2,188.9 ac re s
No. of d r i l l c d wells i n reg ion - 197
No. of dug wel l s and spr ings u t i l i z e d i n reg ion - 3
The average depth of oveyburdcn over ly ing bedrcck i s 10.5 f e e t and the
average depth of d r i l l e d wel l determined as 75.5 f e e t . Well depths range
from shallow dug wells t o d r i l l e d depths of 325 f n e t .
Approximately 25 percent o f * t h i s reg ion i s subdivided f o r p re sen t o r
f u t u r e development.
h igher e l eva t ions and along c o a s t a l a r cas west of Lock Bay,
Most development e x i s t s along North Road in land a t
I. i

1 2
A good major i ty o f wells d r i l l e d and recorded i n t h i s reg ion are
loca tcd rwst of Lock Bay (Figure 2) a t e l eva t ions between 25 and 7’5 fee t above
sea l eve l . Thc major i ty of t hese wells are l e s s than 100 f ee t i n depth and
r e p o r t e x c e l l e n t dones t i c y i e l d s g r e a t e r than 10 ga l lons p e r minute (Figure 4 ) .
The p r inc ipa l water-bearing formation along t h e c o a s t a l area west o f
Lock Bay i s predominantly f r ac tu red and broken sha le (Northumberland Shales ) .
The f r ac tu red and broken na tu re of t hese s h a l e s and topography surrounding
t h i s area are favourable , r e s u l t i n g i n numerous product ive wells.
i n t h i s ales are s i t u a t e d on l o t s l e s s than onerhalf acre i n s i z e and are
loca ted very c l o s e t o t h e c o a s t l i n e , Wells i n t h i s area a r e c l o s e l y spaced
and mining o r s e a water i n t r u s i o n could subsequent ly occur, p a r t i c u l a r l y i n
t h e dry summer months when water demand i s a t i t s g r e a t e s t , This p a r t i c u l a r
area, west of Lock Bay, along t h e coas t i s being a c t i v e l y developed as approx-
imately 20 new wel l s were cons t ruc ted i n t h i s s p e c i f i c area i n 1977.
8
r
Many wells
The predominant water-bearing formation in land a t h ighe r e l eva t ions
appears t o be t h e con tac t zone between sha le and sandstone sequences, The
sha le l aye r ing i s probably broken and wel l - f rac tured and thus a b l e t o s t o r e
and t ransmi t groundwater i n varying amounts. ‘The sandstone appears t o have
no s i g n i f i c a n t po ros i ty o r permeabi l i ty and appears t o be r e l a t i v e l y massive,
Comparative y i e l d s inland t o those along c o a s t a l reg ions are apparent .
Domestic y i e l d s i n t h e s e areas range from moderate t o e x c e l l e n t ; however,
depths of wells inland a r e considerably g r e a t e r i n o rde r t o i n t e r c e p t ground-
water movement through t h e f a u l t and f r a c t u r e zoncs,
Elght complete chemical ana lyses of groundwater q u a l i t y a r e a v a i l a b l e
showing water q u a l i t y inland t o b e gene ra l ly a s o f t , low t o moderately
. . .. . . . . . - - . . . .. - -

13
mincral ized groundwater. Only two complete analyses are a v a i l a b l e from well
water along c o a s t a l a r e a s a t lower e l e v a t i o n ,
l e v e l s are apparent , minera l iza t ion i s considerably g r e a t e r ,
selective wells along c o a s t a l areas a t d i f f e r e n t times of t h e year may show
evidence of sea water encroaclmcnt i n these mils
Although no high ch lo r ide
Sampling o f
There i s p re sen t ly one a c t i v e observat ion well (72-1) monitoring water I
l e v e l s within t h e boundaries of t h i s region CFigure 9). Observation well
72-5, a l s o wi th in t h e boundaries of t h i s reg ion , was abandoned i n August 1977. t
A d e t a i l e d d iscuss ion on the cons t ruc t ion and development of both wells and
2n at tempt t o analyse t h e hydrograph of Well 72-1 has been made arid presented
l a t e r i n t h i s r e p o r t .
Demand-storage percentages have been ca l cu la t ed i n Table 2 and shown
diagrammatically i n Figure 1 2 .
of a v a i l a b l e groundwater i n s torage .
T h i s f i g u r e shows groundwater u se t o be 70 percent i _I......__c_-
The low-lying c o a s t a l bas in west of Lock Bay i s very popular and has
been and i s cont inuing t o be subjec ted t o r a p i d growth.
7 . 3 Descanso Bay Region
Area - 1,420.9 ac re s
No. of d r i l l e d wells i n reg ion - 65
No. of dug wells and u t i l i z e d sp r ings i n reg ion - 5
The averagc depth o f overburden overlying bedrock i n t h i s region i s
5 f ee t , while well depths range from 8 fee t t o 537 f e e t (%he deepest produc-
t i v e water well on record on Gabriola I s land) ,
14
This region is a t p re sen t no t h ighly developed. The major i ty of wcl l s
are loca ted in lend on l o t s varying betweeri 0 .5 and 1 acre i n s i z e . The remaining
wells are loca ted along t h e c o a s t l i n e south of Taylor Bay and inland on
largeT p a r c e l s o f ].and.
Well y i e l d s are repor ted as "poor" t o as high
approximately 40 percent of the wells have beenpra ted
of 10 gpm o r grea tey . The major i ty o f t h e we l l s r a t e d r
as 40 U S . g p i n , whil e
s cap b l e of a p o t e n t i
10 gpm and g r e a t e r are
This sub- loca ted on a subdiv is ion along t h e southern po r t ion o f t he reg ion .
d i v i s i o n i s s i t u a t e d i n a l e v e l v a l l e y a r e a , about 300 f e e t above sea l eve l
and r ece ives su r face drainage from a r e a s e a s t a n d south of t h e subdivis ion.
In c o n t r a s t , many we l l s loca ted wit.hin S.E. Sec t ion 20 (Figure 2) are
low. to moderate y i e ld ing (less than 5 gpm) ,
Wells loca ted s0ut.h of Taylor Bay along the c o a s t l i n e have shown
evidence of sea water encroachment wi th ch lo r ide va lues recorded as high as
550 p a r t s p e r mi l l i on ,
Massive sandstone i s t h e predominant bedrock type i n t h i s reg ion
The ma jo r i ty of d r i l l logs show sandstone and t h i n (Gabricla Formation).
sha l e l a y e r sequences, Drill logs show both t h e sandstone and sha le t o be
very capable o f s t o r i n g and t r ansmi t t i ng groundwater. Conglomerate layer ing
i s evident i n wells along t h e south coas t and appears t o be t h e p r inc ipa l
water producer,
Four complete chemical analyses a r e on record from d r i l l e d wells i n
T h j s l imi ted information shows groundwater from shallow wells, t h i s region.
1
1s
less than 100 f e e t i n depth and completed a t e l eva t ions above sea leve l ,
t o be a s o f t , low mineral ized grour\.dwatcr.
A d i s c u s s i m on t h e d e t a i l s of wel l cons t ruc t ion and analyses of t h e
hydrograph p l o t f o r Observation Well 72-3 has been presented l a t e r i n t h i s
r e p o r t .
The demand-storage f i g u r e has been calculated a t 3 7 . 8 percent f o r
t h i s reg ion ,
exceeding groundwater i n s to rage ,
This f i g u r e suggests t h e r e i s no present danger of demand
In summary, exce l l en t domestic y i e l d s can b e expected throughout t h e
southern p o r t i o n o f t h i s reg,ion.
have been recorded nea r t h i s area. Exce l len t p o s s i b i l i t i e s f o r cons t ruc t ing
Many p o t e n t i a l wel l y i e l d s exceeding 10 gpm
a high product ive well f i e ld d e f i n i t e l y ex i s t i n t h i s region.
product ive wel l s are between 50 and 1SO f e e t i n depth a t an e l eva t ion of
between 250 and 300 f e e t a5ove sea l e v e l .
i o r a t e with well depth,
sha l e interbedding as i n some reg ions and t h e sandstone appears t o b e capable
of s t o r i n g and t r ansmi t t i ng groundwater t o provide e x c e l l e n t prcduct ive
y i e l d s from sh2llot; depths ,
The ma jo r i ty of
Water q u a l i t y does appear t o d e t e r -
Groundwater does not appear t o be r e s t r i c t e d t o t h e
7 .4 Gabriola Region
Area - 3,148.9 acres
No, of d r i l l e d wells i n r e g i o n , t. 24
No, of dug wells and u t i l i z e d sp r ings i n region 1
The average depth of overburden overlying bcdrock i s 7.5 f e e t with we11
depths ranging between 1 2 and 275 f e e t ,
16
Very l i t t l e development has occurred i n t h i s r eg ion , Most we l l s a r e ,
located on large. t r a c t s of land and a r e widely s c a t t e r e d .
The p r i n c i p a l water-bearing ma te r i a l appears t o be t h e contac t zone
between sandstone and s h a l e sequences; h.owever, many moderately product ive
we l l s have been repor ted t o be d r i l l e d i n the sandstone.
Well y i e l d s range between 0.6 U,S.gpm t o 75 U,S.gpm Cobservation well
72-2 - t h e h ighes t s a f e p roduc t ive .po ten t i a1 y i e l d on record on Gabriola
I s l a n d ) , _--
The few f i e l d chemical t e s t s and complete ana lyses a v a i l a b l e show
groundwater t o be so f t , low i n minera l iza t ion i n shal low wells inland, and
s o f t , moderately high i n minera l iza t ion from deeper wells at lower e l eva t ion .
Water q u a l i t y appears t o d e t e r i o r a t e s l i g h t l y with increased wel l depth,
Discussions on t h e d e t a i l s of wel l cons t ruc t ion and development for
observat ion we l l s 72-2 and 72-4 have been presented l a t e r i n t h i s r e p o r t .
An at tempt t o analyse t h e hydrograph p l o t CFigure 11) has a l s o been made f o r
observat ion w e l l 72-4.
A ca lcu la t ed demand-storage f i g u r e of 5.8 percent (_assuming sa tu ra t e6
depth of 200 f e e t ) i n d i c a t e s t h e r e i s no p resen t danger of groundwater with-
drawal exceeding groundwater i n s to rage ,
In,summary, a d e f i n i t e p o t e n t i a l for d r i l l i n g and developing good
q u a l i t y , h igh y i e ld ing produc.tion w e l l s e x i s t s wi th in t h i s region,

i !I '1 I.
i ;I
17
7.5 S i l v a Bay Region
'Area - 563.0 acres
No, of d r i l l e d we l l s i n region - 4.8
No, of dug we l l s and u t i l i z e d sp r ings i n reg ion - 3
Most development i n t h i s reg ion is centered around S i l v a Bay, no r th
of Whitney Road on l o t s between 0.5 and 1 ac re i n s i z e , 8
The average depth of overburden overlying bedrock is _ - 3 f e e t with well.
depths ranging between 9 f e e t and ZOO f e e t .
have been repor ted from wel l s l e s s than 100 f e e t i n depth ,
Many exce l l en t p o t e n t i a l y i e l d s
: Well y i e l d s range between 0.25 ga l lon per minute and 26 ga l lons p e r
minute, with t h e ma jo r i ty of y i e l d s repor ted as 5 ga l lons p e r minute o r less
near c o a s t a l a r eas .
The p r i n c i p a l water-bearing formation i s sandstone (Gab-siola Formation).
D r i l l logs do not show t h e presence of f r a c t u r e zones and it can only be
assumed they are p resen t where moderate t o high y i e l d p o t e n t i a l wells are
encountered.
t h i s contac t zone being the major producing zone.
A few d r i l l logs show sha le layer ing between sandstone with
A s i g n i f i c a n t number of f i e l d chemical analyses have been performed
on wells i n t h e S i l v a Bay area.
of s ea water encroachment where ch lo r ide values a s high as 1,050 ppm have
been recorded from shallow d r i l l e d wel l s LFigure 5) .
These analyses have shown d e f i n i t e evidence
The major i ty of wel ls i n t h e S i l v a Bay region a r e completed below sea
leve 1.

18
Chemical a n a l y s i s has s h o w watcr q u a l i t y inland t o be b a s i c a l l y
s o f t , moderately mineral ized groundwater with no evidence o f s ea water
i n t r u s i o n a t p re sen t . -
A demand-storage f i g u r e o f 68.1 percent suggests s e r ious cons idera t ion
should be given t o monitoring f u t u r e groundwater development i n the a rea
surrounding S i l v a Bay.
c o a s t a l a r e a s ,
y i e ld ing wells inland i n t h i s region,
Sea water encroachment is a l ready a problem along d
There is p o t e n t i a l fo r cons t ruc t ion o f moderate -to high r
Well depths between 100 and 150 f e e t
s.hould r e s u l t I n y i e ld ing good q u a l i t y groundwater.
7.6 North Degnen Bay Region
Area - 553.2 ac re s
. No. of d r i l l e d wells i n region 2 30
2 .
No, o f dug wel l s and u t i l i z e d sp r ings i n region - Most development i n t h i s region i s centered around Degnen Bay,
The average depth of overburden overlying bedrock is 3 f e e t with w e l l
depths ranging from 8 f e e t t o 202 f e e t . Most d r i l l e d we l l s around Degnen. I
Bay a r e completed below sea. l eve l .
p r e s e n t l y a v a i l a b l e f o r t h i . s region,
Very few water q u a l i t y analyses a r e
One' well loca ted i n t h e east Degnen
Bay a r e a has, however, a repor ted ch lo r ide value of "grea te r than'' 1,GOO ppm,
which may suggest t he poss j .b i l i ty of s ea water encroachment i n some wells
along t h e coas t l i n e e
Excel len t domestic y i e l d s have been repor ted along t h e Degnen Bay
coas t l i ne ; however, water q u a l i t y may not be acceptable because of high
ch lor ide l e v e l s recorded i n some wells i n th'is a rea . Some moderately
y i e ld ing w l l s completed near t h e c o a s t l i n e a t e l eva t ions
0
19
below s e a l e v e l have shown evidence of poss ib l e sea water i n t r u s i o n ,
wells sampled repor ted ch lo r ide va lues exceeding 100 mg/L.
Many
A demand-storage f i g u r e of - 44.4 percent i n d i c a t e s no immediate danger
of groundwater withdrawal exceeding n a t u r a l rechaTge,
should be gi.ven t o f u t u r e groundwater develbpment along c o a s t a l regions where
sea water contamination could becorne a s e r i o u s problem as i s apparent i n
o the r more developed c o a s t a l a r e a s ,
Careful planning
8
- I
.---
7.7 West Degnen Bay Region
Area - 422.5 ac re s
No, of d r i l l e d wells i n reg ion - 16
No. of dug we l l s and u t i l i z e d sp r ings i n region - 3
Almost a l l groundwater'development i n t h i s reg ion surrounds t h e
Degnen Bay c o a s t l i n e .
The average depth of overburden is 1 2 feet with. s u r f i c i a l d e p o s i t s
(blue c l ay ) as th i ck as 40 f e e t recorded nea r t h e west bay area.
wel l s i n t h i s a r e a are completed i n creek beds and r e p o r t good domestic
A few dug
y i e Ids ,
Well depths range between 4 feet and 231 f e e t with y i e l d s ranging
between 0,s gpm and 25 am,
The p r i n c i p a l water-bearing formation appears t o be t h e contac t zone
between sha le and sandstone sequences,
sha l e can be seen in land from t h e Degnen Bay c o a s t l i n e (Spray sha le s ) .
Some t h i c k formations of water-bearing
Water q u a l i t y analyses taken on wel l s west of Degnen Bay near t h e
c o a s t l i n e have shown evidence of s e a water encroachment (Figure 5).
I il
20
The demand-storage f i g u r e o f 34.5 percent - i n d i c a t e s no immediate
danger of groundwater withdrawal exceeding n a t u r a l recharge. Once again,
t h e dangers of f u t u r e groilndwater development on small c o a s t a l l o t s should
be of concern where oveipumping t h e bedrock f r a c t u r e s may eventua l ly de t e r -
i o r a t e water q u a l i t y , e s p e c i a l l y during t h e d ry summer months.
7.8 Fa lse Narrows Region
Area - 1,414.2aacres r
/ No. of d r i l l e d we l l s i n region - 165
No, of dug wel l s and u t i l i z e d sp r ings i n reg ion - 13
' The False Narrows Region i s ex tens ive , covering t h e southeas te rn
coas t of Gabriola I s land and i s h ighly developed along c o a s t a l a r e a s , Over
500 acres o f t h i s region are subdivided f o r p re sen t o r f u t u r e development.
Much of t h i s acreage i s subdivided i n t o l o t s 1 a c r e o r less i n s ize . -.
The average depth of overburden overlying bedrock i s 10 f e e t wi th
wel l depths ranging between 5 and 250 f e e t ( t h i s range does no t include a
coa l explora t ion hole d r i l l e d dur ing t h e 1930% t o a depth of 2,200 f e e t ) ,
The p r i n c i p a l water-bearing formation appears t o be f r ac tu red s h a l e
(Northumberland Formation).
t o shea r s t r e s s caused by fo ld ing and are consequently highly f r ac tu red .
These sha le beds appear t o be have been subjec ted
Sandstone appears capable o f producing moderate domestic y i e l d s i n t h e e a s t e r n
po r t ion of t h e region around t h e mouth of Degnen Bay,
Thick formations of c l ay overlying s h a l e a r e common along the c o a s t l i n e
with some s u r f i c i a l depos i t s (boulders, coarse grave l ] as t h i c k as 85 f e e t
recorded in land within t h e Garland subdiv is ion . These depos i t s , however,

21
genera l ly have l i t t l e water-bearing p o t e n t i a l .
g rave l i s repor ted t o y i e l d 10 an.
Garlana subdiv is ion are compieted i n f r ac tu red sha le s and produce moderate
One well completed i n coarse I
The major i ty of d r i l l e d wel l s i n t h e
domestic y i e l d s ( 5 gpm and less).
Considerable groundwater development is apparent along the c o a s t l i n e
west of Degnen Bay.
from "poor" t o 20 gpm.
below sea l e v e l , and a r e located on l o t s l e s s than 1 acre i n s-ize.
This i s a high, wel l d e n s i t y a r e a with y i e l d s repor ted U
The ma jo r i ty of wells are completed a t e l eva t ions r
Excel len t y i e l d s have been repor ted inland a t h igher e l eva t ions and
t h e Percy Anchorage a r e a (Figure 2) near t h e 2,200-foot coa l explora t ion
hole d r i l l e d i n t h e 1930's. Four wel l s were d r i l l e d i n l a t e . 1971 t o a depth
of.lOO f e e t and a l l p e n e t r a t e f r a c t u r e d water-bearing sha le beds.
f i e l d is located i n a meadow area (e leva t ion 25 f e e t above sea l e v e l ) ,
This well -..
Three of t h e fou r wel l s were pump t e s t e d . The fou r th wel l was not
considered worthwhile t o tes t as t h e d r i l l e r b a i l e d t h i s well d ry a t 1 2 gpm.
Very l i t t l e water q u a l i t y d a t a is ava i l ab le i n t h i s region.
analyses of groundwater are a v a i l a b l e from a r e a s in land and along c o a s t a l
A few chemical
a r eas nea r Percy Anchorage,
i n hardness, moderately t o r a t h e r h ighly mineral ized,
water encroachment i s i n a well ad jacent t o t h e Pcrcy Anchorage c o a s t l i n e .
The h igher l e v e l s of ch lor ide (200-480 ppm) suggest t h a t t h i s wel l is drawing
These analyses have shown groundwater t o be low
The only s ign of s e a
water from a deeper zone than i s used by t h e ad jacent wells i n t h e same sha le
format ion.
Sea water i n t r u s i o n i s evident a t t h e mouth of Degnen Bay along t h e
western c o a s t l i n e f r i n g e where ch lo r ide values from wells have been recorded
22
as h igh as 3,050 ppm and T..D.S, values as h igh as 8,000 ppni,
A demand-storage f i g u r e of 96.6 percent has been c a l c u l a t e d , Once
again, t h i s f i g u r e may be r e l a t i v e l y high assuming 500 gpd i s requi red of
every well recorded i n t h e region.
r e l a t i v e va lue of t h i s f i g u r e i s considered t o be v a l i d and does serve t o
po in t ou t problem areas .
As s t a t e d previously, however, the
0
In summary, t h i s region i s h igh ly developed, p a r t i c n l a r l y along t h e /-
coas t l i ne .
encroachment is p resen t ly ava i l ab le , well dens i ty i n t h i s a r ea sugges ts t h i s
could be a d e f i n i t e problem.
Although l i t t l e evidence of well i n t e r f e r e n c e and sea water
, This region has proven p o t e n t i a l for cons t ruc t ion of a moderate t o
highly product ive wel l f i e l d . .-Production we l l s should, however, be s i t e d a t
higher e l eva t ions in land as far as i s p r a c t i c a l away fro111 low-lying c o a s t a l
areas.
7.9 Hoggan Lake Region
Area - 1,977.7 ac re s
No, of d r i l l e d wel l s i n reg ion - 20
No. of dug wel l s and u t i l i z e d sp r ings i n region - 2
Most development e x i s t s wi th in t h e Wildwood Estates subdiv is ions i n
t h e northwestern por t ion of t h e reg ion ,
overlying bedrock is 4 , s f e e t with wells rangin.g i n depth between 60 and 245
f e e t , Reported wel l y i e l d s range from 10 ga l lons pe r hour t o 50 ga l lons per
minute.
The average depth of overburden
I
. .. . .'I .-
23
Both t h e sandstone and sha le aFpear capable o f y i e ld ing moderate t o - high q u a n t i t i e s of groundwater, Sandstone and sha le l aye r ing i s common i n
t h i s region, and d r i l l logs i n d i c a t e t h e contac t zone between s h a l e and
sandstone may be a major producing zone, Excel lent y i e l d s have been r epor t ed
within t h e Wildwood E s t a t e s proper ty , Yields as h i g h as 50 gpni from rela‘cively
shallow depth wel l s (130-140 f e e t ) are on record, D r i l l logs show bedrock
t o be h ighly f r ac tu red with exce l l en t water-bedring p o t e n t i a l ,
t he area is favourable , promoting su r face and Subsurface groundwater - movement.
Topography i n
Chemical ana lyses shows groundwater i n t h i s a r e a t o be gcne ra l ly s o f t
and moderate 1.y mineral ized.
Veiy l i t t l e groundwater d a t a is p resen t ly a v a i l a b l e i n o t h e r po r t ions
of . this : region. -.
Hoggan Lake was formed by the cons t ruc t ion of a dam i n the e a r l y 1900vs
t h a t backed water i n t o a previous wetland. The lake which i s about 40 f e e t
deep and covers approximately 59 ac re s may have p o t e n t i a l as a major water
supply f o r t h e southwest corner of Gabriola I s l and , I t is , however, s i tua te1
on p r i v a t e l y owned proper ty .
In summary, exce l l en t p o t e n t i a l f o r groundwater development ex i s t s
i n t h e northwestern po r t ion of t h i s region. No groundwater d a t a is present ly
ava i l ab le a t h igher e l eva t ions surrounding t h e Wildwood E s t a t e s subdiv is ions .
7.10 Northumberland Channel -- Region
Area _. 204.9 ac re s
No. o f d r i l l e d wells i n region - 2
No. of dug w e l l s and u t i l i z e d sp r ings i n region - - ,
_. .. . . . - . - ,’.

I
The South Descanso Region has been heavi ly subdivided and is almost
(I t o t a l l y divided i n t o l o t s one a c r e and less i n s i z e ,
overburden overlying bedrock is 5.5 f e e t wi th well depths ranging between 12
f e e t and 300 feet.
The average depth of '
.
24
The Northumberland Channel Region.covers a narrow s t r i p of lznd along
t h e southwestern coas t of t he I s land , Some development e x i s t s along t h e
western por t ion of t he r e g i o n ; however, t h e e a s t c r n po r t ion i s bounded by
s t eep c l i f f s with l i t t l e p o t e n t i a l f o r development,
a v a i l a b l e on groundwater quan t i ty o r q u a l i t y i n t h i s reg ion ,
Almost no information i s
7.11 South Descanso Bay Region
Area - 339.2 a c r e s
No, of d r i l l e d wells i n reg ion r - 4 7
Sandstone and sha le sequences a r e common in land i n t h i s region while
sandstone and conglomerate layer ing i s common along c o a s t a l reg ions , p a r t i c u -
l a r l y i n t h e Descanso Bay area, D r i l l logs i n d i c a t e t h e contac t zone between
these sequences i s t h e ma.jor water-producing zone, Yields i n t h i s region' are
1- - r i
i L.- 'I repor ted t o range from "poor supplytf t o 32 gpm.
I n t h e p a s t , a well. f i e l d was designed and cons t ruc ted t o provide
domestic water t o f u t u r e r e s i d e n t s i n the South Descanso Region,
c u l a r a rea i s loca ted i n a low-lying meadow area bu t i n s u f f i e n t water
was
This p a r t i -
'1 \ L . obtained t o meet t h e requirements of t he development of t h a t time.
Numerous domestic wel l s have s i n c e been d r i l l e d on p r i v a t e l o t s t o t h e L- east of t he meadow a r e a a t h igher e l eva t ions w i t h varying r e s u l t s . Most we l l s
I-.! . ,
I -
25
r epor t ing good domestic y i e l d s a r e shallow, gene ra l ly less than 100 f e e t i n
depth, while deeper wells have not shown s i g n i f i c a n t i nc reases i n p o t e n t i a l
y i e l d s . Pumping l e v e l s of many of t h e wells inland a r e above sea l e v e l .
- Wells located around Descanso Bay are sub jec t t o s ea water i n t r u s i o n .
Most of t hese wells a r e completed below sea l e v e l and once the f r e s h water
head is lowered through pumping, sea water may Fnter t he water-bearing zone.
Chloride va lues as high as 250 ppm have been reForded i n the Descanso Bay
a rea . _c
A t presertt t h e number of wel l s on record a s t h e o r e t i c a l l y e x t r a c t i n g
500 ga l lons p e r day has ind ica ted groundwater withdrawals are exceeding
groundwater i n s torage. A demand-storage percentage of 108.6 percent has
been ca l cu la t ed f o r t h e region. This p a r t i c u l a r reg ion has been s u b s t a n t i a l l y
subdivided i n t h e past and i f domestic wells were constructed on each iet
excessive groundwater withdrawals could p re sen t a r e a l problem, p a r t i c u l a r l y
i n the dry summer per iod when water l e v e l s are a t or near t h e i r lowest.
Some.potent ia l ly high y i e ld ing wells have been constructed t o t h e e a s t of
t h i s subdivis ion.
8. GROUNDWATER QUALITY
Natural groundwater q u a l i t y i s emphasized i n t h i s r epor t a.nd po l lu t ion
aspec ts apa r t from n a t u r a l sources such as sea water, f o r example, have not been
analyzed.
Approximately 7 5 complete chemical analyses o f groundwater have been
done on Gabriola I s land , as well as numerous f i e l d (Hach) analyses .
26
These ana lyses have shown groundwater on Gabriola I s l and t o be
b a s i c a l l y a good q u a l i t y , s o f t , low t o moderately mineral ized water i n a reas
of h igher e l eva t ion , while h igher mineral ized groundwater i s apparent a t
lower e l eva t ions . This is p a r t i c u l a r l y evident along c o a s t a l regions where
wel l s a r e sub jec t t o sea water encroachment, The major i ty of wel l s sampled
f o r complete chem3cal analyses are l e s s than 200 f e e t i n depth ,
a
A computer p l o t has shown a c o r r e l a t i o n c o e f f i c i e n t of around 0.6 r
between Tota l Dissolved S o l i d s and t o t a l depth of wel l CFigure 8 ) . This
f igu re would i n d i c a t e a r e l a t i o n s h i p between T,D,S, and depth does e x i s t ;
however, t h i s i s no t overly ev ident , A more apparent T,D,S,-depth r e l a t i o n -
s h i p would probably be evident i f similar depth we l l s were located i n topo-
g raph ica l ly similar a reas .
...
9. OBSERVATION %ELLS
A t p re sen t t h e r e a r e th ree observat ion we l l s on Gabriola I s land
CFigure 9) t h a t a r e being a c t i v e l y monitored, e i t h e r manually by an observer
or with automatic water l e v e l cha r t r eco rde r s , ,
Five test wel l s were o r i g i n a l l y d r i l l e d during the 1972 d r i l l i n g pro-
gram and fou r of t h e f i v e wel l s have been monitored f o r a t l e a s t p a r t of t h e
t i m e during the per iod 1973-78,
to red due mainly because of a flowing a r t e s i a n condi t ion (water l e v e l + 10
f e e t above ground l e v e l a t t ime of well completion), n e c e s s i t a t i n g t h e capping
of t h i s well, ’
Observation w e l l 72-2 has never been.moni-
A b r i e f d i scuss ion on t h e cu r ren t s t a t u s of the Gabriola I s land
observat ion wel l s has been presented below. Wherever length and consis tency \
of record has permit ted, an attempt has been made t o t r y and c o r r e l a t e water

27
l e v e l f l u c t u a t i o n with per iods of high and low. p r c c i p i t a t i o n and/or pumping
i n t h e a rea .
>
9.1 Observation Well 72-1
Descr ipt ion: Sec t ion 14, Well No, 3 Depth 325 f e e t S i t e I . D . 1400064
This wel l is located i n t h e Lock Bay region. and was d r i l l e d i n 1972
by t h e a i r r o t a r y method, 6
I t was pump t e s t e d fo r 1,000 minutes.- r
_--
Based upon t h e r e s u l t s of t h i s pump t e s t , t he s a f e product ive y i e l d
was r a t e d a t 10 U.S.gpm. I t i s located inland i n N , E . s e c t i o n 1 4 a t an
e l eva t ion of 325 f e e t above sea- l e v e l (Figure 9 ) .
I n t e r p r e t a t i o n of t h i s water l e v e l hydrograph i s d i f f i c u l t i n t h a t
measurements are taken on a once per month b a s i s and a l s o water l e v e l s may
be inf luenced from nearby pumping.
Peak water l e v e l s do, however, correspond t o per iods of high p r e c i p i -
t a t i o n , although response i s slow, with a time l a g of about one month
(Figure 11).
is n o t responding t o a l o c a l flow system, bu t r a t h e r t o a deeper flow system.
Water Qual i ty shows a moderately mineral ized calcium bicarbonate type ground-
water deeper f l o w systen:; however, more ex tens ive sampling would have t o be
done before this can be confirmed,
cepted is 215 f e e t below ground l e y e l ,
This slow response t o p r e c i p i t a t i o n may i n d i c a t e t h a t t he wel l
The major water-bearing formation i n t e r -
I t i s reconmended t h a t an automatic water l e v e l r eco rde r be i n s t a l l e d
on t h i s w e l l , as pas t experience has shown t h a t manual readings can be
misleading taken on a once p e r month b a s i s on a wel l suspected of being
inf lucnccd froin nearby punping;‘

28
9.2 Observation Well 72-2
Descr ipt ion: Sec t ion 6, Well No, 5 Depth 275 feet S i t e I , D , 1400060
Observation wel l 72-2 is loca ted i n t h e e a s t e r n end o f t h e I s land
along Peterson Road a t an e l eva t ion of 120 f e e t above s e a l e v e l (Figure 9 ) .
,The wel l was d r i l l e d i n 1972 by t h e a i r r o t a r y method and pxiiped a t a r a t e
of 70 U,S,gpm f o r 1,400 minutes, Based upon av'ailable d a t a , t he wel l was
r r a t e d a t 75 U.S.gpm. c
An artesian flowing condi t ion Ccalculated head a t time cf well com-
p l e t i o n was 10 f e e t above ground l e v e l ) necess i t a t ed capping of t h i s wel l .
9 .3 Observation Well 72-3
Descr ipt ion: Sect ion 19, Well No. 7 Depth 250 f e e t S i t e I.D. 1400067
Observation well 72-3 i s located i n t h e Minis t ry of Highways yard o f f
North Road a t an e l eva t ion of 305 f e e t above sea l e v e l p i g u r e 9 ) .
was d r i l l e d i n 1972 by the a i r r o t a r y method and was pumped a t 50 U.S,gpm f o r
1,500 minutes,
The wel l
The safe product ive y i e l d of t h i s wel l was ca l cu la t ed a t
between 35 and 40 U,S.gpm.
The well is equipped with an automatic water l eve l recorder and has
been con t inua l ly .monitored s ince 1973,
Analyses of the water l e v e l d a t a has shown t h a t although annual seasonal
f l u c t u a t i o n can r e a d i l y be seen, water l e v e l i s d e f i n i t e l y being inf luenced
from nearby pumping ,
e a s t , i s most probably the inf luenc ing well.
The Gabriola school we1 1, located approximately 600 f e e t
S imi la r water l e v e l s i n both
\

29
wells f u r t h e r supports t h i s assumption,
t h a t t h e r e i s no evidence of any overpumping of t h i s a q u i f e r a t t h i s t ime,
'lle water l e v e l d a t a has a l s o shown
9.4 Observation Well 72-4
Descr ipt ion: Sect ion 16, Well No, 1 Depth 275 f e e t S i t e I,D, 1400061
Observation w e l l 72-4 i s loca ted near t he middle of t h e Gabriola .e
region along North Road a t an e l eva t ion of 210 f e e t above s e a l e v e l (Figure 9).
The well was d r i l l e d i n 1972 by t h e a i r r o t a r y method and no pump t e s t was r
conducted. A t t h e t i m e of d r i l l i n g t h e well y i e l d was est imated t o be 3 U.S.gpm.
Attempts t o improve t h e y i e ld by surging were no t successfu l .
A l l ava i l ab le manual water l e v e l d a t a co l l ec t ed t o d a t e has .been
presented in t h i s r e p o r t (Figure 11) .
i n s t a l l e d on t h i s wel l i n August 1977.
An autoniatic water l e v e l recorder was
The hydrograph (Figure 10) shows water l e v e l does correspond with
p r e c i p i t a t i o n ; however, peak water l e v e l s lag behind peak per iods of p r e c i p i -
t a t i o n by about one month,
The water l e v e l has continued t o r ise i n t h i s well s ince i n i t i a l l y
d r i l l e d i n 1972,
31.5 f e e t i n October 1973,
The low po in t i n t h e hydrograph record was reached a t about
A d e f i n i t e p a t t e r n of Tisir.2 water l eve l can '
r e a d i l y be seen with t h e low po in t i n October 1977 recorded as 21.7 f e e t below
ground l e v e l ,
Both observat ion we l l s c72-2 and 72,4] have been samplcd f o r complete
chemical ana lys i s .
a l k a l i n e , higher mlneral ized water than wel l 72-4, a Schoel le r p l o t has shown
Although t h e water q u a l i t y of wel l 72-2 shows a more
both groundwatcrs t o be G f a similar t y p e (Figure 7 ) , and poss ib ly wi th in t h e

30
same flow system.
va t ion wel l 72-2) would be expected t o b e located i n t h e lower end of t h e
flow system.
i n 72-2 tends t o support t h i s assumption,
a r t e s i a n condi t ion and more rapid movement o f t he groundwater through t h e
f r z c t u r e system may account for t h e lower mineral ized groundwater found i n
w e l l 72-4. 6
The sample showing higher parameter values [seen i n obser-.
, The topographic ' loca t ion and flowing a r t c s i a n condi t ion seen
The h igher y i e l d and flowing
r 4 9.5
Descript ion: Sec t ion 22 , Well No, 44 Depth 325 f e e t S i t e I . D . 1400063
Observation w e l l 72-5, a l s o within t h e boundaries of t h i s reg ion , was
abandoned i n August 1977. The w e l l was d r i l l e d i n 1972 by t h e a i r r o t a r y
method and was pumped f o r 1,500 minutes, The safe product ive y i e l d was
ca lcu la t ed a t 20 U . S . g p m .
The wel l was equipped with an automatic water l e v e l recorder from
June 1973 t o August 1977.
10. CONCLUSIONS
[a) Groundwater inland on GabriOla I s l and i s gene ra l ly of a benign type,
being a r e l a t i v e l y s o f t , moderately mineral ized type groundwater.
Dissolved So l ids i n wel l s sampled in land i s gene ra l ly below 250 mg/L.
To ta l
Higher mineralized water i s ev ident along c o a s t a l r eg ions where T,D,S,
va lues are as high as 5,800 mg/L,
a well loca ted on the western c o a s t l i n e f r i n g e of Degnen Bay,
This p a r t i c u l a r sample was taken from
This
h ighly mineral ized water is usua l ly assoc la ted with s e a water i n t r u s i o n .
A combination of cont inuing development, l ack of summer recharge and 0

31
nature of t h e l o c a l bedrock has cont r ibu ted t o d e t e r i o r a t i o n o f water I
q u a l i t y i n some a r e a s ,
are S i l v a Bay, Degnen Bay, e a s t o f Lock Bay, and p a r t i c u l a r l y t h e P i l o t -
Areas where sca water encroachment i s appqrent
Taylor Bay aTea.
@) Approximately 10 t o 15 percent o f d r i l l e d we l l s on Gabriola I s land have
been reported by t h e wel l d r i l l e r s t o bc capable o f y i e ld ing over 10
ga l lons pe r minute, - a
I _- Cc) Approximately 85 percent of groundwater u t i l i z e d on Gabriola I s land is
from d r i l l e d we l l s wi th the p r i n c i p a l aqu i f e r repor ted as f r ac tu red
s h a l e s and sandstones,
Cd) Bedrock wells range i n depth from 5-foot dug wel l s t o 537-foot d r i l l e d
wel l s , --.
(e) Well y i e l d s range from 1 ga l lon p e r hour t o 75 U.S. gal lons pe r minute.
(f) A r e l a t i o n s h i p showing increas ing minera l iza t ion with increasing wel l
depth appears t o e x i s t up t o depths of around 200 f e e t (Figure 8).
Fur ther i nves t iga t ions may show a T.D.S. depth r e l a t i o n s h i p i s even more
evident I n deeper wel ls .
(g) Successful w e l l f i e l d s have been developed t o supply water t o subdiv is ions
on t h e I s l and ,
groundwater development, while some areas have shown p o t e n t i a l f o r devel-
oping higher capac i ty wel l y i e l d s , These a r e a s are, however, l imi t ed
and In some cases q u i t e f a r from the more populated c o a s t a l regions.
Spec i f i c wel l s i t e s have shown p o t e n t i a l f o r g r e a t e r
32
(h) Denand-storage percentagcs have been ca l cu la t ed f o r each groundwater *
region. On t h e b a s i s of 500 gpd p e r wel l , those reg ions considered t o
be a t p re sen t c r i t i c a l are t h e Sands, Fa lse Narrows and South Descanso
Bay reg ions . Those reg ions t h a t a r e becoming c r i t i c a l as groundwater
development cont inues a r e the Lock Bay and S i l v a Bay reg ions , The
remaining regions appear t o have adequate. groundwa.ter i n s torage t o meet
add i t iona l water demands. 8
r _.-
11. RECOMMENDATIONS
(1) Fur ther groundwater development along t h e c o a s t a l a r e a s of t h e Sands,
Lock Bay, South Descanso Bay, False Narrows, Degnen Bays and S i l v a Bay
regions should be c a r e f u l l y planned. Fur ther d e t e r i o r a t i o n of t h e
groundwater resource may occur i n these a reas due t o s e a water encroach-
ment or wel l i n t e r f e rence problems. .
(2) Addit ional p o t e n t i a l f o r development o f t h e grnundwaLer resource e x i s t s
within t h e Hoggan Lake, Descanso Bay and Gabriola reg ions , aad inland
i n t h e Lock Bay, Degnen Bays and S i l v a Bay reg ions .
? .
1
C3) Addit ional i nves t iga t ions a r e warranted t o determine with more
c e r t a i n t y t h e p roduc t iv i ty of t h e f a u l t and f r a c t u i e systems on
Gabriola I s land , and t h e r o l e of.major f a u l t zones on groundwater move-
ment on t h e i s l and .
(4) Some add i t iona l programs which should be considered a re :
( i ) A water q u a l i t y program should be i n i t i a t e d on Gabriola I s land ,
p a r t i c u l a r l y along c o a s t a l regions t o obta in more up-to-date
- .. . . . .

33
information on groundwater q u a l i t y .
is p r e s e n t l y ava i l ab le on water q u a l i t y from wel l s d r i l l e d
Very l i t t l e information
during t h e p a s t few years .
( i i ) Well 72-2 should be monitored on a r egu la r b a s i s .
and importance of t h i s high y ie ld ing aqu i f e r ( the product ive
The loca t ion
. y ie ld of t h i s wel l was determined as 75 U.S.gpm) warrants moni-
t o r i n g of t h e shut - in p re s su re head a t l e a s t once p e r month.
[The a r t e s i a n head a t time o f well cons t ruc t ion was est imated
8
r
t o be 10 f e e t above ground.)
( i i i ) A pump test should be conducted on observat ion well 72-4 (Weldwood
of Canada) i n t h e near f u t u r e ; water l e v e l i n t h i s well has
,- continued t o r i s e s ince i n i t i a l l y d r i l l e d i n 1972.
'1
1 2 . . REFERENCES
B.C. Minis t ry of Agr icu l ture , Climate of B.C. , Tables of Temperatures,
P r e c i p i t a t i o n and Sunshine, 1968-1977.
Brown, W . L. and Erdman, R. B. 1975. Habi ta t of Groundwater on Gabriola
I s land , B.C. Report prepared f o r Department of Lands, Fores t s and
Water Resources, Groundwater Division, Water Inves t iga t ions Branch,
F i l e 92-G-4.
Brown, W. L. and Dakin, R. A. 1972. Regional Groundwater Study Gabriola
I s land and Nanoose Peninsula (Par t A-Gabriola I s land) f o r t h e Regional
D i s t r i c t of Nanaimo.

34
Foweraker, J,. C. 1974. Groundwater Inves t iga t ions on Mayne Is land .
Report No. 1, Evaluation, Development and Management of t h e Groundwater
Resource on Mayne I s l a n d . ' Groundwater Divis ion, Water Inves t iga t ions
Branch, Department of Lands, Fores t s and Water Resources.
I Muller,, J. E , and Je l e t zky , J. A. 1970. Geology of t h e Upper Cretaceous
Nanaimo Group, Vancouver I s land and Gulf I s l ands , B.C. Geological
Survey o f Canada, Paper 69-25. ? I -
I
/
Oswald, E. T. 1978. Gabriola I s land and Neighbouring I s l ands ; A Landscape I c i
Analysis. Environment Canada, Fores t ry Service.
Walton, W. C . 1970, Groundwater Resource Evaluation. McGraw H i l l Book Co.
c I I I
.
W. S . Hodge Technician Groundwater Sec t ion Hydrology Divis ion Water Inves t iga t ions Branch Minis t ry of t h e Environment
I P D I I I

TO ACCOMPANY REPORT ON BRITISH COLUMBIA .-
MlNlSlRY OF THE ENVIRONMENT ENVIRONMENTAL AND ENGINEERING SERVICES
GCZ~TLOCCL. ZsCand - - h/uZersj7ea! fley ~ 'un
WATER INVESTGATIONS BRANCH
. I'
KALE1 VER7...&...5!70Ut!7 ............
L_ HCR...A5...ShQC4m ................................
..........................................................................
F l l E N,,. ........................ D\NG. No.. FfgUfC.. y... UD -W-t----W.krU
L . l , I ,

BRITISH COLUMBIA MINISTRY OF THE EiJVlRONMENT
ENVIRONMENTAL AND ENGINEERING SERVICES WATER INVESTIGATIONS BRANCH
TO ACCOMPANY REPORT ON
&&,-dola ZsLmd - SCALE: VERT ... AS _ _ _ _ .S~OLU[=I
I"
BRITISH COLUMGIA . MINISTRY OF THE ENVIRONMENT
ENVIRONMENTAL AND ENGINEERING SERVICES WATER INVESTlGATiONS BRANCH
cp.IcIIII. -
.... .iUn .............................. CALE: VERT I
~
j ,
.....................................
b! :
3
0 @
SCALE: VERT .... C?un ................
ENVIROFJMENTAL AND ENGINEERING SERVICES 'WATER INVESTIGATIONS BRANCH
.---- L.9 I i r ,
. .
.
I " I-
TO ACCOMPANY REPORT ON
MINISTRY OF THE ENVIRONMENT ENVIRONMENTAL AND ENGINEERING SERVICES
WATER INVEST!GATIONS BRANCH
E ... .
a ? I

I TO ACCOMPAMY REPORT ON BRITISH COLUMBIA
A4 IN I STH Y 0 F THE E NVI RON M E NT ENVIRONMENTAL AND ENGINEERING SERViCES Map sh~w'ny cM~nde5 .
. * . e w c e d / r t g /oo /ys;//- , WATER INVESTIGATIONS BRANCH
r u m M 1 . w i m r r a
DATE SCALE VERT ...Ha... ....7(.................................
* H6R .... &5 ..... ShoWn .................................. I g Aup ':L9.;TB .___
ENGINEER .......................................................................................................................
F I I . E N~ ......................................... DWG. NO. fiqu/e;,6 ............. -3-
.I&

4
1
.-

BRITISH COLUMBIA I\I,INISTKY OF THE ENVIRONMENT
EfjVIRONMEN'TAL AND ENGINEERING SERVICES WATER INVESTIGATIONS BRANCH
--r..*L..-L* an.--
@ , / @
0
TO ACCOMPANY REPORT ON
s GQ~TLIoLQ. -25Lin&!. - ~
LKUtif=?/7
BRITISH COLUMBIA MlNlSTRY OF THE ENVIRONMENT
WATER INVESTGATIONS BRANCH ENVIRONMENTAL AND ENGINEERING SERVICES ok5-ervaf ror l Iv'eCL
--P--.---L ---=
DATE ...
HOR ... AS ... ............. : ................... SCALE: VERT As.
................................................................. EN.31 NEER .............................................
FILE No ........................................ DWG. --I eF?;7c/re -.DIM.."- . 9 . . . . . . .-
?-
(,I
eLed 325 '
72 -f
/ACT/ VAE AND N O M - ACTf VE 1 eCev: ,
120
. .
XD. ,275'
72 -2 Safe P d . XeCd 75 -usypm.
d e 305.'
72-3
72-5
I . TO ACCOMPANY REPQRT ON BRITISH COLUMBIA
MINISTRY OF THE ENVIRONMENT G&rLo&. ZSdand ,T. .: . ENVIRONMENTAL AND ENGINEERING SERVICES
WATER INVESTIGATIDNS BR,ANCH . . I _ .. ~
FILE No. .____.___....... .. K = w ~ - ~ . " . - - - - Y - ----I--

I ->
ill ijj
4 5
J W > w J
4 W (0
P 0 a L
Gabrioc'a ZsCand - .
WATER INVESTIGATIONS ERANCH
-.- , . I .

- .

-- -- C A S / N G L€tdGTh' -- 5'
7 0 .
g ' ?
+ a .' 7
2 2
33 '
35 '
so '
SO '
25' '
26 '
6'6"
15'
I I . 190 f I ? 7
"- ;zco
7
8 ' I /bo* 30'
20 '
6'
/4 '
L 0 . 8'
25 9%
-I.-- --- . . . . .

i 1 I ! 1
i I ! I
I
I--- --
I 25'
/10' j 30'
I
I 1 5 .'
2'
5'
25' /60'
/m 1 5 '
5 / /o ' 6'
. ..----..

3-4 WkJ I . I I d / I 53
8'
8'
5 P
s a d h e //5/ 20'
+* 4%'
10 -1 2 9 ,
6 ' /pm. I I
5'6'' 1 6 L I I
3' 7 I l l 97 ' I
-- 96' 4 .' - I /So' I 4a' /90f I
--.- I s-5:/asi
1

I 7' 5
5
5
I
. . .
5 '
5 7 +0.-60 i
i ~
S
5 I
. : . I
. j
,
5
5
5
5
5
4 +-
i , , . .

I 1 ' I 6 6 I
..-. -._I.,.._-."-.". 1 I I.......... I-. 1 ...--...-.- / 3 4 /5',
....-_...... ,..._ ....-. I
I +-
I 7
58' j 3 d 1 ?
I I _._... .... ,...... . . I -... - .- 1 ?... 11--.1-.
- i /LL
i
WELL
DUG
I C I 2 3 I
I S I S I ! 5 I-36L.L-
I I
, ! . , , . ., , ,. .̂.L .....,..... . . .. .
1
, .. ,.. ... I . . .

.... ,..,.,I. -* <.,.-....

t
P-
-- I i . j /
I /
I I . t
2 1 9 ' j
3 /o'j-
i 2 7 I
I -- 2* ...... I I -------I-..&-
I I t

. . . I .
. . , . .
I +-- ,---I- -
i I
3L 1220' I
/ 75
pB, 1 j /75'
I 75 -- "-I&-
54 j230. j -
..^_<_.^.. I..-_ ._..: -... 1 . . . . . . . . . I . - . . . .
7
25
' . , . ~ .- .,,. . . . , ,. , ...,. ._ _. '...I .... .. . ... , .
CASlNV'c- LENGTH
4'
I / I @ I
I /35'
.7
25'
/o
!! 2 5 L
7
/3'S"
/ / I 7 i / & G $ - M !
1
2 2 i I i
~
\ / 6 --
;' -- I ' I I I
2 1
-4 _ I
, i . . _.... I ..__.. . - ..
&5 -_I_-
! I ,
I ,
! ' I
i I
i .
I
/9 I I 90'
. .__ _.. .. .... - - .-.. ...
I I ! - 1 . . : , , . - .- , . l .I

. .
I

. .
! . .

i * . ._.. ....

-- 45' w e / 30' - - 55
425'/ M'
- I + c
45 'I -- I / U I 9 1 I
I i j . 70' 172'
1
72.1 12'
I 1 I
,. . ! . , . .. ..

I 1 I/ I I I
! I i +
D d L L I -====
?If- 70 29
Bt.- 60 15 #
am'/ 25,' T-- *- /20
. .
... . . . ..I.
--.
? I 7 -I-
// I 2.
7 i - 18, i ? i
j /B'jss' 95l 1 ? .
I A-
3 1 .. 1
I - - 7
I --
I
- . i )
?
232 7 . . ,
- . _ _ - . I ._..-. .......... I -.- ..- ' , I
I ' . . . , . . I . .
91 I--- -
I 13 /3
I ' I
3 1 j 73'
7 1 1/80' 8 j-f 32 I I 2/0'
.--=- ; - I -------I ~,
44 72" I I 9 /
I Q '
, , , .,( L. . .

I I
I -+?
7 i L
-74 I- 4 5/ --- --.-
39'1 3 '
/t
I ,. ...

-- 7-
1
. .
120' $7
I
. .. . ._.. . , _.._.. .- ...-. . .. _. .. . ~ ...

TABLE 2 - QUANTITATIVE ESTIMATES OF PRESENT GROUNDWATER USE VERSUS AVAILABLE STORAGE
GROUNDWATER REGION AREA OF REGION PRELIMINARY ESTIMATES OF GROUNDWATER WELLS & S P R I N G ESTIMATED YIELD ESTIMATED GROUND- I N ACRES S U P P L I E S I N STORAGE AND RECOVERABLE I N REGION I N GPM USAGE WATER USAGE I N
BY MINING - EXPRESSED AS 0 EST. BEDROCK VOL. I N AC.-FT.
500 GPD PER WELL GALLONS BASED ON 500 GPD/PER 100 DAY PUMPING ASSUMING DEPTH
OF 200’ - FOR 0.01% I N AC.FT.
(1) (2)
1. Sands 864.19 17.28 175 60.76 8 . 7 ~ 1 0 ~
2. L o c k B a y 2188.93 43.78 200 63.44 10x106
4. Gabriola 3148.93 62.98 25 8.68 1.2x10⁶
1420.93 28.42 71 24.65 3 . 5 ~ 1 0 ~ 3. D e s c a n s o B a y
563.01 11.26 5 1 17.70 2 .5x106
1. 6x10⁶
.5. S i l v a B a y
6. N o r t h D e s c a n s o 553.15 11.06 32 11.11 B a y
7. West D e g n e n B a y 422.46 8.45 19 6.60 9 .5x105 b -4 8. F a l s e N a r r o w s 1414.21 28.28 178 61.80 8. 9x10⁶
1977.73 39.55 22 7.64 1.1x10⁶ I 9. H o g g a n L a k e
10. N o r t h u m b e r l a n d 204.93 Channel
11. South Descanso , 339.20 B a y
4.10 2 .69 lX1o5
6.78 49 17.01 2. 4x10⁶
-. . : .
. . .;! c
. e

?
IC
(I
0
9f v)
r-l
b
M
i.
r-. 0 4
x v)
M
N
‘? ‘9
I. 4
0
ri
r(
4
N
‘4
x
-,_
..I
:_.
..
. .
..
I

. -1.-
3 O f I f25 ' . I ?
6'
4' 7'
7'
. .., < .

! 2/ I 7% 1 I /oa'
S. kCL
6'
2'
1 1 I - !

. . . . .

// 0
124 BO'
d 3 e I d
/3 5 6 G, -- 1275' 5
L ..6
7 0 0 .
i , 1 ' 7 I
?
8 ' --- I f i t 44' I 1 7 1 -
j
1-17 1
1
f /b j -275' __I
/o --
2 i !
!',_ .... "I--.-.... ".& i -..* ..... ...... ".,. . I .--. ..-....... I . ..... _-.. ...... LC.._. ........ ,^I....
... " ._.__._,._ .. . . . .

........... -
- I
...
30
8
-
.......... - ..
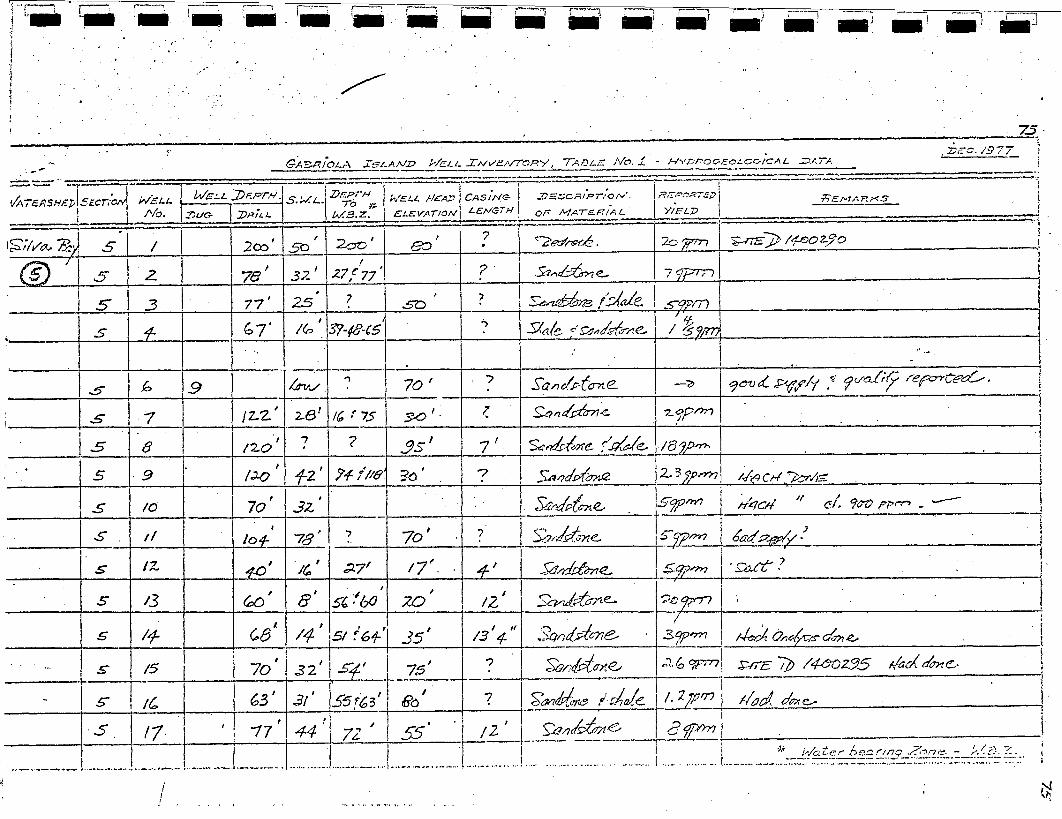
Is 1.7 I
1 70'
63 '
I., . I ~, ., . ... ., . ..

. . . .
2- I 5
-~ . ,
15
' .
15
I ' 15 I+-+- ' _, ,. _.._--* .--.... ..- -.-.-..
, 25 6 0
=rc 60'
* 31
-...
,i

2 . 1 1 50'
16 I
7
7 20' I 37'
I I
.7
7
?. 22 ! 1 3 I u I / i" I 15' I 7
7
7 .
7
I I _* .---.. ,,,.-_... "__" .._.- ... _-.. * ..._.

I
, ,
, . I
!
I
7 ' /o' ' ? 32'
,

, .. i 1
ZZC. /s77
Ji+ti" 3c 7L 6 ' 250'"
2-2
?
7 .22
2 2 I
5 Z m I , . I 2r 5'
? 2r
22
22
-- 4Cs I . 1/44' 8/ 22
32
'59m
#8 i 6 ' 1 7 2 2
49 I I . - 2z .--
5' 2L I
1 -....-.... .. ̂ ...... ~ .... . . I .- ..--... ..-.-.. .. _-....._.. .- ..- ..^. ... " ,__..,..... ___.._.. -...
I . . .,. ..,. .. . ,

/ . . /'
. 1
I I + t /7
8' 1 3 f .U
/
. I Z Z O ' . 7 I : , 7
1
: .
:
(
6 '
G'
'5'
1323'
j ,a' I I ' I
.- . .... . .
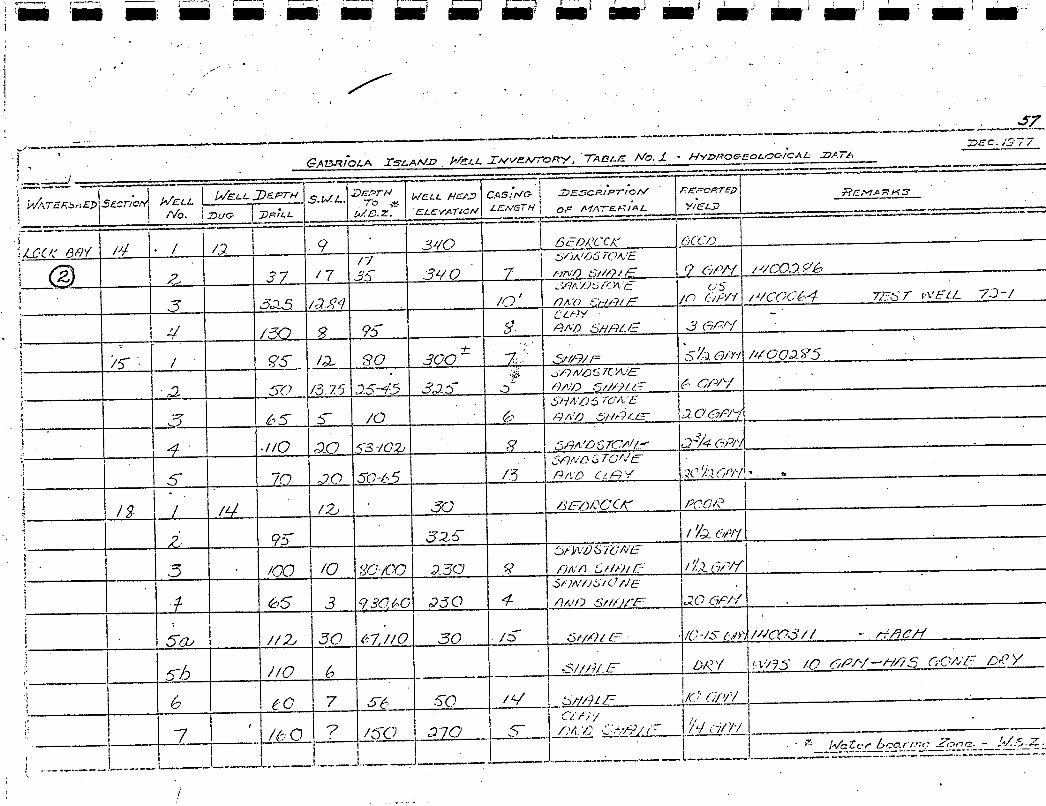
1 . .. .. .. .. . i
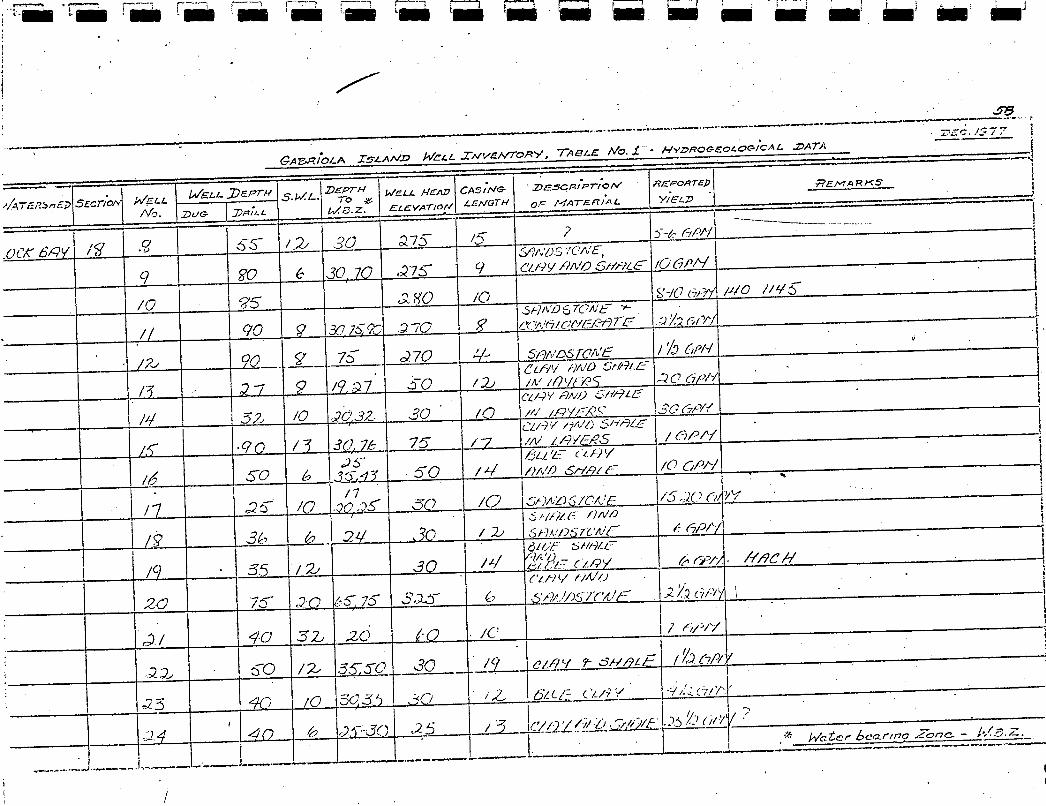
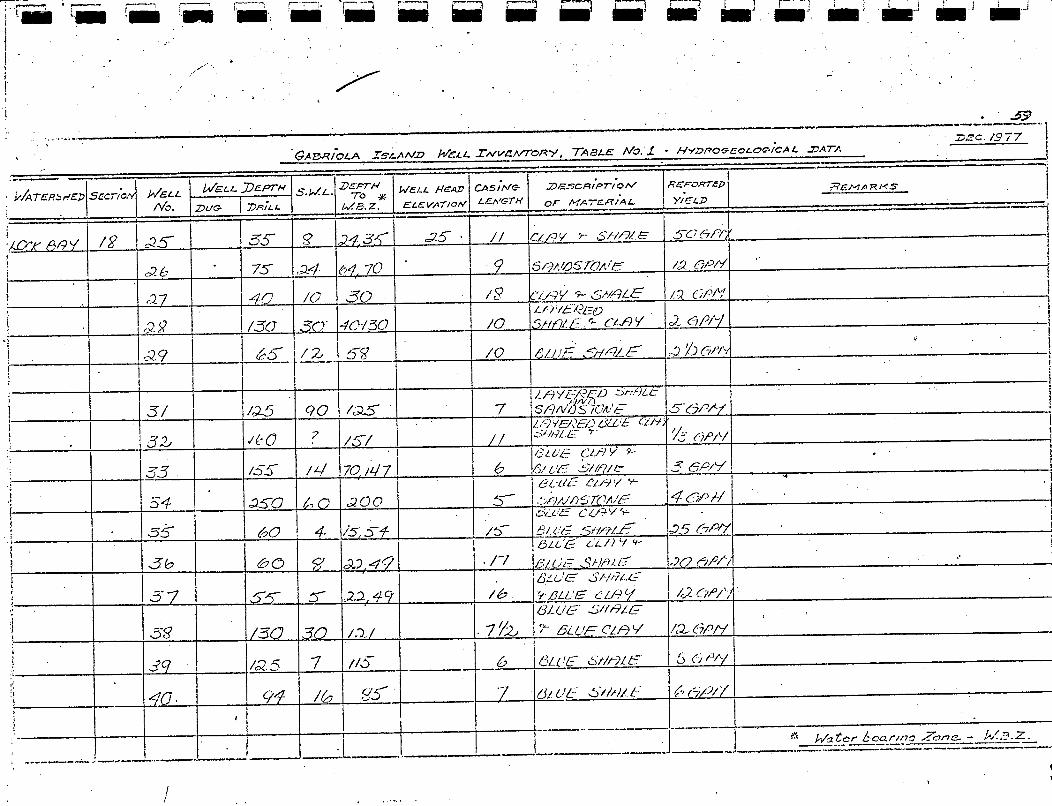

,

. , , . . .. - ..-. .... .

I . 16 I
50' ~
55- 70
30
40
40
70
40
-40
__I. 35 ..I -I I.
:?
, . ., ._."... ".. . .


1 I ,..,...-... I.-.. .___.. i ......--.... ..-."....._........... i .. I I .......... -.,. . . . . . . . .


, I
. . ' ' ,'
. . .
. . / . ' . .
. / . e ' , ' : .
; . ' . . . - . . . .
I -- I L
.+
I 1 1
1 I I I


I +I-:- ............. ....-- .. ..---
I i ! . ,
j 675 1 " 1 9 0 I
7 5
' I 7(? -.-.- I
. . . . . . . .

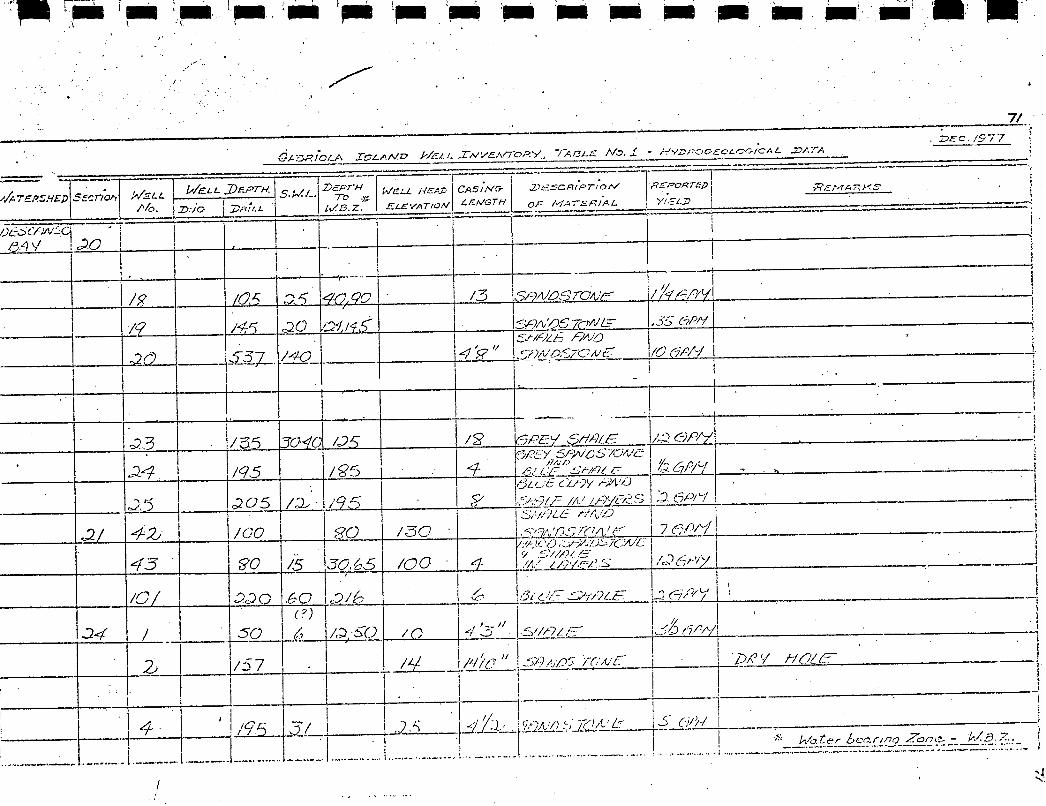
, I . . . ... . I