monitoring, analysis and gis interpretation of
TRANSCRIPT

Monitoring, Analysis and GIS Interpretation of Hydrodynamic and Sediment
Transport Systems for Inlets on the Central Texas Coast
Submitted to: US Army Engineer Research and Development Center
Coastal and Hydraulics Laboratory 3909 Halls Ferry Road
Vicksburg, MS 39180-6199 Dr. Nicholas C. Kraus, Contract Manager
2003 Annual Report in Fulfillment of USACE Contract No. DACW42-03-C-0042
Submitted by:
James S. Bonner, F.J. Kelly, and Deidre D. Williams Conrad Blucher Institute for Surveying and Science
Texas A&M University—Corpus Christi 6300 Ocean Drive, Corpus Christi Texas 78412
and Thomas Ravens, Texas A&M University at Galveston
Technical Report TAMU-CC-CBI-03-03
October 23, 2003 February 18, 2004 (Revised)

Technical Report TAMU-CC-CBI-03-03
BLANK PAGE
ii
Technical Report TAMU-CC-CBI-03-03
Table of Contents Table of contents .........................................................................................................................iii List of Tables ............................................................................................................................... v List of Figures ............................................................................................................................vii Executive Summary ...................................................................................................................... 1 1. Introduction.............................................................................................................................. 3 2.0 Task 1. Geographic Information System (GIS) for Central Texas Inlets Analysis. ............... 3 2.1 “Texas Inlets Online,” A Data Dissemination and Archiving Resource for Inlet Data and... 3 2.2 Aerial Photography of Texas Inlets of Interest ....................................................................... 4
2.3 Geographic Information System for Central Texas Inlets Analysis ....................................... 7
2.4 Key Milestones for Task 1 and Continuing Work : ................................................................ 7 3.0 Task 2. Inlet and Channel Morphology Surveys ................................................................... 7 3.1 Colorado River Mouth. ........................................................................................................... 7 3.1.1. Colorado River Inlet Survey ............................................................................................... 7 3.1.2 Design of Video Camera System......................................................................................... 9 3.2 Packery Channel. .................................................................................................................. 10 3.2.1 Profile Surveys................................................................................................................... 10 3.2.2 Sediment Samples.............................................................................................................. 15 3.2.3 Key Milestones for Task 2 and Continuing Work. ............................................................ 17 4.0 Task 3. Monitoring and Measurements. ............................................................................... 18 4.1 Key Task 3 Milestones and Continuing Work ..................................................................... 20 5.0 Summary .............................................................................................................................. 20 6.0 Reference ............................................................................................................................. 21
iii

Technical Report TAMU-CC-CBI-03-03
Appendix A ..............................................................................................................................A-1 Appendix B .............................................................................................................................. B-1 Appendix C .............................................................................................................................. C-1
iv

Technical Report TAMU-CC-CBI-03-03
List of Tables Table 1. Summary of aerial photographs taken during this project period by Lanmon Aerial ... 5 Table 2. Packery Channel Beach Profile Control Point Information.......................................... 12 Table 3. Sorting classification system for inclusive graphic standard deviation........................ 17 Table 4. Summary of Grain Size Statistics for Profiles (PC01-PC14) ....................................... 17 Table 5. Status of project milestones .......................................................................................... 20
v

Technical Report TAMU-CC-CBI-03-03
BLANK PAGE
vi

Technical Report TAMU-CC-CBI-03-03
List of Figures Figure 1. Site map of Texas Inlets of interest to CHL.................................................................1 Figure 2. Front page of the Texas Inlets Research site on the CBI website, providing a focal point for data dissemination and archiving of Texas inlet research. See http://www.cbi.tamucc.edu/ResearchProjects/TexasInletsOnline ................................................4 Figure 3. Colorado River 09/08/2003 (Lanmon Aerial Photography, Inc.)................................. 6 Figure 4. Existing Packery Channel and proposed inlet location along Padre Island (photo on 09/08/2003 by Lanmon Aerial Photography, Inc.) ..................................................................... 6 Figure 5. Contour plot of the Colorado River Inlet (Aug. 19-23, 2003). The plot provides sediment position (US State Plane NAD 1927) as a function of its position (Texas South Central 4204 US feet) and depth (NAVD 88 US feet) ................................................................. 8 Figure 6. Line 15 profiles. a) Results from topographic survey (beach/wade); b) results from the Jet Ski hydrographic survey plus the beach/wade data. Points overlap between topographic and hydrographic surveys. Depths match very well. Lines 13, 14, 16, are like these. ........................................................................................................................................... 9 Figure 7. Site map indicating the location of survey control points and beach profile data north and south of the future site of Packery Channel inlet........................................................ 12 Figure 8. Overlap of sled/wade survey of greater that 100 ft as observed on profile PC-05..... 14 Figure 9. Sea sled preparation during survey of PC-04 located north of Bob Hall Pier............ 14 Figure 10. Fall 2003 beach profile survey data compared to 1996 data at PC-06..................... 16 Figure 11. Fall 2003 beach profile survey data compared to 1996 data at PC-10..................... 16 Figure 12. View from the JFK Causeway GIWW Bridge of location of the data controller/logger/telemetry site and the bottom-mounted ADCP. A double armored cable connects the ADCP to the shore site........................................................................................... 18 Figure 13. Aerial photo showing the location of the ADCP relative to the intersection of existing Packery Channel and the GIWW .................................................................................. 19 Figure 14. Photo of the components of the data controller/logger/telemetry box ..................... 19
vii

Technical Report TAMU-CC-CBI-03-03
BLANK PAGE
viii
Technical Report TAMU-CC-CBI-03-03
EXECUTIVE SUMMARY Report to US Army Engineer Research and Development Center
Coastal & Hydraulics Laboratory
“Monitoring, Analysis and GIS Interpretation of Hydrodynamic and Sediment Transport Systems for Inlets on the Central Texas Coast”
Under USACE Contract No. DACW42-03-C-0042
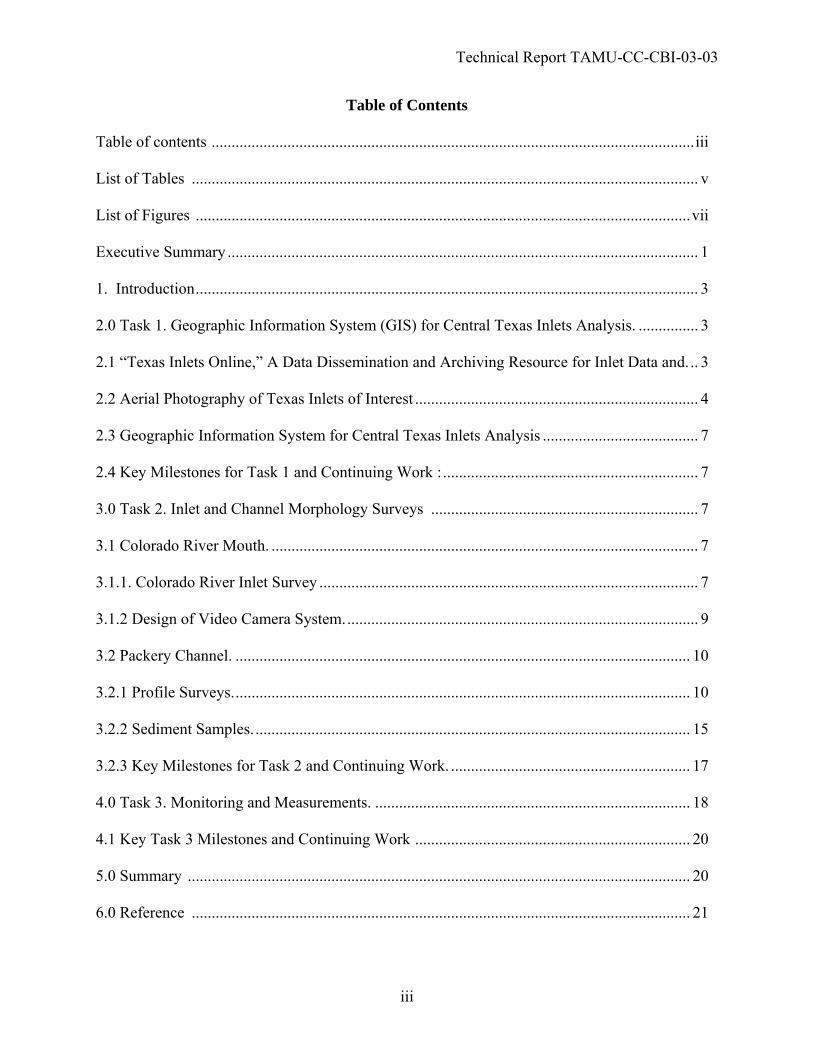
For the Period July 17, 2003 through September 30, 2003 The U.S. Army Corps of Engineers, Engineering Research and Development Center (ERDC), Coastal and Hydraulics Laboratory (CHL), awarded Texas A&M University-Corpus Christi (TAMU-CC), a Minority Institution, a contract (DACW42-03-C-0032) for the period July 17 through September 30, 2005. The project, “Monitoring, Analysis and GIS Interpretation of Hydrodynamic and Sediment Transport Systems for Inlets on the Central Texas Coast” is being performed for the U.S. Army Corps of Engineers, Galveston District, and the Coastal Inlets Research Program (CIRP) conducted at CHL. The purpose of this project is to provide a dynamic local network of research and technical support to compliment Galveston District and CIRP initiatives for monitoring existing inlets and the response of the coast to development of new inlet infrastructure. The project encompasses data collection and analysis in support of present and continuing studies of existing and proposed inlets conducted by the Galveston District and the CIRP (Figure 1). Increased understanding of
Figure 1. Site map of Texas Inlets of interest to CHL.
1

Technical Report TAMU-CC-CBI-03-03
the hydrodynamics and sediment transport of these inlet systems will assist in improving inlet design and channel maintenance, thereby affording significant economic and navigational benefits. This Annual Report covers work performed during July 17 through September 30, 2003 (FY03) by TAMU-CC and its two collaborating sub-recipients, Texas A&M University at Galveston (TAMUG), and the Texas Engineering Experiment Station, Corpus Christi Regional Division (TEES-CC). For this reporting period, the project accomplished all major tasks and subtasks, some of which operate on a continuing basis: Task 1. Geographic Information System for Central Texas Inlets Analysis
• Architecture for a web-based, data-dissemination site was designed, reviewed by CHL and published online. See http://www.cbi.tamucc.edu/ResearchProjects/TexasInletsOnline.
• Population of the website with this project’s data was completed, and mechanisms to facilitate data and imagery dissemination were initiated (continuing).
• Color aerial photographs were obtained for Packery Channel covering the Gulf of Mexico inland to the GIWW.
• Color aerial photographs of Texas Inlets were obtained covering Sabine Pass to the Mouth of the Rio Grande.
• The development of baseline Arc View project in support of GIS for Central Texas Inlets analysis and CHL applications was initiated. Aerial imagery and beach profile survey data collected for Packery Channel serve as the prototype for future project development (continuing).
Task 2. Inlet and Channel Morphology Surveys
• CBI’s survey sea sled was overhauled, reinforced and modularized for assembly on site. • Sled and wading-depth surveys were conducted for 14 profiles, PC-01 through PC-14. • PC-15 and PC-16 located north of Fish Pass Jetty were not surveyed due to deteriorating
weather and damage to the sea sled. • Sediment samples (96) were collected for PC-01 through PC14. • Sediment samples were processed and analyzed. • Data reduction, review, verification, and plotting were completed.
Task 3. Monitoring and Measurements
• An Acoustic Doppler Current Profiler (ADCP) was deployed in the existing Packery Channel close to its intersection with the Gulf Intracoastal Waterway (GIWW).
• Data collected are being stored onsite until a real-time communications link for posting data from the ADCP to the website is established (continuing).
2

Technical Report TAMU-CC-CBI-03-03
1.0 Introduction The U.S. Army Corps of Engineers, Engineering Research and Development Center (ERDC), Coastal and Hydraulics Laboratory (CHL), in collaboration with the U.S. Army Corps of Engineers, Galveston District, awarded Texas A&M University-Corpus Christi (TAMU-CC), a Minority Institution, a contract (DACW42-03-C-0032) for the period July 17 through September 30, 2005, to perform “Monitoring, Analysis and GIS Interpretation of Hydrodynamic and Sediment Transport Systems for Inlets on the Central Texas Coast” for the Coastal Inlets Research Program (CIRP). The purpose of this project is to provide a dynamic local network of research and technical support to compliment CIRP research initiatives for existing inlets and for the potential development of new inlet infrastructure along the Texas coast. Both data collection and analysis are being performed in support of present and continuing studies of existing and proposed inlets as identified by the Galveston District and the CIRP. Increased understanding of the hydrodynamics and sediment transport of these inlet systems could assist in improving inlet design, thereby affording significant economic and navigational benefits. This Annual Report covers work performed during July 17 through September 30, 2003 (FY03) by TAMU-CC and its two collaborating sub-recipients, Texas A&M University at Galveston (TAMUG), and the Texas Engineering Experiment Station, Corpus Christi Regional Division (TEES-CC). For this reporting period, the project accomplished all major tasks and subtasks. This report and all graphics and photographs are presently being made available on the “Texas Inlets Online” website. Because of the quantity of pages of color graphics and photographs, only selected examples are included in this report. 2.0 Task 1. Geographic Information System (GIS) for Central Texas Inlets Analysis Work under Task 1 focused on the three subtasks: 1) development an online data dissemination and archiving resource, called Texas Inlets Online; 2) acquisition of baseline aerial imagery for inlets of interest, as directed by CHL; and 3) development of a GIS (ArcGIS) Geodatabase for archiving and manipulation of imagery and coastal data sets. 2.1 “Texas Inlets Online,” A Data Dissemination and Archiving Resource for Inlet Data and Imagery The architecture and initial population of Texas Inlets Online was completed during August and September of 2003. The site’s front page (Figure 2) complements and will support the CHL website, Inlets Online (http://www.oceanscience.net/inletsonline). CBI’s website was designed using MS FrontPage and will host historic information for all inlets of interest, including coastal data, imagery, reports, topics of interest, and relevant links.
3

Technical Report TAMU-CC-CBI-03-03
4
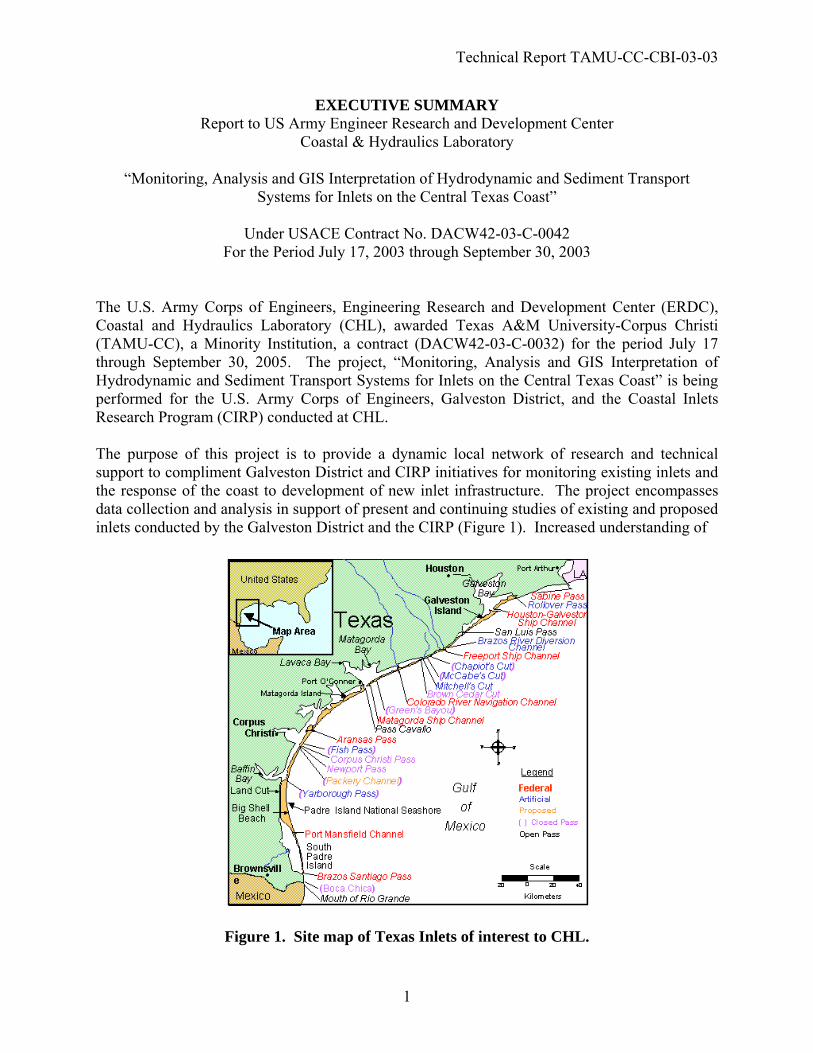
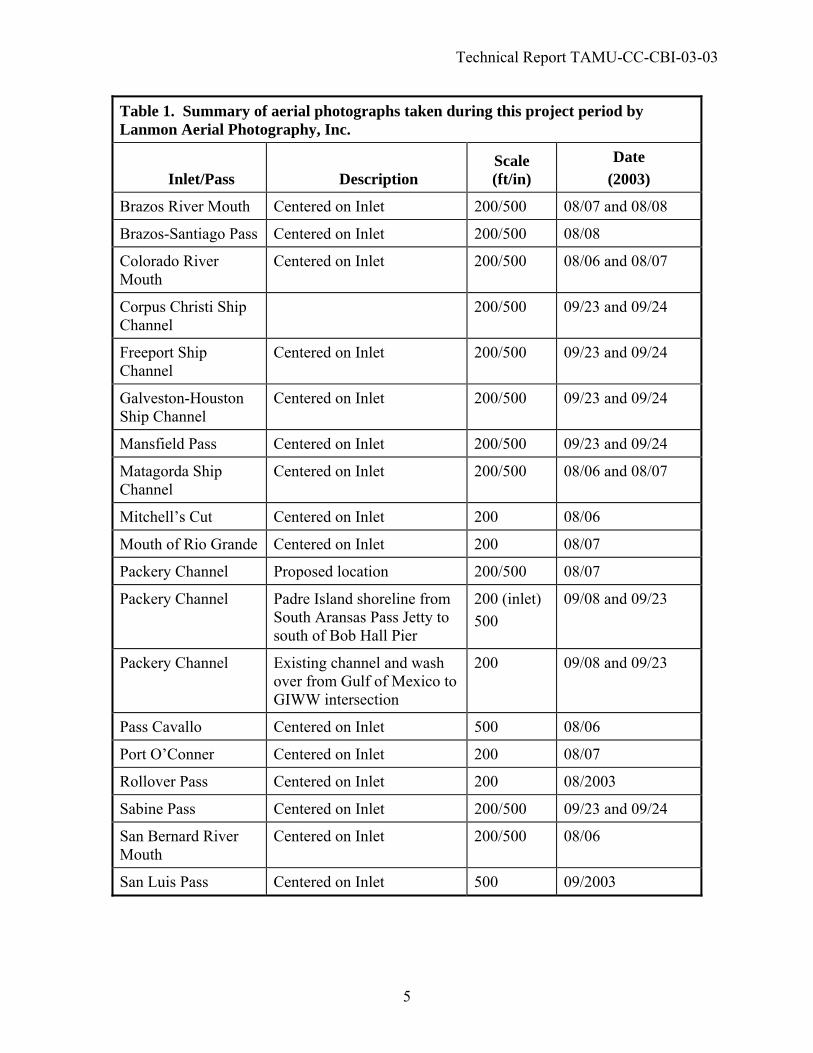
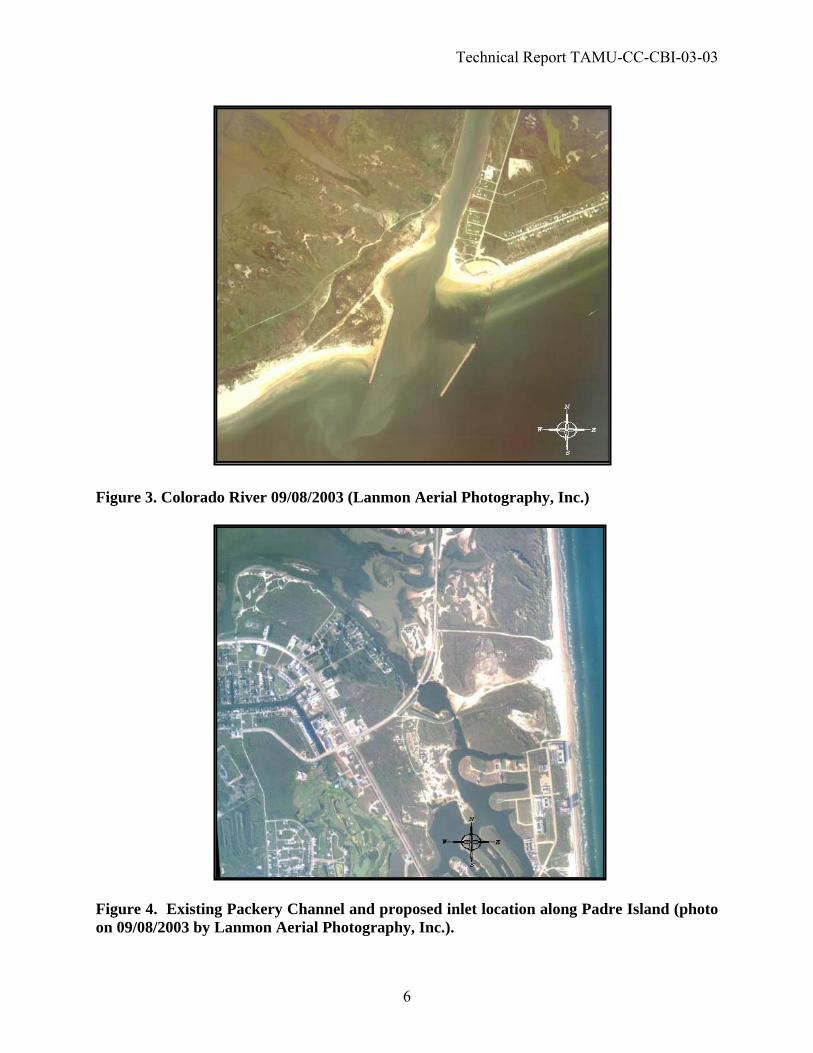
Figure 2. Front page of the Texas Inlets Research site on the CBI website, providing a focal point for data dissemination and archiving of Texas inlet research. See http://www.cbi.tamucc.edu/ResearchProjects/TexasInletsOnline. 2.2 Aerial Photography of Texas Inlets of Interest A comprehensive set of color aerial photographs of Texas inlets (Table 1) was taken during August and September 2003. The image library for Texas inlets will include: rectified images, associated metadata, 36 by 36-inch prints as well as relevant DOQQ images that were applied during image rectification. Metadata for the aerial images will be made available online during FY2004. During fiscal year 2003 both the Colorado River (Figure 3) and Packery Channel (Figure 4) were identified as primary inlets of interest by CHL. Therefore, two sets of photographs were taken of Colorado River mouth (one post- tropical storm season) and a baseline series of photographs were taken from Aransas Pass to just south of Bob Hall Pier prior to the initiation of construction operations of Packery Channel. The Texas Inlets image library will be accessible through the web-based dissemination site, Texas Inlets Online.
Technical Report TAMU-CC-CBI-03-03
Table 1. Summary of aerial photographs taken during this project period by Lanmon Aerial Photography, Inc.
Inlet/Pass Description Scale (ft/in)
Date (2003)
Brazos River Mouth Centered on Inlet 200/500 08/07 and 08/08
Brazos-Santiago Pass Centered on Inlet 200/500 08/08
Colorado River Mouth
Centered on Inlet 200/500 08/06 and 08/07
Corpus Christi Ship Channel
200/500 09/23 and 09/24
Freeport Ship Channel
Centered on Inlet 200/500 09/23 and 09/24
Galveston-Houston Ship Channel
Centered on Inlet 200/500 09/23 and 09/24
Mansfield Pass Centered on Inlet 200/500 09/23 and 09/24
Matagorda Ship Channel
Centered on Inlet 200/500 08/06 and 08/07
Mitchell’s Cut Centered on Inlet 200 08/06
Mouth of Rio Grande Centered on Inlet 200 08/07
Packery Channel Proposed location 200/500 08/07
Packery Channel Padre Island shoreline from South Aransas Pass Jetty to south of Bob Hall Pier
200 (inlet) 500
09/08 and 09/23
Packery Channel Existing channel and wash over from Gulf of Mexico to GIWW intersection
200 09/08 and 09/23
Pass Cavallo Centered on Inlet 500 08/06
Port O’Conner Centered on Inlet 200 08/07
Rollover Pass Centered on Inlet 200 08/2003
Sabine Pass Centered on Inlet 200/500 09/23 and 09/24
San Bernard River Mouth
Centered on Inlet 200/500 08/06
San Luis Pass Centered on Inlet 500 09/2003
5
Technical Report TAMU-CC-CBI-03-03
Figure 3. Colorado River 09/08/2003 (Lanmon Aerial Photography, Inc.)
Figure 4. Existing Packery Channel and proposed inlet location along Padre Island (photo on 09/08/2003 by Lanmon Aerial Photography, Inc.).
6
Technical Report TAMU-CC-CBI-03-03
2.3 Geographic Information System for Central Texas Inlets Analysis An ArcGIS Geodatabase was established to archive all data describing coastal parameters related to inlets of interest. All elevation data collected to date have been processed in the ArcGIS 8.3 environment. These data and the appropriate vector base map layers are stored in the ESRI Personal Geodatabase format of MS Access (*.mdb). This format allows for export of the classic *.shp format. The ongoing GIS effort is in preparation for the migration of all point and vector data into the Enterprise Geodatabase on CBI’s MS sequel Server. This format will allow for importing all the historic, current and future imagery as raster layers in the Geodatabase. The Geodatabase containing the imagery is in place and the implementation of an ArcIMS (Internet Map Server) for this project will be possible and is recommended for more efficient and practical dissemination of complex imagery via Texas Inlets Online. 2.4 Key Milestones for Task 1 and Continuing Work
• Architecture for a web-based, data-dissemination site was designed, reviewed by CHL and published online. See http://www.cbi.tamucc.edu/ResearchProjects/TexasInletsOnline.
• Population of the website with this project’s data was completed, and mechanisms to facilitate data and imagery dissemination were initiated (continuing).
• Color aerial photographs were obtained for Packery Channel covering the Gulf of Mexico inland to the GIWW.
• Color aerial photographs of Texas Inlets were obtained covering Sabine Pass to the Mouth of the Rio Grande.
• The development of baseline Arc View project in support of GIS for Central Texas Inlets analysis and CHL applications was initiated. Aerial imagery and beach profile survey data collected for Packery Channel serve as the prototype for future project development (continuing).
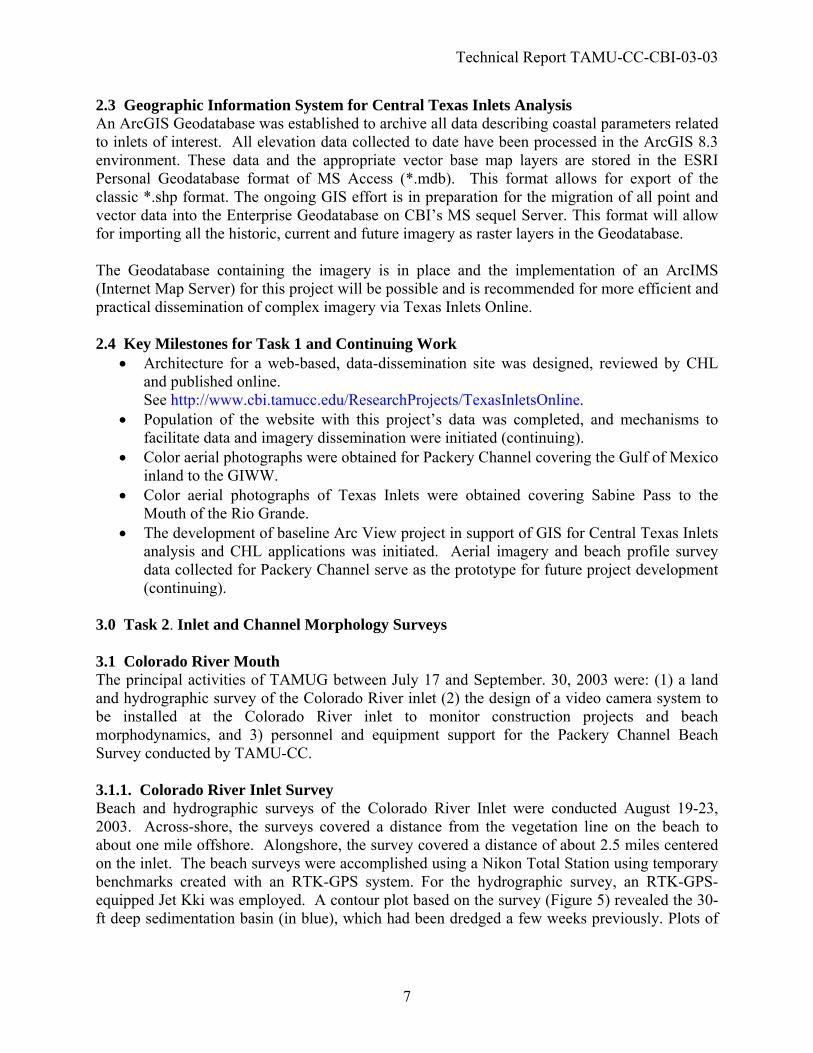
3.0 Task 2. Inlet and Channel Morphology Surveys 3.1 Colorado River Mouth The principal activities of TAMUG between July 17 and September. 30, 2003 were: (1) a land and hydrographic survey of the Colorado River inlet (2) the design of a video camera system to be installed at the Colorado River inlet to monitor construction projects and beach morphodynamics, and 3) personnel and equipment support for the Packery Channel Beach Survey conducted by TAMU-CC. 3.1.1. Colorado River Inlet Survey Beach and hydrographic surveys of the Colorado River Inlet were conducted August 19-23, 2003. Across-shore, the surveys covered a distance from the vegetation line on the beach to about one mile offshore. Alongshore, the survey covered a distance of about 2.5 miles centered on the inlet. The beach surveys were accomplished using a Nikon Total Station using temporary benchmarks created with an RTK-GPS system. For the hydrographic survey, an RTK-GPS-equipped Jet Kki was employed. A contour plot based on the survey (Figure 5) revealed the 30-ft deep sedimentation basin (in blue), which had been dredged a few weeks previously. Plots of
7
Technical Report TAMU-CC-CBI-03-03
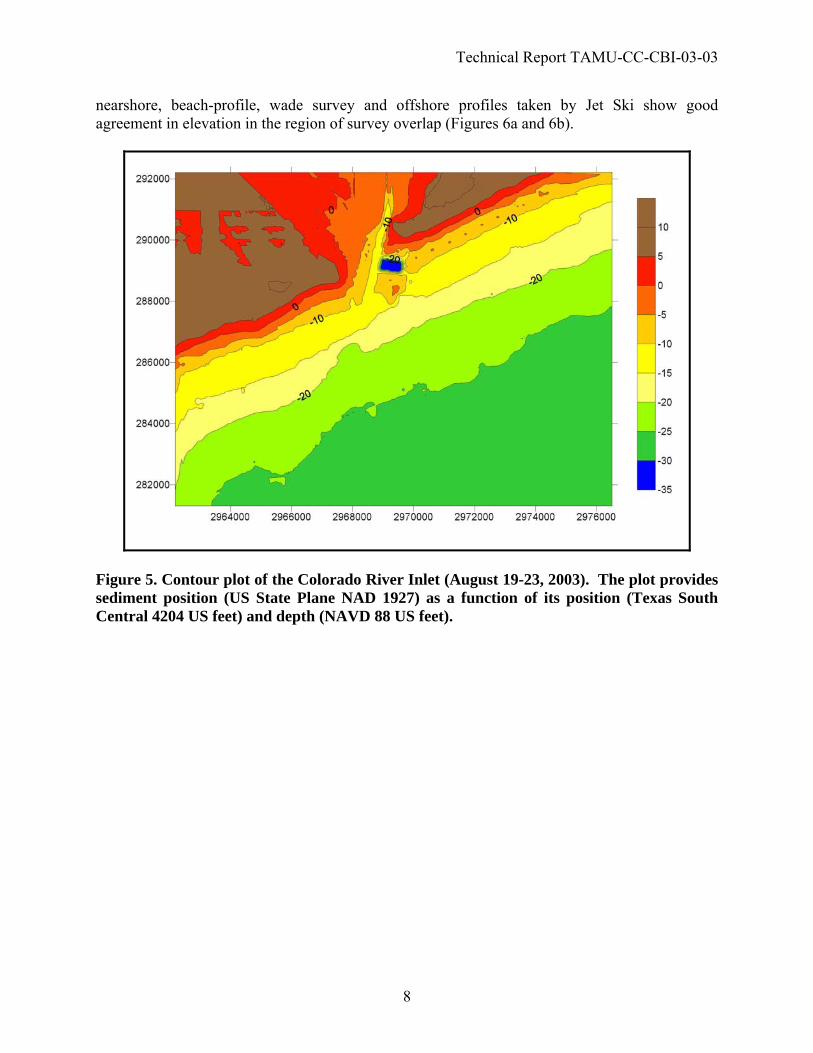
nearshore, beach-profile, wade survey and offshore profiles taken by Jet Ski show good agreement in elevation in the region of survey overlap (Figures 6a and 6b).
Figure 5. Contour plot of the Colorado River Inlet (August 19-23, 2003). The plot provides sediment position (US State Plane NAD 1927) as a function of its position (Texas South Central 4204 US feet) and depth (NAVD 88 US feet).
8
Technical Report TAMU-CC-CBI-03-03
a) Line 15 Beach/Wade Profile
-6-4-202468
10
0 100 200 300 400 500 600
FEET
FEET
b) Line 15 JetSki plus Beach/Wade Profile
-30
-20
-10
0
10
0 1000 2000 3000 4000 5000 6000
FEET
FEE
T
Figure 6. Line 15 profiles. a) Results from topographic survey (beach/wade); b) results from the Jet Ski hydrographic survey plus the beach/wade data. Points overlap between topographic and hydrographic surveys. Depths match very well. Results for lines 13, 14, 16, are like these. 3.1.2 Design of Video Camera System The camera system employs an Axis 2130R Pan/Tilt/Zoom (PTZ). This camera has a Sony 1/4" CCD element with a 2-lux light sensitivity and a 16x optical lens. The camera has a digital resolution of 704 x 480 pixels. The camera has a built in web server and network interface. High-speed, hardware-based, image compression supports high-quality JEPG still images and motion-JPEG video in full color. The camera supports event-triggered actions for remote-image storage via File Transfer Protocol (FTP) and e-mail (SMTP) with time stamp and text overlay. Security is provided through username and password protection. Complete technical information can be found at: http://www.axis.com/documentation/datasheet/2130/2130ds.pdf
9
Technical Report TAMU-CC-CBI-03-03
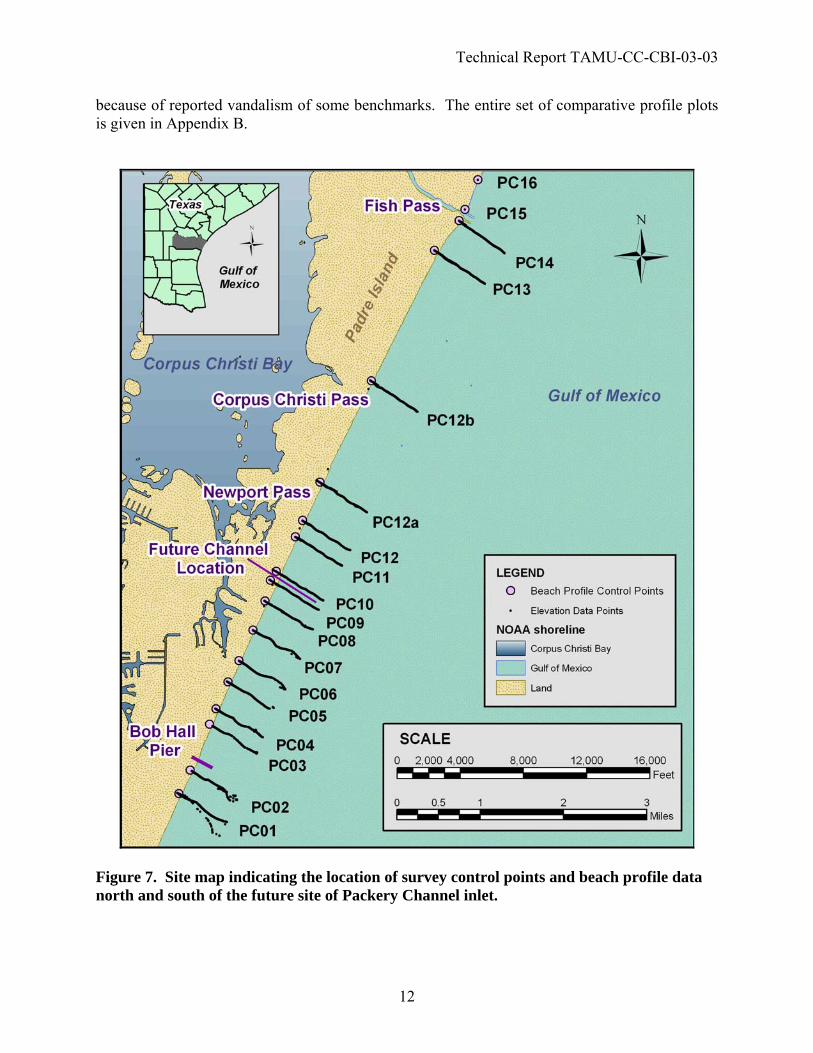
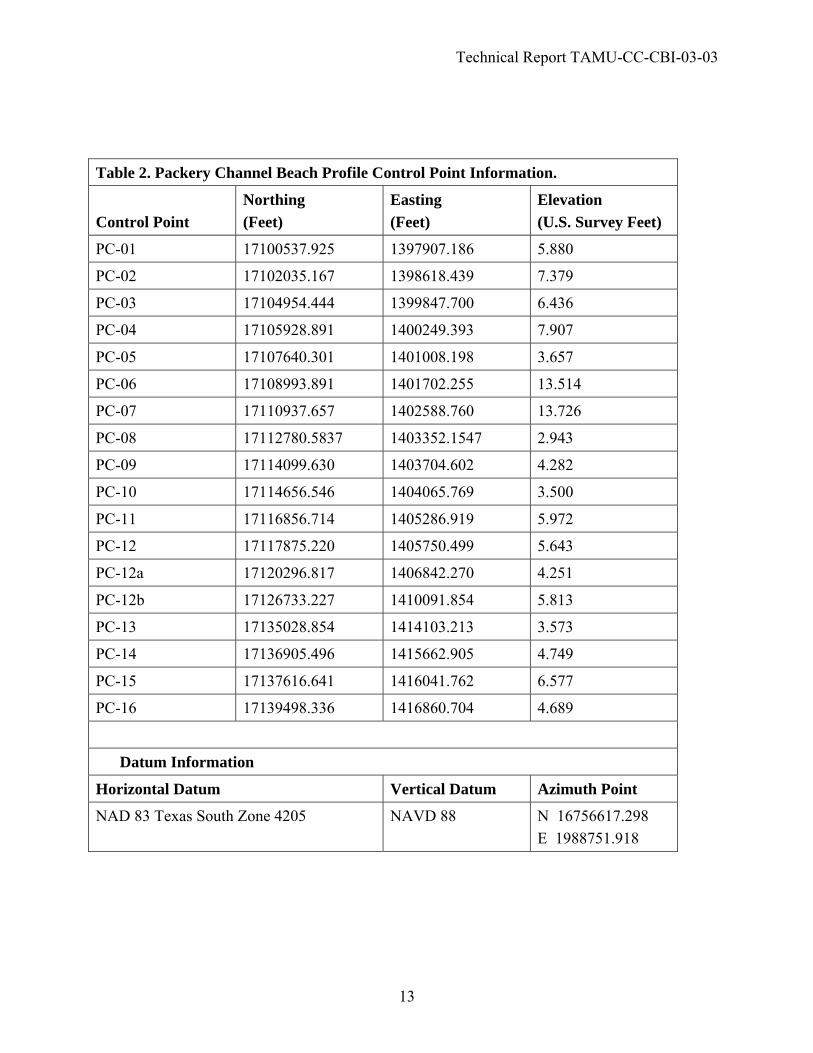
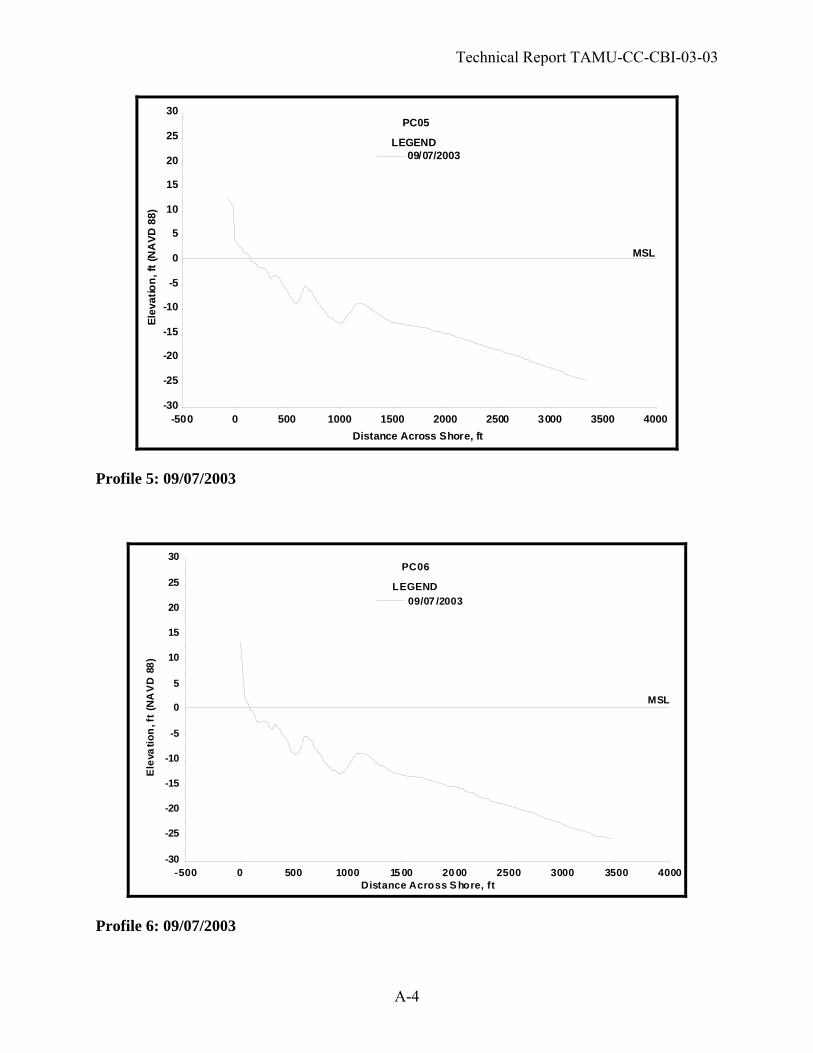
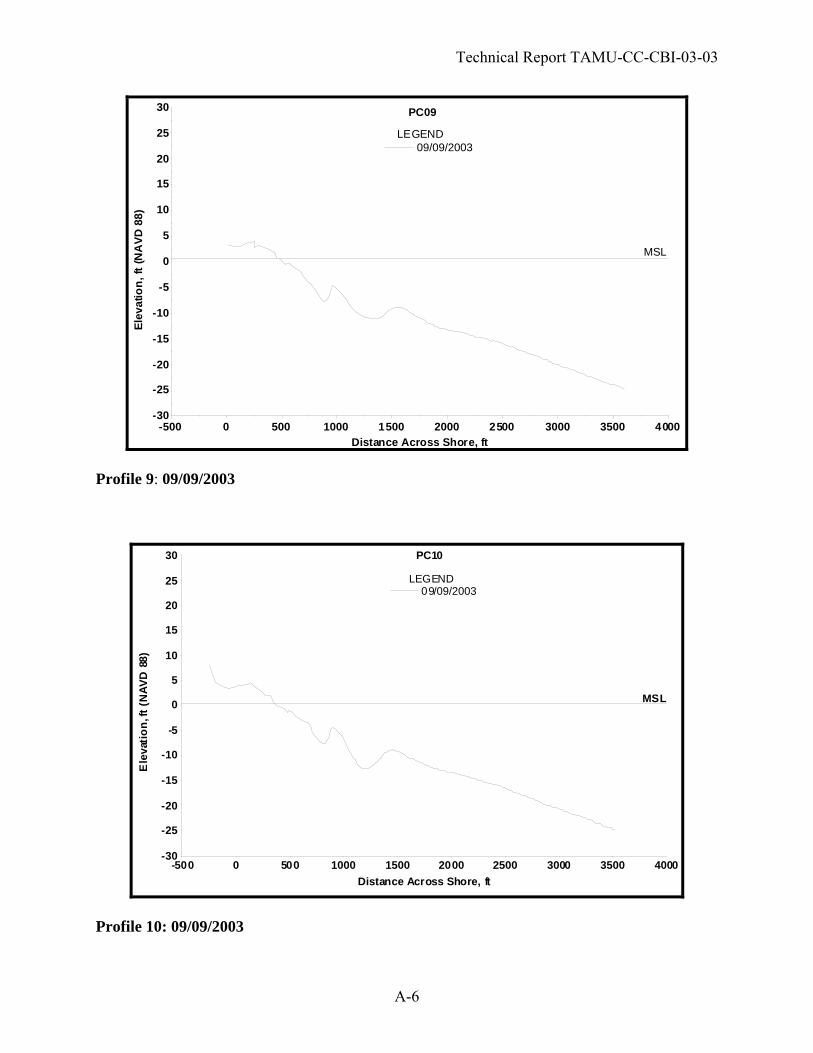
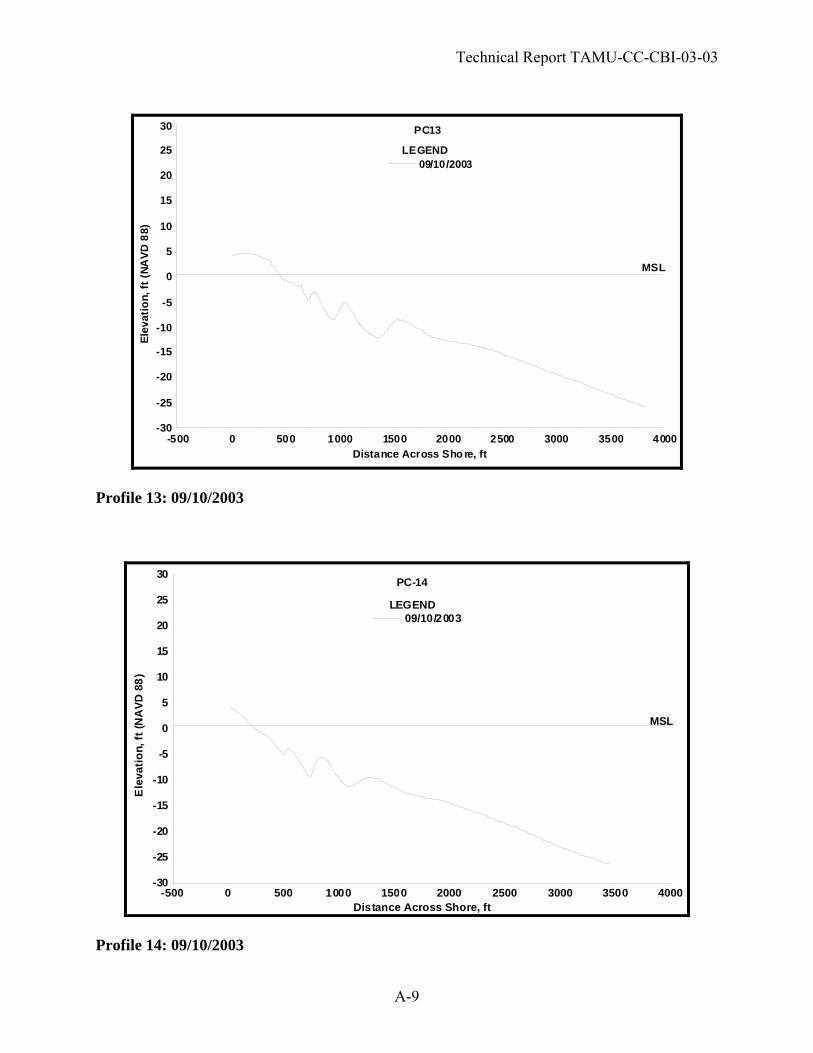
Two Cisco 350 Aironet Wireless Bridge transceivers are employed to bridge the camera network via Wireless Local Area Network (WLAN) with a DSL cable at the Corps of Engineers locks on the Intracoastal Waterway four miles from the camera position at the mouth of the Colorado River in Matagorda County, Texas. The WLAN will use data transfer Network Standard IEEE 802.11b at frequencies of 2.4 to 2.497 GHz. It operates license-free under FCC part 15 and complies as a Class B device. High gain Yagi antennas transmit the data over the 4-mile distance. Complete technical information can be found at http://www.cisco.com/en/US/products/hw/wireless/ps458/products_data_sheet09186a008008883c.html. Although a computer would not be necessary at the locks, a modem or Ethernet connection would be required to access the web. We provide for this connection through a Dell Pentium-4 computer, which also provides hard disc storage of the camera video images on site. The remote power requirements are provided through the use of a 120-watt solar panel, two 50-AH gel batteries and a voltage regulator. The 120-watt solar panel will provide 60-AH of charge on a sunny day, based on six hours of direct sunlight on the panel. With a 20-AH daily usage it will take three sunny days to recharge fully discharged batteries. 3.2 Packery Channel A baseline study of Packery Channel was initiated by the Galveston District and CHL in anticipation of construction activities scheduled to begin September 2003. To capture the pre-construction morphology and sediment conditions, a beach profile survey was performed September 6-16, 2003. The research team included CBI staff supported by a survey team from Frontier Surveying Company and visiting researchers. Dr. Ping Wang of University of South Florida was a primary investigator during the 1996 CBI Packery Channel survey. Dr. Wang and graduate student Mr. David Tidwell participated during the first four days of the 2003 survey to ensure maximum efficiency, data reliability and safety of sea sled operation. In addition, Mr. Randall Thomas from Texas A&M University at Galveston (TAMUG), operating the Jet Ski, performed line and bridle transfers to the boat, sled and shore. 3.2.1 Profile Surveys The beach profile surveys were conducted along the stretch of coast from approximately 5 miles north to 5 miles south of Packery Channel, i.e., control points PC-01 through PC-14 in Figure 7. The southern boundary of the survey lies just south of Bob Hall Pier, and the northern boundary is the southern jetty of Fish Pass at Mustang Island State Park. The spacing of the profile lines is more concentrated around the (to-be-reopened) intersection of Packery Channel with the Gulf of Mexico and the nourished beach located directly adjacent to the inlet. The profile transect locations agree as closely as possible with profile locations occupied during a survey conducted in 1996 by CBI (Kraus and Heilman 1997). Only one of the 1996 control points was relocated (PC-06). To search for the 1996 control locations and to establish new controls in the vicinity of the unrecoverable control points, an RTK differential GPS was utilized, referencing two local base stations for increased accuracy. The locations and elevations of the control points as well as survey datum information are given in Table 2. The beach profile surveys extended from landward of the primary dune (or to other onshore limiting features) to a minimum offshore elevation of -24 ft (NAVD 88). National Ocean
10
Technical Report TAMU-CC-CBI-03-03
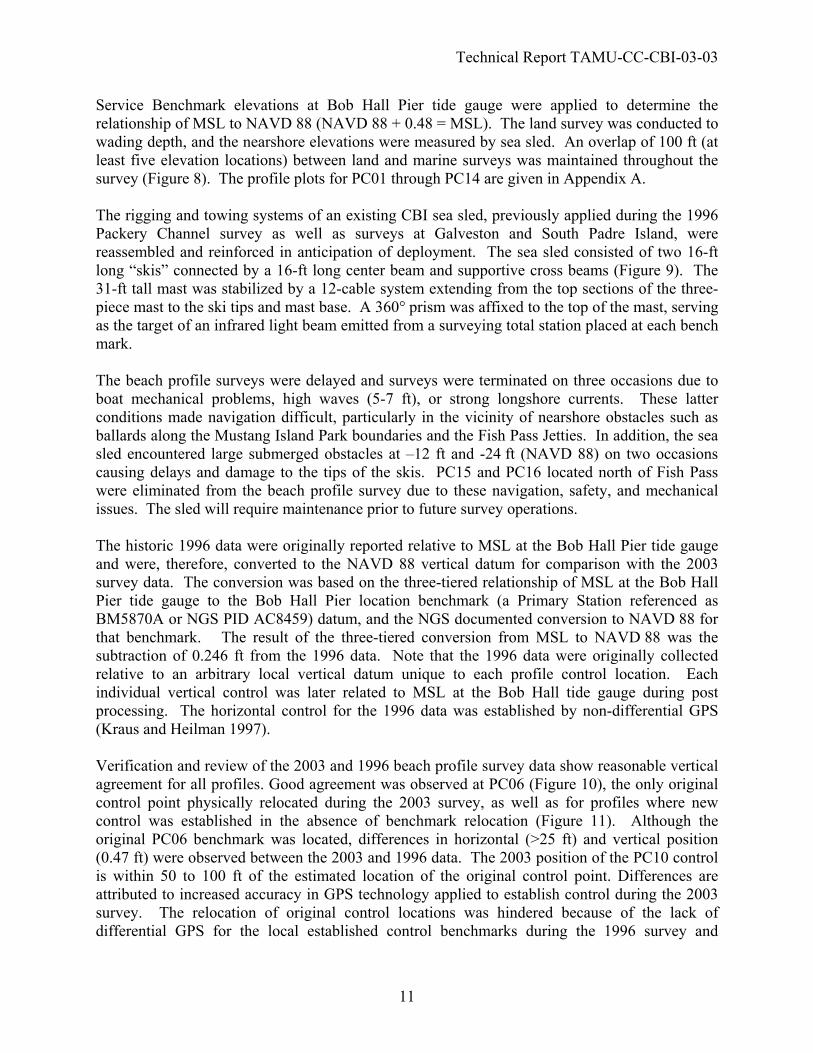
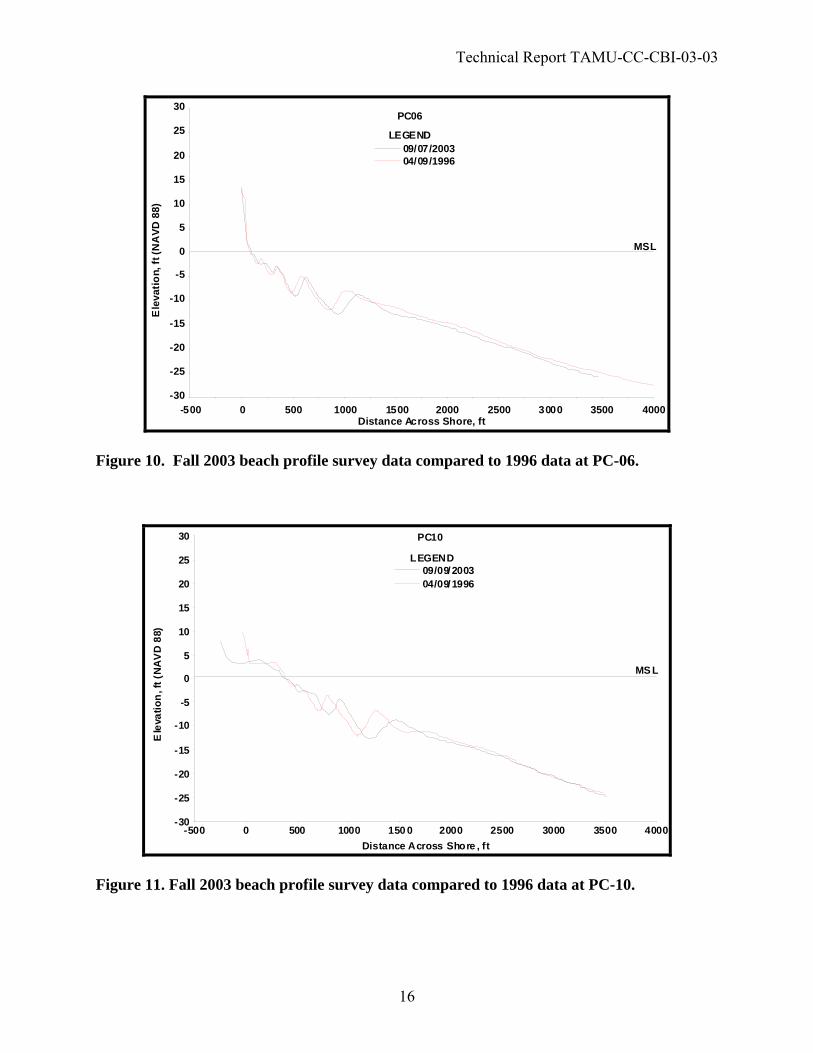
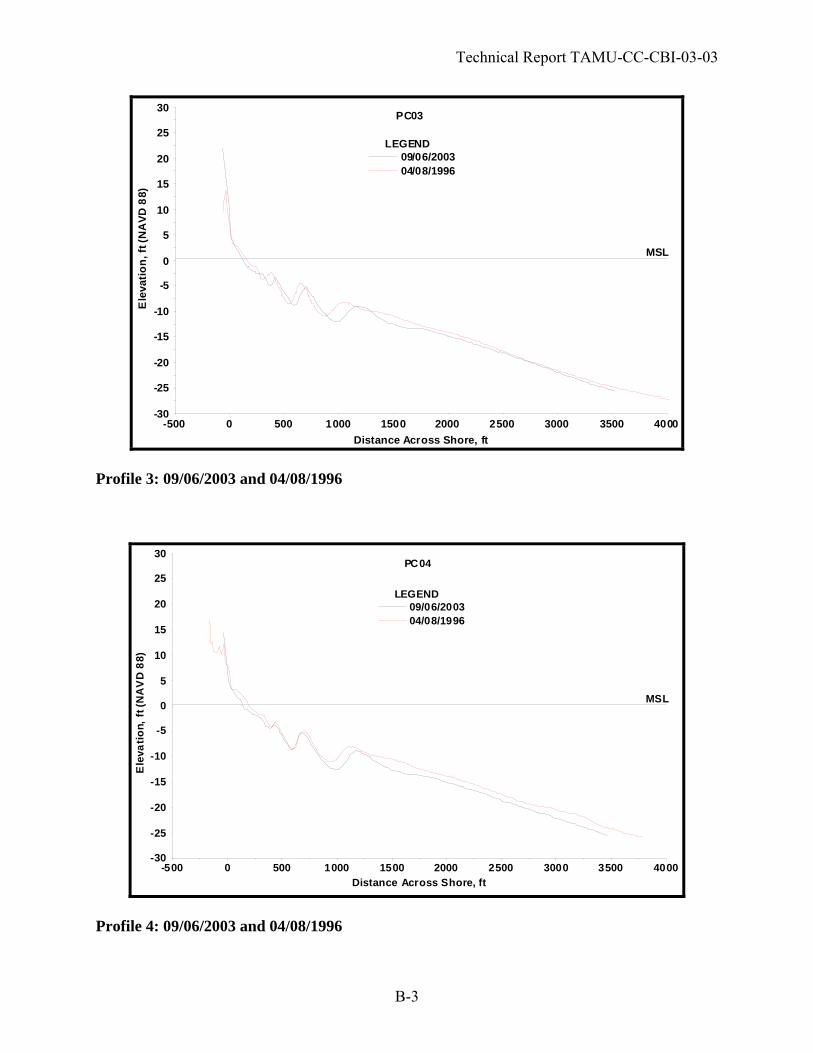
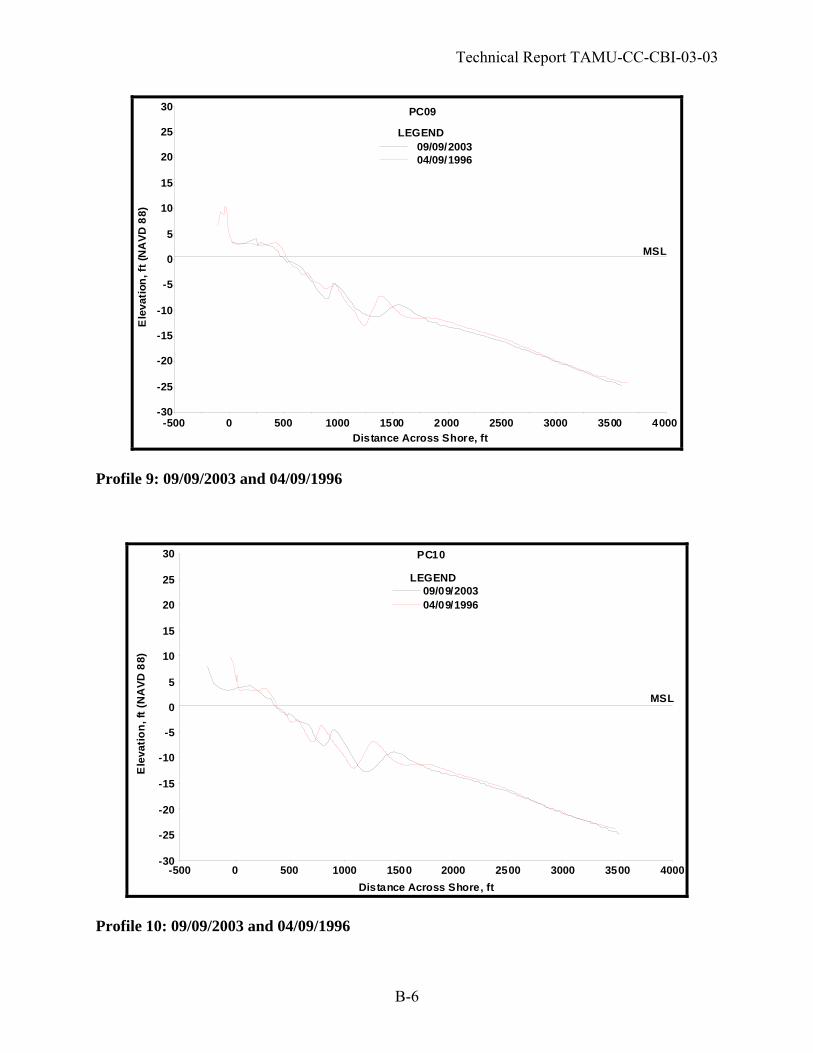
Service Benchmark elevations at Bob Hall Pier tide gauge were applied to determine the relationship of MSL to NAVD 88 (NAVD 88 + 0.48 = MSL). The land survey was conducted to wading depth, and the nearshore elevations were measured by sea sled. An overlap of 100 ft (at least five elevation locations) between land and marine surveys was maintained throughout the survey (Figure 8). The profile plots for PC01 through PC14 are given in Appendix A. The rigging and towing systems of an existing CBI sea sled, previously applied during the 1996 Packery Channel survey as well as surveys at Galveston and South Padre Island, were reassembled and reinforced in anticipation of deployment. The sea sled consisted of two 16-ft long “skis” connected by a 16-ft long center beam and supportive cross beams (Figure 9). The 31-ft tall mast was stabilized by a 12-cable system extending from the top sections of the three-piece mast to the ski tips and mast base. A 360° prism was affixed to the top of the mast, serving as the target of an infrared light beam emitted from a surveying total station placed at each bench mark. The beach profile surveys were delayed and surveys were terminated on three occasions due to boat mechanical problems, high waves (5-7 ft), or strong longshore currents. These latter conditions made navigation difficult, particularly in the vicinity of nearshore obstacles such as ballards along the Mustang Island Park boundaries and the Fish Pass Jetties. In addition, the sea sled encountered large submerged obstacles at –12 ft and -24 ft (NAVD 88) on two occasions causing delays and damage to the tips of the skis. PC15 and PC16 located north of Fish Pass were eliminated from the beach profile survey due to these navigation, safety, and mechanical issues. The sled will require maintenance prior to future survey operations. The historic 1996 data were originally reported relative to MSL at the Bob Hall Pier tide gauge and were, therefore, converted to the NAVD 88 vertical datum for comparison with the 2003 survey data. The conversion was based on the three-tiered relationship of MSL at the Bob Hall Pier tide gauge to the Bob Hall Pier location benchmark (a Primary Station referenced as BM5870A or NGS PID AC8459) datum, and the NGS documented conversion to NAVD 88 for that benchmark. The result of the three-tiered conversion from MSL to NAVD 88 was the subtraction of 0.246 ft from the 1996 data. Note that the 1996 data were originally collected relative to an arbitrary local vertical datum unique to each profile control location. Each individual vertical control was later related to MSL at the Bob Hall tide gauge during post processing. The horizontal control for the 1996 data was established by non-differential GPS (Kraus and Heilman 1997). Verification and review of the 2003 and 1996 beach profile survey data show reasonable vertical agreement for all profiles. Good agreement was observed at PC06 (Figure 10), the only original control point physically relocated during the 2003 survey, as well as for profiles where new control was established in the absence of benchmark relocation (Figure 11). Although the original PC06 benchmark was located, differences in horizontal (>25 ft) and vertical position (0.47 ft) were observed between the 2003 and 1996 data. The 2003 position of the PC10 control is within 50 to 100 ft of the estimated location of the original control point. Differences are attributed to increased accuracy in GPS technology applied to establish control during the 2003 survey. The relocation of original control locations was hindered because of the lack of differential GPS for the local established control benchmarks during the 1996 survey and
11
Technical Report TAMU-CC-CBI-03-03
because of reported vandalism of some benchmarks. The entire set of comparative profile plots is given in Appendix B.
Figure 7. Site map indicating the location of survey control points and beach profile data north and south of the future site of Packery Channel inlet.
12
Technical Report TAMU-CC-CBI-03-03
Table 2. Packery Channel Beach Profile Control Point Information.
Control Point Northing (Feet)
Easting (Feet)
Elevation (U.S. Survey Feet)
PC-01 17100537.925 1397907.186 5.880
PC-02 17102035.167 1398618.439 7.379
PC-03 17104954.444 1399847.700 6.436
PC-04 17105928.891 1400249.393 7.907
PC-05 17107640.301 1401008.198 3.657
PC-06 17108993.891 1401702.255 13.514
PC-07 17110937.657 1402588.760 13.726
PC-08 17112780.5837 1403352.1547 2.943
PC-09 17114099.630 1403704.602 4.282
PC-10 17114656.546 1404065.769 3.500
PC-11 17116856.714 1405286.919 5.972
PC-12 17117875.220 1405750.499 5.643
PC-12a 17120296.817 1406842.270 4.251
PC-12b 17126733.227 1410091.854 5.813
PC-13 17135028.854 1414103.213 3.573
PC-14 17136905.496 1415662.905 4.749
PC-15 17137616.641 1416041.762 6.577
PC-16 17139498.336 1416860.704 4.689
Datum Information
Horizontal Datum Vertical Datum Azimuth Point
NAD 83 Texas South Zone 4205 NAVD 88 N 16756617.298 E 1988751.918
13

Technical Report TAMU-CC-CBI-03-03
Figure 8. Overlap of sled/wade survey of greater that 100 ft as observed on profile PC-05.
Figure 9. Sea sled preparation during survey of PC-04 located north of Bob Hall Pier.
14

Technical Report TAMU-CC-CBI-03-03
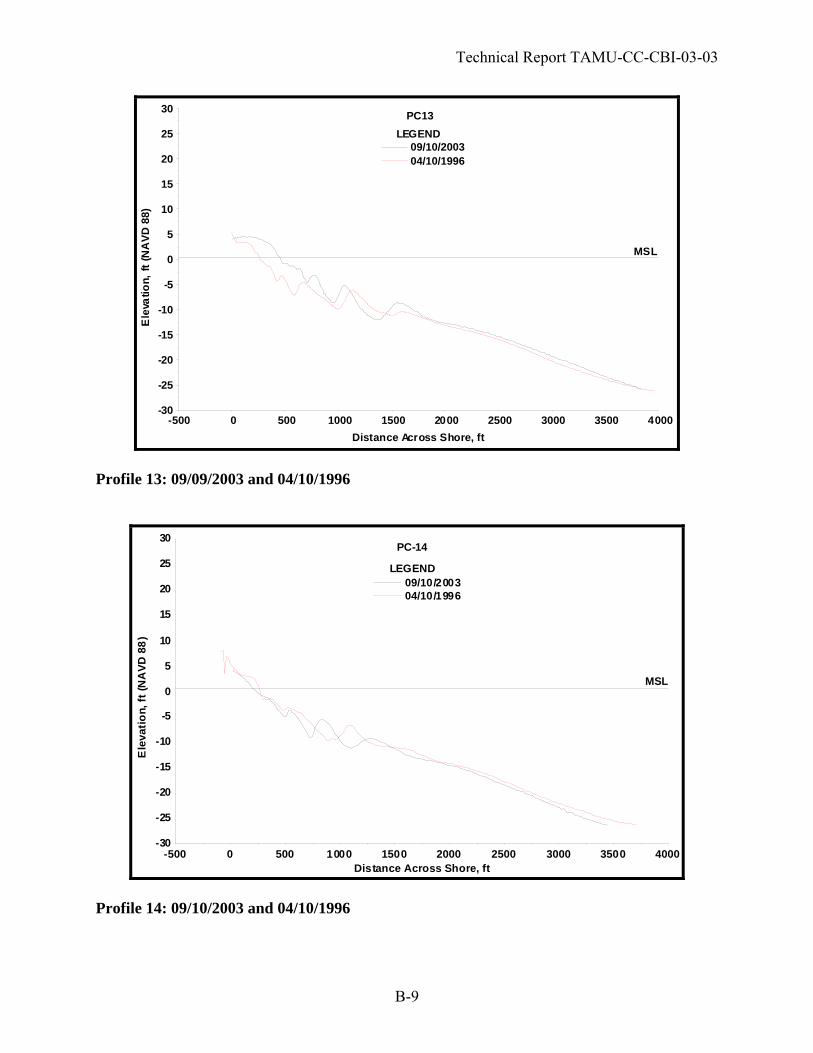
The comparison plots of the 1996 and 2003 profile data indicate significant change in the backshore features such as dune toe position (Appendix B). The region from PC01 to PC10 has experienced a large amount of mechanical sand manipulation. The dune toe shown by the 2003 data indicates the seaward extent of the mechanically placed dunes. These dune features in some cases had been “placed” days in advance of the 2003 profile survey and, therefore, do not reflect dune accretion by natural processes. The placement of piles of sand and beach debris (generally seaweed) at the existing dune toe is standard practice in this area in an effort to combine routine beach cleaning and maintenance with dune reinforcement. Furthermore, Christmas trees are seasonally deposited along the dune toe to aid in sand accretion. In addition, the data show a region of significant sand accretion at the landward extreme of profile PC13. This profile is located on Mustang Island State Park in the center of the park facilities. Nearly all of the park picnic tables and benches were completely covered by sand at the time of the 2003 survey. Wind driven transport and extended periods of higher-than-average water levels are likely responsible for the accretion observed in this area. 3.2.2 Sediment Samples Sediment samples were collected at six locations along each profile (dune toe, mid berm, shoreline, and -3 ft, -12 ft, and -24 ft elevations). Ninety-six sediment samples were collected among the 16 profiles. Sediment grain size analysis was conducted according to standard sediment processing and sieving methodology (Mason and Folk, 1958; Folk, 1976). Sediment samples were desalted and mechanically sieved (Ro-Tap machine) at 0.25-Phi increments for 15 minutes. Sediment analysis showed consistency in grain size characteristics at onshore locations for all profiles with variability increasing at nearshore and offshore locations throughout the study site. The Coastal Engineering and Design System (CEDAS) software Automated Coastal Engineering System (ACES) was applied to determine statistical parameters describing grain size distribution (median, mode and inclusive graphic standard deviation). Statistical analysis followed methods described by Folk and Ward (1957), Mason and Folk (1958) and Folk (1976). Inclusive graphic standard deviation is a measure of sorting that has been applied to describe the sediments of Mustang Island (Mason and Folk, 1958) and is defined as: σI = ø84 – ø16 + ø95 – ø5 ; 4 6.6 Where ø = grain size (Phi)
15
Technical Report TAMU-CC-CBI-03-03
-500 0 500 1000 1500 2000 2500 3000 3500 4000-30
-25
-20
-15
-10
-5
0
5
10
15
20
25
30
MSL
PC06
Ele
vatio
n, ft
(NA
VD 8
8)
Distance Across Shore, ft
LEGEND 09/07/2003 04/09/1996
Figure 10. Fall 2003 beach profile survey data compared to 1996 data at PC-06.
-500 0 500 1000 150 0 2000 2500 3000 3500 4000-30
-25
-20
-15
-10
-5
0
5
10
15
20
25
30
MS L
PC10
Ele
vatio
n, f
t (N
AV
D 8
8)
Distance Across Shore , ft
LEGEND 09/09/2003 04/09/1996
Figure 11. Fall 2003 beach profile survey data compared to 1996 data at PC-10.
16

Technical Report TAMU-CC-CBI-03-03
This formula includes 90% of the distribution and is the best overall measure of sorting (Folk 1974). A classification system for sorting defined by the inclusive graphic standard deviation is given in Table 3.
Table 3. Sorting classification system for inclusive graphic standard deviation σ
IClassification
< 0.35 Very well sorted 0.35-0.50 Well sorted 0.50-0.71 Moderately well sorted 0.71-1.00 Moderately sorted 1.00-2.00 Poorly sorted 2.00-4.00 Very poorly sorted > 4.00 Extremely poorly sorted
The data show that the sediment found at the most offshore locations (-24 ft) was composed of, moderately sorted sand (m = 0.60ø) and that sorting improved as the dune toe was approached, which had the best sorting (m = 0.24ø). The sediment in the study area was classified as Fine Sand with a median grain size ranging from 0.14 mm (-4 ft) to 0.17 mm (shoreline to dune toe). Data indicate a trend of finer sand progressively offshore. Table 4 summarizes the mean and range of values determined for all profiles (PC01-PC14) at the location indicated. A more detailed account of grain size statistics is given in Table C1 (Appendix C).
Table 4. Summary of Grain Size Statistics for Profiles (PC01-PC14) Median Grain Size (mm) Inclusive Graphic Standard Deviation (ø) Location Range Mean Range Mean Toe of Dune
0.14-0.16 0.15 0.22-0.30 0.24
Mid Berm 0.14-0.17 0.15 0.20-0.34 0.28 Shoreline 0.14-0.17 0.15 0.22-0.66 0.36 - 3 ft 0.14-0.16 0.14 0.21-0.48 0.34 -12 ft 0.11-0.15 0.14 0.17-0.63 0.37 -24 ft 0.11-0.15 0.13 0.24-0.97 0.60
3.2.3. Key milestones for Task 2 and continuing work
• TAMUG completed land and hydrographic surveys of the Colorado River inlet. • TAMUG designed a video camera system to be installed at the Colorado River inlet to
monitor construction projects and beach morphodynamics. • TAMUG supplied personnel and equipment support to TAMU-CC for the Packery
Channel Beach Survey. • (TAMU-CC) Construction, reinforcement and assembly on site of the sea sled were
completed. • (TAMU-CC) Sled and wading depth surveys were conducted for 16 profiles, PC-01
through PC-14. • (TAMU-CC) PC-15 and PC-16 located north of Fish Pass Jetty were not surveyed due to
deteriorating weather, sea conditions and a damaged sea sled.
17

Technical Report TAMU-CC-CBI-03-03
• (TAMU-CC) Sediment samples (96) were collected for PC-01 through PC14. • (TAMU-CC) Sediment sample processing and analysis were completed. • (TAMU-CC) Data reduction, review, verification and plotting were completed.
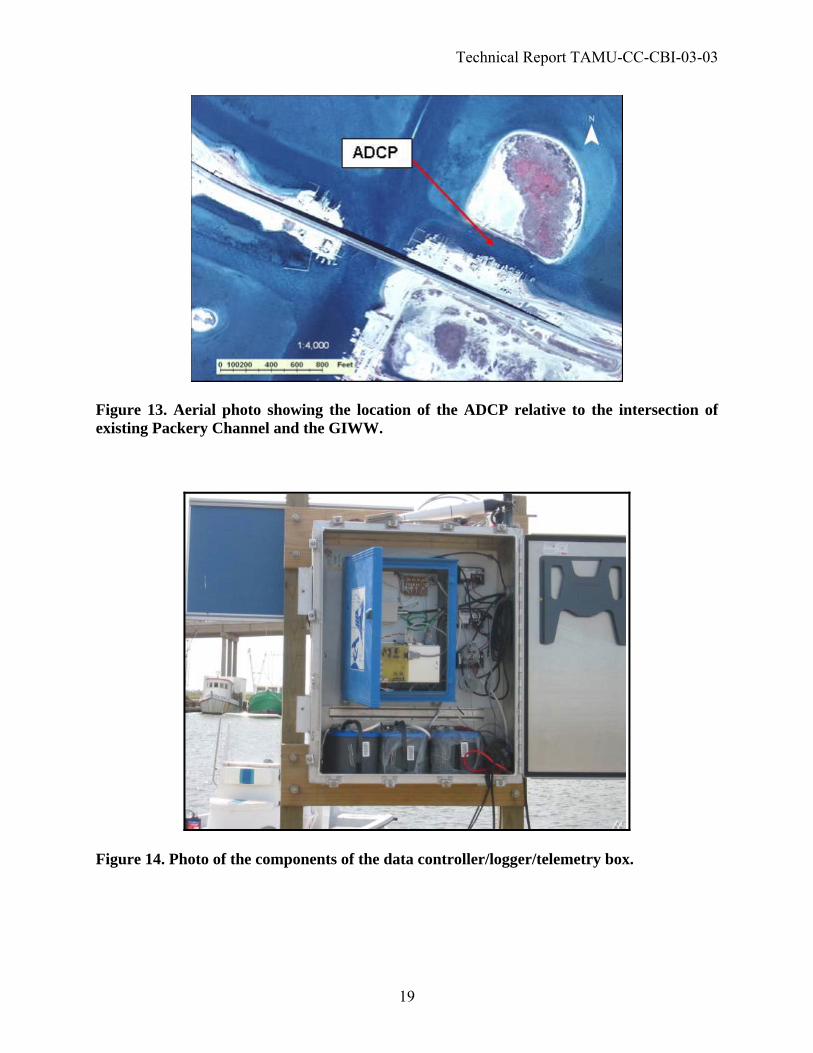
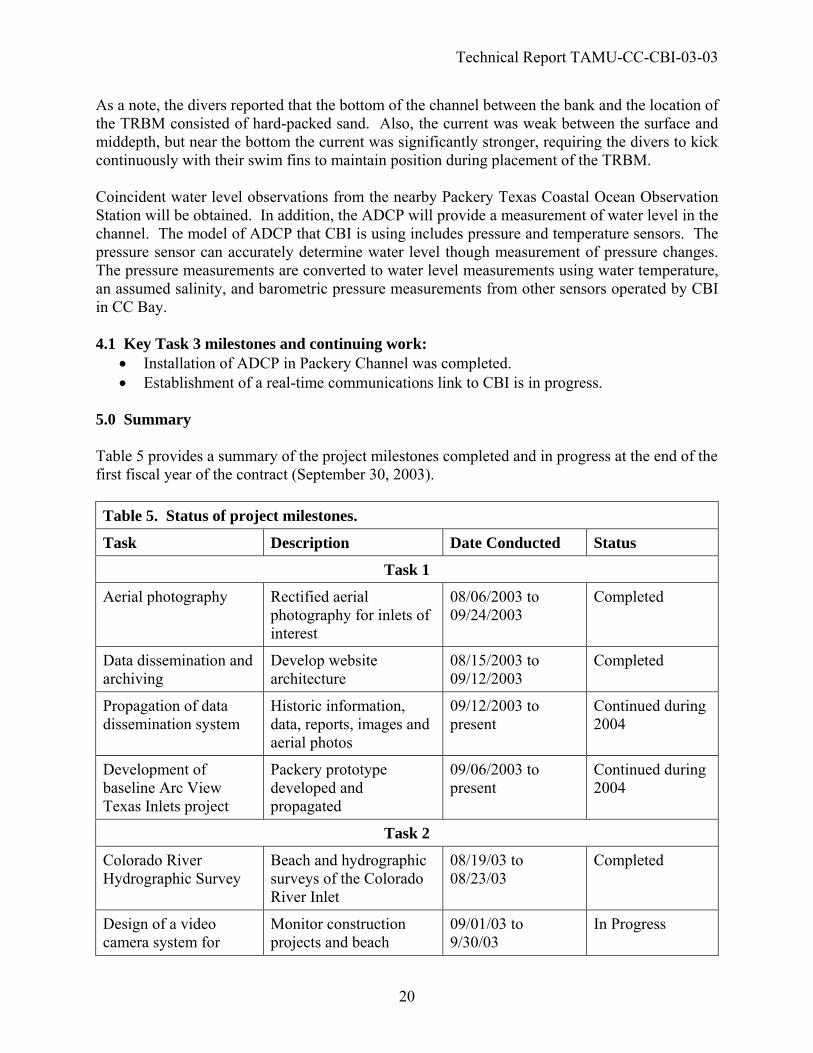
4.0 Task 3. Monitoring and Measurements On September 30, 2003, the TEES-CC component of this project began installation of a bottom-mounted 1200-kHz RDI Monitor Work Horse ADCP in the existing Packery Channel near its intersection with the GIWW (see Figures 12 and 13). The ADCP monitors the vertical profile of horizontal currents. It is located near the middle of the channel in about 9-ft water depth in a trawl-resistant-bottom-mount (TRBM) to protect it from normal ship traffic in the channel. The ADCP is configured to sample 5-min averages in 0.2-m depth bins. The current velocity profile data are transmitted through a double-armored cable to a nearby remote site, which provides data control and storage (Figure 14). Various real-time telemetry pathways to CBI were tested. The most successful was found to be a radio link from the Packery Channel site to CBI’s Shoreline Environmental Research Facility (SERF) located on Flour Bluff, where the data are then transferred by T1 ethernet cable to CBI. Storage at the nearby remote site secures the data in the event the instrument or transmission link is lost. Transmission of the data to CBI provides additional backup, permits continuous QA/QC, and allows some preliminary data analysis if requested. Wind speed and direction measurements will also be collected at the remote site during the next fiscal year.
Figure 12. View from the JFK Causeway GIWW bridge of location of the data controller/logger/telemetry site and the bottom-mounted ADCP. A double armored cable connects the ADCP to the shore site.
18
Technical Report TAMU-CC-CBI-03-03
Figure 13. Aerial photo showing the location of the ADCP relative to the intersection of existing Packery Channel and the GIWW.
Figure 14. Photo of the components of the data controller/logger/telemetry box.
19
Technical Report TAMU-CC-CBI-03-03
As a note, the divers reported that the bottom of the channel between the bank and the location of the TRBM consisted of hard-packed sand. Also, the current was weak between the surface and middepth, but near the bottom the current was significantly stronger, requiring the divers to kick continuously with their swim fins to maintain position during placement of the TRBM. Coincident water level observations from the nearby Packery Texas Coastal Ocean Observation Station will be obtained. In addition, the ADCP will provide a measurement of water level in the channel. The model of ADCP that CBI is using includes pressure and temperature sensors. The pressure sensor can accurately determine water level though measurement of pressure changes. The pressure measurements are converted to water level measurements using water temperature, an assumed salinity, and barometric pressure measurements from other sensors operated by CBI in CC Bay. 4.1 Key Task 3 milestones and continuing work:
• Installation of ADCP in Packery Channel was completed. • Establishment of a real-time communications link to CBI is in progress.
5.0 Summary Table 5 provides a summary of the project milestones completed and in progress at the end of the first fiscal year of the contract (September 30, 2003). Table 5. Status of project milestones.
Task Description Date Conducted Status
Task 1
Aerial photography Rectified aerial photography for inlets of interest
08/06/2003 to 09/24/2003
Completed
Data dissemination and archiving
Develop website architecture
08/15/2003 to 09/12/2003
Completed
Propagation of data dissemination system
Historic information, data, reports, images and aerial photos
09/12/2003 to present
Continued during 2004
Development of baseline Arc View Texas Inlets project
Packery prototype developed and propagated
09/06/2003 to present
Continued during 2004
Task 2
Colorado River Hydrographic Survey
Beach and hydrographic surveys of the Colorado River Inlet
08/19/03 to 08/23/03
Completed
Design of a video camera system for
Monitor construction projects and beach
09/01/03 to 9/30/03
In Progress
20
Technical Report TAMU-CC-CBI-03-03
Colorado River inlet morphodynamics 09/01/03 to 9/30/03
(50% complete)
Provide personnel and equipment support for TAMUCC survey
One experienced person and Jet Ski to assist in Packery Channel survey
09/06/2003 to 09/16/2003
Completed
Packery Channel Beach profile survey (Baseline Fall 2003)
16 Beach profile surveys and sediment samples at Packery Channel
09/06/2003 to 09/16/2003
Completed
Verification and review of Packery Channel survey data
Data reduction, verification and graphical display against previous data
08/07/2003 to present
Completed
Sediment Processing Washing, drying, sieving samples
09/17/2003-12/30/2003
Completed
Sediment Analysis Statistical analysis 09/30/2003-12/30/2003
Completed
Task 3
Installation of Monitoring Station at intersection of Packery Channel and GIWW
Station constructed and ADCP deployed
09/30/2003 Completed
Establishment of real-time link to CBI database and website
Ensure reliability of data collection and archiving
9/30/03 to present
In Progress (10% complete)
6.0 Reference Folk, R.L. and W.C. Ward, 1957. Brazos River bar: a study in the significance of grain size
parameters: Journal of Sedimentary Petrology, Vol. 27, pp. 3-26. Folk, R.L., 1974. Petrology of Sedimentary Rocks. Hemphill Publishing Company, Austin,
Texas, 182 p. Kraus, N.C. and D.J. Heilman, 1997. Packery Channel Feasibility Study: Inlet Functional
Design and Sand Management, Report 1 of a Two-Part Series, Final Report. Technical Report: TAMU-CC-CBI-96-06, Prepared for Naismith Engineering, Inc., 106 p.
Mason, C.C and R.L. Folk, 1958. Differentiation of Beach, Dune, and Aeolian Flat
Environments by Size Analysis, Mustang Island, Texas. Journal of Sedimentary Petrology, Vol. 28, No. 2, pp. 211-226.
21

Technical Report TAMU-CC-CBI-03-03
BLANK PAGE
22

Technical Report TAMU-CC-CBI-03-03
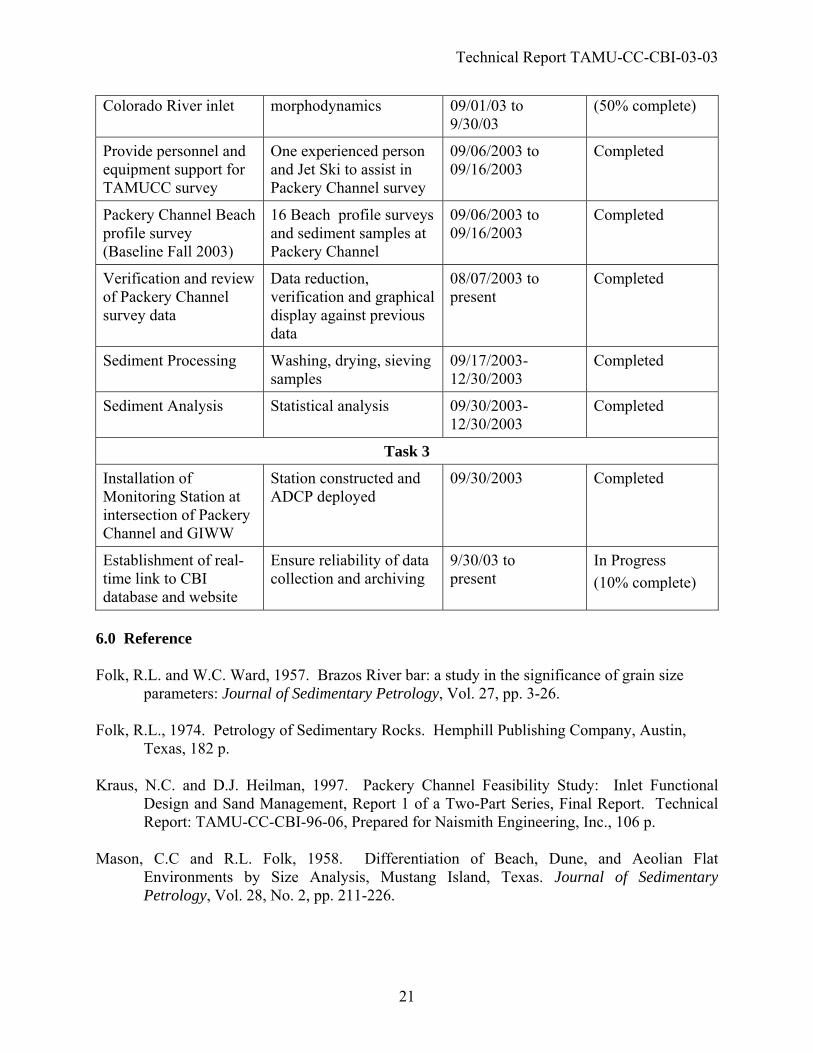
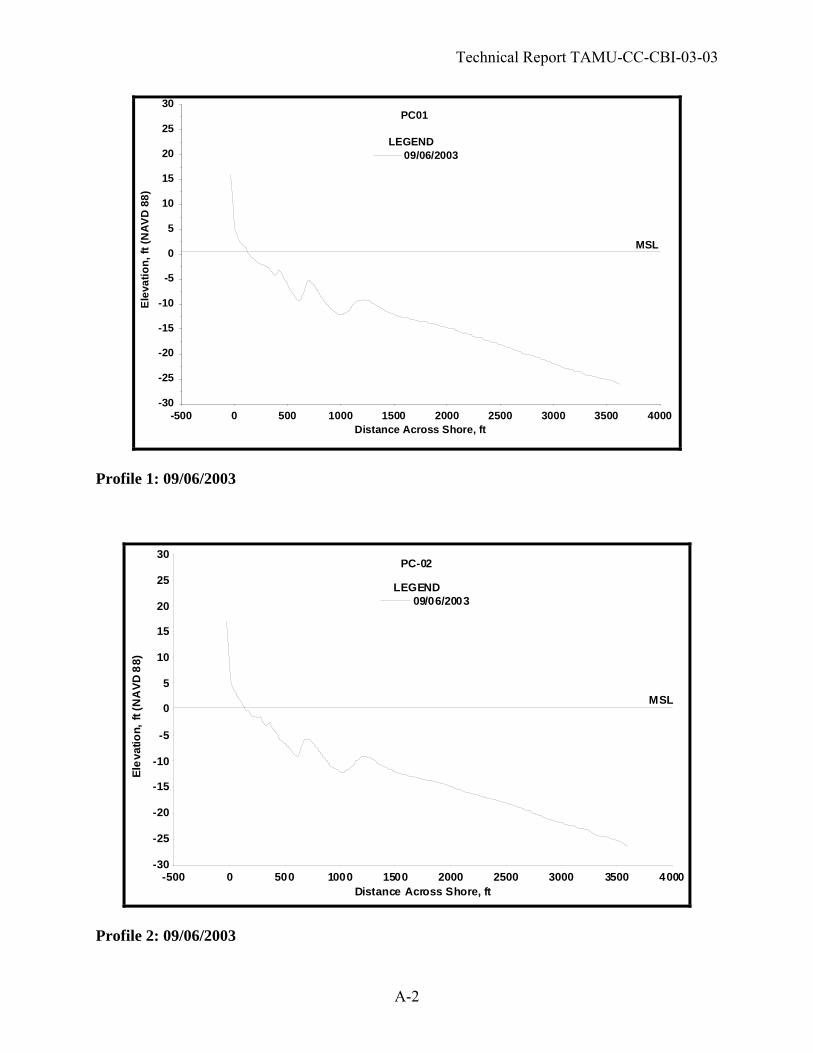
APPENDIX A: Plots of Profile Surveys, September 2003
This section presents plots of the beach survey profiles collected during September 2003. The locations of the profiles are shown in Figure 7 in the main text.
A-1
Technical Report TAMU-CC-CBI-03-03
-500 0 500 1000 1500 2000 2500 3000 3500 4000-30
-25
-20
-15
-10
-5
0
5
10
15
20
25
30
MSL
PC01
Elev
atio
n, ft
(NAV
D 8
8)
Distance Across Shore, ft
LEGEND 09/06/2003
Profile 1: 09/06/2003
-500 0 500 1000 1500 2000 2500 3000 3500 4000-30
-25
-20
-15
-10
-5
0
5
10
15
20
25
30
MSL
PC-02
Elev
atio
n, ft
(NA
VD 8
8)
Distance Across Shore, ft
LEGEND 09/06/2003
Profile 2: 09/06/2003
A-2

Technical Report TAMU-CC-CBI-03-03
-500 0 500 1000 1500 2 00 0 25 00 3 000 350 0 40 00-30
-25
-20
-15
-10
-5
0
5
10
15
20
25
30
MS L
PC0 3
Ele
vatio
n, f
t (N
AV
D 8
8)
Distance Acros s S hore, ft
LEGE ND 0 9/06/2003
Profile 3: 09/06/2003
-500 0 500 1000 1500 2000 2500 3000 3500 4000-30
-25
-20
-15
-10
-5
0
5
10
15
20
25
30
MSL
PC04
Elev
atio
n, ft
(NA
VD 8
8)
Distance Across Shore, ft
LEGEND 09/06/2003
Profile 4: 09/06/2003
A-3
Technical Report TAMU-CC-CBI-03-03
-500 0 500 1000 1500 2000 2500 3000 3500 4000-30
-25
-20
-15
-10
-5
0
5
10
15
20
25
30
MSL
PC05
Elev
atio
n, ft
(NA
VD 8
8)
Distance Across Shore, ft
LEGEND 09/07/2003
Profile 5: 09/07/2003
-500 0 500 1000 15 00 20 00 2500 3000 3500 4000-30
-25
-20
-15
-10
-5
0
5
10
15
20
25
30
MSL
PC06
Ele
vatio
n, f
t (N
AV
D 8
8)
Distance Across S hore, ft
LEGEND 09/07 /2003
Profile 6: 09/07/2003
A-4

Technical Report TAMU-CC-CBI-03-03
-500 0 500 1000 1500 2000 2500 3000 3500 4000-30
-25
-20
-15
-10
-5
0
5
10
15
20
25
30
MSL
LEGEND 09/07/2003 04/09/1996
PC07
Elev
atio
n, ft
(NAV
D 8
8)
Distance Across Shore, ft Profile 7: 09/07/2003
-500 0 500 1000 1500 2000 2500 3000 3500 4000-30
-25
-20
-15
-10
-5
0
5
10
15
20
25
30
MSL
LEGEND 09/09/2003
PC08
Elev
atio
n, ft
(NAV
D 8
8)
Distance Across Shore, ft Profile 8: 09/07/2003
A-5
Technical Report TAMU-CC-CBI-03-03
-500 0 500 1000 1500 2000 2500 3000 3500 4000-30
-25
-20
-15
-10
-5
0
5
10
15
20
25
30
MSL
PC09
Elev
atio
n, ft
(NA
VD 8
8)
Distance Across Shore, ft
LEGEND 09/09/2003
Profile 9: 09/09/2003
-500 0 500 1000 1500 2000 2500 3000 3500 4000-30
-25
-20
-15
-10
-5
0
5
10
15
20
25
30
MSL
PC10
Ele
vatio
n, ft
(NAV
D 8
8)
Distance Across Shore, ft
LEGEND 09/09/2003
Profile 10: 09/09/2003
A-6

Technical Report TAMU-CC-CBI-03-03
-500 0 500 1000 1500 2000 2500 3000 3500 4000-30
-25
-20
-15
-10
-5
0
5
10
15
20
25
30
MSL
PC11
LEGEND 09/09/2003
Ele
vatio
n, ft
(NA
VD
88)
Distance Across Shore, ft
Profile 11: 09/09/2003
-500 0 500 1000 1500 2000 2500 3000 3500 4000-30
-25
-20
-15
-10
-5
0
5
10
15
20
25
30
MSL
PC12
Elev
atio
n, ft
(NAV
D 8
8)
Distance Across Shore, ft
LEGEND 09/09/2003
Profile 12: 09/09/2003
A-7

Technical Report TAMU-CC-CBI-03-03
-500 0 500 100 0 1500 2000 25 00 3000 35 00 40 00-30
-25
-20
-15
-10
-5
0
5
10
15
20
25
30
MS L
PC 12a
Ele
vati
on, f
t (N
AVD
88)
Dis ta nce Ac ross Shore, ft
LE GEND 09 /09/200 3
Profile 12a: 09/09/2003
-500 0 500 1000 1500 2000 2500 3000 3500 4000-30
-25
-20
-15
-10
-5
0
5
10
15
20
25
30
MSL
PC12b
Elev
atio
n, ft
(NA
VD 8
8)
Distance Across Shore, ft
LEGEND 09/10/2003
Profile 12b: 09/10/2003
A-8
Technical Report TAMU-CC-CBI-03-03
-500 0 500 1000 1500 2000 2500 3000 3500 4000-30
-25
-20
-15
-10
-5
0
5
10
15
20
25
30
MSL
PC13El
evat
ion,
ft (
NAVD
88)
Distance Across Shore, ft
LEGEND 09/10/2003
Profile 13: 09/10/2003
-500 0 500 1000 1500 2000 2500 3000 3500 4000-30
-25
-20
-15
-10
-5
0
5
10
15
20
25
30PC-14
MSL
Ele
vatio
n, ft
(NA
VD 8
8)
Distance Across Shore, ft
LEGEND 09/10/2003
Profile 14: 09/10/2003
A-9

Technical Report TAMU-CC-CBI-03-03
BLANK PAGE
A-10

Technical Report TAMU-CC-CBI-03-03
APPENDIX B: Comparison Plots of 1996 and 2003 Profile Surveys
This section presents plots that compare the results from the April 1996 and September 2003 beach survey profiles. The locations of the profiles are shown in Figure 7 in the main text.
B-1

Technical Report TAMU-CC-CBI-03-03
-500 0 500 1000 1500 2000 2500 3000 3500 4000-30
-20
-10
0
10
20
30
MSL
PC01
Elev
atio
n, ft
(NA
VD
88)
Distance Across Shore, ft
LEGEND 09/06/2003 04/08/1996
Profile 1: 09/06/2003 and 04/08/1996
-500 0 500 1000 1500 2000 2500 3000 3500 4000-30
-25
-20
-15
-10
-5
0
5
10
15
20
25
30
MSL
PC02
Elev
atio
n, ft
(NA
VD 8
8)
Distance Across Shore, ft
LEGEND 09/06/2003 04/08/1996
Profile 2: 09/06/2003 and 04/08/1996
B-2
Technical Report TAMU-CC-CBI-03-03
-500 0 500 1000 1500 2000 2500 3000 3500 4000-30
-25
-20
-15
-10
-5
0
5
10
15
20
25
30
MSL
PC03
Ele
vatio
n, ft
(NA
VD 8
8)
Distance Across Shore, ft
LEGEND 09/06/2003 04/08/1996
Profile 3: 09/06/2003 and 04/08/1996
-500 0 500 1000 1500 2000 2500 3000 3500 4000-30
-25
-20
-15
-10
-5
0
5
10
15
20
25
30
MSL
PC04
Ele
vatio
n, f
t (N
AV
D 8
8)
Distance Across Shore, ft
LEGEND 09/06/2003 04/08/1996
Profile 4: 09/06/2003 and 04/08/1996
B-3

Technical Report TAMU-CC-CBI-03-03
-500 0 500 1000 1500 2000 2500 3000 3500 4000-30
-25
-20
-15
-10
-5
0
5
10
15
20
25
30
MSL
PC05
Ele
vatio
n, ft
(NA
VD 8
8)
Distance Across Shore, ft
LEGEND 09/07/2003 04/09/1996
Profile 5: 09/07/2003 and 04/09/1996
-500 0 500 1000 1500 2000 2500 3000 3500 4000-30
-25
-20
-15
-10
-5
0
5
10
15
20
25
30
MSL
PC06
Ele
vatio
n, ft
(NA
VD 8
8)
Distance Across Shore, ft
LEGEND 09/07/2003 04/09/1996
Profile 6: 09/07/2003 and 04/09/1996
B-4

Technical Report TAMU-CC-CBI-03-03
-500 0 500 1000 1500 2000 2500 3000 3500 4000-30
-25
-20
-15
-10
-5
0
5
10
15
20
25
30
MSL
LEGEND 09/07/2003 04/09/1996
PC07
Elev
atio
n, ft
(NA
VD 8
8)
Distance Across Shore, ft
Profile 7: 09/07/2003 and 04/09/1996
-500 0 500 1000 1500 2000 2500 3000 3500 4000-30
-25
-20
-15
-10
-5
0
5
10
15
20
25
30
MSL
LEGEND 09/09/2003 04/09/1996
PC08
Elev
atio
n, ft
(NA
VD 8
8)
Distance Across Shore, ft Profile 8: 09/09/2003 and 04/09/1996
B-5
Technical Report TAMU-CC-CBI-03-03
-500 0 500 1000 1500 2000 2500 3000 3500 4000-30
-25
-20
-15
-10
-5
0
5
10
15
20
25
30
MSL
PC09
Ele
vatio
n, ft
(NA
VD 8
8)
Distance Across Shore, ft
LEGEND 09/09/2003 04/09/1996
Profile 9: 09/09/2003 and 04/09/1996
-500 0 500 1000 1500 2000 2500 3000 3500 40-30
-25
-20
-15
-10
-5
0
5
10
15
20
25
30
00
MSL
PC10
Ele
vatio
n, ft
(NA
VD 8
8)
Distance Across Shore, ft
LEGEND 09/09/2003 04/09/1996
Profile 10: 09/09/2003 and 04/09/1996
B-6

Technical Report TAMU-CC-CBI-03-03
-500 0 500 1000 1500 2000 2500 3000 3500 4000-30
-25
-20
-15
-10
-5
0
5
10
15
20
25
30
MSL
PC11
Elev
atio
n, ft
(NA
VD 8
8)
Distance Across Shore, ft
LEGEND 09/09/2003 04/12/1996
Profile 11: 09/09/2003 and 04/10/1996
-500 0 500 1000 1500 2000 2500 3000 3500 4000-30
-25
-20
-15
-10
-5
0
5
10
15
20
25
30
MSL
PC12
Ele
vatio
n, ft
(NA
VD
88)
Distance Across Shore, ft
LEGEND 09/09/2003 04/10/1996
Profile 12: 09/09/2003 and 04/10/1996
B-7

Technical Report TAMU-CC-CBI-03-03
-500 0 500 1000 1500 2000 2500 3000 3500 4000-30
-25
-20
-15
-10
-5
0
5
10
15
20
25
30
MSL
PC12a
Ele
vatio
n, ft
(NA
VD
88)
D istance Across Shore, ft
LEGEND 09/09/2003 04/12/1996
Profile 12a: 09/09/2003 and 04/12/1996
-500 0 500 1000 1500 2000 2500 3000 3500 4000-30
-25
-20
-15
-10
-5
0
5
10
15
20
25
30
MSL
PC12b
Elev
atio
n, ft
(NA
VD 8
8)
Distance Across Shore, ft
LEGEND 09/10/2003 04/12/1996
Profile 12b: 09/10/2003 and 04/10/1996
B-8
Technical Report TAMU-CC-CBI-03-03
-500 0 500 1000 1500 2000 2500 3000 3500 4000-30
-25
-20
-15
-10
-5
0
5
10
15
20
25
30
MSL
PC13
Ele
vatio
n, ft
(NA
VD 8
8)
Distance Across Shore, ft
LEGEND 09/10/2003 04/10/1996
Profile 13: 09/09/2003 and 04/10/1996
-500 0 500 1000 1500 2000 2500 3000 3500 4000-30
-25
-20
-15
-10
-5
0
5
10
15
20
25
30PC-14
MSL
Ele
vatio
n, ft
(NA
VD 8
8)
Distance Across Shore, ft
LEGEND 09/10/2003 04/10/1996
Profile 14: 09/10/2003 and 04/10/1996
B-9

Technical Report TAMU-CC-CBI-03-03
B-10
BLANK PAGE

Technical Report TAMU-CC-CBI-03-03
APPENDIX C: Sediment grain size statistics for beach and nearshore locations. This section shows sediment grain size statistics for the following sampling locations; toe of dune (or most landward position of beach as limited by other feature where no dune exists), mid-berm, shoreline, -3 ft, -12 ft, and -24 ft. Sediment samples were processed and analyzed according to standard methods (Mason and Folk, 1958; Folk, 1974) Sediment samples were sieved at 0.25 PHI increments. Coastal Engineering and Design System (CEDAS) software Automated Coastal Engineering System (ACES) was applied to determine sediment grain size statistics from gravimetric data. Table C1. Median (mm), mode (mm), and inclusive graphic standard deviation (Phi) of grain sizes. Profile
# Toe of Dune Mid-Berm Shoreline 3-ft Depth 12-ft Depth 24-ft Depth
PC01 0.15 0.125 0.22 0.14 0.125 0.29 0.15 0.125 0.34 0.14 0.125 0.27 0.14 0.125 0.31 0.11 0.074 0.45PC02 0.15 0.149 0.22 0.15 0.125 0.22 0.15 0.125 0.22 0.14 0.125 0.35 0.14 0.125 0.27 0.13 0.125 0.24PC03 0.15 0.125 0.22 0.15 0.125 0.24 0.17 0.125 0.66 0.15 0.125 0.35 0.14 0.125 0.23 0.13 0.125 0.69PC04 0.15 0.125 0.22 0.16 0.149 0.29 0.16 0.149 0.33 0.15 0.125 0.31 0.14 0.125 0.24 0.13 0.125 0.58PC05 0.15 0.125 0.22 0.14 0.125 0.30 0.16 0.125 0.33 0.15 0.125 0.36 0.14 0.125 0.23 0.13 0.074 0.97PC06 0.16 0.149 0.30 0.15 0.125 0.28 0.16 0.125 0.36 0.14 0.125 0.29 0.13 0.125 0.52 0.13 0.125 0.54PC07 0.16 0.149 0.28 0.16 0.125 0.34 0.15 0.125 0.36 0.14 0.125 0.36 0.11 0.088 0.26 0.11 0.074 0.46PC08 0.15 0.125 0.23 0.15 0.149 0.24 0.16 0.149 0.31 0.15 0.125 0.36 0.14 0.125 0.39 0.14 0.125 0.61PC09 0.14 0.125 0.22 0.14 0.125 0.36 0.15 0.125 0.47 0.15 0.125 0.34 0.14 0.125 0.63 0.13 0.074 0.59PC10 0.16 0.149 0.27 0.15 0.149 0.24 0.15 0.125 0.27 0.14 0.125 0.34 0.13 0.125 0.38 0.12 0.125 0.57PC11 0.15 0.125 0.22 0.16 0.149 0.31 0.16 0.125 0.36 0.14 0.125 0.42 0.13 0.125 0.17 0.14 0.125 0.63PC12 0.15 0.125 0.22 0.17 0.149 0.34 0.14 0.125 0.30 0.16 0.125 0.39 0.14 0.125 0.46 0.14 0.074 0.62PC12a 0.15 0.125 0.25 0.14 0.125 0.20 0.15 0.125 0.42 0.14 0.125 0.48 0.15 0.125 0.70 0.15 0.074 0.70PC12b 0.14 0.125 0.24 0.16 0.125 0.33 0.16 0.125 0.37 0.14 0.125 0.33 0.14 0.125 0.29 0.14 0.125 0.68PC-13 0.15 0.125 0.23 0.14 0.125 0.21 0.15 0.125 0.31 0.14 0.125 0.21 0.14 0.125 0.38 0.13 0.074 0.69PC-14 0.14 0.125 0.26 0.16 0.149 0.33 0.15 0.125 0.28 0.14 0.124 0.35 0.14 0.125 0.53 0.12 0.074 0.56
C-1