monitoring the nesting population of pacific black brant
TRANSCRIPT

Monitoring the nesting population of Pacific black brant Robert A. Stehn, Robert M. Platte, Heather M. Wilson, and Julian B. Fischer U.S. Fish and Wildlife Service, Migratory Bird Management, 1011 E. Tudor Rd,
Anchorage, AK 99503 2 December, 2011 Report to the Pacific Flyway Study Committee Abstract
1. Over the last 18 years, mid-winter population counts of Pacific brant were stable with an average growth rate of 1.01 (1.00-1.02, 90% c.i.). Fall population counts 1993-2010 confirmed this population trend with a growth rate at 1.00 (0.99-1.00). In contrast, during the same period the number of nests in brant colonies on Yukon-Kuskokwim Delta (YKD) declined annually with a growth rate of 0.96 (0.94-0.98). This discrepancy prompted us to examine whether an increase in brant nesting beyond the major colonies on the YKD offset the decline within colonies.
2. The five major nesting colonies of black brant on the Yukon-Kuskokwim Delta (YKD), Alaska were monitored annually by examining aerial photographic sample plots to estimate the population of nests (Anthony 1991-2006, Wilson 2007-2011). This survey was considered adequate for population management because 70-80% of all nesting brant were thought to be in these colonies. Not included in the photographic sample were brant nesting in scattered small groups or as individuals. Although we sampled some dispersed nesting areas outside of the colonies by ground-searched plots (Fischer et al. 2011), most of the YKD was not sampled.
3. Aerial observations of brant, other geese, swans, and cranes were made on a systematic transect survey flown annually to index populations on the entire coastal fringe of the YKD. Observations of brant were not used for monitoring because of suspected problems in counting the high density of brant within colonies. However, we found that aerial observations reliably tracked nests in both colonies and dispersed nesting areas. We determined the ratios of nest density to aerial index density in various regions of the YKD and used these ratios to estimate the total population of nests from aerial observations in each of 48 strata and 26 years, 1986-2011.
4. From 1986 to 1993, the estimated population of brant nests in the five major colonies increased with an average annual growth rate of 1.10 (1.01-1.19, 90% c.i.) and nests outside of these colonies increased at a rate of 1.07 (1.03-1.12). This 8-year period of population recovery followed a series of years with very poor brant nesting success in the early 1980s just prior to the start of the aerial survey.
5. From 1993 to 2011, the estimated nest population for the five major colonies declined at a growth rate averaging 0.95 (0.94-0.96) while the nest population in all other strata had a growth rate of 0.99 (0.98-1.00). Combining both, the total nest population had an average growth rate at 0.97 (0.96-0.98). The estimated total number of nests averaged 43,275 (40,975-45,576, 90% c.i.) in 1993-1997 versus 28,688 (25,121-32,254) in 2007-2011.
2
6. The percentage of the estimated total nests within the five largest colonies has
declined from 64% in 1986-1990 to 40% in 2007-2011. Introduction An important nesting area for Pacific black brant (Branta bernicla nigricans) is the Yukon-Kuskokwim Delta (YKD) on the Bering Sea coast. Early reconnaissance flights describe almost uncountable numbers of brant along a 3-5 km (2-3 mi) wide coastal strip from Igiak Bay (Kokechik) to South Nelson Island (Spencer et al. 1951). Monitoring the nesting population of brant in colonies has occurred for 30 years (Eisenhauer 1977, Byrd 1981, Byrd et al. 1982, Anthony 1991-2006, Wilson 2007-2011). The declining numbers of nests has prompted management concerns (Raveling 1984, Pamplin 1986, King and Derksen 1986, Sedinger et al. 1993, Sedinger et al. 1994, Sedinger et al. 2007). The Flyway Management Plan for Pacific Brant (Pacific Flyway Council 2004) summarizes the biology of brant and management recommendations. Pacific brant are currently managed as two breeding populations. Most Pacific brant are the black brant of Alaska, western Canada, and northeastern Russia. The other population component is the predominantly gray-bellied brant of the western high arctic (WHA) population nesting on Prince Patrick, Eglinton, and Melville Islands in Northwest Territories, Canada. Both populations migrate along the coast of Alaska and across the North Pacific to winter in estuaries along the Pacific coast. Many WHA brant winter at Padilla, Samish, and Fidalgo Bays in Washington. Brant wintering in British Columbia and near Izembek Lagoon, Alaska, may also include WHA brant as the affinities between breeding and wintering locations are not absolute and may change with time. The Flyway Council uses the three-year average of mid-winter counts to monitor the populations relative to objectives set at 150,000 black brant and 12,000 WHA brant. These objectives were based on the population numbers observed when comprehensive monitoring began in the 1960s. Federal and state waterfowl managers have implemented a variety of sport and subsistence hunting restrictions to help maintain both the size and the winter distribution of the populations. The criterion that would prompt harvest closure specifies a 3-year average midwinter survey of <90,000 brant and a nesting index on the five major YKD colonies of <9,931, 50% of the 1993-2000 reported average of 19,863 nests (Pacific Flyway Council 2004, p.21). Since 1991 when the photographic surveys were initiated, nesting in the five major brant colonies has declined to an estimated 9,469 nests in 2010 and 11,956 nests in 2011 (Wilson 2010). In contrast, the mid-winter population has remained stable and well above the closure threshold with a three-year average of 145,781 in January 2011 (USFWS 2011). The discrepancy between stability of the mid-winter brant population counts versus the continuing decline of brant nests on the YKD is unexplained. Resolving this difference was the impetus for this study. A large amount of data is available for monitoring brant. Both fall and mid-winter counts are made on the entire population. The breeding population is indexed by counts of brant seen on aerial transects flown in early June on the coastal fringe of the YKD. Crews search ground plots for nests sampling part of the YKD central coast. Within the colonies, digital photograph images are examined to count brant nests. Our objective was to produce a single best estimate of total brant nests by integrating the data from brant observed on aerial transects sampling the entire YKD coast, nests found on random plots sampling the central
3
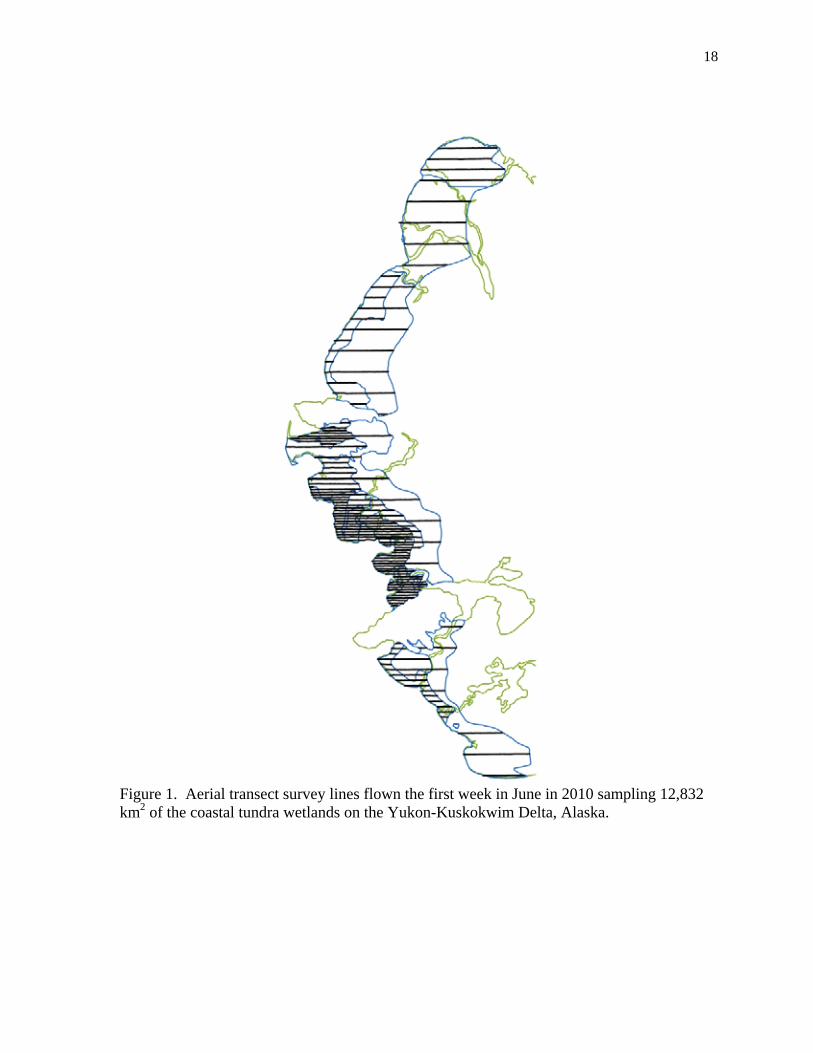
YKD coast outside the colonies, and nests observed on photographic images sampling the five major brant colonies. We also relate size and trend of this population of YKD nests to the fall and winter counts of the entire Pacific brant population and review the population status of Pacific brant. Methods Aerial survey index In 1985, the Fish and Wildlife Service initiated an aerial survey specifically designed to monitor geese and swans on the coast of the YKD. Aerial transect intervals, allocation of sampling intensity, stratification boundaries, and survey timing were adjusted in the first three years of surveys to improve efficiency and precision. Methods and early survey results have been summarized (Butler et al. 1995a,b, Eldridge 2003). Since 1993, further minor modifications of stratum boundaries have occurred as computerized GIS mapping and better geographic coverages became available. The entire 12,832 km2 coastal zone was sampled by systematic, straightline, east-west transects (Fig. 1). Transects were placed at 1.6, 3.2, 6.4, and 12.8 km (1, 2, 4, or 8 mi) intervals and extended from the west coast to approximately 40 km inland. A repeated four-year rotation through a standard set of systematic flightlines began in 1998. All brant colonies and surrounding areas were sampled at 1.6 km intervals such that, in 4-years, essentially complete coverage was obtained with four adjacent 400 m wide strip transects. However, actual flightline paths were not exact and birds move around even if remaining near their nest sites, thus coverage was not complete and even replicated flights would be variable. For these reasons, we did not use a finite population correction factor to reduce the estimated variance of the mean density. We scheduled the starting date of the aerial survey each year to maintain constant timing relative to cackling Canada goose (Branta hutchinsii minima) average nest initiation, which in turn was correlated with the onset of spring warming temperatures (Platte and Stehn 2011, Fischer et al. 2011).
In 1985, the first year of intensive aerial transect surveys, observers did not attempt to count brant in the large colonies at Kokechik Bay, Tutakoke River, and Kigigak Island because the density of brant was expected to overwhelm the observer's ability to record the birds observed. However, observers found the density in colonies was not impossibly high and colony boundaries were not distinct, so beginning in 1986, all geese including brant were counted at all locations. The pilot and observer recorded singles, pairs, and flocks of geese, swans, and cranes within 200 m of each side of the aircraft flying at 30-45 m and 145-170 km/hr. The indicated total bird aerial index was based on twice the number of singles, twice the number of pairs, plus birds observed in flocks (itotal = 2*nsg + 2*npr + birds in flocks). We assumed the single geese observed were the mates of unobserved females on nests.
We used the geographic locations of all individual aerial sightings of brant in the last ten years to produce a fine-scale map of the average distribution of brant. A kernel density calculation procedure (ARC/GIS 10.3) with a search radius of 1.609 km (1.0 mile) was used for smoothing and then contoured to indicate relative density. Aerial videographic or photographic sampling of colonies Ground crews searching transects or plots made the first estimates of brant colonies on the YKD in the early 1980s (Byrd 1981, Byrd et al. 1982, Sedinger et al.1993). In 1991, an aerial videographic survey of colonies was initiated and conducted annually at the five

4
largest brant colonies (Anthony 1991-2003, Anthony et al. 1995). In 2004, the survey instrument changed from digital camcorder videography to digital photography (Anthony 2004-2006, Wilson 2007-2011). Digital photographs were taken from the belly port of an aircraft flown 122 m above ground level at speeds ranging from 120-145 km/hr (75-90 mph). Photographs were taken at about one second intervals along systematic flight lines (~200 m apart) flown along the long axis of all colonies. Each photograph covered a ground footprint of ~42 m by 28 m (0.001165 km2). A sub-sample of photos was ground-truthed to determine the probability of detecting an active nest when counting the digital images. Because both errors of omission (e.g., not seeing a nest or not correctly identifying a brant as incubating) and commission (e.g., misidentifying a standing brant as a nest or an incubating cackling goose as incubating brant) occurred, the detection metric had the potential to be >1 and was considered an “index ratio” (Bart et al. 1998) rather than a detection probability. The index ratio and its variance across all ground-truthed images was calculated with a ratio estimate (Cochran 1963) equal to the sum of brant nests observed on aerial images divided by the sum of brant nests located on ground plots. The mean density of nests seen on photo images was adjusted to actual nests divided by the index ratio. The population size of active nests in each colony was estimated from the mean density of nests in photographic images multiplied by the area of each colony (Wilson 2011). Plot-based estimate of nests
Beginning in 1986, randomly located rectangular ground plots were searched for nests of all species in areas of the central YKD coast. New random locations were selected each year with a restriction to exclude any overlap with plots of the current year or the previous five years, resulting in slightly better than random dispersion. Plots were included regardless of overlap with lakes and rivers. Plot size was 402 m by 805 m (0.324 km2) with the exception of 1986-1987 when some plots varied in size (0.16-1.66 km2), 1995 with 0.45 km2 plots, and 1996 with 0.36 km2 plots. A total of 2,104 randomly-located plots were searched from 1986 to 2011. All of the 957 plots searched after 1999 were located within a ground-sampled core area of 716 km2. The majority of the 1147 plots searched up to 1999 were also within this standardized area (621 plots within, 526 plots outside). Brant colonies at Tutakoke, Kokechik, Baird Island, and Baird Inlet were intentionally not included in the core area, although the Kigigak colony was included because it was interspersed with high nest densities of other geese, eiders, and gulls. Although the core region represented only 5.6% of the total coastal zone area sampled by the aerial transect survey, the plot sampled core did include a majority of the high and medium density nesting areas of cackling Canada geese and spectacled eiders (Somateria fischeri).
Typically a crew of two biologists were transported either by Cessna 185 float-equipped aircraft or by boat to search each plot. All sites dry enough for a nest were examined for active and destroyed waterfowl, crane, loon, and gull nests. At each nest, a notecard was used to record species, nest status, nest site habitat (shoreline, island, peninsula, slough bank, grass meadow, palsa upland, ridge upland), stage of incubation, clutch size, and geographic coordinates. Species identification was determined by visual confirmation of an adult at the nest or by comparing down and contour feathers in the nest bowl with a photographic field guide (Bowman 2004). Stage of incubation was determined by recording float angles of eggs (Westerkov 1950). Nest initiation was backdated from hatch date using observed clutch size, average incubation duration, and laying interval.
5
The mean and variance of number of nests per plot were based on a simple random
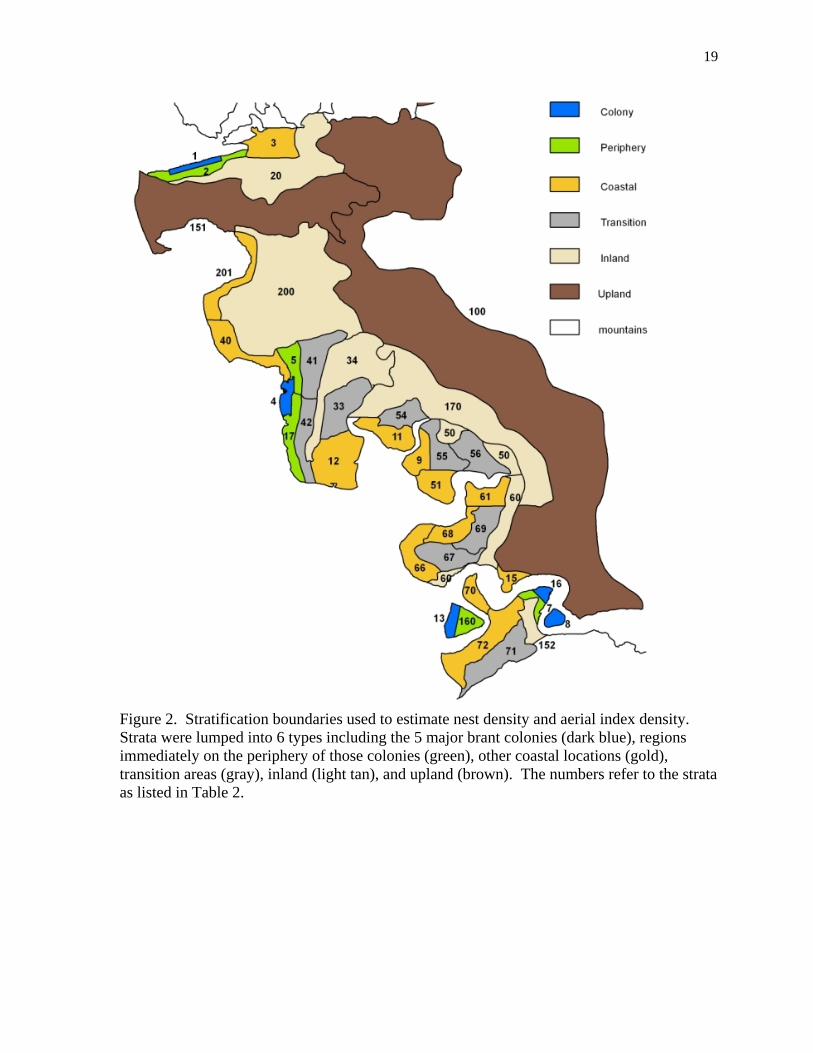
sample of all plots in the single sampled stratum (Fischer et al. 2011). For the current analysis, we determined the mean density of nests within each of the smaller geographic strata (Fig. 2). Nest population estimates were corrected for detection rate using a model that included species, nest activity status (active, destroyed), observer experience, and nest site habitat (unpublished data). The detection rate for brant nests averaged 95%, the highest among all species, and ranged from 93-97% among years depending mostly on average nest success. Other details of plot sampling methods and results are available in annual reports (Fischer et al. 2011). Relationship between nests and aerial observations To examine the relationship between bird density from aerial observations and nest density outside of the major brant colonies, we subdivided the entire area of the YKD coastal aerial survey into 48 smaller geographic strata (Fig. 2). The stratification boundaries reflected areas with equal aerial sampling intensity, relatively homogeneous habitat, and a similar density of birds. Stratum delineation included the boundaries used in the photographic sampling of the five major brant colonies, various sections of the ground plot-sampled area, and other areas sampled by plots in previous years. The stratum type was related to the average density of brant nests with colony averaging 295 nests per km2 to one or fewer nests per km2 in transition, inland, or upland types (Table 1). To quantify the relationship between nest and aerial index densities, we calculated ratio estimates. The ratio estimate model was appropriate because both the nest and aerial index variables had measurement error, the variances increased with the means, and it was reasonable that the relationship included the origin point 0-0, all conditions where the ratio estimator is optimal (Cochran 1963). The ordinary least squares regression model was less appropriate because the assumption that the X-variable was measured essentially without sampling error was not true. We tabulated the nest density and indicated total bird aerial index density for each stratum-year unit and calculated the ratio of nest density to aerial index density. Of the 1248 possible units (= 26 years x 48 strata), 599 had both aerial transect and ground plot data. The individual units were pooled, either temporally or spatially, into larger groups to allow calculation of reliable ratio estimates. The mean nest density and the aerial index density within each of the stratum-year units were determined with low precision due to small sample size. Because almost 50% of the individual stratum-year units had three or fewer plots, or five or fewer aerial transects, we pooled data to obtain reliable nest to aerial index ratios. We also did not want to mask potentially important sources of variation in the ratio such as the date of survey, average nest initiation date, observers, year, stratum type, nesting success, and aerial observation density of other species. First, we combined data from stratum-year units into six stratum types (Fig. 2) identified as colony, periphery, coastal, transition, inland, and upland and we examined nest to aerial index ratios for annual fluctuations or trend over time. Then, we combined adjacent years of data into 3, 4, 5, or 9-year groups within each stratum to look for stratum-specific differences in nest to aerial index ratios.
6
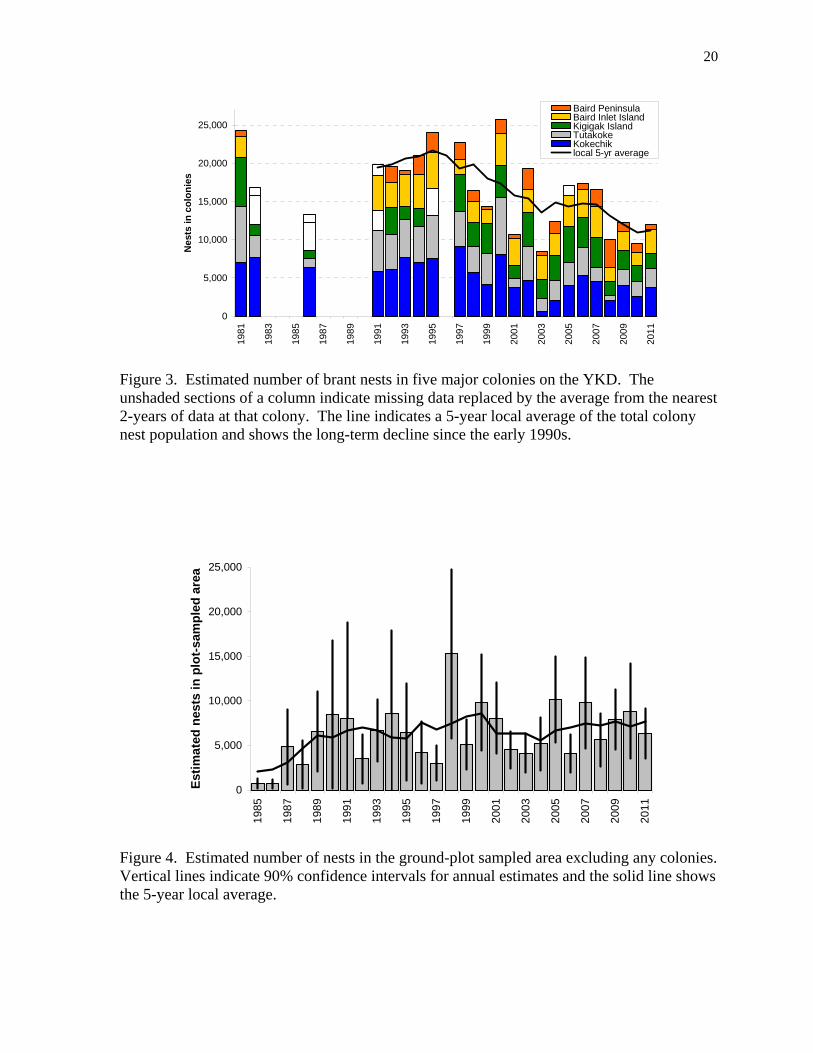
Fall and winter counts of brant Since 1960, aerial survey counts of brant in lagoons along the west coasts of Baja California and mainland Mexico (Mallek et al. 2010) and ground-based counts of brant at wintering sites in California, Oregon, and Washington have provided a standardized January population estimate of Pacific brant throughout their winter range (Pacific Flyway Council 2004, USFWS 2011). Brant historically wintered in low numbers near Izembek Lagoon in Alaska but began to increase in the 1980s (Mallek and Dau 2009, Ward et al. 2009). Since January 1986, the mid-winter counts have included an aerial count of brant wintering at Izembek. We considered the mid-winter counts in Mexico of January 1981 and January 1987 to be outliers and, along with the missing Mexico count of January 2009, each of these counts was replaced by the averaged Mexico counts of the previous three years. The Mexico aerial survey also was not flown in 2011 but that count was replaced by ground counts of brant (Eduardo Palacios, PRONATURA, unpublished data). Essentially all Pacific brant spend 6 to 9 weeks at Izembek Lagoon on the Alaska Peninsula feeding on eelgrass before migrating to wintering areas as far south as Mexico (Dau 1992, Reed et al. 1998, Ward et al. 2005). Telemetry and banding studies suggested the most reliable period to monitor the entire population of Pacific brant at Izembek Lagoon was between 5 and 20 October (Reed et al. 1989, Ward and Stehn 1989). Beginning in October 1975, brant have been counted on aerial survey flights covering Izembek and adjacent lagoons. To count each flock and prevent double counting, the pilot must continually adjust multiple flight paths across and around each of the bays based on the position and behavior of large flocks of brant. Both pilot and observer independently voice-recorded brant seen on their side of the aircraft. Counts of brant varied depending on an undefined combination of factors including aircraft, pilot, observer, time of day, date, wind, weather, and tide stage. To counteract the variability caused by all these factors, one or more survey crews flew up to seven repeated survey counts (average n = 3.9) each year from 1975 to 2010 (Stehn et al. 2010) and the average was used as the best annual estimate. We excluded any counts of less than 100,000 (n = 15) or more than 180,000 (n = 5) as being incomplete or inaccurate, leaving 119 valid counts in 36 years of Izembek surveys. These exclusion boundaries were slightly more restrictive than the discarding of outliers beyond the 95% confidence interval of the overall mean as used by Stehn et al. (2010). Results Aerial videographic and photographic sample of nests in colonies Ground searches in 1981, 1982, and 1986 indicated a decline in brant nests around the Tutakoke colony, continuing a trend seen since 1966 (Byrd 1981, Byrd et al. 1982, Sedinger et al. 1993). Nesting studies showed near complete nest failure for brant in 1984 and 1985 (Sedinger et al. 1993). By the early 1990s, the initial video-sampling of colonies showed that some population recovery had occurred (Fig. 3) however since then, the photo-sampling of colonies showed a long-term decline (Wilson 2011). For the 1993-2011 data, the average total population of nests in colonies was 16,043 (SD = 5,220) with an average growth rate of 0.963 (0.944-0.981, 90% c.i.). The individual years of 2001 and 2003 had markedly lower numbers of active nests compared to adjacent years especially at Kokechik, Tutakoke, and Baird Peninsula, the non-island colonies. The reduction in nests reflects the combination of high predation rate, early
7
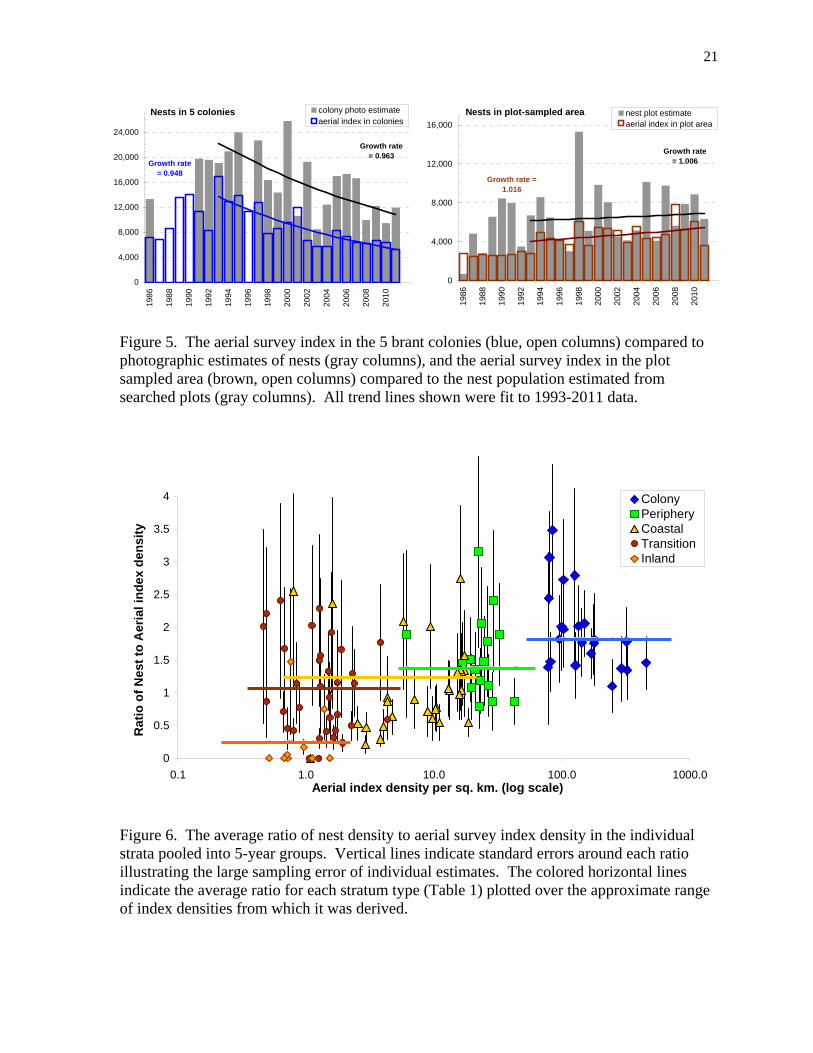
nest failures, and fewer nesting attempts. The proportion of nest plots searched that had active sign of Arctic fox (Vulpes lagopus) was also highest in 2001 and 2003 (Fischer et al. 2011) from all the years indexed for fox activity, 1988 to 2011. Plot-based estimate of nests We estimated the number of brant nests in a 712 km2 area that was sampled by the randomly located ground plots 1985-2011. To document population change for only dispersed-nesting brant, we excluded the Kigigak Island brant colony (stratum 13, Fig. 2). The population of nests showed an initial increase and then a flat trend (Fig. 4). The 1993-2011 average was 7,049 nests (SD = 2,966) with an average annual growth rate at 1.006 (0.977-1.035). The uneven distribution of brant resulted in high sampling variation in the single-year estimates of the nest population (Fig. 4). The clumped distribution of nests for dispersed nesting brant was shown by 71% of the plots with zero brant nests while 9% of the plots had 11 or more nests. Relationship between nests and aerial observations We compared the number of nests in colonies (Fig. 3) and nests in the plot-sampled dispersed nesting area (Fig. 4) to the indicated total bird aerial index of brant observed in the same areas (Fig. 5). The aerial index was a smaller number and it showed less variation among years compared to direct estimates of nests, nevertheless the trend lines were almost identical (Fig. 5). The simple correlation coefficient between the aerial indices and nests in colonies was r = 0.60 (n = 21) and nests in the plot-sampled area was r = 0.41 (n = 26). The aerial index underestimated the high numbers of nests based on photographic sampling of colonies in several years, whereas the aerial index overestimated the number of nests in years with a sharp drop in number of nests shown by photographic sampling (Fig. 5). We found the ratios to be most reliably determined when grouping strata by their type, whether colony, periphery, coastal, transition, inland or upland (Fig. 2). Thus, all the nest data from the photographic sampling of colonies or searching of ground plots and all the observations on aerial transects were pooled across years and strata to determine the average ratio of nests to aerial observations within each type (Table 1). Deviations from these six stratum type ratios were calculated using only the data in individual years (pooled by type) or individual strata (pooled by groups of years). Deviates were examined for correlation with various covariates. The only factor that was significantly correlated to the deviates was the proportion of nests remaining active when the plot was searched (an index to nest success), although this correlation explained only about 15% of the variance. A smaller nest to air index ratio was found in years with lower average nesting success. Other factors such as year, survey timing, spring warming chronology, or observer experience were not significant. We also found that ratios differed within a given stratum between groups of years by as much as the variation among other strata of the same type (Fig. 6). Certainly many factors could influence the ratio of nests to aerial index densities, however, given the large sampling error in the ratios estimated within stratum- or year-specific subsets of the data (Fig. 6), we could not identify important explanatory factors. Consequently, we used the average nest to aerial index ratio for each stratum type (Table 1) as the best estimate. The six ratios were used as multiplication factors that converted the observed aerial index density to an estimated average density of nests.

8
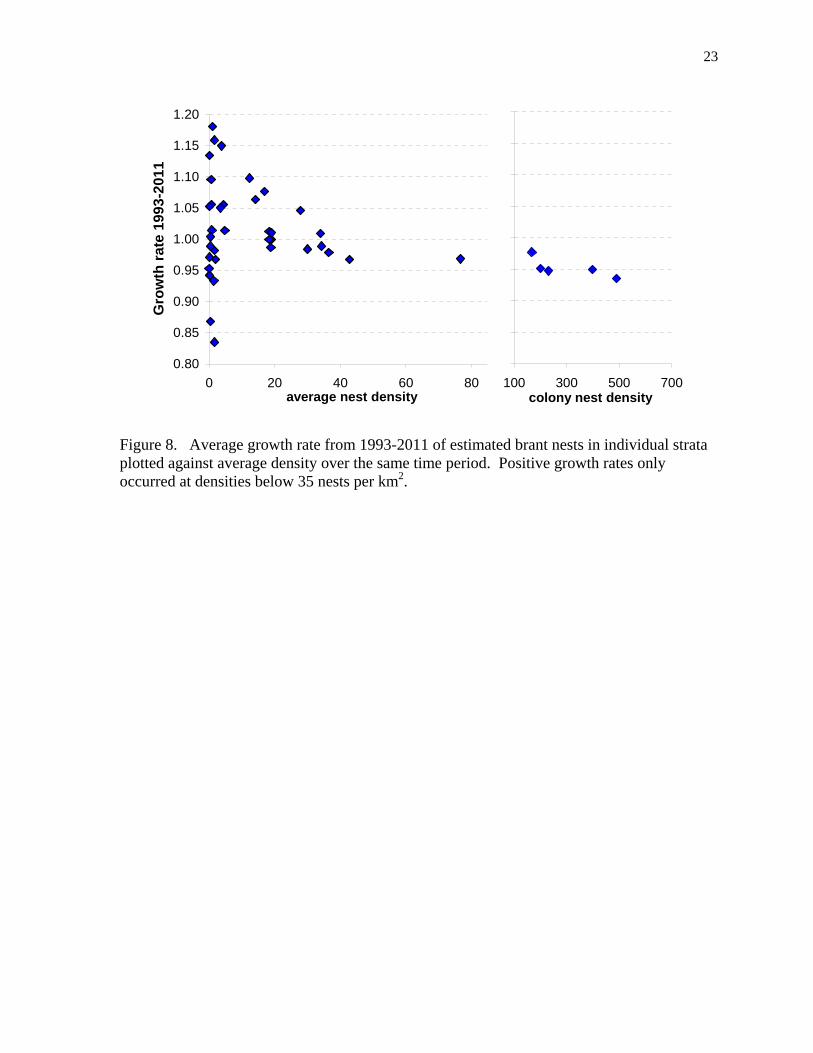
Estimated nest population Using the six stratum type ratios of nest to aerial index density (Table 1), we estimated the nest population size from the aerial index data available in all 48 strata and 26 years. The average of the predicted nest populations and growth rates were calculated in each stratum for 1986-1993 and 1993-2011 (Table 2). These intervals corresponded to periods of overall growth and decline of brant on the YKD. The estimates from each stratum were totaled by stratum type and plotted by year to show their relative population size and timing of population increase or decline (Fig. 7). During a period of population recovery from 1986 to 1993, the estimated population of brant nests in colonies increased at an average annual growth rate of 1.10 (1.01-1.19, 90% c.i.) and nests outside of colonies increased at a rate of 1.07 (1.03-1.12). From 1993 to 2011, the estimated nest population in the five major colonies declined with an average annual growth rate of 0.95 (0.94-0.96, 90% c.i.) and the nest population in all non-colony strata declined at 0.99 (0.98-1.00) (Table 2). The total nest population combined had an average growth rate of 0.97 (0.96-0.98) for 1993-2011. Estimated nest populations in individual strata had various growth rates from 1993 to 2011. All five brant colonies (strata 1, 4, 8, 13, 16, see Fig. 2) had significant declining trends, eight strata had significant increasing trends, and three had significant declining trends (Table 2). The other strata, 11 with increases and 15 with declines, were either close to stable or had highly variable estimates resulting in non-significant trends (Table 2). Average growth rates indicated that decline occurred in all strata with nest densities greater than 35 per km2 (Fig. 8). In addition to colonies, most other loss of estimated nests occurred at Kokechik Bay south (stratum 2, Fig. 2), South Nelson coast (stratum 80), Aknerkochik-Azun (stratum 51), Scammon coast (stratum 110), Punorat Point (stratum 40), and Kigigak east (stratum 160). Most gain in estimated nest numbers occurred at Manokinak River north (stratum 11), Naskonat north (stratum 68), Kokechik River (stratum 3), and Opagaryak River (stratum 12). Between 1993-1997 and 2007-2011, the total estimated average number of nests decreased 34% from 43,323 (SD = 3,127) to 28,688 (SD = 4,848). With a lower growth rate in the colonies compared to most other strata (Table 2, Fig. 7), the percentage of the total brant nests within the five largest colonies has declined from 64% in 1986-1990 to 40% in 2007-2011.
The relative density of all individual aerial sighting locations of brant from 2002-2011 showed a detailed map of the average distribution of brant (Fig. 9) without any possible bias caused by arbitrary stratum boundaries, ground plot, or photographic sampling plans. Contours of sighting density confirmed the colonies (red) and indicated several other areas of moderately high density (yellow) including the periphery around colonies, and aggregations at Aknerkochik River and Kokechik River (Fig. 9). The contours of density often closely matched the boundaries of the 48 strata, and therefore added support to the results derived for the delineated strata (Table 2). Fall and winter counts of brant For 1960 to 1975 populations (January counts of 1961-1976), the mid-winter counts of the brant (USFWS 2011) declined with an average growth rate = 0.981 (0.975-0.987, 90% c.i.). Count data since 1976 has indicated a long period of population stability. The 1983-2011 mid-winter counts for black brant averaged 126,300 with an average growth rate = 1.003 (0.999-1.006). The 1983-2011 mid-winter counts for all Pacific brant (USFWS 2011),
9
summing black brant, WHA, and British Columbia brant, averaged 136,565 brant with a growth rate of 1.003 (0.999-1.007) (Fig. 10). The comparable populations of Pacific brant in October 1982-2010 counted at Izembek Lagoon (unpubl. data Izembek National Wildlife Refuge, Stehn et al. 2010) averaged 130,371 brant with a growth rate of 1.001 (0.998-1.005) (Fig. 10). The last six years of 2005-11 had somewhat higher mid-winter counts than previous years (Fig. 10), however these were not matched by higher fall counts at Izembek. The mid-winter 2011 count was 147,614 black brant with a 3-year running average of 145,781 (USFWS 2011). This population size was close to the management-defined objective of 150,000 brant noted in the Flyway Management Plan for Pacific brant (Pacific Flyway Council 2004). Discussion The 2011 average of the three most recent mid-winter counts was 145,781 black brant (USFWS 2011), close to the population objective of 150,000 (Pacific Flyway Council 2004). This contrasted with the most direct and precise monitoring data on the nesting population that showed a continuing decline in the nest population (Fig. 3) based on the photographic sampling of all five brant colonies on the YKD (Wilson 2011). Using additional independent aerial survey data from the YKD, we converted the aerial index to estimated nests using the average ratio of brant nest density to aerial index density in the various stratum types. The converted aerial data supported the decline of brant nests in the colonies (Fig. 7). The aerial data also estimated the population of brant nests outside of the five major colonies (Fig. 7), and by adding these more dispersed nesting brant to nests in colonies, the current total number of nests approximately doubled. The total population of nests has not declined at the magnitude indicated by only monitoring the five major brant colonies. Nevertheless, from 1993-2011 the total nesting population has declined at an average annual growth rate of 0.97 (0.96-0.98). The photographic estimate of nests in colonies showed more variation among years compared to annual variation in the aerial index (Fig. 5), and consequently, in variation of nests estimated by the aerial index. Because the estimated nest population from the photo samples also had smaller sampling error, the greater variation among years was not due to chance but was real. We concluded that the population of active nests had more variation among years than the number of potentially breeding birds visible to aerial observers. This explanation required that most surviving brant return to the same nesting area every year but the proportion of those brant that actually initiated a nest and their nesting success varied substantially among years. Converting the aerial index to estimated nests by using average nest to aerial index ratios underestimated annual variation in the number of nests, however, over several years, the predicted number and trend in the nesting population remained comparable between the two methods, in both the colony and dispersed nesting areas (Fig. 5). Brant observed on aerial transects provided an index to the potential breeding population of birds. With the photographic sampling of colonies, nests were counted only for visible nest bowls or brant apparently sitting on a nest, and therefore, the number of destroyed nests or the total number of birds were not estimated. The density of active nests from the photographic survey and the density of birds observed on the aerial survey could be

10
quite different measures depending on the proportion of paired brant that attempt to nest, whether the nest remains active, the number of non-nesting brant in the colony, and the visibility rate of nesting versus non-nesting brant. The annual production of young must more closely relate to the number of active nests than to total birds, as was shown, for example, by the 2001 and 2003 nest failures in colonies not matched by reduced aerial indices of birds (Fig. 5). The aerial survey index of brant, even after its conversion to estimate the population size of nests, cannot as accurately estimate annual deviations in the production of young as could measures based on number of active nests, broods, fledged goslings, or fall age ratio. On the other hand, the aerial index of potentially nesting birds observed may be more useful for monitoring long-term trends in population size without the added variability caused by annual fluctuations in the proportion of brant with a nest or their variation in nest success. The differences in the nest to aerial index ratio for each stratum type (Table 1) reflect the combined effect of incomplete detection (aerial visibility rate) and the presence of additional birds without nests. Within the colonies, based mainly on the photographic sampling and the count of active nests, the average ratio was 1.835 nests for each indicated total bird aerial index (Table 1). Assuming that a) non-nesting brant were not present, b) failed nests were not attended by lingering adult birds, and c) two birds were at each nest, the expected number of birds would be twice the number of nests or 3.67 brant present for each indicated bird in the aerial index. The inverse was 1 / 3.67 = 27%, the effective detection rate of in the colonies (Table 1). If additional brant without an active nest were present in colonies, which was likely, the true visibility detection rate of brant would be less than 27%. The comparable effective detection rates in periphery, coastal, and transition types of strata were 36%, 40%, and 46%, respectively (Table 1). We conclude that, in colonies averaging 295 nests per km2, aerial observers were less able to detect and record birds over the full width of the transect, but only to a slightly lesser degree than when detecting brant at densities of 35, 11, or 1 nests per km2 in other stratum types (Table 1). Because aerial observers record all species of geese, the density of all species would be a more relevant measure of observer workload among the stratum types. The densities for all three species of geese plus brant were not as different as for brant alone, with an average of 196, 82, 32, 47, 28, and 5 geese per km2 recorded in colony, periphery, coastal, transition, inland, and upland stratum types, respectively. In the inland stratum type, the effective detection rate for brant was 189% (Table 1), indicating that non-nesting brant or brant flying between nesting areas were the majority of those detected. Likewise, in upland strata where 0.20 brant per km2 were seen, no nests have been found (Table 1). The non-colony pooled ratio of 1.345 is equivalent to an effective detection rate of 37% (Table 1). We emphasize that these rates, termed "effective" detection rates, at 27% in colonies and about 37% elsewhere, are not actual visibility detection rates. They are the long-term average of the balance between incomplete detection of birds and the number of extra birds present without nests. Data from a similar aerial survey flown to monitor waterfowl on 57,336 km2 of Alaska's Arctic Coastal Plain (ACP) showed the 1992-2011 average annual rate of growth for brant was 1.09 (1.07- 1.12, 90% c.i.) and the 2007-2011 average aerial index was 10,512 brant (Larned et al. 2010, USFWS unpubl. data). Of the indicated total brant observed on the ACP, 46% were singles and pairs comparable to the 47% recorded as singles or pairs on the YKD in 2007-2011. Because these ACP surveys were completed by 16-22 June, most of the
11
failed-nesting and non-nesting brant that molt near Teshekpuk Lake had not yet arrived and would not be included in the counts. Extensive aerial transect surveys have been flown in 2005-2010 sampling 234,040 km2 of various wetland areas in the Northwest Territories and Nunavut, Canada (Conant et al. 2006, Conant et al. 2007, Groves et al. 2009a,b, Groves and Mallek 2011a,b). These surveys included Victoria Island, Banks Island, and the area around Queen Maud Gulf. The surveyed areas in Canada were still south of the nesting areas of gray-bellied brant on Prince Patrick, Melville, and Eglinton Islands, and they did not include some areas also known to have nesting brant such as Mackenzie Delta, Liverpool Bay, and Anderson River. The sampled surveyed area totaled an average indexed population of 5,796 black brant. We assumed that the ACP and Canadian aerial survey indices had a higher average detection rate than the YKD aerial surveys because the average density of all waterfowl species was much lower. We believe the most appropriate ratio of nests per aerial observation was 1.077, based on the YKD transition stratum type, which was the lowest density non-colony area on the YKD (Table 1). Using this ratio for conversion, the aerial index estimated 11,321 nests on the ACP and 6,242 nests in Canada. With 2007-2011 aerial survey data from the YKD, we estimated an average of 11,359 nests in YKD colonies and 17,328 nests outside colonies for a total of 28,688 YKD nests. The sum for YKD, ACP, and Canada was an estimated population of 46,251 black brant nests from five years of the most recent data. Brant nesting in large colonies, small colonies, and as dispersed groups and individuals is not a new observation. In 1980-82, a combination of ground and aerial observations on the YKD documented nearly 68,000 nesting brant (34,000 nests) in 22 delineated areas (Byrd 1981, Byrd et al. 1982), although no estimate was available for individual or very small groups of dispersed nesting birds. Of the total brant, 84% were in four major colonies at Kokechik, Tutakoke, Kigigak, and Baird Inlet Island. Another small colony of 1,553 brant (776 nests) was located in 1981 at Newtok Point on the north side of the Ninglick River across from the present location of the Baird Peninsula colony. In 1981, a boat crew observing the Baird Peninsula area did not find a colony of brant (Byrd 1981). By 1993-2011, Newtok Point averaged 216 estimated nests and Baird Peninsula averaged 1,443 nests (Table 2, stratum 15 vs. 16). An earlier local decline or shift in a brant colony had been documented near the mouth of the Kashunuk River where permanent 10-acre plots had been established and censused for brant from 1966-1981 (YDNWR, unpublished data). Annual nest searches indicated a consistent decrease from 15.4 nests per plot in 1971 to 3.8 nests per plot by 1981 (Byrd 1981) and essentially no nests by 1984 (Sedinger et al. 1993). The observed decline at this specific location had prompted the 1980-1982 surveys to obtain a total brant population estimate. The colony at Tutakoke has continued to decline except for a period of growth from about 1986-1993. The long-term decline at the Tutakoke colony has not been balanced by increases at other colonies, nor was it matched by increases of equivalent magnitude in nearby peripheral areas. Our observed results were contrary to expectation. Brant nesting in larger colonies generally have higher nest success (Raveling 1989) and, except for certain conditions (Anthony et al. 1991), they do not have high rates of Arctic fox depredation. In addition, brant in large colonies are more likely to provide the grazing pressure needed to maintain the quality and increase the long-term quantity of closely-cropped sedge grazing lawns that provide critical brood-rearing habitat (Sedinger et al. 1998, Person et al. 2003). Short-term
12
early season grazing alone did not change forage quality (Person et al. 1998). Abundant high quality forage correlates with greater gosling growth rates (Sedinger and Flint 1991, Sedinger et al. 1998, Sedinger et al. 2001) and subsequent increased post-fledging survival (Sedinger et al. 1995, Sedinger and Chelgren 2007) and recruitment (Sedinger et al. 2004). At some density level, overcrowding would result in reduced forage availability per gosling and cause reduced gosling growth and survival (Sedinger et al. 1998). However, declining colonies and lower densities apparently do not always reverse this effect with a compensatory increase in foraging opportunity by goslings. Low gosling growth rate (i.e. poor forage) was found at Baird Inlet and Kigigak colonies (Fondell et al. 2011). Also, in brood rearing areas located away from any colony near lower density nesting areas (Aknerkochik stratum 51, Big Slough stratum 17), brant had poor nesting success and low gosling growth rates compared to Tutakoke (Nicolai et al. 2008). Some recovery of gosling growth rates has now occurred at Tutakoke (Nicolai et al. 2008, Fondell et al. 2011), and further documenting the complexity of interactions among habitat capacity and density of brant. These studies do not explain the observed stability or growth of many areas with dispersed nesting brant and the continued decline of brant in colonies on the YKD. Philopatry of female brant was high with ~0.91-1.00 return probability to prior breeding locations and ~0.70-0.96 return rates to their natal colony (Sedinger et al. 2008) nevertheless some emigration to new locations has been documented (Lindberg et al. 1998, Sedinger et al. 2008, Nicolai et al. 2008). The importance of emigration from colonies in initiating or supplementing the growth of brant populations at other locations on the YKD has not been established. Likewise, brood rearing success, gosling growth rate, and eventual recruitment at those locations with stable or growing populations and low densities of dispersed nesting brant (<35 nests per km2) has not been, and from a practical viewpoint perhaps cannot be, easily documented. In summary, we found that many areas with low-density, dispersed nesting brant on the YKD showed slowly increasing or stable populations. This has helped to reduce, but not completely replace, the decline of nests from the five major colonies. The estimated nest population in colonies showed lower growth rates over the last 19 years compared to most other coastal strata and now, the majority of brant on the YKD nest outside of the five major colonies. To account for the stable population size indicated by fall and mid-winter counts, the continuing decline in the nesting population on the YKD must be compensated by more brant nesting in other locations such as Alaska's ACP and the Canadian Arctic. Monitoring the total number of brant nests should include these locations. Monitoring on the YKD, that is still the most important nesting area, should include sampling areas with low densities of nests and employ a stratified sampling design allowing for gradual change in the distribution of the population. Literature cited
Anthony, R. M. 1991-2006. Aerial surveys of brant colonies on the Yukon Delta NWR.
Unpubl. annual reports, 1991 to 2006. U.S. Geological Survey, Alaska Science Center, Anchorage, Alaska.
Anthony, R.M., W.H. Anderson, J.S. Sedinger, and L.L. McDonald. 1995. Estimating populations of nesting brant using aerial videography. Wildlife Society Bulletin 23:80-87.
13
Anthony, R.M., P.L. Flint, and J.S. Sedinger. 1991. Arctic fox removal improves nest
success of black brant. Wildlife Society Bulletin 19:176–184. Bart, J., M.A. Fligner, and W.I. Notz. 1998. Sampling and Statistical Methods for
Behavioral Ecologists. Cambridge University Press. 330pp. Bowman, T.D. 2004. Field guide to bird nests and eggs of Alaska's coastal tundra. Alaska
Sea Grant College Program, University of Alaska Fairbanks, AK. 80pp. Butler, W.I., Jr., R.A. Stehn, and G.R. Balogh. 1995. GIS for mapping waterfowl density
and distribution from aerial surveys. Wildl. Soc. Bull. 23:140-147. Butler, W.I., Jr., J.I. Hodges, and R.A. Stehn. 1995. Locating waterfowl observations on
aerial surveys. Wildl. Soc. Bull. 23:148-154. Byrd, G.V. 1981. Distribution, density, and production of black brant on the Yukon Delta
NWR, 1981. Unpubl. refuge report, 8 July 1981. 20pp. Byrd, V., S. Finger, C.A. Janik, M. Joseph, P. Paniyak. 1982. The status of geese and swans
nesting on the coastal fringe of the Yukon Delta National Wildlife Refuge in 1982. Unpubl. refuge report, July 1982. 44pp.
Cochran, W.G. 1963. Sampling Techniques. 2nd Ed. John Wiley & Sons, NY. 413pp. Conant, B., F. Roetker, and D.J. Groves. 2006. Distribution and Abundance of Wildlife
from Fixed-Wing Aircraft Surveys on Victoria Island and Kent Peninsula, Nunavut, Canada. June 2005. Unpubl. report, USFWS, MBM Juneau, AK 8pp.
Conant, B., D.J. Groves, and T.J. Moser. 2007. Distribution and Abundance of Wildlife from Fixed-Wing Aircraft Surveys in Nunavut, Canada. June 2006. Unpubl. report, USFWS, MBM Juneau, AK 15pp.
Dau, C.P. 1992. Fall migration of Pacific brant in relation to climatic conditions. Wildfowl 43:80-95.
Eisenhauer, J.H. 1977. Nesting ecology and behavior of Pacific brant in Alaska. Thesis, Univ. Letheridge, Alberta, Canada. 254pp.
Eldridge, W.D. 2003. Population indices, trends and distribution of geese, swans, and cranes on the Yukon-Kuskokwim delta from aerial surveys, 1985-2002. Unpubl. report, USFWS, MBM Anchorage, AK. 27pp.
Fischer, J.B., R.A. Stehn, and G. Walters. 2011. Nest population size and potential production of geese and Spectacled Eiders on the Yukon-Kuskokwim Delta, Alaska, 1985-2011. Field report, USFWS, MBM Anchorage. Nov 2011. 43pp.
Fondell, T.F., P.L. Flint, J.S. Sedinger, C.A. Nicolai, and J. L. Schamber. 2011. Intercolony variation in growth of black brant goslings on the Yukon-Kuskokwim Delta, Alaska. J. Wildl. Manage. 75:101-108.
Groves, D.J., E.J. Mallek, R. MacDonald, and T.J. Moser. 2009a. Migratory birds surveys in the Canadian Arctic - 2007. Unpubl. report, USFWS, MBM Juneau, AK. 31pp.
Groves, D.J., E.J. Mallek, and T.J. Moser. 2009b. Migratory birds surveys in the Canadian Arctic - 2008. Unpubl. report, U.S. Fish and Wildl. Ser., MBM Juneau, AK. 30pp.
Groves, D.J., and E.J. Mallek. 2011a. Migratory birds surveys in the Canadian Arctic - 2009. Unpubl. report, USFWS, MBM Juneau, AK. 34pp.
Groves, D.J., and E.J. Mallek. 2011b. Migratory bird survey in the western Canadian Arctic - 2010. Unpubl. report, USFWS, MBM Juneau, AK. 31pp.
King, J.G. and D.V. Derksen. 1986. Alaska goose populations: past, present and future. Trans. No. Am. Wildl. & Natur. Resour. Conf. 1:464-479
14
Larned, W., R. Stehn, and R. Platte. 2010. Waterfowl breeding population survey Arctic
Coastal Plain, Alaska 2009. Unpublished USFWS report, Migratory Bird Management, Soldotna and Anchorage, AK. 7 April 2010. 45pp.
Lindberg, M.S., J.S. Sedinger, D.V. Derksen, and R.F. Rockwell. 1998. Natal and breeding philopatry in a black brant, Branta bernicla nigricans, metapopulation. Ecology 79:1893-1904.
Mallek, E.J. and C.P. Dau. 2009. Aerial survey of wintering Pacific brant and other waterbirds on and adjacent to the Izembek NWR, Alaska, 2008-09. Unpubl. USFWS report, Fairbanks, AK. 7pp.
Mallek, E.J., J. Wortham, and B. Eldridge. 2010. Winter waterfowl survey: Mexico west coast and Baja California, January 2010. Unpubl. USFWS report, Fairbanks, AK. 13pp.
Nicolai, C.A., J.S. Sedinger, and M.L. Wege. 2008. Differences in growth of black brant goslings between a major colony and outlying breeding aggregations. Wilson J. Ornithology 120: 755–766.
Pacific Flyway Council. 2004. Pacific Flyway management plan for Pacific brant. Pacific Flyway Study Committee, USFWS, DMBM, Portland, OR. Unpubl. Report. 40pp + appendices.
Pamplin, W.L., Jr. 1986. Cooperative efforts to halt population declines of geese nesting on Alaska’s Yukon-Kuskokwim Delta. Trans. N. Am. Wildl. Nat. Resour. Conf. 51:487-506.
Person, B.T., C.A. Babcock, and R.W. Ruess. 1998. Forage variation in brood-rearing areas used by Pacific black brant geese on the Yukon-Kuskokwim Delta, Alaska. Journal of Ecology 86:243–259.
Person, B.T., M.P. Herzog, R.W. Ruess, J.S. Sedinger, R.M. Anthony, and C.A. Babcock. 2003. Feedback dynamics of grazing lawns: Coupling vegetation change with animal growth. Oecologia 135:583–592.
Platte, R. M., and R. A. Stehn. 2011. Abundance and trend of waterbirds on Alaska’s Yukon-Kuskokwim Delta Coast based on 1988 to 2010 aerial surveys. Unpubl. report, USFWS, Migratory Bird Mgt, Anchorage, AK. 29 Apr 2011. 44pp.
Raveling, D.G. 1984. Geese and hunters of Alaska's Yukon Delta: Management problems and political dilemmas. Trans. N Amer. Wildl. Nat. Res. Conf. 49:555-575.
Raveling, D.G. 1989. Nest predation rates in relation to colony size of black brant. J. Wildlife Management 53:87-90.
Reed, A., R.A. Stehn, and D.H. Ward. 1989. Autumn use of Izembek Lagoon, Alaska, by brant from different breeding areas. Journal of Wildlife Management 53:720-725.
Reed, A., D.H. Ward, D.V. Derksen and J.S. Sedinger. 1998. Brant (Branta bernicla), The Birds of North America Online (A. Poole, Ed.). Ithaca: Cornell Lab of Ornithology; Retrieved from the Birds of North America Online: http://bna.birds.cornell.edu/bna/species/337
Sedinger, J.S., and N.D. Chelgren. 2007. Survival and breeding advantages of larger black brant (Branta bernicla nigricans) goslings: Within- and among-cohort variation. Auk 124:1281–1293.
Sedinger, J.S., N.D. Chelgren, D.H. Ward, and M.S. Lindberg. 2008. Fidelity and breeding probability related to population density and individual quality in black brent geese Branta bernicla nigricans. J. Animal Ecology 77:702-712.
15
Sedinger, J.S., and P.L. Flint. 1991. Growth rate is negatively correlated with hatch date in
black brant. Ecology 72:496–502. Sedinger, J.S., P.L. Flint, and M.S. Lindberg. 1995. Environmental influence on life-history
traits: growth, survival and fecundity in black brant (Branta bernicla). Ecology 76:2404–2414.
Sedinger, J.S., M.P. Herzog, B.T. Person, M.T. Kirk, T. Obritchkewitch, P.P. Martin, and A.A. Stickney. 2001. Large-scale variation in growth of black brant goslings related to food availability. Auk 118:1088–1095.
Sedinger, J.S., M.P. Herzog and D.H. Ward. 2004. Early environment and recruitment of black brant (Branta bernicla nigricans) into the breeding population. Auk 121:68-73.
Sedinger, J.S., M.S. Lindberg, B.T. Person, M.W. Eichholz, M.P. Herzog, and P.L. Flint. 1998. Density dependent effects on growth, body size and clutch size in black brant. Auk 115:613–620.
Sedinger, J.S., C.J. Lensink, D.H. Ward, R.M. Anthony, M.L. Wege, and G.V. Byrd. 1993. Current status and recent dynamics of the black brant Branta bernicla breeding population. Wildlfowl 44:49-59.
Sedinger, J. S., C.A. Nicolai, C.J. Lensink, C. Wentworth, and B. Conant. 2007. Black brant harvest, density dependence, and survival: A record of population dynamics. J. Wildlife Management 71:496-506.
Sedinger, J.S., D.H. Ward, R.M. Anthony, D.V. Derksen, C.J. Lensink, K.S. Bollinger, and N.K. Dawe. 1994. Management of Pacific brant: population structure and conservation issues. Trans. No. Am. Wildl. & Natur. Resour. Conf. 59:50-62.
Spencer, D.L., U.C. Nelson, and W.A. Elkins. 1951. America's greatest goose-brant nest area. Trans. N. Amer. Wildl. Conf. 16:290-295.
Stehn, R.A., E.J. Mallek, and E.J. Taylor. 2010. Monitoring Pacific brant: A comparison of fall and mid-winter population surveys. Unpubl. report, USFWS, Migratory Bird Mgt, Anchorage, AK. 10 Dec 2010. 17pp.
USFWS. 2011. Pacific Flyway Data Book: Waterfowl harvests and status, hunter participation and success in the Pacific Flyway and United States. Unpubl. report, Division of Migratory Bird Management, Portland, OR. Draft, July 2011. Compiled by D.P.Collins and R.E Trost.
Ward, D.H., C.P. Dau, T.L. Tibbitts, J.S. Sedinger, B.A. Anderson, and J.E. Hines. 2009. Change of abundance of Pacific brant wintering in Alaska: Evidence of a climate warming effect. Arctic 62:301-311.
Ward, D.H., A. Reed, J.S. Sedinger, J.M. Black, D.V. Derksen, and P.M. Castelli. 2005. North American brant: Effects of changes in habitat and climate on population dynamics. Global Change Biology 11:869–880.
Ward, D.H. and R. A. Stehn. 1989. Response of brant and other geese to aircraft disturbance at Izembek Lagoon, Alaska. Final report to Minerals Management Service, Intra-agency agreement 14-12-0001-30332. 193pp.
Westerkov, K. 1950. Methods for determining the age of game bird eggs. J. Wildlife Management 14:56-67.
Wilson, H.M. 2007-2011. Aerial photographic surveys of brant colonies on the Yukon-Kuskokwim delta, Alaska. Unpubl. annual reports, USFWS, Anchorage, AK.

16
Table 1. Average brant nest density, average indicated total bird aerial index density, and the ratio of the nest density to aerial index density pooled for the six types of strata on the YKD coast.
Type
Total number of plots
Average nest
density / km2
Total number
of transects
Average aerial index
density / km2
Ratio of nest
density to aerial
index density
Standard error of
ratio CV
Aerial index / (2*nest density)
1 Colony 384 295.16 342 160.82 1.835 0.139 8% 27%2 Periphery 231 35.40 548 25.40 1.394 0.164 12% 36%3 Coastal 609 10.58 889 8.47 1.250 0.115 9% 40%4 Transition 853 1.46 1242 1.36 1.077 0.113 10% 46%5 Inland 278 0.21 593 0.79 0.264 0.065 24% 189%6 Upland 54 0.00 189 0.20 0.000
2,3,4 Pooled non‐colony 1693 9.32 2679 6.93 1.345 0.091 7% 37%
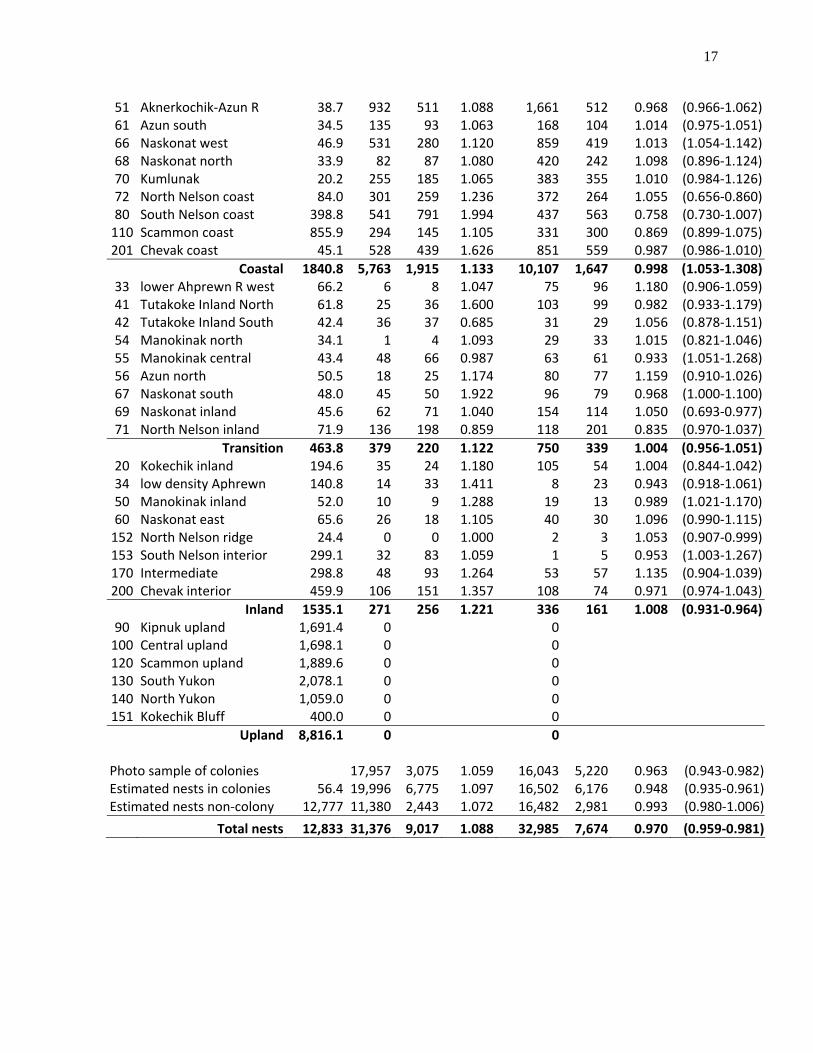
Table 2. Estimated nest population size in each of the 48 strata (Fig. 2) based on ratio of nests to aerial indices in each stratum type (Table 1). 1986‐1993 1993‐2011
StrN Strata name
Strata km2
Avg. nests
SD nests
Growth Rate
Avg. nests
SD nests
Growth Rate 90% c.i. GR
1 Kokechik 10.7 6,586 2,477 1.117 5,267 2,958 0.935 (0.931‐0.964)4 Tutakoke 15.3 3,774 1,574 1.103 3,522 1,466 0.947 (0.928‐0.971)8 Baird Island 10.4 5,073 1,877 1.056 4,120 1,908 0.949 (0.959‐0.996)13 Kigigak 12.8 2,518 1,131 1.067 2,150 625 0.977 (0.929‐0.973)16 Baird Peninsula 7.2 2,045 1,540 1.334 1,443 584 0.951 (0.935‐0.961)
Colony 56.4 19,996 6,775 1.097 16,502 6,176 0.948 (0.925‐1.012)
2 Kokechik Bay south 29.9 1,947 808 1.169 2,287 1,365 0.969 (0.954‐1.015)5 Tutakoke coast north 26.1 256 172 1.162 784 309 0.984 (0.954‐1.138)7 Baird Peninsula edge 10.8 755 694 1.031 299 190 1.046 (0.962‐1.015)17 Tutakoke coast south 35.8 1,286 620 0.967 1,231 450 0.989 (0.946‐1.012)160 Kigigak east 18.9 724 323 0.987 689 262 0.979 (0.952‐1.005)
Periphery 121.4 4,967 906 1.022 5,289 1,891 0.978 (0.982‐1.037)3 Kokechik River 54.2 905 693 1.436 1,841 620 1.009 (0.967‐1.032)9 Manokinak R south 28.5 171 92 1.155 543 231 1.000 (1.035‐1.119)11 Manokinak R north 41.1 135 107 1.257 694 386 1.077 (1.012‐1.287)12 Opagaryak R 89.0 124 159 1.368 338 263 1.150 (0.952‐1.175)15 Newtok peninsula 15.3 296 328 1.074 216 184 1.063 (0.962‐1.037)40 Punorat Point 54.5 531 395 0.863 996 608 0.999 (0.946‐0.989)
17
51 Aknerkochik‐Azun R 38.7 932 511 1.088 1,661 512 0.968 (0.966‐1.062)61 Azun south 34.5 135 93 1.063 168 104 1.014 (0.975‐1.051)66 Naskonat west 46.9 531 280 1.120 859 419 1.013 (1.054‐1.142)68 Naskonat north 33.9 82 87 1.080 420 242 1.098 (0.896‐1.124)70 Kumlunak 20.2 255 185 1.065 383 355 1.010 (0.984‐1.126)72 North Nelson coast 84.0 301 259 1.236 372 264 1.055 (0.656‐0.860)80 South Nelson coast 398.8 541 791 1.994 437 563 0.758 (0.730‐1.007)110 Scammon coast 855.9 294 145 1.105 331 300 0.869 (0.899‐1.075)201 Chevak coast 45.1 528 439 1.626 851 559 0.987 (0.986‐1.010)
Coastal 1840.8 5,763 1,915 1.133 10,107 1,647 0.998 (1.053‐1.308)33 lower Ahprewn R west 66.2 6 8 1.047 75 96 1.180 (0.906‐1.059)41 Tutakoke Inland North 61.8 25 36 1.600 103 99 0.982 (0.933‐1.179)42 Tutakoke Inland South 42.4 36 37 0.685 31 29 1.056 (0.878‐1.151)54 Manokinak north 34.1 1 4 1.093 29 33 1.015 (0.821‐1.046)55 Manokinak central 43.4 48 66 0.987 63 61 0.933 (1.051‐1.268)56 Azun north 50.5 18 25 1.174 80 77 1.159 (0.910‐1.026)67 Naskonat south 48.0 45 50 1.922 96 79 0.968 (1.000‐1.100)69 Naskonat inland 45.6 62 71 1.040 154 114 1.050 (0.693‐0.977)71 North Nelson inland 71.9 136 198 0.859 118 201 0.835 (0.970‐1.037)
Transition 463.8 379 220 1.122 750 339 1.004 (0.956‐1.051)20 Kokechik inland 194.6 35 24 1.180 105 54 1.004 (0.844‐1.042)34 low density Aphrewn 140.8 14 33 1.411 8 23 0.943 (0.918‐1.061)50 Manokinak inland 52.0 10 9 1.288 19 13 0.989 (1.021‐1.170)60 Naskonat east 65.6 26 18 1.105 40 30 1.096 (0.990‐1.115)152 North Nelson ridge 24.4 0 0 1.000 2 3 1.053 (0.907‐0.999)153 South Nelson interior 299.1 32 83 1.059 1 5 0.953 (1.003‐1.267)170 Intermediate 298.8 48 93 1.264 53 57 1.135 (0.904‐1.039)200 Chevak interior 459.9 106 151 1.357 108 74 0.971 (0.974‐1.043)
Inland 1535.1 271 256 1.221 336 161 1.008 (0.931‐0.964)90 Kipnuk upland 1,691.4 0 0 100 Central upland 1,698.1 0 0 120 Scammon upland 1,889.6 0 0 130 South Yukon 2,078.1 0 0 140 North Yukon 1,059.0 0 0 151 Kokechik Bluff 400.0 0 0
Upland 8,816.1 0 0
Photo sample of colonies 17,957 3,075 1.059 16,043 5,220 0.963 (0.943‐0.982)Estimated nests in colonies 56.4 19,996 6,775 1.097 16,502 6,176 0.948 (0.935‐0.961)Estimated nests non‐colony 12,777 11,380 2,443 1.072 16,482 2,981 0.993 (0.980‐1.006)
Total nests 12,833 31,376 9,017 1.088 32,985 7,674 0.970 (0.959‐0.981)
18
Figure 1. Aerial transect survey lines flown the first week in June in 2010 sampling 12,832 km2 of the coastal tundra wetlands on the Yukon-Kuskokwim Delta, Alaska.
19
Figure 2. Stratification boundaries used to estimate nest density and aerial index density. Strata were lumped into 6 types including the 5 major brant colonies (dark blue), regions immediately on the periphery of those colonies (green), other coastal locations (gold), transition areas (gray), inland (light tan), and upland (brown). The numbers refer to the strata as listed in Table 2.
20
0
5,000
10,000
15,000
20,000
25,000
1981
1983
1985
1987
1989
1991
1993
1995
1997
1999
2001
2003
2005
2007
2009
2011
Nes
ts in
co
lon
ies
Baird PeninsulaBaird Inlet IslandKigigak IslandTutakokeKokechiklocal 5-yr average
Figure 3. Estimated number of brant nests in five major colonies on the YKD. The unshaded sections of a column indicate missing data replaced by the average from the nearest 2-years of data at that colony. The line indicates a 5-year local average of the total colony nest population and shows the long-term decline since the early 1990s.
0
5,000
10,000
15,000
20,000
25,000
198
5
198
7
198
9
199
1
199
3
199
5
199
7
199
9
200
1
200
3
200
5
200
7
200
9
201
1
Est
imat
ed n
ests
in
plo
t-sa
mp
led
are
a
Figure 4. Estimated number of nests in the ground-plot sampled area excluding any colonies. Vertical lines indicate 90% confidence intervals for annual estimates and the solid line shows the 5-year local average.
21
Nests in 5 colonies
0
4,000
8,000
12,000
16,000
20,000
24,000
1986
1988
1990
1992
1994
1996
1998
2000
2002
2004
2006
2008
2010
colony photo estimateaerial index in colonies
Growth rate= 0.963
Growth rate = 0.948
Nests in plot-sampled area
0
4,000
8,000
12,000
16,000
198
6
198
8
199
0
199
2
199
4
199
6
199
8
200
0
200
2
200
4
200
6
200
8
201
0
nest plot estimateaerial index in plot area
Growth rate = 1.006
Growth rate = 1.016
Figure 5. The aerial survey index in the 5 brant colonies (blue, open columns) compared to photographic estimates of nests (gray columns), and the aerial survey index in the plot sampled area (brown, open columns) compared to the nest population estimated from searched plots (gray columns). All trend lines shown were fit to 1993-2011 data.
0
0.5
1
1.5
2
2.5
3
3.5
4
0.1 1.0 10.0 100.0 1000.0Aerial index density per sq. km. (log scale)
Ra
tio
of
Ne
st
to A
eri
al i
nd
ex
de
ns
ity
ColonyPeripheryCoastalTransitionInland
Figure 6. The average ratio of nest density to aerial survey index density in the individual strata pooled into 5-year groups. Vertical lines indicate standard errors around each ratio illustrating the large sampling error of individual estimates. The colored horizontal lines indicate the average ratio for each stratum type (Table 1) plotted over the approximate range of index densities from which it was derived.

22
0
5,000
10,000
15,000
20,000
25,000
30,000
35,000
40,000
19
86
19
88
19
90
19
92
19
94
19
96
19
98
20
00
20
02
20
04
20
06
20
08
20
10
Est
imat
ed n
est
po
pu
lati
on Colony
0
2,000
4,000
6,000
8,000
10,000
12,000
14,000
16,000
18,000
19
86
19
88
19
90
19
92
19
94
19
96
19
98
20
00
20
02
20
04
20
06
20
08
20
10
Es
tim
ate
d n
est
po
pu
lati
on Periphery
0
2,000
4,000
6,000
8,000
10,000
12,000
14,000
16,000
18,000
19
86
19
88
19
90
19
92
19
94
19
96
19
98
20
00
20
02
20
04
20
06
20
08
20
10
Est
imat
ed n
est
po
pu
lati
on Coastal
0
500
1,000
1,500
2,000
2,500
3,000
1986
1988
1990
1992
1994
1996
1998
2000
2002
2004
2006
2008
2010
Es
tim
ate
d n
es
t p
op
ula
tio
n Transition
0
500
1,000
1,500
2,000
2,500
3,000
19
86
19
88
19
90
19
92
19
94
19
96
19
98
20
00
20
02
20
04
20
06
20
08
20
10
Es
tim
ate
d n
es
t p
op
ula
tio
n Inland
0
10,000
20,000
30,000
40,000
50,000
19
86
19
88
19
90
19
92
19
94
19
96
19
98
20
00
20
02
20
04
20
06
20
08
20
10
Es
tim
ate
d n
es
t p
op
ula
tio
nInlandTransitionCoastalPeripheryColony
Figure 7. Estimated population of brant nests in colony, periphery, coastal, transition, and inland stratum types based on aerial index observations. Vertical lines indicate 90% confidence intervals including both sampling error from the aerial transects and variability from the nest to aerial index ratio conversion factor.
23
0.80
0.85
0.90
0.95
1.00
1.05
1.10
1.15
1.20
0 20 40 60 80average nest density
Gro
wth
ra
te 1
99
3-2
01
1
100 300 500 700colony nest density
Figure 8. Average growth rate from 1993-2011 of estimated brant nests in individual strata plotted against average density over the same time period. Positive growth rates only occurred at densities below 35 nests per km2.

24
Figure 9. Estimated kernel density based on 13,241 individual aerial survey sightings of brant on the central coastal zone of the Yukon-Kuskokwim Delta, 2002-2011calculated with a search radius of 1.6 km and converted to density polygons. Each sighting of a single, pair, or flock was given equal weight. Areas with density less than 2 sightings per km2 are not shown.

25
0
20,000
40,000
60,000
80,000
100,000
120,000
140,000
160,000
180,000
200,000
195
9
196
2
196
5
196
8
197
1
197
4
197
7
198
0
198
3
198
6
198
9
199
2
199
5
199
8
200
1
200
4
200
7
201
0P
ac
ific
bra
nt
co
un
ted
sum ALL mid-winter countsIzembek October replicate surveys3-year running average mid-winter3-year running average Izembek
Figure 10. Total population counts of Pacific brant (black brant and WHA gray-bellied brant) based on the sum of all mid-winter counts Mexico to Alaska (gray columns) and the average of replicated fall counts at Izembek Lagoon (green columns). The January winter counts are plotted in the previous calendar year to match the year of breeding and the fall population count.