morphometric analysis of upper end of...
TRANSCRIPT
MORPHOMETRIC ANALYSIS OF
UPPER END OF FEMUR
DISSERTATION SUBMITTED TO
THE TAMIL NADU DR.M.G.R MEDICAL UNIVERSITY
IN PARTIAL FULFILMENT OF THE REGULATIONS FOR THE
AWARD OF THE DEGREE OF
M.D. BRANCH- XXIII
ANATOMY
SREE MOOKAMBIKA INSTITUTE OF MEDICAL SCIENCES,
KULASEKHARAM
THE TAMILNADU DR. M.G.R. MEDICAL UNIVERSITY
CHENNAI - 600 032
APRIL - 2016
CERTIFICATE
This is to certify that the dissertation entitled “MORPHOMETRIC
ANALYSISOF UPPER END OF FEMUR” is a bonafide work done by
Dr.S.P.Rathija Sreekumar, Sree Mookambika Institute of Medical
Sciences, Kulasekharam in partial fulfilment of the University rules and
regulations for the award of MD in Anatomy under our guidance and
supervision during the academic year 2013- 2016.
Dr.P.C.Kunjumon.MS Dr.G.V.Hebbal.M.Sc,PhD (Med.fac)
(Guide) (Co-guide)
Professor & Head of the Department Professor
Department of Anatomy Department of Anatomy
Sree Mookambika Institute of Sree Mookambika Institute of
Medical Sciences, Medical Sciences,
Kulasekharam. Kulasekharam.
CERTIFICATE
This is to certify that the dissertation entitled “MORPHOMETRIC
ANALYSISOF UPPER END OF FEMUR” is a bonafide work done by
Dr.S.P.Rathija Sreekumar, Sree Mookambika Institute of Medical
Sciences, Kulasekharam in partial fulfilment of the University rules and
regulations for the award of MD in Anatomy under our guidance and
supervision during the academic year 2013- 2016.
Dr.Rema.V.Nair.MD(OB&G), DGO
The Director
Sree Mookambika Institute of Medical Sciences,
Kulasekharam [K.anyaKumari District]
Tamil Nadu- 629 161.
Dr.P.C.Kunjumon.MS
(Guide)
Professor & Head of the Department
Department of Anatomy
Sree Mookambika Institute of Medical Sciences,
Kulasekharam. [KanyaKumar District]
Tamil Nadu- 629 161.
DECLARATION
I Solemnly declare that the dissertation ‘MORPHOMETRIC STUDY
OF UPPER END OF FEMUR’ was prepared by me at Sree Mookambika
Institute of Medical Sciences, Kulasekharam under the guidance and
supervision of Dr.P.C.Kunjumon. M.S, Professor & HOD, Department of
Anatomy, Sree Mookambika Institute of Medical Sciences, Kulasekharam.
This dissertation is submitted to The Tamilnadu Dr.M.G.R Medical
University, Chennai in partial fulfilment of the University regulations for the
award of the degree of M.D (Anatomy).
Place: Kulasekharam.
Date: DR. S.P.RATHIJA SREEKUMAR
ACKNOWLEDGEMENT
I thank “ LORD ALMIGHTY”, for all the blessings he showered on
me throughout my life.
I would like to express my hearty thanks to Dr.Rema.V.Nair. MD
(OB&G), DGO, Director and Dr.Velayuthan Nair.M.S (Gen. Surgery),
Chairman for permitting me to conduct the study in Sree Mookambika
Institute of Medical Sciences, Kulasekharam.
I would like to express my sincere thanks to Dr.Padmakumar. MS,
Mch, Principal of Sree Mookambika Institute of Medical Sciences for
indulging me to co-ordinate this dissertation using college facilities.
It is a great pleasure to express my gratitude and sincere thanks to my
guide Dr.P.C.Kunjumon.MS, Professor and Head of the Department of
Anatomy for selecting this topic & encouraging me constantly with great
support.
I also express my sincere thanks to Dr.G.V.Hebbal. MSc, Ph.D,
Professor, Department of Anatomy, Sree Mookambika Institute of Medical
Sciences for his encouragement & valuable guidance at every stage of this
study.
I also express my sincere thanks to Dr.Arun Kumar.S. Bilodi, M.S,
Professor, Department of Anatomy, Sree Mookambika Institute of Medical
Sciences for his encouragement and guidance.
I am grateful to Dr.Anju More Balaji.M.D, Associate professor,
Department of Anatomy for her help and support during my post graduate
programme.
I would like to extend my special thanks to Dr. Shoma Alban,
Dr. Susie David and Dr. J.B.Linda, Assistant Professors, Department of
Anatomy for their whole hearted support during this study and my post
graduate programme.
It is with great pleasure and gratitude that I keep on record the
encouragement and support I received from Dr.Velusamy and Dr.Preethi
Pawde.
I am very much thankful to the Associate Professors, Assistant
Professors, Tutors, My Seniors and non- teaching staffs of the Department of
Anatomy for their co-operation throughout my study.
I express my thanks to my dear husband Dr.K.Greesh, my parents
Mr.B.Sreekumar and Dr. Prasanna Sreekumar, my brother Mr. Ranjith,
my sister Dr. Rathisha and my in-laws for their whole hearted support and
affection throughout the course.
DR. S.P.RATHIJA SREEKUMAR

CONTENTS
SL.NO. INDEX PAGE NO.
1. INTRODUCTION 1-4
2. AIMS AND OBJECTIVES 5
3. REVIEW OF LITERATURE 6-48
4. MATERIALS AND METHODS 49-58
5. RESULTS 59-72
6. DISCUSSION 73-78
7. SUMMARY AND CONCLUSION 79-80
8. BIBLIOGRAPHY
9. ANNEXURES
LIST OF ABBREVATIONS
CDA - Collo diaphyseal angle.
NSA - Neck Shaft angle.
HTD - Head transverse diameter.
NTD - Neck transverse diameter.
HVD - Head vertical diameter.
NVD - Neck vertical diameter.
PB - Proximal breadth.
FA - Femoral anteversion.
BMI - Body mass index.
BMD - Bone mineral density.
FNL – Femoral neck length.
FNW - Femoral neck width.
FHD - Femoral head diameter.
FAL – Femoral axis length.
DHS - Dynamic hip screw.
PFN - Proximal femoral nails.
SD - Standard deviation.
Introduction
1
INTRODUCTION
Femur is the thigh bone which is the longest and strongest bone of the
body. It provides skeletal support for the thigh. It consists of a proximal end, a
shaft and a distal end. The proximal end of femur consists of a head, a neck
and on the upper part of the shaft there are two large projections known as
greater trochanter and lesser trochanter.
Femur has a spherical head that articulates with the acetabulum of the
pelvic bone. On its medial surface, it has a non- articular pit called fovea
which gives attachment to the round ligament of the head of the femur.
Femoral neck is a cylindrical strut of bone which connects the head to
the shaft of the femur. Approximately at an angle of 1250 the neck projects
superomedially from the shaft and also it projects slightly forwards. The
greater and lesser trochanters provides attachments to the muscles that move
the hip joint.1
Approximately the neck of the femur is 5cms long and connects the
head and the shaft at an angle. This is known as the angle of inclination or the
neck-shaft angle or collo diaphyseal angle (CDA) or cervico diaphyseal angle
of the femur. In most of the cases, the collo diaphyseal angle on the right side
is lesser than that of the left side and there was no significant differences
between the two sexes.2
Introduction
2
Fractures involving the neck and trochanter of the proximal end of the
femur are very common. Internal fixation with implants for these fractures are
important for rehabilitation and early mobilization of the patients. Depending
upon the dimensions of the upper end of the femur, the implants are designed.
Currently most of the orthopaedic surgeons need notifications in the
dimensions of the implants that suits the Indian standards.3
To measure the dimensions of the femur, various methods are used by
researchers. The femur dimensions on cadaveric bones are measured
mechanically, but in patients, various methods such as ultrasound,
roentgenography, computerised tomography (CT) and magnetic resonance
imaging (MRI) are used. Number of studies in femur dimensions varies
according to the methods adopted and according to the populations.4
On the basis of measurements performed in Causasians, the implants
are used for the treatment of proximal femur fractures including the 1350
cervico diaphyseal angle. At birth the cervico diaphyseal angle measures about
an average of 1600 and is greater but along with the skeletal growth the angle
decreases and in adults the cervico diaphyseal angle measures on an average
of 1350. So for the manufacture of implants used in the orthopaedic surgery,
the reference value of about 1350 is used.
5
For pre-operative assessment of the size of the implants, combined use
of computerised tomography and radiography is recommended, especially in
the cemented arthroplasty where it is essential for an optimal biological
Introduction
3
fixation.6 Anthropometry gives various techniques and scientific methods for
taking number of measurements in the different races and geographical
regions.7
The individuals in the central Indian population have medium femora
when compared to the other available data.8 In India, very few studies have
been done on morphometry of the femur and these studies reveal that in
Indian population the results of western studies are not applicable because the
measurements of the femora differ in both populations.9
Proximal femur morphology is a necessary parameter for designing and
implant development in the total hip replacement. Use of inappropriately
designed implants and their size affects the outcome of the surgery with some
complications such as micromotion, loosening and stress shielding. Implants
are mostly manufactured and designed in North America and European region
which are designed, based on morphology of their population.10
Femoral neck fractures are mostly intracapsular and as a result of the
fracture, the cervical vessels which are formed from subsynovial intra articular
ring are disrupted. Therefore head of the femur may be necrosed in such cases
and it is necessary to carry out a total hip replacement or hemiarthroplasty.
Intertrochanteric fracture is another typical fracture around the hip joint. In
this case femoral neck is not involved and usually fracture line begins from
greater trochanter to the lesser trochanter.1
Introduction
4
Femoral neck blood supply is preserved in intertrochanteric fractures.
These types of fractures are usually corrected by the surgeries using femoral
plate and a pin that obtains alignment to the central portion of the neck of the
femur. Early mobilization allows the fractures to heal well.1The collo-
diaphyseal angle gives greater mobility at the hip joint. Any difference
identified from a normal neck shaft angle (NSA) of the femur reflects the
anatomical variation or acquired origin or disease. Decrease in the neck shaft
angle of the femur is termed as coxavara. In this case, the femoral head
position tends to seat very deep in the acetabulum and the hip remains very
stable. Increase in the neck shaft angle is termed as coxavalga. In this case, the
hip tends to have very less contact with the dorsal acetabulum and it may
result in the subluxation or luxation.2 Reduction of bone mineral density is a
characteristic feature of a disease called osteoporosis. Proximal femur is the
most susceptible site of osteoporosis. Mechanical properties of the bone is
reduced in osteoporosis.11
An important indicator of femoral fracture is low
bone mineral density.12
Bone mineral density cannot evaluate the fracture risk.
There are also certain patients who present with normal bone mineral density
but with high fracture risk.13
This study will enlighten the implant designers to take a step on
altering the designs of the implants that suits our Indian needs.

Aims And Objectives
5
AIMS AND OBJECTIVES
1. To describe
The angle between neck and shaft (NSA) on both sides.
Head vertical diameter (HVD) on both sides.
Neck vertical diameter (NVD) on both sides.
Head transverse diameter (HTD) on both sides.
Neck transverse diameter (NTD) on both sides.
Proximal breadth (PB) on both sides.
2. To find out whether there is any significant differences between right and
left femur.
Review of Literature
6
REVIEW OF LITERATURE
Review of literature is described under following headings:
1.Anatomy of the Femur
2.Blood supply of a long bone
3.Embryogenesis of a long bone
4.Measurements of proximal femur
5.Different methods used to measure the femoral geometry
6.Femoral fractures
7. Implants used
Review of Literature
7
1. ANATOMY OF FEMUR:
The femur is a long bone which consists of an upper end, a shaft and a
lower end. The proximal end of the femur is distinguished from the distal end
by the presence of a rounded head which joins with the shaft by an elongated
neck. The head of the femur is directed medially and it articulates with the
acetabulum of the hip bone.
The anterior aspect and the posterior aspect of the femur can be
identified by examining the shaft of the bone. The anterior aspect of the shaft
is smooth and convex forwards, whereas its posterior aspect has a prominent
vertical ridge called the linea aspera.
The upper end:
The femur consists of two projections in its upper end known as greater
trochanter and lesser trochanter. Apart from being directed medially the head
is also directed upwards and a little forwards. Femoral head is much more
rounded when compared to the head of the humerus and it is slightly more
than half a sphere. A pit or a fovea can be seen near the centre of the femoral
head.
The neck of the femur connects the head to the shaft at an angle of
1250. The neck is about 5cms long.
Review of Literature
8
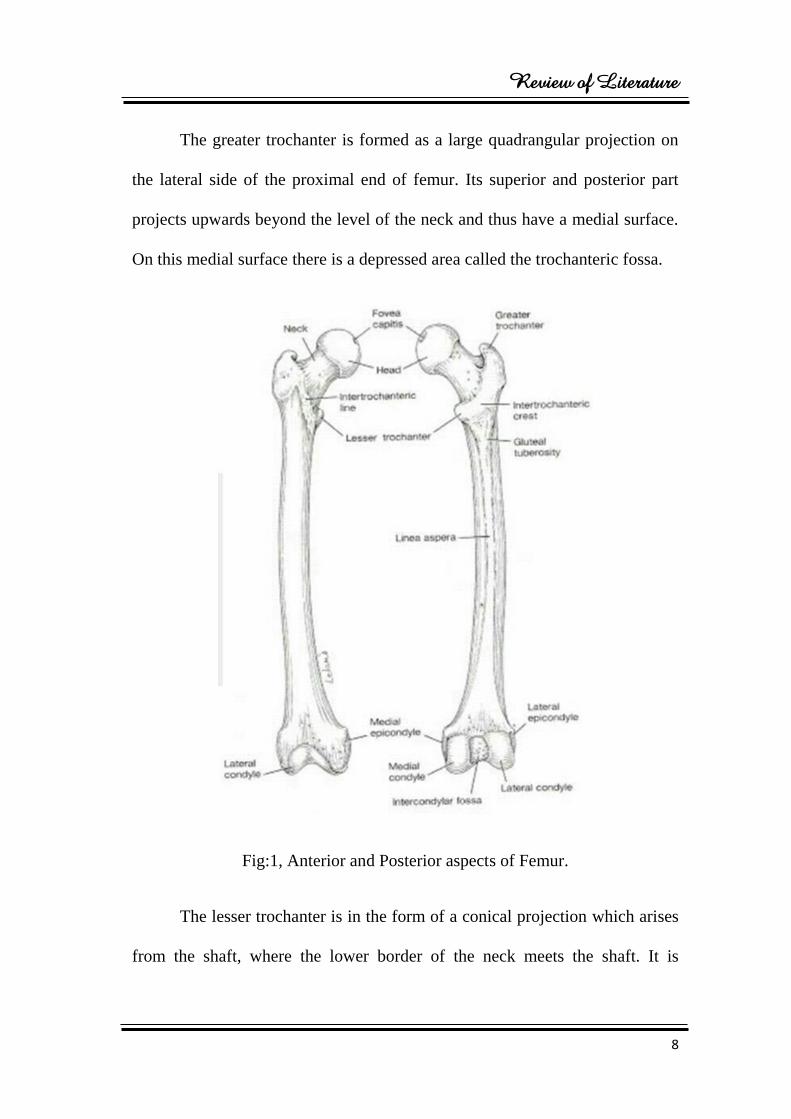
The greater trochanter is formed as a large quadrangular projection on
the lateral side of the proximal end of femur. Its superior and posterior part
projects upwards beyond the level of the neck and thus have a medial surface.
On this medial surface there is a depressed area called the trochanteric fossa.
Fig:1, Anterior and Posterior aspects of Femur.
The lesser trochanter is in the form of a conical projection which arises
from the shaft, where the lower border of the neck meets the shaft. It is
Review of Literature
9
directed medially and backwards. Posteriorly, the greater and the lesser
trochanters are joined together by a prominent ridge called the
intertrochanteric crest. This crest bears a rounded elevation a little above its
middle called the quadrate tubercle. On the anterior aspect, the junction of the
neck and the shaft of the femur is marked by a very less prominent
intertrochanteric line. Superiorly, this line reaches the anterior and upper part
of the greater trochanter and inferiorly it lies a little infront of the lesser
trochanter. From the lesser trochanter, the intertrochanteric line is continuous
with the spiral line that runs downwards and backwards crossing the medial
aspect of the shaft to reach the posterior aspect.
The Shaft:
The shaft is triangular in cross section having three surfaces (medial,
lateral and anterior) and three borders (medial, lateral and posterior). The
medial and lateral borders are rounded. The posterior border corresponds to
the linea aspera. Here the medial and the lateral surfaces of the bone also faces
backwards. The linea aspera has medial and a lateral lips. When traced
upwards the medial lip becomes continuous with the spiral line and the lateral
lip becomes continuous with the broad rough area called as the gluteal
tuberosity. Superiorly, the gluteal tuberosity reaches the greater trochanter. On
the posterior aspect, upper one third of the shaft has an area between the
gluteal tuberosity and the spiral line which constitutes the posterior surface.
The linea aspera diverges in the lower one third of the shaft and becomes
Review of Literature
10
continuous with the medial and lateral supracondylar lines. An additional
triangular surface can be noted in between the two supracondylar lines known
as the popliteal surface.
The lower end:
It consists of two large medial and lateral condyles. Anteriorly, the two
condyles are joined and they lie in the same plane as that of the distal end of
the shaft. On the posterior aspect, the medial and the lateral condyles extend
beyond the plane of the shaft and here the intercondylar notch or fossa
separates the condyles from each other. The side view of the lower end of the
bone shows an arc with downward convexity. The medial condyle is curved a
little having a medial convexity. In contrast, the lateral condyle is straight and
is directed backwards and slightly laterally. An articular area can be seen in
the anterior aspect of the condyles for the patella (patellar surface). The two
condyles articulate with the tibia below and form the knee joint. On the lateral
aspect, the lateral condyle of the femur is more or less flat and slightly behind
the middle there is a prominence called lateral epicondyle. The medial aspect
of the medial condyle is convex and the most prominent part on it is called the
medial epicondyle. There is a small prominence at the uppermost part of the
medial condyle called adductor tubercle which can be seen above and behind
the medial epicondyle.14
Review of Literature
11
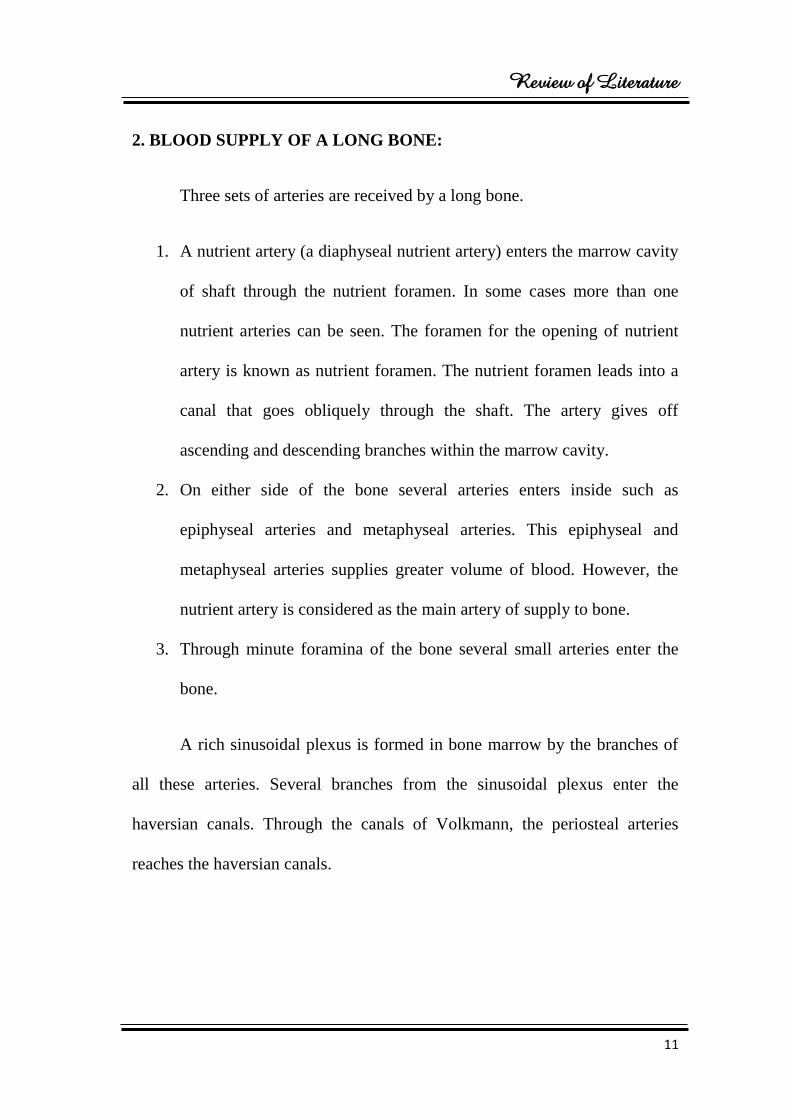
2. BLOOD SUPPLY OF A LONG BONE:
Three sets of arteries are received by a long bone.
1. A nutrient artery (a diaphyseal nutrient artery) enters the marrow cavity
of shaft through the nutrient foramen. In some cases more than one
nutrient arteries can be seen. The foramen for the opening of nutrient
artery is known as nutrient foramen. The nutrient foramen leads into a
canal that goes obliquely through the shaft. The artery gives off
ascending and descending branches within the marrow cavity.
2. On either side of the bone several arteries enters inside such as
epiphyseal arteries and metaphyseal arteries. This epiphyseal and
metaphyseal arteries supplies greater volume of blood. However, the
nutrient artery is considered as the main artery of supply to bone.
3. Through minute foramina of the bone several small arteries enter the
bone.
A rich sinusoidal plexus is formed in bone marrow by the branches of
all these arteries. Several branches from the sinusoidal plexus enter the
haversian canals. Through the canals of Volkmann, the periosteal arteries
reaches the haversian canals.
Review of Literature
12
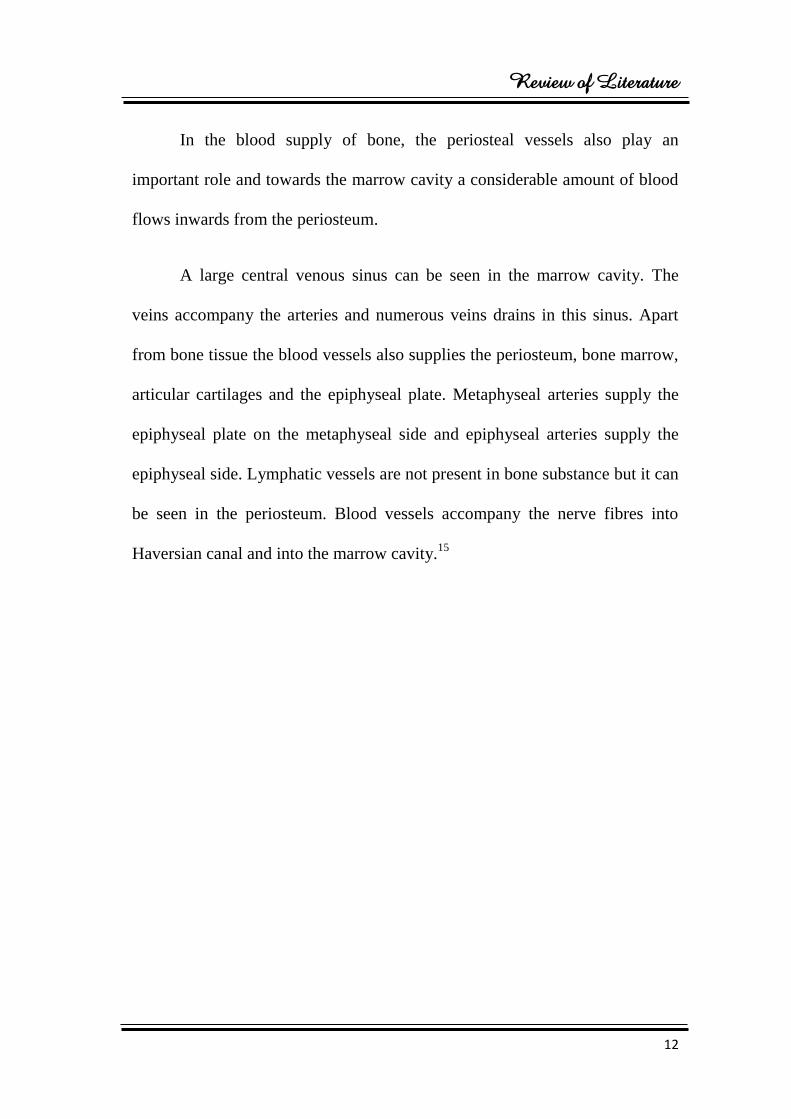
In the blood supply of bone, the periosteal vessels also play an
important role and towards the marrow cavity a considerable amount of blood
flows inwards from the periosteum.
A large central venous sinus can be seen in the marrow cavity. The
veins accompany the arteries and numerous veins drains in this sinus. Apart
from bone tissue the blood vessels also supplies the periosteum, bone marrow,
articular cartilages and the epiphyseal plate. Metaphyseal arteries supply the
epiphyseal plate on the metaphyseal side and epiphyseal arteries supply the
epiphyseal side. Lymphatic vessels are not present in bone substance but it can
be seen in the periosteum. Blood vessels accompany the nerve fibres into
Haversian canal and into the marrow cavity.15
Review of Literature
13
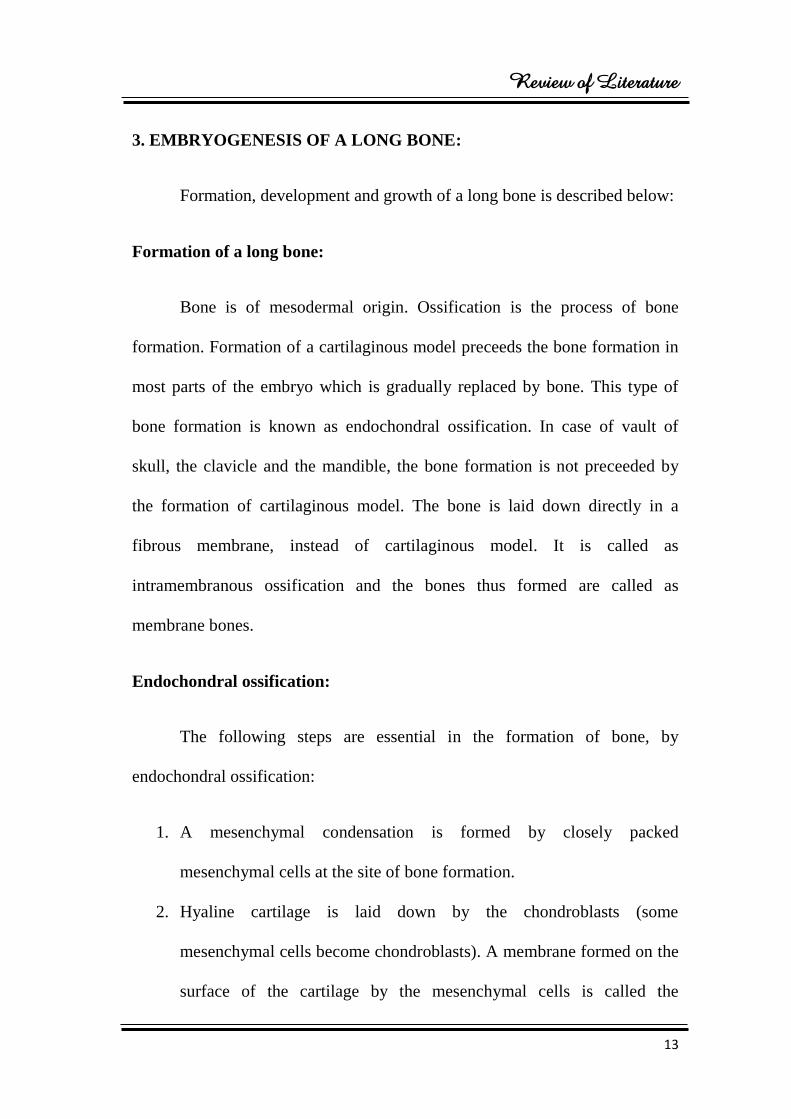
3. EMBRYOGENESIS OF A LONG BONE:
Formation, development and growth of a long bone is described below:
Formation of a long bone:
Bone is of mesodermal origin. Ossification is the process of bone
formation. Formation of a cartilaginous model preceeds the bone formation in
most parts of the embryo which is gradually replaced by bone. This type of
bone formation is known as endochondral ossification. In case of vault of
skull, the clavicle and the mandible, the bone formation is not preceeded by
the formation of cartilaginous model. The bone is laid down directly in a
fibrous membrane, instead of cartilaginous model. It is called as
intramembranous ossification and the bones thus formed are called as
membrane bones.
Endochondral ossification:
The following steps are essential in the formation of bone, by
endochondral ossification:
1. A mesenchymal condensation is formed by closely packed
mesenchymal cells at the site of bone formation.
2. Hyaline cartilage is laid down by the chondroblasts (some
mesenchymal cells become chondroblasts). A membrane formed on the
surface of the cartilage by the mesenchymal cells is called the
Review of Literature
14
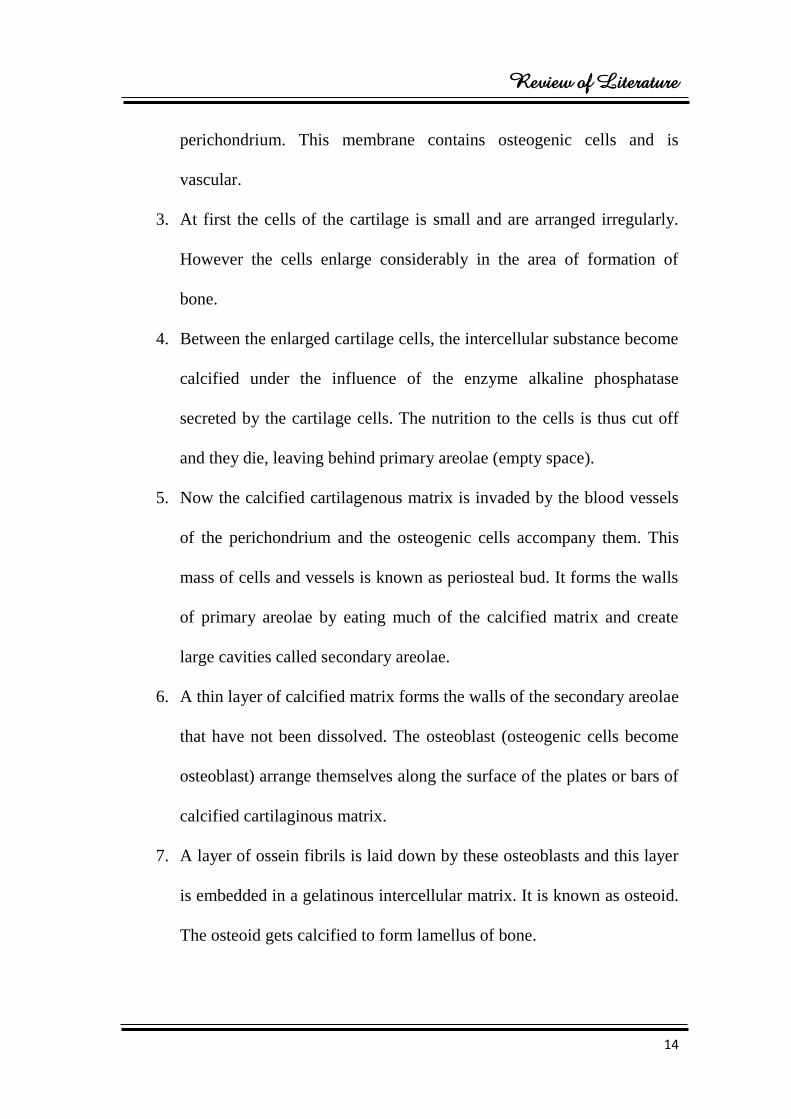
perichondrium. This membrane contains osteogenic cells and is
vascular.
3. At first the cells of the cartilage is small and are arranged irregularly.
However the cells enlarge considerably in the area of formation of
bone.
4. Between the enlarged cartilage cells, the intercellular substance become
calcified under the influence of the enzyme alkaline phosphatase
secreted by the cartilage cells. The nutrition to the cells is thus cut off
and they die, leaving behind primary areolae (empty space).
5. Now the calcified cartilagenous matrix is invaded by the blood vessels
of the perichondrium and the osteogenic cells accompany them. This
mass of cells and vessels is known as periosteal bud. It forms the walls
of primary areolae by eating much of the calcified matrix and create
large cavities called secondary areolae.
6. A thin layer of calcified matrix forms the walls of the secondary areolae
that have not been dissolved. The osteoblast (osteogenic cells become
osteoblast) arrange themselves along the surface of the plates or bars of
calcified cartilaginous matrix.
7. A layer of ossein fibrils is laid down by these osteoblasts and this layer
is embedded in a gelatinous intercellular matrix. It is known as osteoid.
The osteoid gets calcified to form lamellus of bone.
Review of Literature
15
8. Over the first lamellus, another layer of osteoid is laid down by the
osteoblasts. Now two lamellae of bone are formed. Between the
lamellae, some osteoblasts get caught and form osteocytes. Bony
trabeculae are formed as more lamellae are laid down.
The calcified matrix of cartilage supports the developing trabeculae and
is not converted in to bone itself.
At this stage a central area can be seen in the ossifying cartilage, where
the bone is formed. Away from this area, the followings can be seen:
a. Cartilage cells.
b. In an uncalcified matrix, a zone of hypertrophied cartilage cells
c. Normal cartilage with mitotic activity.
Development of a long bone:
A mesenchymal condensation is seen in the limb bud in the region
where the bone is to be formed. The mesenchymal condensation is converted
into a cartilaginous model. This model closely resembles the bone to be
formed. It is covered by a superficial fibrous layer and a deeper layer that has
osteogenic cells
Endochondral ossification starts in a small area of the shaft. This area is
called the primary ossification. Gradually, bone formation extends from the
Review of Literature
16
primary centre towards the end of the shaft. This accompanied by enlargement
of the cartilaginous model.
Soon after the appearance of the primary centre and onset of
endochondral ossification in it, the perichondrium (which may now be called
periosteum) becomes active. The osteogenic cells in its deeper layer lay down
bone on the surface of the cartilaginous model by intramembranous
ossification. This periosteal bone completely surrounds the cartilaginous shaft
and is therefore, called the periosteal collar. It is first formed only around the
region of the primary centre but rapidly extends towards the ends of the
cartilaginous model. The periosteal collar acts as a splint and gives strength to
the cartilaginous model, at the site where it is weakened by the formation of
secondary areolae. The most of the bone shaft is derived from this periosteal
collar and is, therefore, intramembranous in origin.
Growth of a long bone:
A growing bone increase both in length and in thickness. The
periosteum lays down a layer of bone around the shaft of the cartilaginous
model. This periosteal collar gradually extends over the whole length of the
diaphysis. As more layers of bone are laid down over it, the periosteal bone
become thicker and thicker. However, it is neither necessary nor desirable for
it to become too thick. Hence, osteoclast come to line the internal surface of
the shaft. And remove bone from this aspect. As bone is laid down outside the
Review of Literature
17
shaft, it is removed from inside. The shaft thus grows in diameter, and at the
same time its wall does not become too thick. The osteoclasts also remove the
trabeculae lying in the centre of the bone that were formed by endochondral
ossification. In this way a marrow cavity is formed.
As the shaft increases in diameter, there is a corresponding increase in
the size of the marrow cavity. This cavity also extends towards the ends of the
diaphysis but does not reach the epiphyseal plate. Gradually, most of the bone
formed from the primary centre (endochondral origin) is removed, except near
the ends, so that the wall of the shaft is made up purely of periosteal bone
formed by the process of intramembranous ossification.
a) Zone of resting cartilage:
The cells are small and irregularly arranged.
b) Zone of proliferating cartilage:
The cells are larger and are undergoing repeated mitosis. As they
multiply, they come to be arranged in parallel columns, separated by bars of
intercellular matrix.
c) Zone of calcification:
The cells become still larger and the matrix becomes calcified.

Review of Literature
18
Next to the zone of calcification, there is a zone where casrtilage cells
are dead and the calcified matrix is being replaced by bone. Growth in length
of the bone take place by continuous transformation of the epiphyseal cartilage
to bone in this zone. At the same time, the thickness of the epiphyseal cartilage
is maintained by active multiplication of cells in the zone of proliferation.
When the bone has attained its full length, cells in the epiphyseal cartilage stop
proliferating. The process of ossification, however, continues to extend into it
until the whole of the epiphyseal plate is converted into bone. The bone of the
diaphysis and epiphysis then becomes continuous. This is called fusion of
epiphysis.16
Review of Literature
19
4. MEASUREMENTS OF PROXIMAL FEMUR:
In 1889, Humphry.G et al conducted a study on the angle of the neck
with shaft of the femur at different periods of life and under different
circumstances and said that the collo diaphyseal angle (CDA) was very stable
from mid adolescence.17
In 1914, Parsons.F.G et al, documented that in females the femoral
anteversion (FA) was greater on right side when compared to left side.18
In 1941, Pick.J.W et al, studied the measurements on the human
femur: length, diameter and angle by radiographic assessment, measurements
taken from 100 males and 100 females and documented that females having
larger neck shaft angle when compared to males.19
In 1945, Elftman.H et al, did a study on Torsion of lower extremity
and the average value of adult femoral anteversion (FA) and found range
between 70– 16
0 in multiple skeletal surveys.
20
In 1958, Breathnach et al, the author of classic Anatomy text book
quoted the angle of inclination as 120 degrees that may vary from 1100 to
1400.21
In 1968, Kate.B.R et al, had described the average neck shaft angle as
123.50 by observing 1000 femora and he found that the Formosans have lowest
Review of Literature
20
neck shaft angle of an average of about 125.60
and Andamanians have the
highest angle of an average of about 1340.22
In 1970, Chhibber and Singh found that the left limb is dominant.
They stated that whether a person is right handed or left handed, for weight
bearing, most of the people use their left lower limb.23
In 1980, Hoaglund et al, did a comparative study on the anatomy of
upper end of femur between normal Causasians and Hong Kong people. He
identified the differences in the geometry of head, neck and proximal femoral
shaft and found the average collo diaphyseal angle (CDA) of Causasians as
1350
and the anteversion angle as 80.24
In 1982, Reikeras.O et al, studied femoral neck angle measured in 48
pairs of normal femora from cadavers of Norwegians. He found that the
cervico diaphyseal angle of males was about 128.30 7.9
0 and in the female it
was about 1270 7.2
0 and specified that no significant sex differences were
found.25
In 1985, Staheli.L.T et al, detected the lower extremity rotational
problems in children and the normal values to guide management. He stated
that the femoral neck anteversion gradually increases with gestational age and
reported that at the third month it was about 00, after four months it was noted
to be +120
and at the time of birth the femoral neck anteversion was +24.40. By
Review of Literature
21
detorsion in childhood it would change till it reaches the average angle of
+120.26
In 1993, Issac.B et al, studied neck shaft angle of femur and found that
the average collo diaphyseal angle (CDA) as 127.50.27
In 1993, Trikaus.E et al, detected femoral neck shaft angles (NSA) of
Qafzeh-skuhl early modern humans and activity levels among immature near
Eastern middle Paleolithic hominids and said that, from mid adolescence
through most of adulthood, the angle of inclination (AI) was very stable.28
In 1996, Ranganathan.T.S, author of Anatomy text book quoted that
the average cervico diaphyseal angle was about 1250 in adults and 140
0 in
foetuses.29
In 1996, Karlsson et al, described the morphology of upper end of
femur and explained the differences in the morphology of the upper end of
femur in population studies and races.30
In 1997, Strecker.W et al studied the length and torsion of the lower
limb and concluded that when compared to right femora, the left femora
showed higher values but they were not significantly greater.31
In 1998, Anderson.J.Y et al, studied the pattern of bilateral and inter
populational variations in human femoral neck shaft angles and stated that the

Review of Literature
22
climate, race and geography also has a role on patterning in femoral collo
diaphyseal angle.32
In 1998, Dithie.R et al, presented the morphometric study by using
femora. The study showed significantly higher values of femoral neck length
and width for both men and women. There was an envoluntary change in the
morphometric pattern of Scottish population which was compared to 1920
specimens of skeleton from 90’s.33
In 1999, Gnudi.S et al prepared a geometry of proximal end of femur
in the prediction of hip fracture in osteoporotic women and showed the value
of collo diaphyseal angle in radiographic studies, data’s were collected from
329 females and reported that the neck shaft angle was about 122.60 among
the Italian populations.34
In 2000, Leelavathy.N et al, did a study on sexing of the femora and
published that there is variation in the maximum length of the femur with a
maximum value of 512mm and minimum of 371mm, when this range is
compared to the known sex, they identified the sex of 29 femora from 40
sample and documented that out of 29 identified femora, 18 belongs to males
and 11 to females. They also observed that male femur is longer than female
femora and also observed that in males right femora is shorter than left and
vice versa in females.35
Review of Literature
23
In 2002, Ziylan.T et al, identified the geometry of femur from
Anatolian population from two different ages according to normal parametric
measurements. The study obtains eleven femoral parameters including neck
shaft angle. 36 right and 36 left human adult femora were used. For this study
an osteometric board, a sliding calliper, goniometer and a tapeline were used.
The study was also compared with the previous studies of human femora from
Hoyuk area. This study showed that, between the right and left femora, there
was no significant differences but the head vertical diameter reveals some
difference. The maximum length was determined from the femoral head to the
medial condyle, trochanter length was measured from the tip of the greater
trochanter to the lateral condyle of the femur, the neck shaft angle was
measured from the angle between the long axis of neck and shaft, the proximal
breadth was between the femoral head and the greater trochanter, vertical
diameter of the head measures the head of femurs maximum vertical diameter,
the maximum antero-posterior diameter of femoral head was measured as the
head transverse diameter.
Transverse diameter of the neck was the minimum diameter of the
femoral neck at antero-posterior diameter. Antero-posterior diameter of mid
shaft was the minimum antero-posterior diameter of the femoral shaft at the
middle. At the midpoint of shaft, the minimum transverse diameter was
considered as a mid- shaft transverse diameter. The result concluded that the
Review of Literature
24
geometry of femoral measurements showed the differences in the values
obtained from various populations and also varies depending on the age.36
In 2002, Cauhan et al, established Anatomical parameters of North Hip
joints, a cadaveric study concluded that among the various populations in
India, the variations in the parameters of acetabulum and the proximal femur
were insignificant but there was a significant variation between the data of two
different countries.37
In 2003, Siwach.R.C et al, used 75 pairs of femora and observed that
the average collo diaphyseal angle as 123.50, maximum effective neck length
was about 3.72cms, minimum neck length was about 2.26cms, anteroposterior
neck width was about 2.49cms and superoinferior neck width was about
3.18cms and found a geometrical variation between the Indian femora and the
Western implants. Use of such implants leads to mal union and avascular
necrosis.38
In 2004, Pulkinen et al, did a study on combination of bone mineral
density and upper femur geometry to improve the prediction of hip fracture by
using radiography and concluded that the collo diaphyseal angle was about
128.30 that was analysed in 40 females.
39
Review of Literature
25
In 2004, Calis.H.T et al, evaluated the morphology of upper end of
femur in adult bones and explained the difference in morphology of the upper
end of femur in population studies and races.40
In 2005, Nissen et al, studied the geometry of the proximal femur in
relation to age and sex, a cross sectional study in healthy adult Danes by
radiography. He collected data from 249 adults and documented that the
average collo diaphyseal angle of males was about 131 50 and that of the
females was about 125 50.41
In 2006, Irdesel and Ari.I, did a study on proximal femoral
morphometry on radiography of Turkish women. The study aimed to measure
the parameters in femur and the body mass index. Both the body mass index
(BMI) and femoral upper end morphometry were very important determinants
of fracture. Generally in elderly people, the hip fractures have high mortality
and morbidity rates. The study was conducted in 190 Turkish women. The
body mass index and the anthropometric measurements were noted. The
proximal morphometry were measured on the radiographs. The study excluded
the women with terminal diseases, malignancy, metabolic bone diseases, cox
arthrosis or renal failure.
Hip was internally rotated about 15-300 in supine position and at a
distance of 100cm a film-focused and on the symphysis pubis, the beam is
centered. This was the procedure used to measure the morphometry of femur
Review of Literature
26
on radiography in this study. They concluded that the average Q angle was
131.50, femoral neck length was 10.8cm, cross section of the head of femur
measures about 5.2cm, cross section of femoral neck was 3.5cm, caput
femoris to femoral neck axis base in lateral aspect of greater trochanter
was10.1cm and cross section above the lesser trochanter to the lateral part of
the greater trochanter was 8.4 respectively.42
In 2008, Samaha. A.A et al, undertook asymmetry and structural
system analysis of the proximal femur epiphysis- osteoarticular anatomical
pathology and reported that the value of femoral neck angle may fluctuate
from 1090
to 1530 without predilection of race and gender, whereas the
Wagner and Colleagues reported that the diaphysis femoral neck angle varies
from 125 0 to 132
0.43
In 2008, Saikia.KC et al, did an anthropomertic study on hip joint in
North Eastern region population with CT scan and suggested that the average
angle of inclination was about 139.50 in the North Eastern populations.
44
In 2009, Toogood et al, had described the proximal femoral anatomy
and reported the average neck shaft angle as 129.230 by analysis 375 normal
human femur bones.45
In 2009, Bokariya.P et al, did a study on anthropometry of femur in
central Indian population by using 106 (58 right and 48 left) adult femora and
Review of Literature
27
measured with the sliding caliper and osteometric board. The aim of his study
was to determine the measurements for obtaining foraminal index (FI),
robusticity index (RI) and platymeric index (PI) and the objectives of the study
was to evaluate the geometry of the femur of Central Indian population, to see
the difference between right and the left bones and did a comparative study
between their data and the data from the other areas. He observed that the
robusticity index on right femur as 13.11 0.93 and left side as
14.441.23cms, platymetric index on right side as 86.496.77cms and left side
as 87.63 7.34 cms and the foraminal index on right femur ranges between
31% to 61% and on left femur it ranges between 33% to 62%. The study
concluded that the mean values of the length on right and left femur was
statistically similar. However, the values of the right femora showed smaller
values than the left femora.7
In 2009, Mishra.A.K et al, has undertaken a second look of implant
design at rational for the upper end of femur and published that the implants of
Western countries should be used in Indians only after a careful consideration.
He also stressed that the implants used for fracture of Indian bones should be
specific.46
In 2010, Gargi.S et al, analysed sex of femur and published the
accuracy for differentiation of sex in males is 62.5% and in females is
62.9%.47
Review of Literature
28
In 2010, Desousa.E et al, established the geometry of proximal femur
in Brazilians. The study was performed by using 110 dry adult femora in
Brazilians. Among the bones 49 belonged to right side and 61 to the left side.
The study excluded the bones with osteosynthesis and those showed
malformation or abnormalities that could affect its shape and structure. Bones
were examined on roentgenographic analysis and scanned images. They
obtained the measurements by graph pad instat software and autocad software.
The study evaluated the parameters such as femoral neck width, femoral neck
length, femoral head diameter, femoral axis length, off set and the neck shaft
angle.
In this study the femora were also radiographed by using a diagnostic
portable model FNX 200, with branded film, that measured about 30x40cm.
At a distance of 100cm of the bulb chasis, the images were obtained by using a
power of 75kV and 10mA. Then the radiographs were scanned. Measurements
of right and left sides were obtained as follow: Femoral neck width (FNW)
30.962.94mm, femoral neck length (FNL) 30.14.3mm and 30.54.1mm,
femoral head diameter (FHD) 31.12.7mm and 30.83.0mm, femoral axis
length (FAL) 98.2+/-5.9mm and 97.47.13mm, off set 42.66.1mm and
42.05.6mm and the neck shaft angle (NSA) 132.00 7.2
0 and 131.8
0 5.2
0
respectively.5
Review of Literature
29
In 2010, Sen.R.K et al compared the anatomical, radiographical and
computed tomographed measurements of upper end of femur among an Indian
population. He used dried femora (24 right and 26 left). Beginning from
proximal to distal end, the femur was divided into 10 cross sectional levels.
Using radiography and CT, the lateral anteroposterior, 450 external oblique
diameter and 450
internal oblique diameter of medullary canal were measured
at each level. The femur was kept over the broad/ film to reduce the
magnification. The femoral head off set, femoral head diameter, collo
diaphyseal angle, neck length were also measured. Vernier caliper was used
for anatomical measurements. Comparison between three modalities was
obtained by using Pearsons calculation coefficient. The result of this study
showed that, the mean collo diaphyseal angle was 1320, the mean diameter of
femoral head was 45mm, the mean length of the neck was 63mm, the mean
head off set of femur was 42mm. Here the dimension of endosteum gradually
decreased from 1 to 10 levels in all 4 diameters, the endosteal dimensions
showed different decreasing trends from 3 to 7 levels in the trochanteric area.
In antero-posterior plane, the degrees was less marked and in the lateral plane
it was more marked. When compared to the anatomical measurement at upper
levels the medullary canal diameters were smaller as compared to the
radiographic and CT measurements.
Radiographic distortion was higher at the level of the lesser trochanter
in all 4 diameters. The distortion was minimal at the levels 7 to 10 and
Review of Literature
30
generally lesser on radiography than on CT. At level 3, based on the lateral
diameter 37 femora were classified as small, medium and large. Remaining 13
femora were excluded from the analysis due to its larger size. Measurements
of anteroposterior diameter was higher than the lateral diameter. This study
concluded that the implant geometry and surface finishing had an important
role in cementless femoral prosthesis implant production.6
In 2010, Zalawadia.A et al, observed femoral neck anteversion in
Indian population. The study aimed to detect the average angle of femoral
neck anteversion. Fifty female femora, among that 27 right and 23 left and 42
male femora (22 right and 20 left), in all total 92 unpaired dry femora were
used for the study. Here the specimen was placed at the corner of a horizontal
surfaced glass board so that the condyles in the distal end rested on its surface.
At the edge, the horizontal limb of a goniometer was fixed. Along the head
and neck axis of the femur, the anteversion was measured. The study resulted
that in males the average anteversion on right side was 21.230 0.30
0 and
14.30 0.38
0 on the left side. In females the average anteversion on right side
was 20.870 0.36
0 and 11.02
0 0.34
0 on left side.
In five bones, the retroversion was observed 6.5%, 20.5% of the bones
ranging between 0 to 100, neutral or almost neutral version were noted in five
bones, 33.6% of the bones were in the range of 100 to 15
0, while above 15
0
there were 36.9% of bones. 48
Review of Literature
31
In 2011, Baharuddin.M.Y et al, had done a Morphological study of
proximal femur in Malay population. The measurement s were taken from 120
right and left hips and he excluded abnormal body mass index (BMI) ,
previous femoral injury, pregnant women, had CT scan performed previously
within 6 months prior, wearing various prosthesis or implants. The data of four
parameters such as femoral head diameter, neck shaft angle, femoral neck
width and femoral neck length were collected and by analysis of the data
collected, he concluded that usually Dynamic hip screw with the neck shaft
angle of 1350 was generally used but for Malay population it may not suit
because the average neck shaft angle for males was about 1320 and for females
1300 respectively. This study also emphasised the importance of the
measurements of upper end of femur, especially the femoral neck length and
width, collo diaphyseal angle which particularly varies from other populations.
The study also gives good information to the clinicians and the engineers in
the development of implants.10
In 2011, Ravichandran.D et al, did a study on proximal femoral
geometry in Indians and its clinical applications by using 578 unpaired femora
by measuring with goniometer and vernier caliper and he explained the
geometry of proximal femur without determining the age and sex of the bones.
The study reported that the average collo diaphyseal angle was about 126.550,
the neck length was about 3.19cm and the mean width was about 3.1cm and he
concludes that the current available dimensions of Western implants used in

Review of Literature
32
the orthopaedic surgeries does not match the proximal femoral dimensions of
Indians and there was a need for modification of the implants.3
In 2011, Murlimanju.B.V et al, had done an osteometric study of the
upper end of the femur and its clinical application. The study was to identify
the geometrical parameter of head and neck of the femur in Indians. The study
comprised of fifty dry bones. Superior and inferior head length, femoral head
diameter, supero-inferior and antero-posterior diameter of the neck and the
superior and inferior length of neck were measured by using vernier caliper.
The study showed that the superior and inferior head length as 30.83.6 and
21.23mm, the mean diameter of femoral head was 41.52.8mm, the antero-
posterior and supero-inferior femoral neck diameter was 23.92.9 and
30.22.5mm, the mean superior and inferior length of femoral neck was
22.33.1 and 31.24.1 respectively. This study enlightens the orthopaedicians
as well as anthropologists.49
In 2012, Srimathi.T et al, made a study on femoral neck anteversion
and its clinical correlation aimed to measure in both the sides and both the
sexes in Indian population. 164 dried adult femora (88 right and 76 left) with
81 male bones and 83 female bones were used. Bones with significant arthritic
or bony deformities were excluded. The angle between transcondylar line into
the centre head neck line was measured by using goniometer.
Review of Literature
33
The result was documented as the mean value was 10.130 in the left and
9.490 in the right femora with a standard deviation of 1.50 and 1.66
respectively. So the angle in the left femur was higher. The mean value in the
female was 9.790 and 9.78
0 in the male with a standard deviation of 1.54 and
1.70. So the value of female bones was higher. About 54.2% of bones were in
the range of 80-10
0, 15.8% bones had angle more than 12
0, 21.9% were in the
range of 100-12
0, 7.9% bones were in the range of 0
0-8
0. Most bones showed
the range of 80-10
0 of anteversion. The study concluded that increase in the
femoral anteversion angle was associated with cerebral palsy, perthes diseases,
postural defects, anterior poliomyelitis, external tibial torsion, apparent genu
valgum, intoing, flat foot. Decrease in the femoral anteversion angle was
associated with rickets, chondrodystrophy, toing out.4
In 2012, Limwei.L.V et al, demonstrated a new method for the
measurement of the parameters of proximal femora in males. In this study,
they used fifty one healthy chinese males. Patients with the history of hip
disease or femoral diseases were excluded. An average age of the males 70.5
years, ranging from 66-75years were selected for the study. To identify the
morphological difference in the bone, the samples were divided into two
groups according to their age. 66 to 70 years old samples were subjected as
group A and group B subjects with 71 to 75 years old. Bone mineral density,
height and weight of the subjects were noted as a part of the morphological
parameters. By using clinical QCT, all subjects were scanned and eight
Review of Literature
34
morphological parameters were measured such as femoral head diameter by
fitting the contour of oral head of femur with a circle at anterior view, superior
view and right view, height of femoral head, collo diaphyseal angle. Off set,
femoral thickness, diameter of neck, and neck length.
The result from the above data collected showed, that the weight of
group A and B are 60.58817.5759 and 57.36547.6780, height of group A
and B are 161.8525.1744 and 163.84624.7777, bone mineral density
(BMD) of group A and B are 0.8650.1046 and 0.80830.1246, head diameter
was 47.64831.7448 and 48.87202.1887, off set for group A and B was
37.82013.9379 and 38.24764.5263, collo diaphyseal angle was 126.0779
6.3039 and 126.8966.2753, femoral thickness was 9.45490.7371 and
9.21500.9931, neck diameter was 34.81843.2642 and 37.21162.6514 and
neck length was 89.42116.443 and 92.28887.1455 respectively. This study
concluded that, a significant difference was found between two measurement
in off set, height of the head, neck diameter, neck length and femoral
thickness.11
In 2013, Nallathamby.R et al, did a comparative study of neck shaft
angle of femur in South Indian population on 100 dry femora. Among these
100 dry femora, 52 were of the female and 48 were of the male and 49
belonged to right side and 51 belonged to the left side. In this study the gender
Review of Literature
35
of the bone was determined by the weight of the bone, prominence of
muscular markings and the caput condylar length.
The result of this study showed that the mean value of collo diaphyseal
angle was 134.560. The mean angle for males was 134.2
0 and for females
134.80. The standard deviation was 5.97 and 6.06 respectively. The mean
value was 133.8 on right side and 135.2 on left side and the standard deviation
was 6.39 and 5.55 respectively. The study concluded that the mean collo
diaphyseal angle for females was little higher for the males but statistically no
differences was found. The mean collo diaphyseal angle of the right femur
was lesser than that of the left but no statistical significance was found.2
In 2013, Kaur.P et al, conducted a study on collo diaphyseal angle on
radiography in the North West Indian population. The study was performed in
280 patients on the pelvic radiographs. All the patients were aged between 20
to 50 years. For the purpose of the study, patients, AP view and pelvic X-ray
in supine position were taken. Anthropometric measurements were taken
bilaterally on picture archiving and communication system (PACS) with
digital caliper. The measurements and observations were made under the
radiologist’s guidance. History of the patients like age, sex and the presenting
complaints were also collected. The results were statistically analysed.
The result showed that the mean collo diaphyseal angle in females on
left side was 120.1602.51
0 and on right side it was 121.16
02.50
0. The mean
Review of Literature
36
collo diaphyseal angle in males on left side was 121.3302.36
0 and on right
side it was 121.6302.41
0. The mean collo diaphyseal angle of the total
population on the left side was 121.1302.44
0 and on right side it was 121.39
0
2.460. The study concluded that the collo diaphyseal angle does not have
significant difference between both the sides and both the genders in the North
West Indian population.50
In 2014, Kamdi.A et al, proposed osteometric parameters of the femur
in Telangana region and aimed to correlate different geometrical parameters of
the femur for forensic practise and anthrological studies. 40 femora (28 right
and 12 left) of unknown sex were measured by using vernier caliper and
osteometric board. First fixing the femur in the osteometric board in such a
way that the two epicondyles touched the vertical wall; dorsal aspect of the
femur in the upward direction. The highest point of the femoral head was
made to touch the movable piece of the board. Between the deepest point on
medial condyle and the highest point of the head, the maximum length of the
bone was measured. Other parameters were measured by using vernier caliper.
In case of the shaft, at right angle to the transverse diameter was measured to
record the anteroposterior diameter of the upper segment of the shaft. The
maximum elevation of linea aspera at mid shaft region, the antero-posterior
diameter of middle segment of the shaft was measured. Approximately 4cms
Review of Literature
37
above the cartilaginous margin of the condyles, the antero-posterior diameter
of the lower segment of the shaft was also recorded.
The study revealed that the mean length of the femur was 43.26cms
(right side-43.19cm and left side- 43.28cm). Maximum length was 48.2cm and
minimum length was 37.8cm. Mean antero-posterior diameter at the upper
segment of the shaft was 24.67mm, mean at middle segment of the shaft was
25.1mm and of the lower segment of shaft it was 25.77mm. The study also
specified that there was no significant difference between right and left side.51
Review of Literature
38
5. DIFFERENTS METHODS USED TO MEASURE THE FEMORAL
GEOMETRY:
In 1988, Christopher.A.K et al, measured neck shaft angle of the
femur of plain radiographs (hip joint is exposed) of homozygous sickle cell
patients by using an illuminator box, calibrated protractor, HB pencil and a
transparent graduated measuring ruler (mm). With an interval of 2cm, he
marked midpoints of three horizontal lines beginning from the upper end of
the lesser trochanter that joins vertically passing medially above the greater
trochanter. Again a line was drawn from distal end of the greater trochanter
and the fovea in the centre of the femoral head, that crossed the vertical line.
The angle was formed in the anterior aspect of the intertrochanteric line of the
proximal end of the shaft. He placed the calibrated protractor on the
radiograph directly which was already fixed on the illuminator box and
recorded the measurements.52
In 1994, Glur.C.C et al, worked out the prediction of hip fractures
from pelvic radiographs of osteoporotic fractures, in 190 women aged above
fifty years. The geometrical values were recorded by using pelvic radiographs
in 15-30 degrees of internal rotation of hips with a film focused at a distance
of 100 cm in supine position and the beam centered on the symphysis pubis.
All morphometric measurements were performed unilaterally.53
Review of Literature
39
In 1996, Robertson.D et al, studied femoral deformity in adults with
developmental hip dysplasia using computerized tomography and three-
dimensional reconstruction and described the deformity associated with
dysplasia. He was the first to use the technique to determine morphology of
the upper end of femur in 24 Japanese adults with developmental dysplasia of
the hip. Average models of the dysplastic femur was developed by their
findings. As they studied on male and the female patients of heterogenous
group with widely varying degree of subluxation without control group they
could conclude only regarding the abnormalities of dimensions of the
dysplastic femur and the shape on the basis of anatomical parameters analysed
from the normal femora of Western populations.54
In 2000, Kaneuji.A et al, measured at saggital plane and coronal plane
of reconstructed models in the three dimensional morphological analysis of
proximal femora, using computer aided design system.55
In 2002, Ziyal.T has described the antropometry of Anatolion human
femur by using a digital sliding caliper, an osteometric board and a tapeline to
measure the length, diameter and the circumference of the femur. Goniometer
was also used to measure the collo diaphyseal angle of the femur.36
In 2004, Sighn.I.PandBhasin.M.K, A manual of biological
anthropology suggested the measurement of geometry of the femur, they
suggested that, soon after cleaning the bones it has be examined under day
Review of Literature
40
light. Then the bone was fixed in the osteometric board, by using vernier
calliper the width of the narrowest part of the neck was measured and
identified the midpoint of the neck of the femur. In the surface of the bone, the
point was marked by the marker. Along the neck axis, a thread was fixed on
both ends of the bone that defined the axis of the bone. Through the centre of
the shaft of the bone another thread was mounted that defined the diaphyseal
axis. Then by using a transparent protractor the angle at the meeting point of
two threads was measured and the values were recorded. The neck shaft angle
of the femur was defined by the angle between the neck and diaphyseal axis.56
In 2006,Dong.X et al, prepared a fully automatic determination of
morphological parameters of upper end of femur from calibrated fluoroscopic
images that particle filtering, he designed the algorithm of morphological
parameters of the upper end of femur that fitted femoral head into sphere,
fitted femoral shaft into cylinder and fitted femoral neck into round table.
Anyhow, a lot of morphological information may miss in the fitted femoral
head.57
In 2007, Song.W.W et al, within a sphere, he fitted a part of
acetabulum of reconstructed model and the head of the femur. However,
except these two, other parameters were not measured in this study.58
In 2008, Chantarapanich.N et al, measured proximal length of the
femur and the femoral curvature which were reconstructed from CT images in
Review of Literature
41
his study. The geometrical assessment of femoral curvature was measured by a
reverse engineering technique.59
In 2009, Aroojaratham.P et al, did a three dimensional morphometric
study of the Thai proximal humerus- a cadaveric study is not applicable in
vivo measurement.60
In 2010, Sen.R.K et al, had done a correlation between anatomic,
radiographic and computerized tomographic measurements of proximal femur
in 50 dried femora (24 right and 26 left) by using radiography which is
commonly used for preoperative measurements of the femur dimensions but it
has many limitations such as resolution, exact positioning and image distortion
but computerized tomogram eliminatedsuch limitations and it provided three
dimensional images. For anatomical measurements a caliper were used.6
In 2011, Baharuddin.M.Y et al, measured the geometry of proximal
femur in Malay population and the measurements were taken from sixty
subjects (30 males and 30 females) 60 right and 60 left hips. Pregnant women,
abnormal body mass index (BMI), those who wearing prosthesis or implants
were excluded in this study. Femoral geometry was measured by using four
row multi slices CT scanner ( somatom, volume zoom, siemens) at 12.0mm
table field per rotation, 3.0mm thickness and operated at 120kV and 90mAs
and the patients were asked to lay in the supine position and their feet is
Review of Literature
42
stabilized by a specifically designed wood jig to standardize the feet position
during image acquisition.10
In 2011, Murlimanju.B.V et al, evaluated the morphological and
topographical anatomy of nutrient foramina in human upper limb long bones
and their surgical importance, measured diaphyseal nutrient foramens in all
the bones by using an elastic rubber band that is applied around the upper end
of the nutrient foramen and photographic images were taken by digital
camera.49
In 2012, Linwei.L.V et al, measured the morphological parameters of
upper end of the femur. Eight morphological parameters were measured in this
study, during the measurement process two auxiliary lines were created, which
were neck axis and the shaft axis of the femur. Neck axis: Firstly, the narrow
end of neck of the femur was cut and fixed the cross section within a circle.
The neck axis was defined as the connection of the head centre and the circle
centre. Shaft axis of proximal femur: In most old people, the shaft of the femur
was curved, but the shaft axis of the upper end of femur was straight, so 25mm
below the inferior edge of the lesser trochanter and the inferior edge of the
lesser trochanter was cut off and fixed the contours of cross section within a
circle. Shaft axis of proximal femur was defined as the connection of two
circle centres.11
Review of Literature
43
6. FEMORAL FRACTURES:
In 1993, Faulkner et al, predicted hip fracture by simple measurements
of femoral morphometry and concluded that femoral fractures are very
important health burden that regards medical costs, disability and even death.61
In 1993, Felson et al, their study further stated that including the
geometry of proximal femur, the body mass index also plays an important role
in fracture risk.62
In 1995, Boonen et al said that some of the parameters of the femur
play an important role in an increased risk of fracture. In addition to that, a
longer hip axis length was also associated with fracture risk.13
In 1995, Peacock et al, found that the collo diaphyseal angle values are
higher in fracture cases.63
In 1996, Pinilla et al, done a study on femoral fracture and documented
that the femoral parameters including femoral neck axis, hip axis length,
femoral head width, femoral neck width, femoral neck shaft angle,
intertrochanteric width are related to the mechanical strength of upper end of
femur. These morphometric measurements were also involved in the higher
incidence of the fracture of hip. The collo diaphyseal angle shown by the
biomechanical test does not correlate with the strength of femoral neck.64
Review of Literature
44
In 1999, Ravn et al, said that within the bone, the stress depends on the
morphometric arrangement and on the direction of bone and by the materials
of which the bone was made and also the size of the force applied.65
In 1999, Simmermacher.R.K et al, studied the anthropometric
variation of the neck of the femur between races to predict osteoporosis related
hip fractures. Only one dimension of hip geometry was separated by neck
length of the femur. To detect the risk of fracture, the neck dimension was also
assumed. The independent predictors of hip fractures were hip axis length,
cortical thickness, bone mineral density and neck shaft angle.
In the transitional bones, between the neck and the shaft of the femur,
the intertrochanteric fracture occurs. Both the greater and the lesser
trochanters are involved in this fracture. Transition bones are composed of
trabecular and cortical bone. Posteromedially calcalfemorale is formed by
these bones, which provide the capacity to distribute the stresses of weight
bearing. This fractures does not disturb the blood supply of the head of the
femur. Osteonecrosis is uncommon and the complications like non-union is
also uncommon as the transitional bone is highly vascular.
The intertrochanteric fracture classification was based on the stability
of fracture. In 1949 Evans introduced this classification. His classification
differentiates the stable and unstable fractures. He said that the stability of the
fractures depends on the integrity of posteromedial cortex. The instability
Review of Literature
45
increased with the comminution of the fracture, presence of a reverse oblique
fracture pattern and the fracture extended to the subtrochanteric region.
According to Evans, the intertrochanteric fractures were classified into i)
stable and reverse, ii) standard oblique fracture, iii) oblique fracture
(unstable).66
In 2000, Rosso and Minisola found that there was difference in the
incidence of hip fractures from country to country.67
In 2001, Testi et al, said that a larger collo diaphyseal angle was
associated with fracture risk.68
In 2004, Gregory et al, assessed the shape of the upper end of femur
and its relationship to hip fracture. The study revealed that the shape of the
upper end of femur is a major risk factor for hip fractures of the neck of the
femur, regardless of bone mass or strength.69
Review of Literature
46
7. IMPLANTS USED:
In 1991, Bridle et al, explained the commonly used implants in India.
They are
i) Intramedullary devices. Eg: Proximal femoral nail (PFN).
ii) Extramedullary devices. Eg: Dynamic hip screw (DHS).
In the last two decades, DHS was a major implant used for fixation in
the proximal fractures. But in 20% of cases it may have problems of cutting
through, implant failure, screw giving away from shaft, rate of fixation failure
and penetration of the joint by the screw. Whereas intramedullary devices had
an advantage of being close to the weight bearing axis have taken over as the
modality for the fixation of these fractures.
For fixation of intertrochanteric fractures, the intramedullary devices
are becoming popular. Dynamic hip screw fixation needs a larger surgical
wound exposure, anatomical reduction and more handling of soft tissues and
it may also caused an increased morbidity because of the infection and blood
loss. Moreover, biomechanically intramedullary devices are more superior. In
hip joint, the bending force on implants is decreased by an intramedullary
device when compared to the laterally fixed side- plate. Especially in elder
patients, this is an advantage in whom the treatment goal was a sudden full-
weight bearing mobilization.
Review of Literature
47
In case of pretrochanteric fractures, the gamma nail fixation was
recommended. But in 8 to 15% of cases reported a cut out of leg screw occurs,
which was a serious complication. An anti rotation screw was present in the
proximal femoral nail and that was fixed in the neck of the femur which was
helpful to avoid the cervicocephalic fragments rotation during weight bearing.
PFN was the latest implant used in the intertrochanteric fracture management.
This implant had many advantages such as load transfer was more efficient as
it was intramedullary, maintains controlled impaction, stress was less
transferred and implant failure was also less because of the shorter lever arm,
loss of blood was less and also the soft tissue dissection was less.
Proximal femoral nail is available in two varieties: i) the long
cannulated variety and ii) the standard variety. The standard variety of PFN
consist of a 240mm long nail. The lower part of nail was in 10, 11 or 12 mm
diameter and 17mm in diameter at it proximal part. Between the two parts, the
angle measures about 6 degrees and it lies 11cm from the top of the nail.
Through the proximal part two screws were inserted. The neck screw was
11mm and anti-rotation screw was 6.5mm. Distal locking can be dynamic or
static. To reduce the stress, the nail was specially shaped at its tip.
In a modified PFN, the proximal part of the implant was reduced to
14mm from 17mm, the neck diameter screw was reduced from 11mm to 8mm,
the length of the device was reduced to 18mm and the rotational screw
Review of Literature
48
reduced to 6mm from 6.5mm. This study concluded that the small diameters
are suited for Indian population.70
In 1993, Faulkner.K.G et al, found that the femoral neck width
influences the prediction for the eventuality of the fracture.61
In 1995, Baumgartner.M.R et al, documented that, femoral geometry
influences the risk of hip fracture. So various parameters like femoral neck
length, femoral neck width and collodiaphyseal angle were assessed. The
result showed that the FNL, FNW and CDA could be used with bone marrow
density measurement to picture the risk of hip fracture.71
In 2001, Kim.W.Y et al, suggested that proper positioning of the screw
was very important because, the biomechanical and anatomical studies
revealed that the weakest part of the implant was the supero medial quadrant
of the head of the femur.72
In 2009, Song.P.U et al, said that initially most of the implants are
designed on the basis of measurements in Caucasian population. So use of
such implants in Asian population causes problems or complications due to
the mismatch of implant size for Asian population.73
Materials & Methods
49
MATERIALS AND METHODS
a) Source of data:
The present study was carried out in the department of Anatomy from
June 2014 to August 2015 on 90 dry femora (45 right femurs and 45 left
femora) from the Department of Anatomy, Sree Mookambika Institute of
Medical Sciences, Kulasekharam.
b) Study design:
Descriptive study.
c) Total sample size of the study:
90 dry bones (45 right femora and 45 left femora).
Sample size calculation:
By literature reference (an analysis of Anatolion human femur
Anthropometry) by Ziylan.T, Murshid.K.A.
The highest standard deviation in left femur is noted as 4.7, σ = 4.7
using the formula E
4 2.E=0, Hence the sample size is 90.
a. Inclusion criteria:
Bones of both sides of either sex.
Materials & Methods
50
b. Exclusion criteria:
Any femur that showed a significant malformation and abnormality that
could affects its shape and structure.
c. Parameters to be studied:
Angle between neck and shaft of femur in degrees.
Head transverse diameter in millimetres.
Neck transverse diameter in millimetres.
Head vertical diameter in millimetres.
Neck vertical diameter in millimetres.
Proximal breadth in millimetres.
Materials & Methods
51
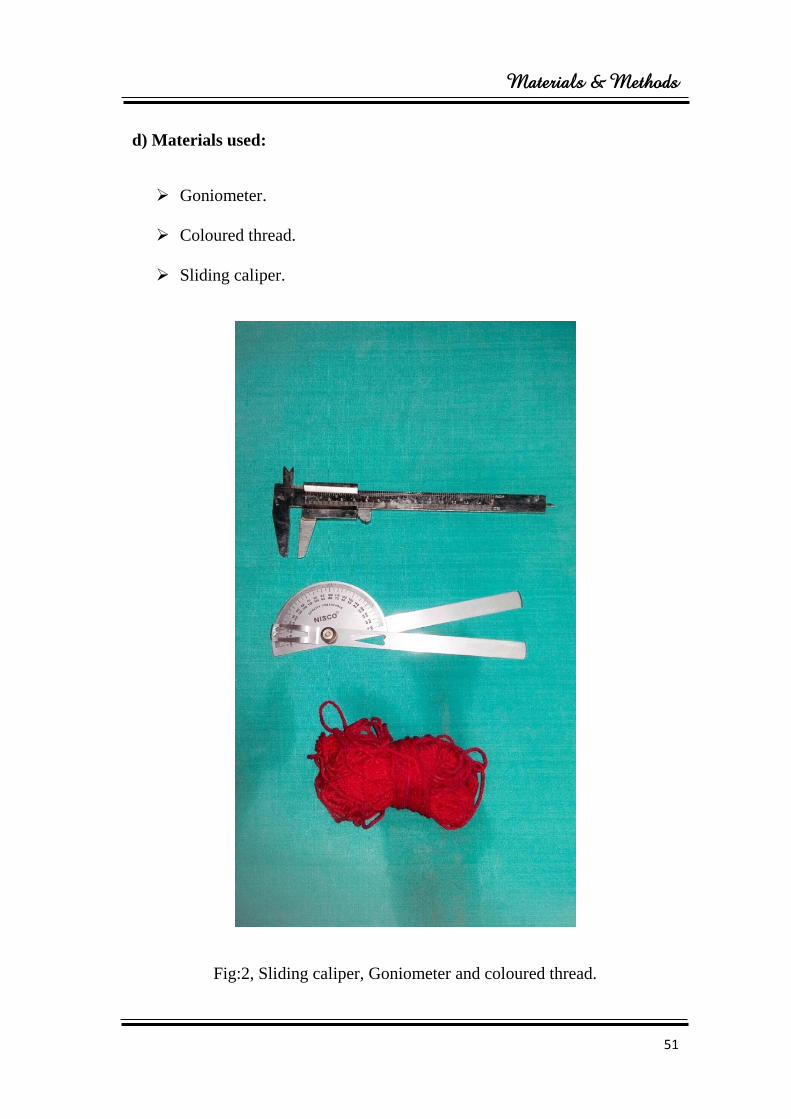
d) Materials used:
Goniometer.
Coloured thread.
Sliding caliper.
Fig:2, Sliding caliper, Goniometer and coloured thread.

Materials & Methods
52
e. Procedure:
Angle between neck and shaft
1. By using the coloured thread, axis of the neck was determined.
2. The thread divides the anterior surface of the neck into two equal
halves.
3. In the mid sagittal plane over the anterior surface, the axis of the
shaft was marked using the same thread.
4. Then the angle between the neck and shaft is measured using the
goniometer.
Materials & Methods
53
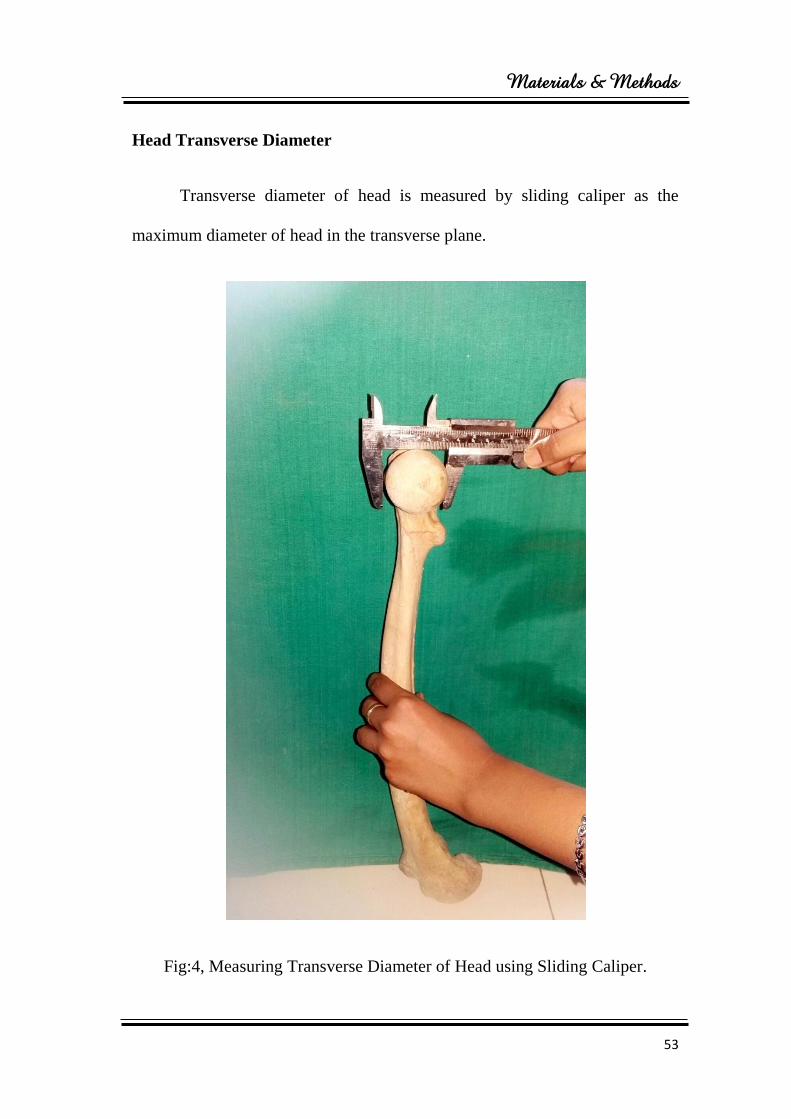
Head Transverse Diameter
Transverse diameter of head is measured by sliding caliper as the
maximum diameter of head in the transverse plane.
Fig:4, Measuring Transverse Diameter of Head using Sliding Caliper.
Materials & Methods
54
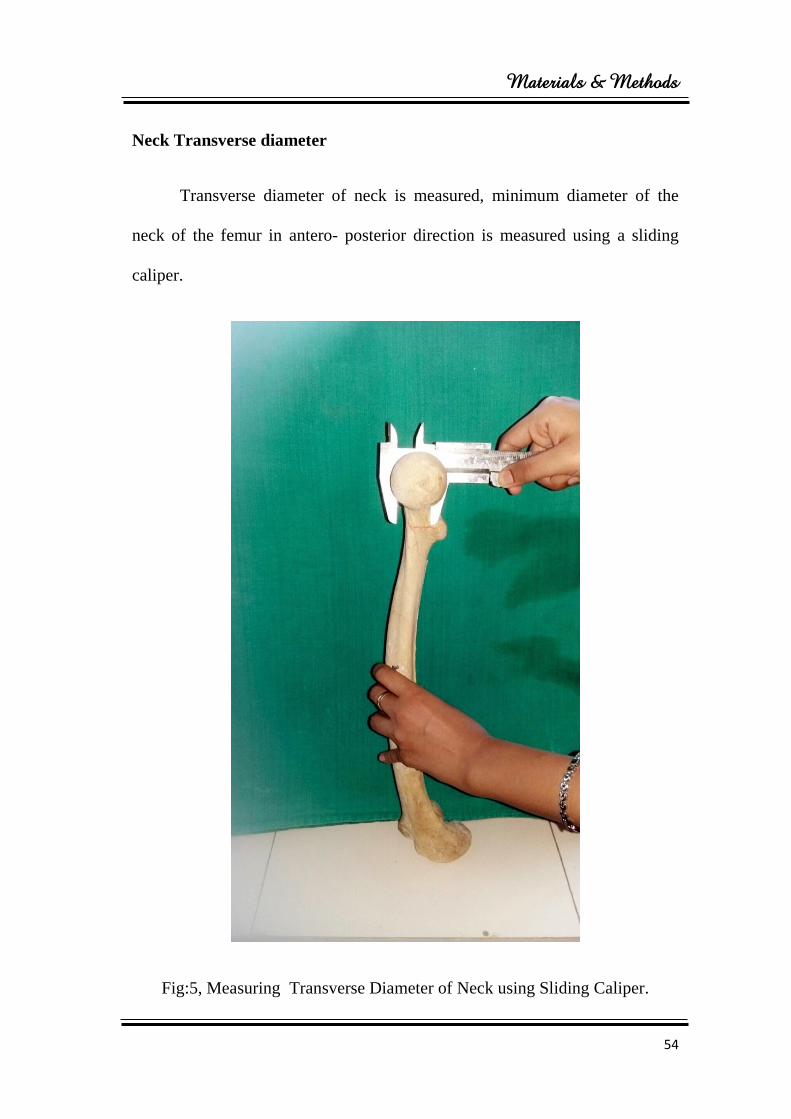
Neck Transverse diameter
Transverse diameter of neck is measured, minimum diameter of the
neck of the femur in antero- posterior direction is measured using a sliding
caliper.
Fig:5, Measuring Transverse Diameter of Neck using Sliding Caliper.
Materials & Methods
55
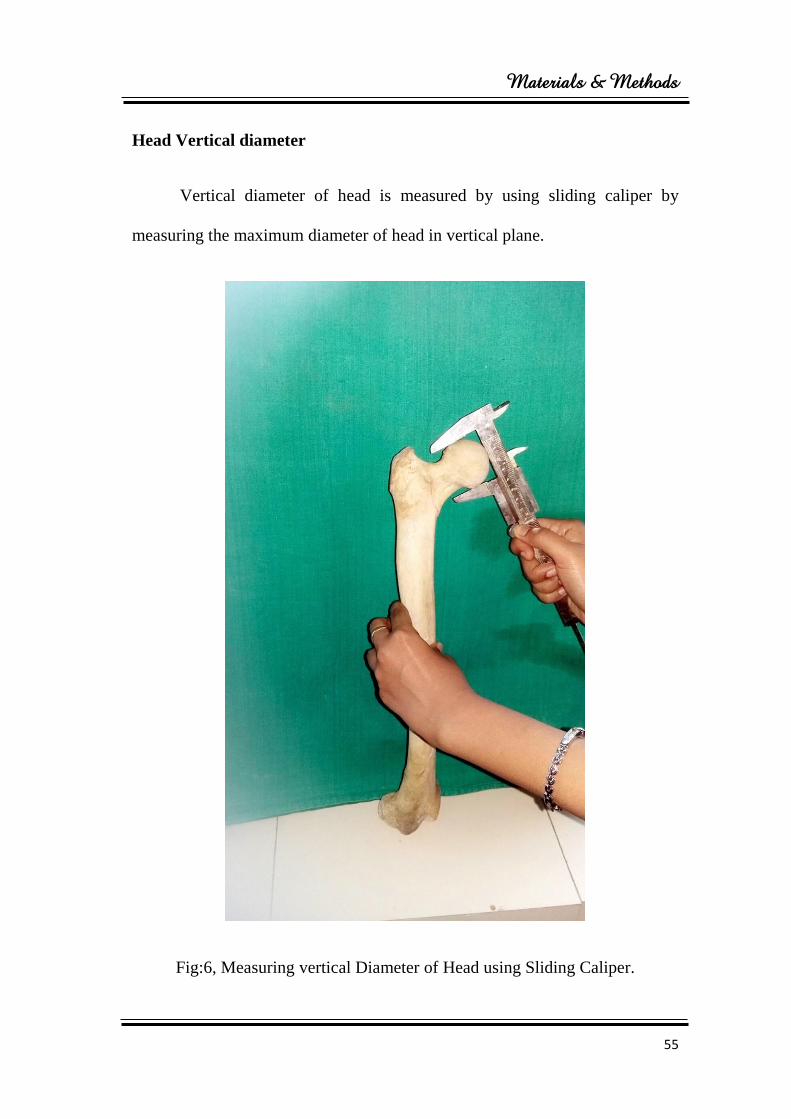
Head Vertical diameter
Vertical diameter of head is measured by using sliding caliper by
measuring the maximum diameter of head in vertical plane.
Fig:6, Measuring vertical Diameter of Head using Sliding Caliper.
Materials & Methods
56
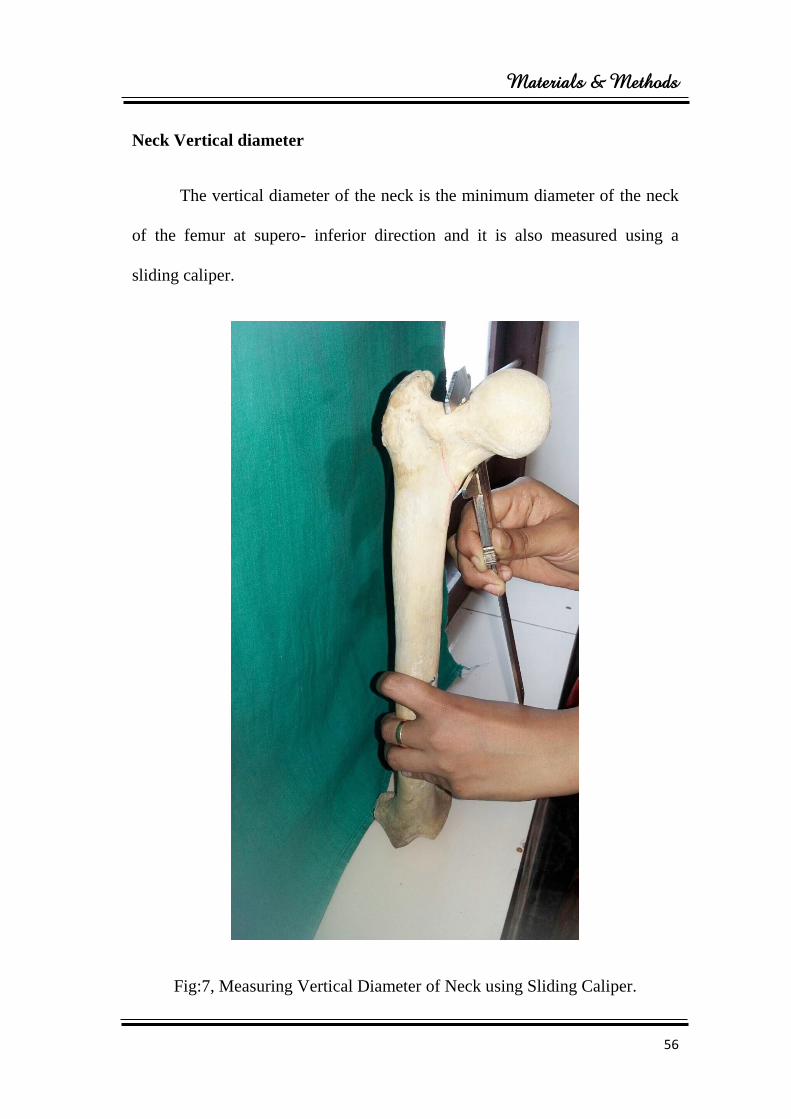
Neck Vertical diameter
The vertical diameter of the neck is the minimum diameter of the neck
of the femur at supero- inferior direction and it is also measured using a
sliding caliper.
Fig:7, Measuring Vertical Diameter of Neck using Sliding Caliper.
Materials & Methods
57
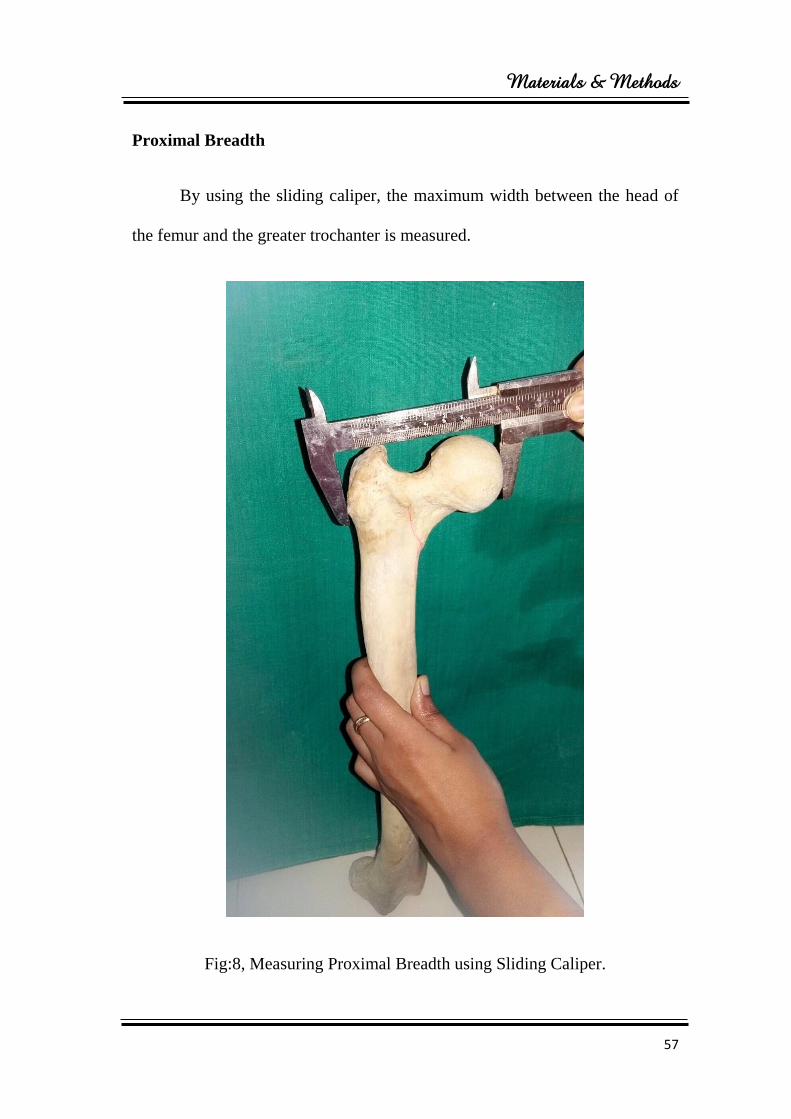
Proximal Breadth
By using the sliding caliper, the maximum width between the head of
the femur and the greater trochanter is measured.
Fig:8, Measuring Proximal Breadth using Sliding Caliper.
Materials & Methods
58
f) Statistics :
The data was collected and entered in a master chart. The statistical
contents like arithmetic mean and standard deviation were found. In order to
test various hypothesis to see the difference between the measurements of
both the sides, mean was tested by using ‘t’ test.
All the statistical calculations were done through SPSS (Statistical
presentation system software) of window version 10.0 SPSS.
In all the cases if the calculated ‘t’ was more than that is given in the
‘t’ table, the test was significant at the appropriate probability level and if the
calculated ‘t’ was less than or equal to table value, t was said to be
insignificant.
P-< 0.05 is significant.
P-> 0.05 is insignificant.
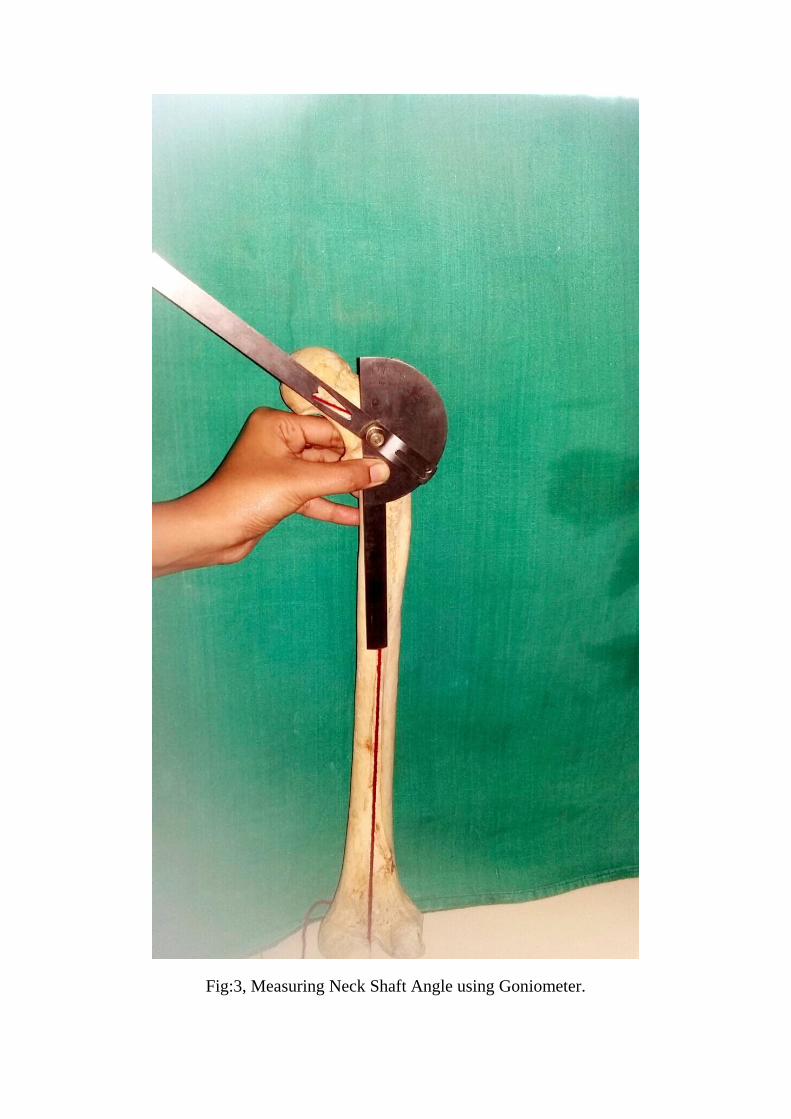
Fig:3, Measuring Neck Shaft Angle using Goniometer.
Results
59
RESULTS
The femoral measurements were studied on 90 bones (45 right and 45
left femora) from the Department of Anatomy, Sree Mookambika Institute of
Medical Sciences, Kulasekharam. The measurements of the bones on the right
side and the left side were subjected to statistical analysis to evaluate the
significance.
Method of analysis:
1. Analysis was done using Pearson’s correlation.
2. Pearson correlation are applied to test the difference between femur of
the right and left side.
3. Bar diagrams are used to represent the data.
4. p value less than 0.005 is considered statistically significant.
Results
60
Table:1
DISTRIBUTION OF BONES
BONES RIGHT SIDE LEFT SIDE TOTAL
Number of bones 45 45 90
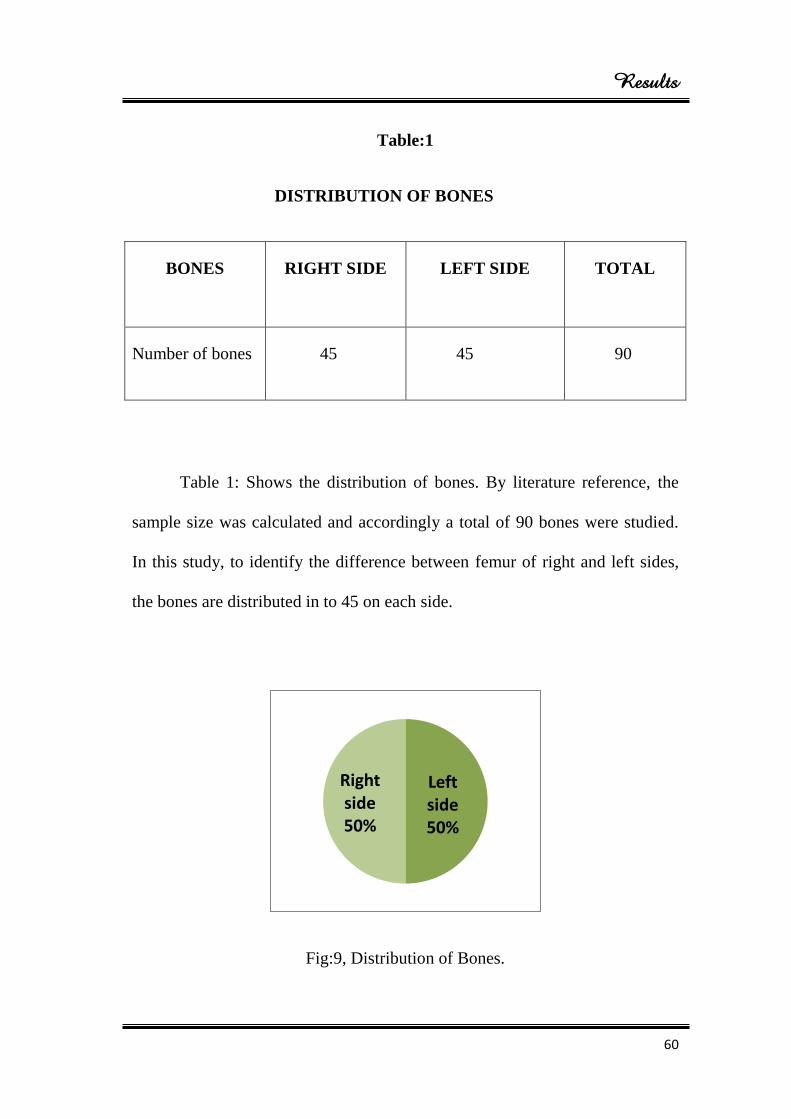
Table 1: Shows the distribution of bones. By literature reference, the
sample size was calculated and accordingly a total of 90 bones were studied.
In this study, to identify the difference between femur of right and left sides,
the bones are distributed in to 45 on each side.
Fig:9, Distribution of Bones.
Left side 50%
Right side 50%
Results
61
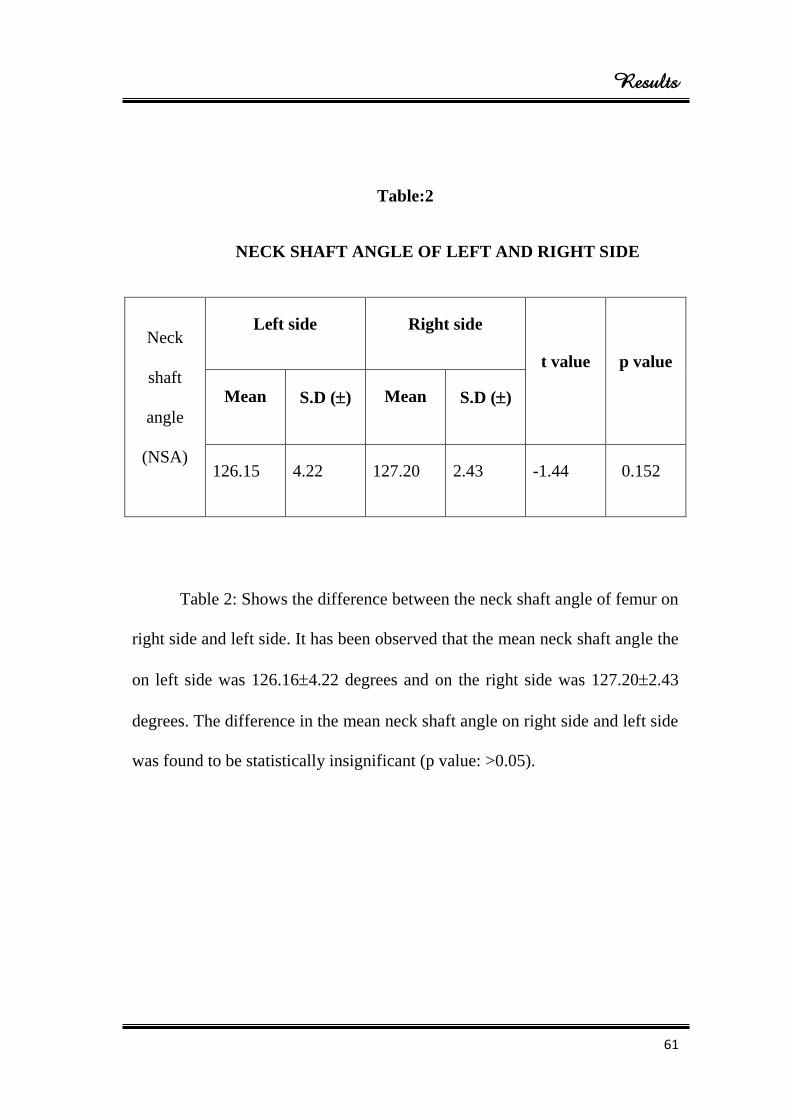
Table:2
NECK SHAFT ANGLE OF LEFT AND RIGHT SIDE
Neck
shaft
angle
(NSA)
Left side Right side
t value p value
Mean S.D () Mean S.D ()
126.15 4.22 127.20 2.43 -1.44 0.152
Table 2: Shows the difference between the neck shaft angle of femur on
right side and left side. It has been observed that the mean neck shaft angle the
on left side was 126.164.22 degrees and on the right side was 127.202.43
degrees. The difference in the mean neck shaft angle on right side and left side
was found to be statistically insignificant (p value: >0.05).
Results
62
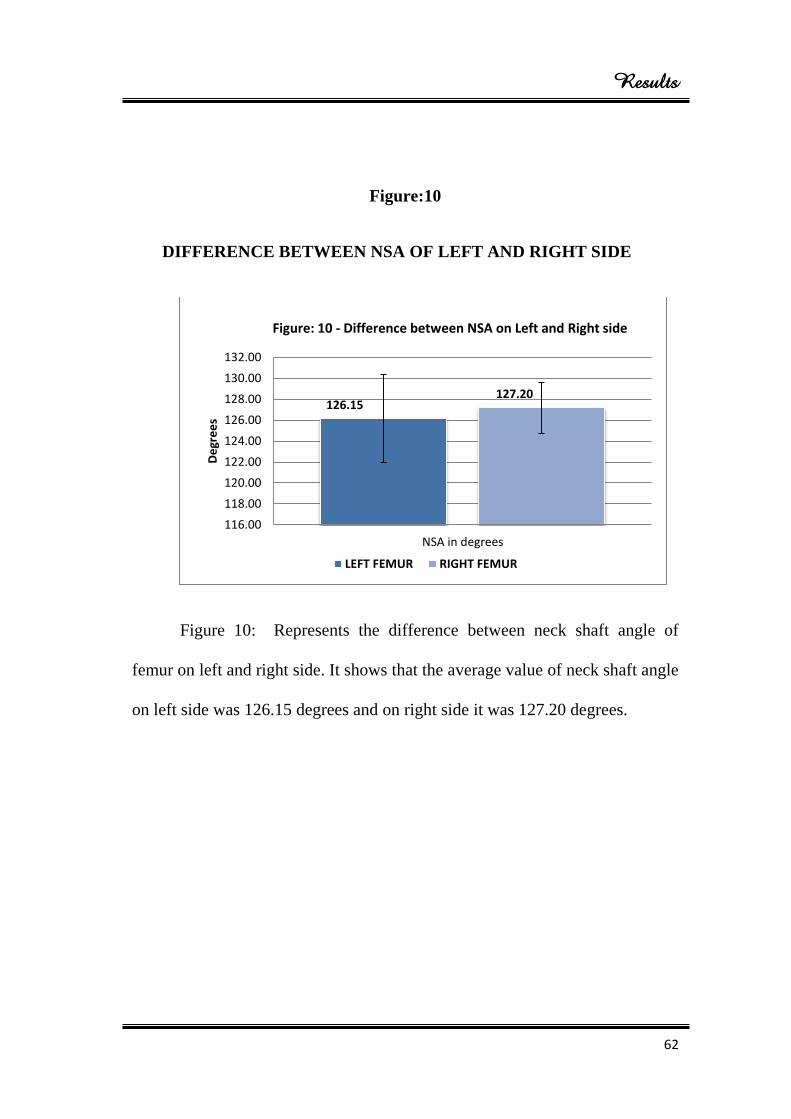
Figure:10
DIFFERENCE BETWEEN NSA OF LEFT AND RIGHT SIDE
Figure 10: Represents the difference between neck shaft angle of
femur on left and right side. It shows that the average value of neck shaft angle
on left side was 126.15 degrees and on right side it was 127.20 degrees.
126.15 127.20
116.00
118.00
120.00
122.00
124.00
126.00
128.00
130.00
132.00
NSA in degrees
De
gre
es
Figure: 10 - Difference between NSA on Left and Right side
LEFT FEMUR RIGHT FEMUR
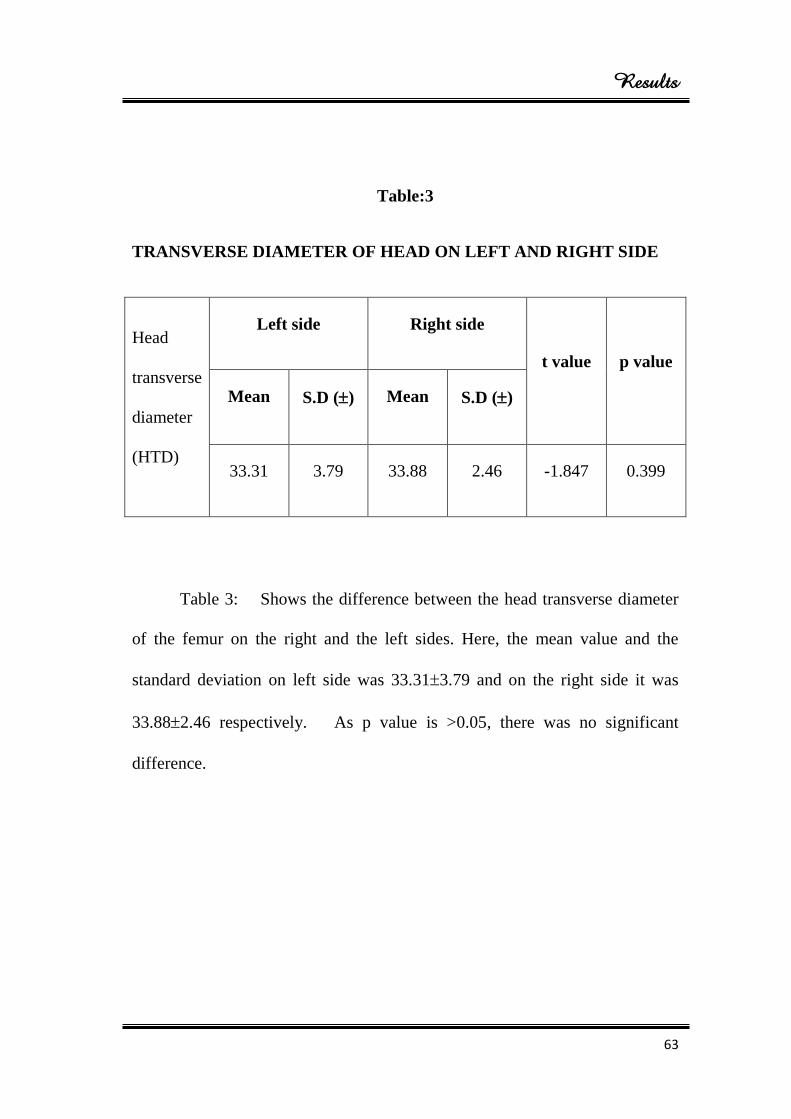
Results
63
Table:3
TRANSVERSE DIAMETER OF HEAD ON LEFT AND RIGHT SIDE
Head
transverse
diameter
(HTD)
Left side Right side
t value p value
Mean S.D () Mean S.D ()
33.31 3.79 33.88 2.46 -1.847 0.399
Table 3: Shows the difference between the head transverse diameter
of the femur on the right and the left sides. Here, the mean value and the
standard deviation on left side was 33.313.79 and on the right side it was
33.882.46 respectively. As p value is >0.05, there was no significant
difference.
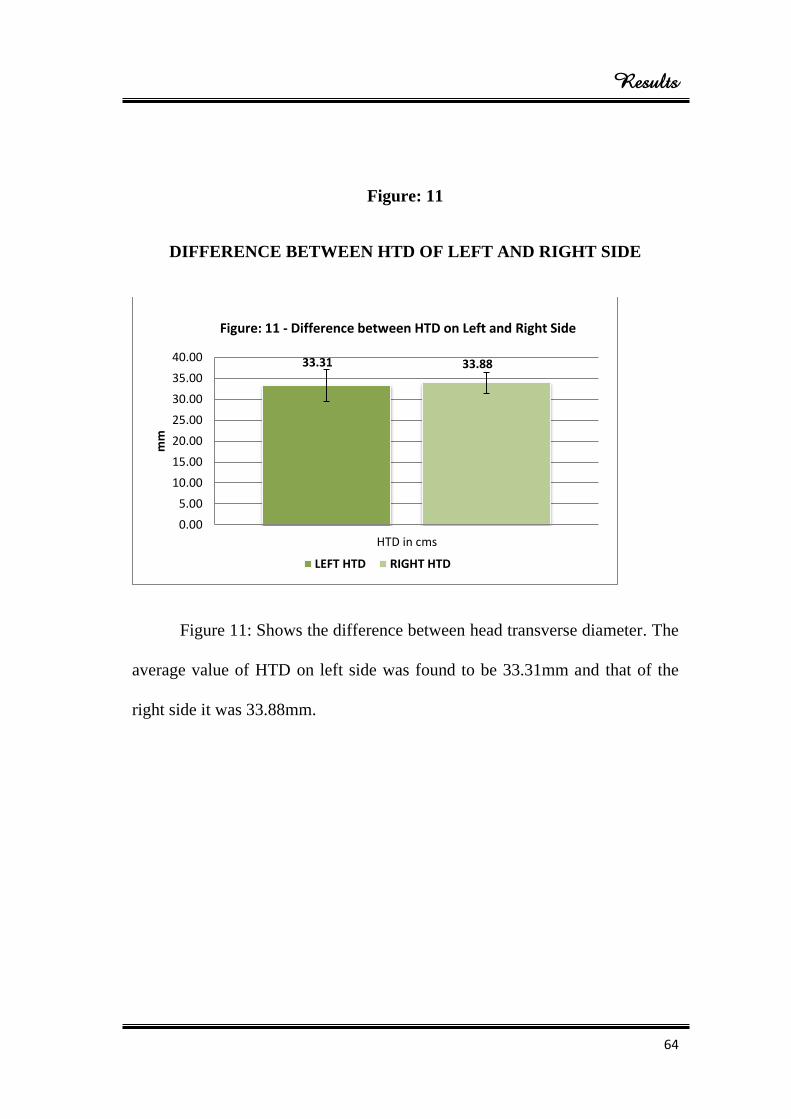
Results
64
Figure: 11
DIFFERENCE BETWEEN HTD OF LEFT AND RIGHT SIDE
Figure 11: Shows the difference between head transverse diameter. The
average value of HTD on left side was found to be 33.31mm and that of the
right side it was 33.88mm.
33.31 33.88
0.00
5.00
10.00
15.00
20.00
25.00
30.00
35.00
40.00
HTD in cms
mm
Figure: 11 - Difference between HTD on Left and Right Side
LEFT HTD RIGHT HTD
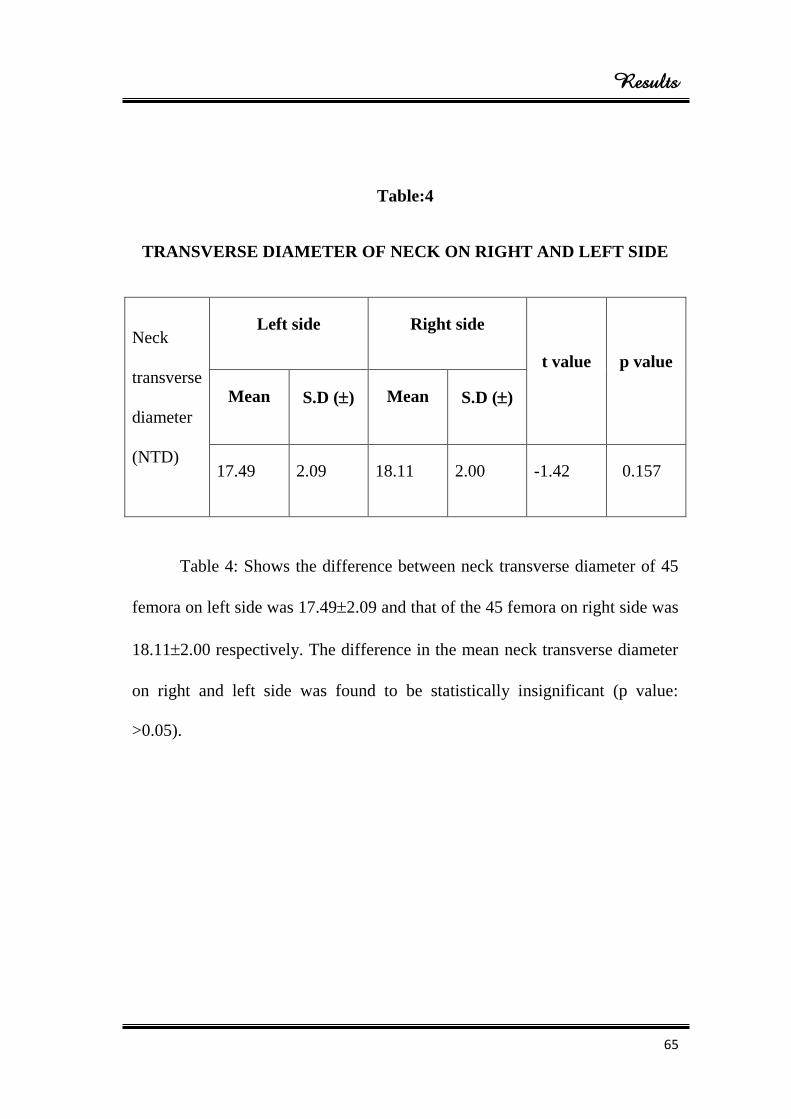
Results
65
Table:4
TRANSVERSE DIAMETER OF NECK ON RIGHT AND LEFT SIDE
Neck
transverse
diameter
(NTD)
Left side Right side
t value p value
Mean S.D () Mean S.D ()
17.49 2.09 18.11 2.00 -1.42 0.157
Table 4: Shows the difference between neck transverse diameter of 45
femora on left side was 17.492.09 and that of the 45 femora on right side was
18.112.00 respectively. The difference in the mean neck transverse diameter
on right and left side was found to be statistically insignificant (p value:
>0.05).
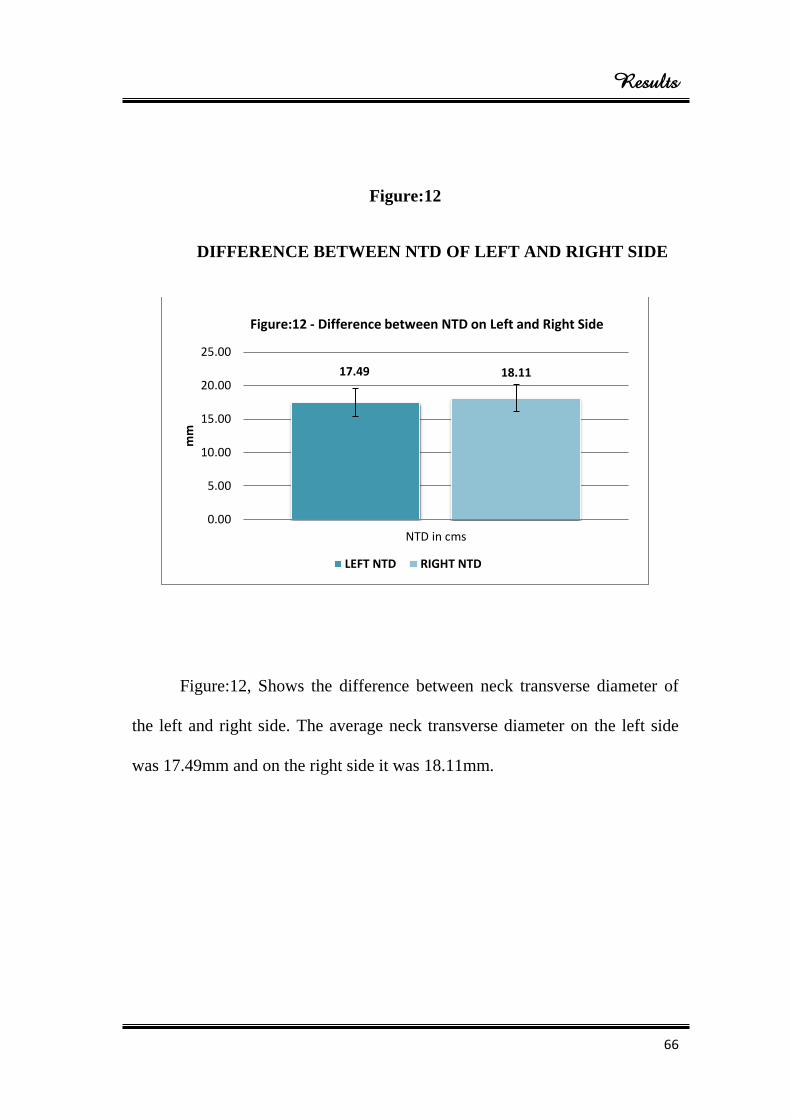
Results
66
Figure:12
DIFFERENCE BETWEEN NTD OF LEFT AND RIGHT SIDE
Figure:12, Shows the difference between neck transverse diameter of
the left and right side. The average neck transverse diameter on the left side
was 17.49mm and on the right side it was 18.11mm.
17.49 18.11
0.00
5.00
10.00
15.00
20.00
25.00
NTD in cms
mm
Figure:12 - Difference between NTD on Left and Right Side
LEFT NTD RIGHT NTD
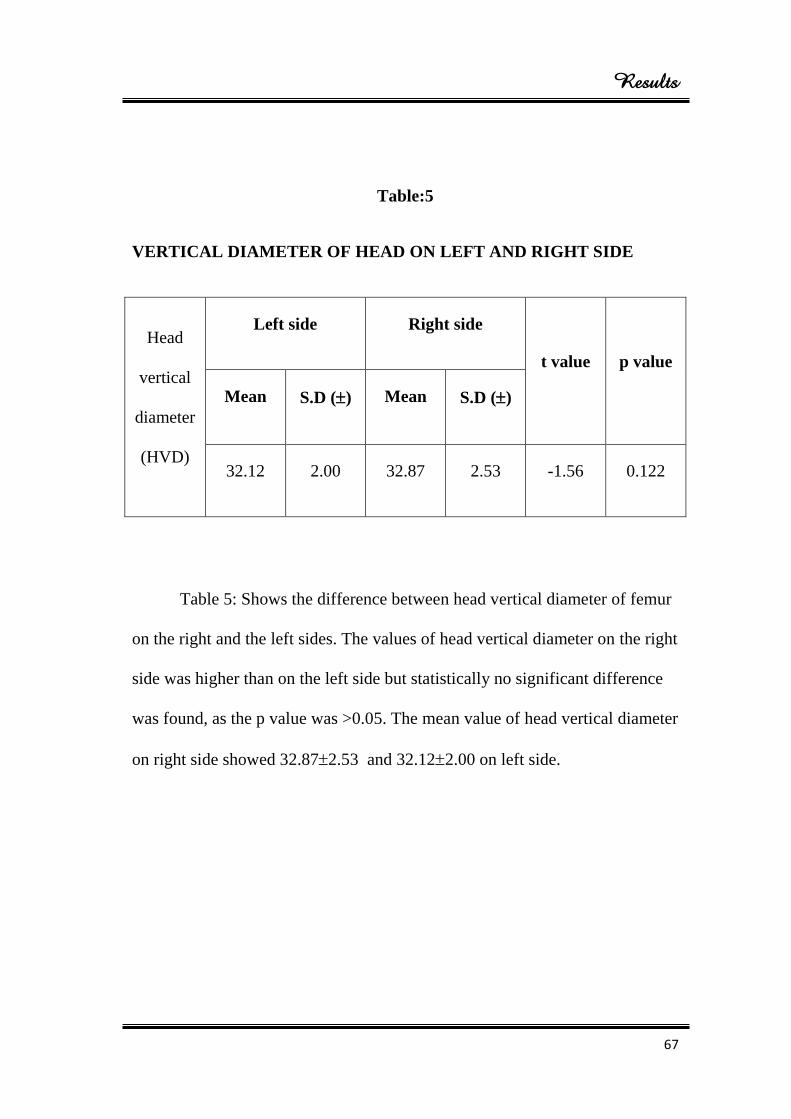
Results
67
Table:5
VERTICAL DIAMETER OF HEAD ON LEFT AND RIGHT SIDE
Head
vertical
diameter
(HVD)
Left side Right side
t value p value
Mean S.D () Mean S.D ()
32.12 2.00 32.87 2.53 -1.56 0.122
Table 5: Shows the difference between head vertical diameter of femur
on the right and the left sides. The values of head vertical diameter on the right
side was higher than on the left side but statistically no significant difference
was found, as the p value was >0.05. The mean value of head vertical diameter
on right side showed 32.872.53 and 32.122.00 on left side.
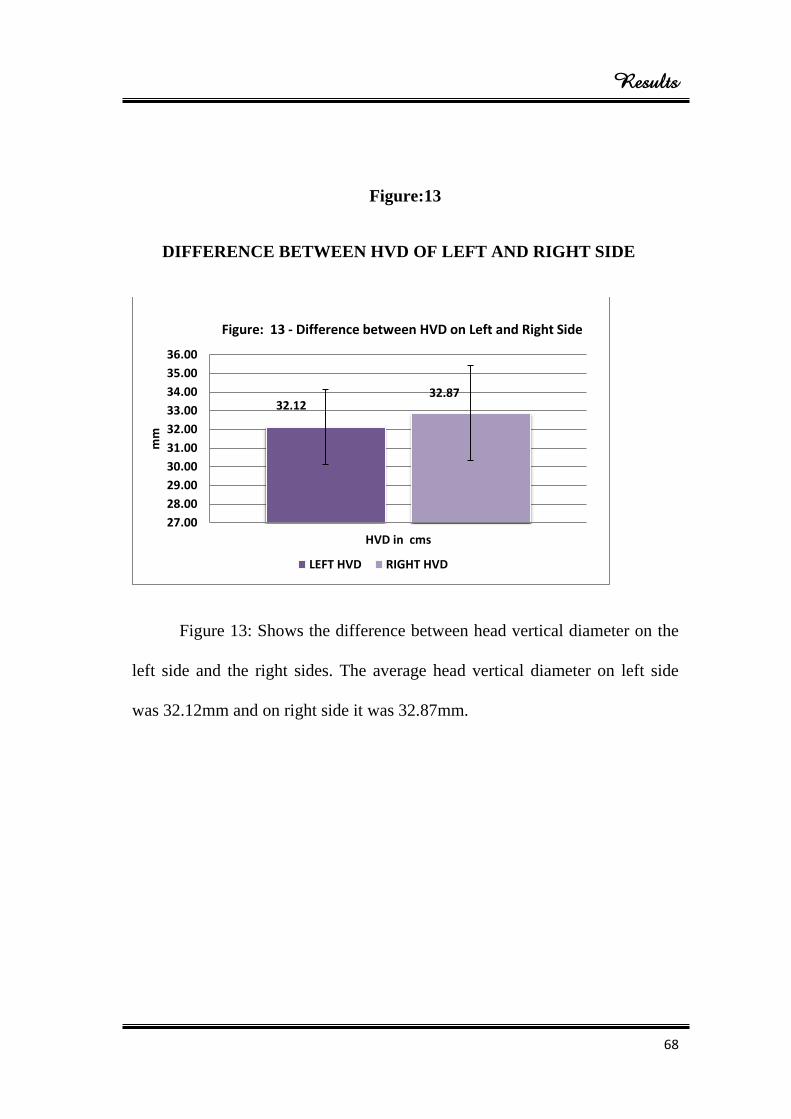
Results
68
Figure:13
DIFFERENCE BETWEEN HVD OF LEFT AND RIGHT SIDE
Figure 13: Shows the difference between head vertical diameter on the
left side and the right sides. The average head vertical diameter on left side
was 32.12mm and on right side it was 32.87mm.
32.12 32.87
27.00
28.00
29.00
30.00
31.00
32.00
33.00
34.00
35.00
36.00
HVD in cms
mm
Figure: 13 - Difference between HVD on Left and Right Side
LEFT HVD RIGHT HVD
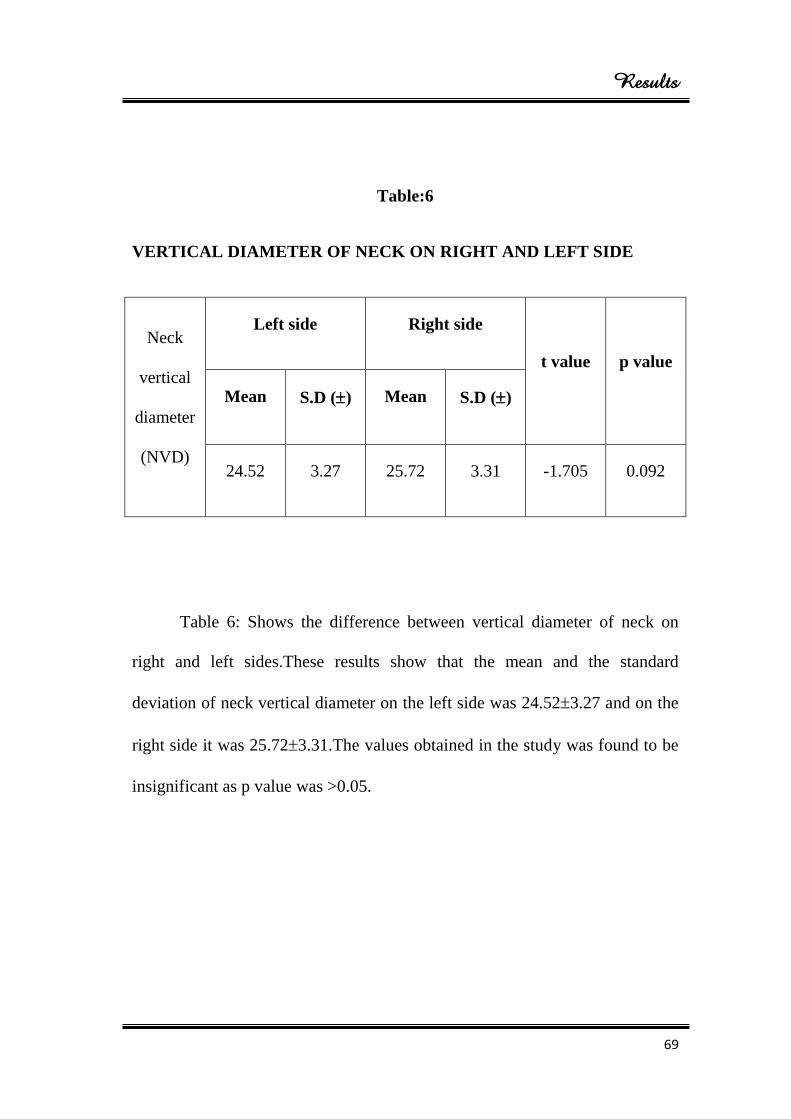
Results
69
Table:6
VERTICAL DIAMETER OF NECK ON RIGHT AND LEFT SIDE
Neck
vertical
diameter
(NVD)
Left side Right side
t value p value
Mean S.D () Mean S.D ()
24.52 3.27 25.72 3.31 -1.705 0.092
Table 6: Shows the difference between vertical diameter of neck on
right and left sides.These results show that the mean and the standard
deviation of neck vertical diameter on the left side was 24.523.27 and on the
right side it was 25.723.31.The values obtained in the study was found to be
insignificant as p value was >0.05.
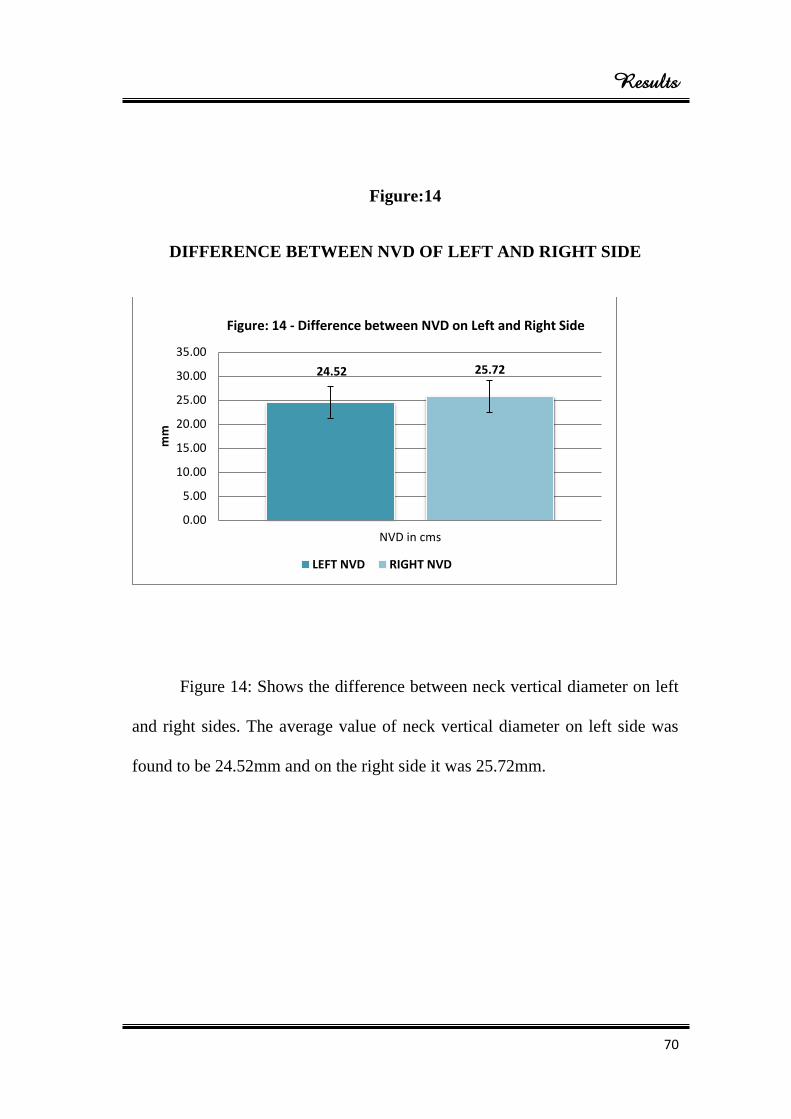
Results
70
Figure:14
DIFFERENCE BETWEEN NVD OF LEFT AND RIGHT SIDE
Figure 14: Shows the difference between neck vertical diameter on left
and right sides. The average value of neck vertical diameter on left side was
found to be 24.52mm and on the right side it was 25.72mm.
24.52 25.72
0.00
5.00
10.00
15.00
20.00
25.00
30.00
35.00
NVD in cms
mm
Figure: 14 - Difference between NVD on Left and Right Side
LEFT NVD RIGHT NVD
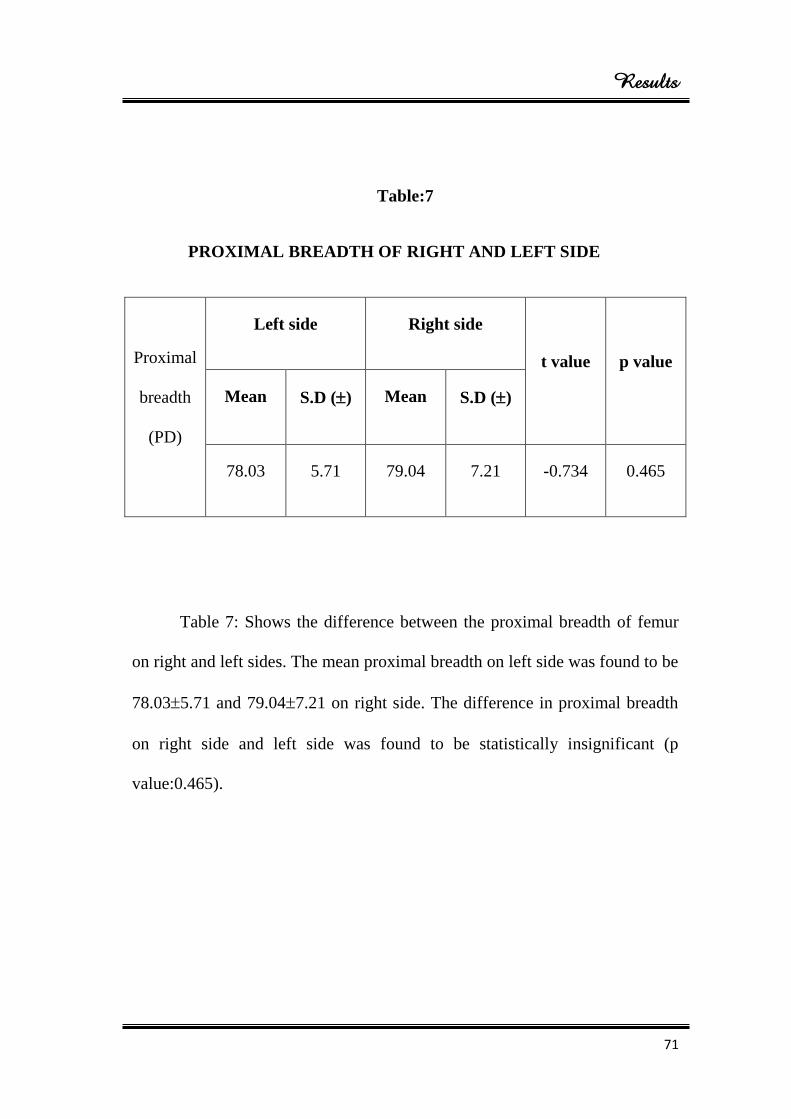
Results
71
Table:7
PROXIMAL BREADTH OF RIGHT AND LEFT SIDE
Proximal
breadth
(PD)
Left side Right side
t value p value
Mean S.D () Mean S.D ()
78.03 5.71 79.04 7.21 -0.734 0.465
Table 7: Shows the difference between the proximal breadth of femur
on right and left sides. The mean proximal breadth on left side was found to be
78.035.71 and 79.047.21 on right side. The difference in proximal breadth
on right side and left side was found to be statistically insignificant (p
value:0.465).
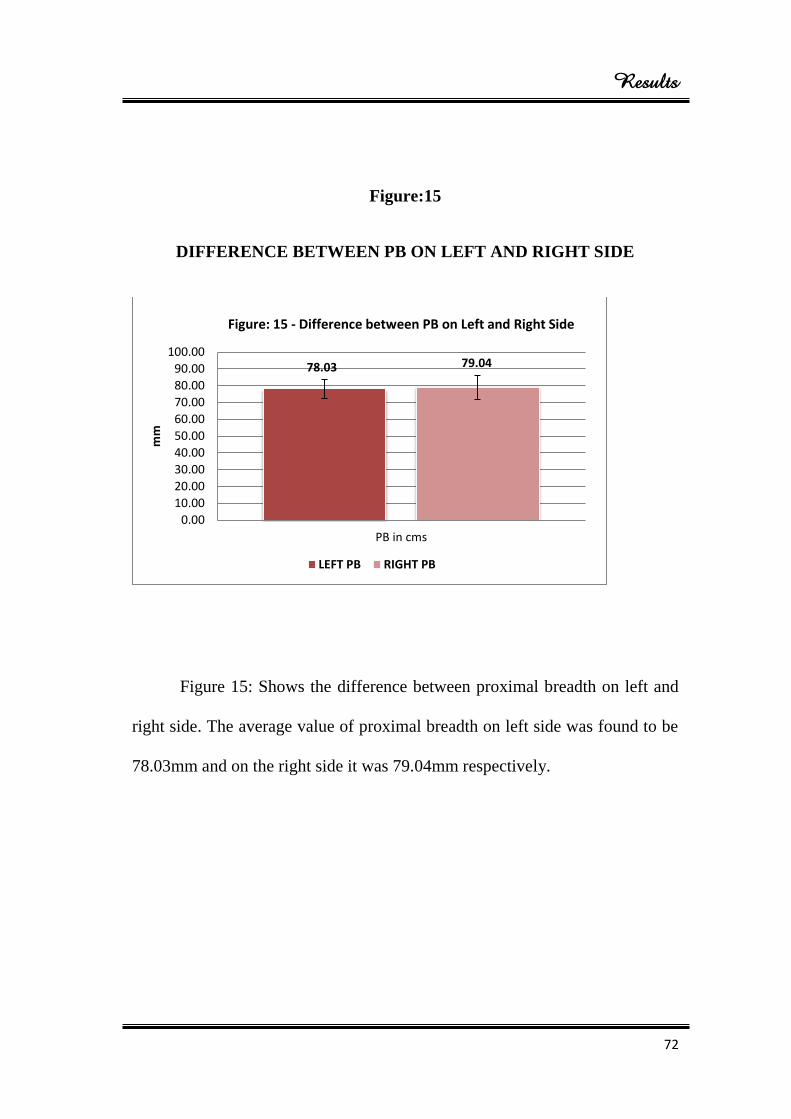
Results
72
Figure:15
DIFFERENCE BETWEEN PB ON LEFT AND RIGHT SIDE
Figure 15: Shows the difference between proximal breadth on left and
right side. The average value of proximal breadth on left side was found to be
78.03mm and on the right side it was 79.04mm respectively.
78.03 79.04
0.00
10.00
20.00
30.00
40.00
50.00
60.00
70.00
80.00
90.00
100.00
PB in cms
mm
Figure: 15 - Difference between PB on Left and Right Side
LEFT PB RIGHT PB
Discussion
73
DISCUSSION
In the past few decades, researchers worldwide have used various
methods to measure the bones. They have measured mechanically on the
cadaveric bone as well as in patients by Roentgenography, Ultrasound,
Computerised tomography and Magnetic resonance imaging. Earlier studies
revealed that the measurements vary in population and the methods adopted.
This study was carried out to evaluate the morphometry of the femur, to
find the difference between the right and the left side for designing
Orthopaedic implants used in the treatment of fracture of femur. There is an
increase in the incidence of injuries such as fracture of neck of femur.
Treatment of those fractures uses implants which are based on the
measurements of upper end of femur.
Neck shaft angle(Table:2)
In our study, the mean value of neck shaft angle on left side was
126.160 4.22
0 and on the right side it was 127.20
0 2.43
0. The difference in
the mean neck shaft angle on right and the left side was found to be
statistically insignificant (pvalue: 0.152). The average value of neck shaft
angle on left side was 126.150 and on right side it was 127.20
0.
Discussion
74
Ravichandran.D et al (2011)3 studied proximal femoral geometry and
concluded that the average neck shaft angle was 126.550, which is almost
similar to the values obtained in our study. Not many Indian studies are
available with respect to the proximal femur dimensions.
Kate (1968)22
worked on 1000 femora and found the average neck shaft
angle to be 128.40. Issac.B et al (1993)
27 found the average neck shaft angle as
127.50. Toogood et al (2009)
45 in their study on proximal femoral anatomy in
the normal human population have reported the average angle as 129.230. Our
results are almost similar to that of Kate, Issac and Toogood et al.
Saikia.K.C et al (2008)44
has reported the average neck shaft angle in
North Eastern population as 139.50. Nallathamby.R et al (2013)
2 worked on
100 dry femora in South Indian population and found the average neck shaft
angle to be 134.60. Our results differ largely from that of Saikia.K.C and
Nallathambhy.R et al.
Head transverse diameter (Table:3)
The difference between the head transverse diameter of femur of the
right and the left sides. Here, the mean value and the standard deviation on left
side was 33.313.79 and the mean head transverse diameter on right side was
33.882.46 respectively. As the p value is 0.399, there was no significant
Discussion
75
difference. The average value of HTD on left side was found to be 33.31mm
and on the right side it was 33.88mm.
Nidugala.H et al (2013)74
studied morphometry of femur in South
Indian population and concluded that the head transverse diameter on right
and the left sides was 35.312.90 and 36.813.79 respectively, which was
almost similar to our result.
Desousa.E.B et al (2010)5 studied proximal extremity of femur and
found that the average head transverse diameter on right side was 31.12.7
and on the left side it was 30.83.0. In our study, the values are almost similar
to Desousa.E.B et al. But Ziylan.Tet al (2002)36
quoted that in Anatolion
population, the average HTD was 44.74.1 on right side and 44.33.3 on left
side. The results reported by Ziylan.T et al were contrasting to the values
obtained in our study. It may be due to the variation among the population.
Neck transverse diameter (Table:4)
The difference between neck transverse diameter of 45 femora on left
side was observed as 17.492.09 and 45 femora on right side was 18.112.00
respectively. The difference in the mean neck transverse diameter on right and
left side was found to be statistically insignificant (p value: 0.157).The
average neck transverse diameter on left side was 17.49mm and on the right
side it was 18.11mm.
Discussion
76
Ziylan.T et al (2002)36
studied an analysis of Anatolian femur and
reported that the values of neck transverse diameter on right side was 26.33.1
and on left side it was 25.52.7, the results obtained by Ziyal.T et al was
contrasting to our results. This may be due to variation in the population.
Head vertical diameter (Table: 5)
The difference between head vertical diameter on femora of right and
left side. The values of head vertical diameter on right side was higher than
left side but statistically no significant differences were found, as the p value
was 0.122. The mean value of head vertical diameter on right side showed
32.872.53 and on the left side it was 32.122.00.The average head vertical
diameter on left side was 32.12mm and on the right side it was 32.87mm.
Nidugala.H et al (2013)74
did a study on morphometry of femur in
South Indian population and revealed that the head vertical diameter on right
side was 39.853.55 and on the left side was 41.753.48. So the result
obtained by Nidugala.H et al differs greatly when compared to our study.
Neck vertical diameter (Table:6)
The difference between neck vertical diameter on right and left side.
These result shows that the mean and the standard deviation of neck vertical
diameter on left side was 24.523.27 and on right side it was 25.723.31. It
was found that the p value was 0.092, which is insignificant. The average
Discussion
77
value of neck vertical diameter on left side was found to be 24.52mm and on
the right side it was 25.72mm.
Ziylan.T et al (2002)36
reported the morphometry of Anatolion femur
and quoted the result of neck vertical diameter on right side as 45.24.0 and
on left side as 43.43.2. Due to the variation in the population of our study,
the results of Ziylan.T et al, was contrasting to our study.
Proximal breadth (Table:7)
The difference between the proximal breadth on femora of right side
and left side. The mean proximal breadth on left side was found to be
78.035.71 and that on the right side was 79.047.21. The difference in
proximal breadth of right side and left side was found to be statistically
insignificant (p value:0.465).The average value of proximal breadth on left
side was found to be 78.03mm and on right side it was 79.04mm respectively.
Nidugala.H et al (2013)74
studied the metric assessment of femur in
South Indian population and concluded that the proximal breadth on right side
was 76.745.73 and that on left side was 79.786.71. The values obtained in
this study was almost similar to our study.
Strecker et al (1997)31
stated that the mean values of right and left
femora were found to be similar, although the left femur generally showed
larger values than on the right, they were not much significant.
Discussion
78
Parsons (1914)18
proposed that no significant bilateral differences were
found in bones.
Ziylan.T et al (2002)36
found, a significant difference in the head
vertical diameter of femur on right and left sides.
Summary & Conclusion
79
SUMMARY
A descriptive study was carried out on 90 dry femora from the
department of Anatomy, at Sree Mookambika Institute of Medical Sciences,
Kulasekharam. The morphometric difference between right and the left femora
were assessed. The data was collected in a fixed time.
The study revealed that there is no statistical significant difference
found in the measurements on the right and the left femora. Therefore the
mean values of NSA, HTD, NTD, HVD, NVD and PB will enlighten the
biomechanical engineers to take a revolutionary step towards altering the
implants designs to suit our needs.
Summary & Conclusion
80
CONCLUSION
The study has shown that there is no significant difference between the
values obtained on the right and the left femora.
In this study the mean value of Neck shaft angle, Head transverse
diameter, Neck transverse diameter, Head vertical diameter, Neck vertical
diameter and proximal breadth on the right and left femora have no statistical
significant differences.
It is commonly accepted that the statistical analysis of Morphometry of
femur among various populations reveals a large amount of variation due to
the fact that the morphometric measurements of femur from different
countries are likely to be affected by variations in climate, hereditary, diet and
other geographical factors related to life style.
Bibliography
BIBLIOGRAPHY
1. Gray’s Anatomy. 2nd
edition, edited by Drake.L.R, Vogl.A.W,
Mitchell.A.W.M, congress cataloguing in publication 2010; 529-32.
2. Nallathamby.R, Avadhani.R, Jacob.M, Babu.B. Cervico- diaphyseal angle
of femur- a comparative study in South Indian population.Int J of Cur Res
2013; 5(8): 2249-51.
3. Ravichandran D, Muthukumaravel N, Jaikumar R, Das H and Rajendran M
(2011). Proximal femoral geometry in Indians and its clinical applications.
J of AnatSoc of Ind2011;60: 6-12.
4. Srimathi T, Muthukumar T, Anandarani VS, Sembian U, Subramanian R.
A study on femoral neck anteversion and its clinical correlation. J
ClinDiagn Res 2012;6:155–8.
5. De Sousa E, Fernandes RMP, Mathias MB, Rodrigues MR, Ambram AJ
and Babinski MA. Morphometric study of the proximal femur extremity in
Brazilians. Intern J of Morph 2010; 28: 835-40.
6. Sen.R.K, Tripathy.S.K, Kumar.R, Kumar.A, Dhatt.S, Dhillon.M.S,
Nagi.O.N, Gulati.M. Proximal femoral medullary canal diameters in
Indians: correlation between anatomic, radiographic, and computed
tomographic measurements. J of OrthSur 2010; 18(2): 189-94.
Bibliography
7. Bokariya.P, Kothari.R, Waghmare.J.E, Tarnekar.A.M, Ingole.I.V.
Anthropometric study of femur in Central Indian population. J of MGIMS
2009; 14(2): 47- 9.
8. Longia GS, Ajmani ML, Saxena SK, Thomas RJ. Study of diaphyseal
nutrient foramina in human long bones. Acta J Anat (Basel).
1980;107(4):399-406
9. Eckhoff DG, Kramer RC, Watkings JJ, AlongiCA, van Greven DP.
Variation in femoralAnteversion. CliniAnat 1994;7:71-5.
10. Baharuddin.M.Y, Kadir.M.R.A, Zulkifly.A.H, Saat.A, Aziz.A.A,
Lee.M.M. Morphology study of the proximal femur in Malay population.
Int J Morphol 2011; 29(4): 1321-25.
11. LinweiLv, GuangweiMeng, Weimin Zhu, He Gong, Dong Zhu, Xizheng
Zhang. Relationships between the three-dimension morphologic
parameters of proximal femurs. Intern Con on BioEng and Info. 2012; 511-
13.
12. Cummings 1993 Cummings SR, Black DM, Nevitt MC, Browner
W,Cauley J, Ensrud K, Genant HK, Palermo L, Scott J,Vogt TM. Bone
density at various sites for prediction ofhip fractures. The Lancet. 1993;
341(8837): 72-5.
13. Boonen S, Koutri R, Dequeker J, Aerssens J, Lowet G, Nijs J, Verbeke G,
Lesaffre E, Geusens P. Measurement of femoral geometry in type I and
type II osteoporosis. J of Anat 1999; 324-45.
Bibliography
14. Singh.IB. Osteology. In: textbook of Anatomy, 4th
edition; New Delhi,
Jaypee Medical Publishers, 2007; 1: 58- 68.
15. Singh.IB. A textbook of Human Histology with colour atlas and practical
guide; 6th
edition; NewDelhi; Jaypee Medical Publishers, 2011; pg-121.
16. Singh.IB. A text book of Human Embryology. 9th
edition, Haryana;
Macmillan publishers, 2012; 90-9.
17. Humphry G (1889). The angle of the neck with the shaft of the femur at
different periods of life and under different circumstances. J of Anat and
Physio 23: 273-82.
18. Parsons FG. The characters of the English thigh bone. J AnatPhysiol
1914;48:238-67.
19. Pick JW, Stack JK, Anson BJ. Measurements on the human femur. I.
Lengths, diameters and angles. Q Bull Northwest UniMed Sch. 1941;
15:281–90.
20. Elftman H. Torsion of lower extremity. Amer J of physic
Anthro1945;3:255-65.
21. Breathnach AS. Pelvis and Femur - The Lower Extremity In: Frazer’s
Anatomy of the Human Skeleton, 5th edition (J & A Churchill Ltd,
London) 1958; 102-27.
22. Kate BR. The angle of femoral neck in Indians.East J Anthro1967; 20: 54-
60.
Bibliography
23. Chibber SR and Singh I. Asymmetry in muscle weight and one sided
dominance in the human lower limbs. J of Anat1970;106: 553-6.
24. Hoaglund FT and Low WD. Anatomy of the femoral neck and head, with
comparative data from Caucasians and Hong Kong Chinese. CliniOrtho
and Rel Res 1980; 152: 10–6.
25. Reikeras O, Holseth A, ET AL. Femoral neck angles.
ActaOrthopScandinavica 1982; 53:775-79.
26. Staheli LT, Corbett M, Wyss C, King H. Lowerextremity rotational
problems in children: normal values to guide management. J Bone Joint
Surg Am 1985;67:39-47.
27. Isaac B, Vettivel S, Prasad R, Jeyaseelan L and Chandi G. Prediction of the
femoral neck-shaft angle from the length of the femoral neck. CliniAnat
1993; 10:318–23.
28. Trinkaus E. Femoral neck-shaft angles of the Qafzeh-Skuhl early modern
humans, and activity levels among immature Near Eastern Middle
Paleolithic hominids. J of HumEvolu1993; 25: 393-416.
29. Ranganathan.TS. A text book of Human Anatomy; 5th
Edn; New Delhi,
S.Chand& Company, 1996; 224.
30. Karlsson KM, Sernbo I, Obrant KJ, Redlund-Johnell I, Johnell O. Femoral
neck geometry and radiographic signs of osteoporosis as predictors of hip
fracture. J of Bone. 1996; 18(4): 327-30.
Bibliography
31. Strecker W, Keppler P, Gebhard F, KinzlL.Length and torsion ofthe lower
limb. Br J BoneJointSurg 1997; 79: 1019 - 23.
32. Anderson JY and Trinkaus E. Patterns of sexual, bilateral and
interpopulational variation in human femoral neck-shaft angles. J of Anat
1998; 192: 279–85.
33. Duthie, R. A.; Bruce, M. F. & Hutchison, J. D. Changing proximal femoral
geometry in north east Scotland: an osteometric study. Brit. Med. J. 1998;
316:498.
34. Gnudi S, Ripamonti C, Gualtieri G and Malavolta N. Geometry of
proximal femur in the prediction of hip fracture in osteoporotic women.
British J of Radio 1999; 72: 729-33.
35. Leelavathy N, Rajangam s, Janakiram S, Thomas JM. Sexing of the
femora.Indian journal of anatomical. Society of india.2000; 49(1):17-20.
36. Ziylan.T.An Analysis of Anatolian Human femur Anthropometry, Turkey
Jl of MedSci 2002; 32: 231-35.
37. Chauhan.R, Paul.S, Dhaon.bK. Anatomical parameters of North Indian Hip
Joints: Cadaveric study. J AnatSocInd 2002; 51: 39- 42.
38. Siwach RC and DahiyaS.Anthropometric study of proximal femur
geometry and its clinical application. Ind J of Ortho 2003; 37 :247-51.
39. Pulkkinen P, Partanen J, Jalovaara P and Jamsa T. Combination of bone
mineral density and upper femur geometry improves the prediction of hip
fracture. Osteo InternJ 2004;15: 274-80.
Bibliography
40. Calis HT, Eryavuz M andCalis M. Comparison of femoral geometry
among cases with and without hip fractures. Yonsei MedJ2004;45: 901-7.
41. Nissen N, Hauge EM, Abrahamsen B, Jensen JEB,Mosikilde L and Brixen
K. Geometry of the proximal femur in relation to age and sex: a cross-
sectional study in healthy adult Danes. ActaRadiologica 2005; 5: 514-18.
42. Irdesel J and Ari I. The proximal femoral morphometry of Turkish women
on radiographs. European J of Anat2006; 10: 21-6.
43. Samaha AA and Ivanov AV. Asymmetry and structural system analysis of
the proximal femur meta-epiphysis: osteoarticular anatomical pathology. J
of Ortho Sur and Res 2008; 3: 11.
44. SaikiaKC,Bhuyan SK and Rongphar R. Anthropometric study of the hip
joint in Northeastern region population with computed tomography scan.
Ind J of Ortho 2008; 42: 260–6.
45. Toogood PA, Skalak A and Cooperman DR. Proximal Femoral Anatomy
in the normal human population. Clini Ortho and Rel Res2009; 467: 876-
85.
46. Mishra, A. K.; Chalise, P.; Singh, R. P. & Shah, R. K. The proximal femur
- a second look at rational of implant design. Nepal Med. Coll. J 2009;
11(4):278-80.
47. Gargi S, Usha D, Sudha C. Determination of sex from femur: Discriminant
analysis. J. Anat. Soc. India 2010; 59(2) 216-21.
Bibliography
48. Zalawadia A, Ruparelia S. Study of Femoral Neck Anteversion neck. J
Bone Joint Surg Am. 1979; 61:46-51.
49. Manjumurali.V, Latha.V,Prabu, Mangala.M, Kumar.B.M. Morphological
and topographicalanatomy of nutrient foramina in human upper limb long
bones and their surgical importance. Rom J MorpholEmbryol2011;
52(3):859-62.
50. Kaur.P, Mathew.S, George.U. A study of neck shaft angle in the North
West Indian population on radiographs.Int J Bas Med Scien 2013; 3(3): 9-
15.
51. Kamdi.A, Gayathri, Sherke.A.R, Krishnaiah. Osteometric parameters of
femur in Telungana Region. J of Den and Med Scien 2014; 13(9): 26-8.
52. Christopher, A.K., Yascar, M.I., Susan, R.L. Metric and comparative
analysis of sexual dimorphism in the Thai Femur. J. Forensic Sci 1988; 43:
954-58.
53. Gluer CC, Cummings SR, Pressman A, LI J, Gluer K, Faulkner KG,
Grampp S and Genant HK. Prediction of hip fractures from pelvic
radiographs: the study of osteoporotic fractures. The study of osteoporotic
fractures research group. J Bone Miner Res1994; 9: 671-77.
54. Robertson D, Essinger J, Imura S, et al. Femoral deformity in adults with
developmental hip dysplasia. ClinOrthop 1996;327:196-206.
55. Kaneuji A, Matsumoto T, Nishino M, Miura T, Sugimori T, Tomita K.
Three-dimensional morphological analysis of the proximal femoral canal,
Bibliography
using computeraided design system, in Japanese patients with
osteoarthrosis of the hip. J Orthop Sci. 2000; 5(4): 361-68.
56. Singh IP and Bhasin MK. A manual of biological antropology. 2004; 16,
2(3): 79-84.
57. Dong X, Zheng GY. Fully automatic determination of morphological
parameters of proximal femur from calibrated fluoroscopic images through
particle filtering. Lecture Note in Computer Science. 2006; 4142: 535- 46.
58. Song WW, Oue ZY, Zhao DW, Wang WM. ComupteraidedModeling and
Morphological Analysis of Hip Joint. The 1st International Conference on
Bioinformatics and Biomedical Engineering.Int Con Bio Eng 2007;
1218-21.
59. Chantarapanich N, Sitthiseripratip K, Mahaisacariya B, Wongcumchang
M, Siribodhi P. 3D Geometrical Assessment of Femoral Curvature: A
Reverse Engineering\ Technique. J Med Assoc Thai. 2008; 91(9): 1377-81.
60. Aroonjarattham P, Jiamwatthanachai P, Mahaisavariya B, Kiatiwat T,
Aroonjarattham K, Sitthiseripratip K. Three-Dimensional Morphometric
Study of the Thai Proximal Humerus: Cadaveric Study. J Med Assoc Thai
2009; 92(9): 1191-97.
61. Faulkner KG, Mcclung M and Cumings SR. Automated evaluation of hip
axis length for predicting hip fracture. J Bon Miner Res 1993; 9: 1065-70.
Bibliography
62. Felson DT, Zhang Y, Hannan MT and Anderson JJ. Effects of weight and
body mass index on bone mineral density in men and women. Framingham
study. J Bon Miner Res 1993; 8: 567-73.
63. Peacock M, Turner CH, Liu G, Manatunga AK, Timmerman L and
Johnston CC Jr. Better discrimination of hip fracture using bonedensity,
geometry and architecture. Osteopor Inter J1995; 5 167-73.
64. Pinilla TP, Boardman KC, Bouxsein ML, Myers ER and Hayes WC.
Impact direction from a fall influences the failure load of the proximal
femur as much as age-related bone loss. CalciTissInt 1996; 58: 231-35.
65. Ravn P, Cizza G, Bjarnason NH, Thompson D, Daley M, Wasnich RD,
McclungM, Hosking D, Yates AJ and Christainsen C. Low body mass
index is an important risk factor for low bone mass and increased bone loss
in early postmenopausal women. Early postmenopausal intervention
Cohort (ERIC) study group. J Bone Miner Res 1999; 14: 1622-27.
66. Simmermacher RK, Bosch AM, Van der Werken C. The AO/ASIF-
proximal femoral nail (PFN): a new device for the treatment of unstable
proximal femoral fractures.J of Injur 1999; 30:327–32.
67. Rosso R and Minisola S. Hip axis length in an Italian osteoporotic
population. Br J Radiol2000; 73: 969-72.
68. Testi D, Cappello A, Chiaril L, VicecontiI M and Gnudi S. Comparison of
logistic and Bayesian classifiers for evaluating the risk of femoral neck
fracture in osteoporotic patients. Med BiolEng 2001; 39: 633-37.
Bibliography
69. Gregory JS, Testi D, Stewart A, Undrill PE, Reid DM and Aspden RM. A
method for assessment of the shape of the proximal femur and its
relationship to osteoporotic hip fracture.OsteoporosIntJ 2004; 15: 5-11.
70. Bridle SH, Patel AD, Bircher M, Calvert PT. Fixation of intertrochanteric
fractures of the femur. A randomized prospective comparison of the
gamma nail and the dynamic hip screw. J Bone Joint Surg Br 1991;
73:330–34.
71. Baumgartner MR, Curtin SL, Lindskog DM and Keggi JM. The value of
the tip-apex distance in predicting failure of fixation of peritrochanteric
fractures of the hip. J Bone Joint Surg Am. 1995;77:1058-64.
72. Kim JS, Park TS, Park SB, Kim JS, Kim IY, Kim SI.Measurement of
femoral neck anteversion in 3D. Part 1: 3D imaging method. Med
BiolEngComput 2000;38:603-9.
73. Song P.U, Lei L.U, Guang-Lin.W, Fang.Y, YangInt.T. Results of the
proximal femoral nail anti-rotation (PFNA) in elderly Chinese. J of pat
Orthop 2009; 33(5): 1441–1444.
74. Nidugala.H, Bhaskar.B, Suresh.S, Avandhani.R. Metric assessment of
Femur using discriminant function analysis in South Indian population.Int
J Anat Res 2013; 1(2):29-32.
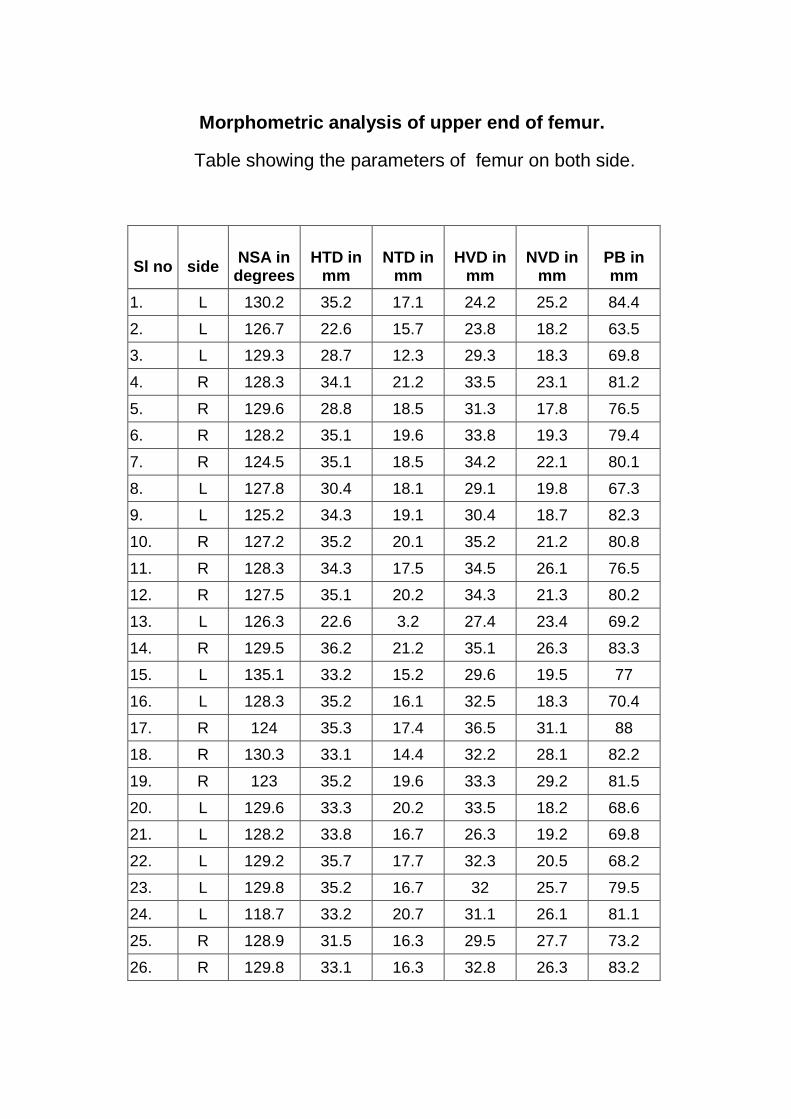
Morphometric analysis of upper end of femur.
Table showing the parameters of femur on both side.
Sl no
side
NSA in
degrees
HTD in
mm
NTD in
mm
HVD in
mm
NVD in
mm
PB in mm
1. L 130.2 35.2 17.1 24.2 25.2 84.4
2. L 126.7 22.6 15.7 23.8 18.2 63.5
3. L 129.3 28.7 12.3 29.3 18.3 69.8
4. R 128.3 34.1 21.2 33.5 23.1 81.2
5. R 129.6 28.8 18.5 31.3 17.8 76.5
6. R 128.2 35.1 19.6 33.8 19.3 79.4
7. R 124.5 35.1 18.5 34.2 22.1 80.1
8. L 127.8 30.4 18.1 29.1 19.8 67.3
9. L 125.2 34.3 19.1 30.4 18.7 82.3
10. R 127.2 35.2 20.1 35.2 21.2 80.8
11. R 128.3 34.3 17.5 34.5 26.1 76.5
12. R 127.5 35.1 20.2 34.3 21.3 80.2
13. L 126.3 22.6 3.2 27.4 23.4 69.2
14. R 129.5 36.2 21.2 35.1 26.3 83.3
15. L 135.1 33.2 15.2 29.6 19.5 77
16. L 128.3 35.2 16.1 32.5 18.3 70.4
17. R 124 35.3 17.4 36.5 31.1 88
18. R 130.3 33.1 14.4 32.2 28.1 82.2
19. R 123 35.2 19.6 33.3 29.2 81.5
20. L 129.6 33.3 20.2 33.5 18.2 68.6
21. L 128.2 33.8 16.7 26.3 19.2 69.8
22. L 129.2 35.7 17.7 32.3 20.5 68.2
23. L 129.8 35.2 16.7 32 25.7 79.5
24. L 118.7 33.2 20.7 31.1 26.1 81.1
25. R 128.9 31.5 16.3 29.5 27.7 73.2
26. R 129.8 33.1 16.3 32.8 26.3 83.2
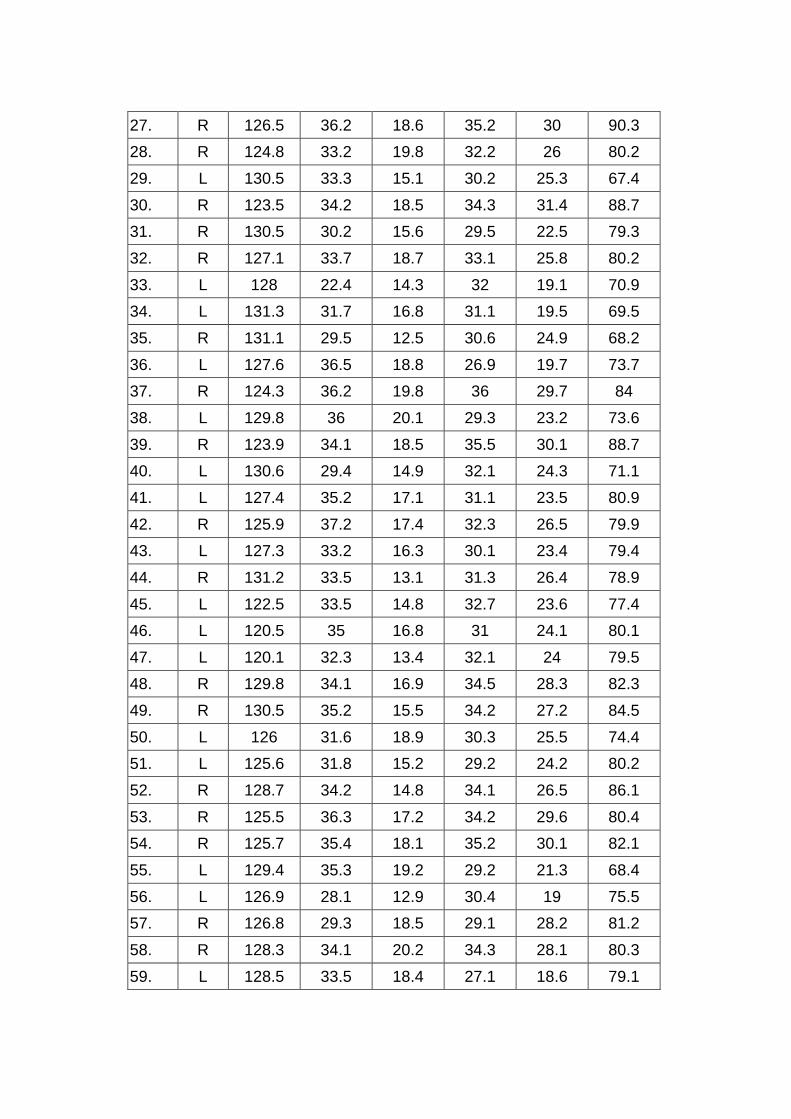
27. R 126.5 36.2 18.6 35.2 30 90.3
28. R 124.8 33.2 19.8 32.2 26 80.2
29. L 130.5 33.3 15.1 30.2 25.3 67.4
30. R 123.5 34.2 18.5 34.3 31.4 88.7
31. R 130.5 30.2 15.6 29.5 22.5 79.3
32. R 127.1 33.7 18.7 33.1 25.8 80.2
33. L 128 22.4 14.3 32 19.1 70.9
34. L 131.3 31.7 16.8 31.1 19.5 69.5
35. R 131.1 29.5 12.5 30.6 24.9 68.2
36. L 127.6 36.5 18.8 26.9 19.7 73.7
37. R 124.3 36.2 19.8 36 29.7 84
38. L 129.8 36 20.1 29.3 23.2 73.6
39. R 123.9 34.1 18.5 35.5 30.1 88.7
40. L 130.6 29.4 14.9 32.1 24.3 71.1
41. L 127.4 35.2 17.1 31.1 23.5 80.9
42. R 125.9 37.2 17.4 32.3 26.5 79.9
43. L 127.3 33.2 16.3 30.1 23.4 79.4
44. R 131.2 33.5 13.1 31.3 26.4 78.9
45. L 122.5 33.5 14.8 32.7 23.6 77.4
46. L 120.5 35 16.8 31 24.1 80.1
47. L 120.1 32.3 13.4 32.1 24 79.5
48. R 129.8 34.1 16.9 34.5 28.3 82.3
49. R 130.5 35.2 15.5 34.2 27.2 84.5
50. L 126 31.6 18.9 30.3 25.5 74.4
51. L 125.6 31.8 15.2 29.2 24.2 80.2
52. R 128.7 34.2 14.8 34.1 26.5 86.1
53. R 125.5 36.3 17.2 34.2 29.6 80.4
54. R 125.7 35.4 18.1 35.2 30.1 82.1
55. L 129.4 35.3 19.2 29.2 21.3 68.4
56. L 126.9 28.1 12.9 30.4 19 75.5
57. R 126.8 29.3 18.5 29.1 28.2 81.2
58. R 128.3 34.1 20.2 34.3 28.1 80.3
59. L 128.5 33.5 18.4 27.1 18.6 79.1
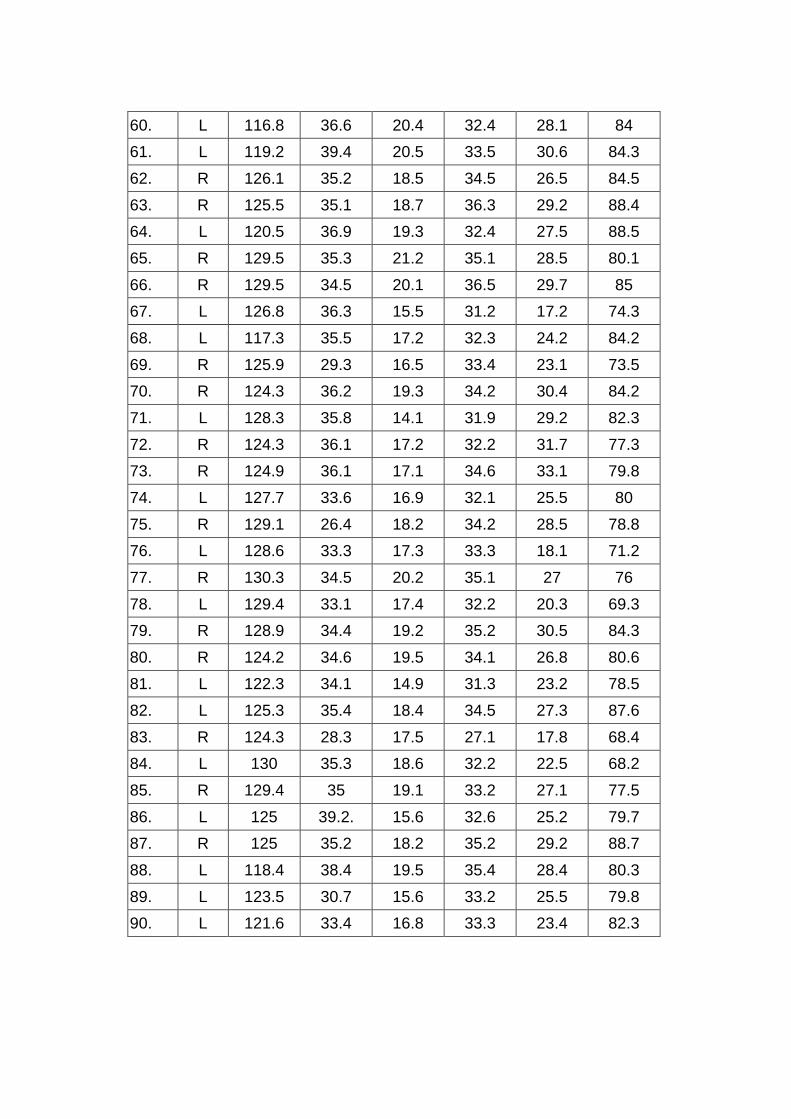
60. L 116.8 36.6 20.4 32.4 28.1 84
61. L 119.2 39.4 20.5 33.5 30.6 84.3
62. R 126.1 35.2 18.5 34.5 26.5 84.5
63. R 125.5 35.1 18.7 36.3 29.2 88.4
64. L 120.5 36.9 19.3 32.4 27.5 88.5
65. R 129.5 35.3 21.2 35.1 28.5 80.1
66. R 129.5 34.5 20.1 36.5 29.7 85
67. L 126.8 36.3 15.5 31.2 17.2 74.3
68. L 117.3 35.5 17.2 32.3 24.2 84.2
69. R 125.9 29.3 16.5 33.4 23.1 73.5
70. R 124.3 36.2 19.3 34.2 30.4 84.2
71. L 128.3 35.8 14.1 31.9 29.2 82.3
72. R 124.3 36.1 17.2 32.2 31.7 77.3
73. R 124.9 36.1 17.1 34.6 33.1 79.8
74. L 127.7 33.6 16.9 32.1 25.5 80
75. R 129.1 26.4 18.2 34.2 28.5 78.8
76. L 128.6 33.3 17.3 33.3 18.1 71.2
77. R 130.3 34.5 20.2 35.1 27 76
78. L 129.4 33.1 17.4 32.2 20.3 69.3
79. R 128.9 34.4 19.2 35.2 30.5 84.3
80. R 124.2 34.6 19.5 34.1 26.8 80.6
81. L 122.3 34.1 14.9 31.3 23.2 78.5
82. L 125.3 35.4 18.4 34.5 27.3 87.6
83. R 124.3 28.3 17.5 27.1 17.8 68.4
84. L 130 35.3 18.6 32.2 22.5 68.2
85. R 129.4 35 19.1 33.2 27.1 77.5
86. L 125 39.2. 15.6 32.6 25.2 79.7
87. R 125 35.2 18.2 35.2 29.2 88.7
88. L 118.4 38.4 19.5 35.4 28.4 80.3
89. L 123.5 30.7 15.6 33.2 25.5 79.8
90. L 121.6 33.4 16.8 33.3 23.4 82.3