mri in lymphoma: where are we in 2016 -...
TRANSCRIPT
Alain RahmouniHenri Mondor Academic Hospital
Paris Est Créteil University, France
MRI in lymphoma:
where are we in
2016

PlanRequirements DWI signal in lymphoma
ADC measurement
SNR:
Surface coils
1.5 T and 3T
Moving table and stations
EPI sequence design
Imaging findings
Pitfalls and limitations
What’s new?

DW signal in lymphoma
Lymphoma: high
cellularity and high
nuclear-to-cytoplasm
ratio
Lower ADC values than
other tumors
Nakayama T et al. J Magn Reson Imaging 2004
Sumi M et al. Eur Radiol 2007
King AD et al. Radiology 2007
Toh CH et al. AJNR Am J Neuroradiol 2008
DLBCL: H&E stain

DW signal in lymphoma
Malignant cervical lymphadenopathy
King AD et al. Radiology 2007

DW signal in lymphoma
44 y/o, DLBCL stage IV, right cervical mass. High signal on b50,
b400, b800 EPI images. Low ADC (compared to muscle). 3 T
images
b 50 b 400 b 800 ADC

ADC measurement
To obtain ADC, at least 2 b
values: low b<50, and high b>
800 s/mm2
When b increases, the signal
decrease is complex
S=S0[(1-f).exp(-b.D)+f.exp-b(D+D*)]
Molecular Diffusion D
Perfusion parameters
F (fraction) and D*
ADC
Radiology 1988
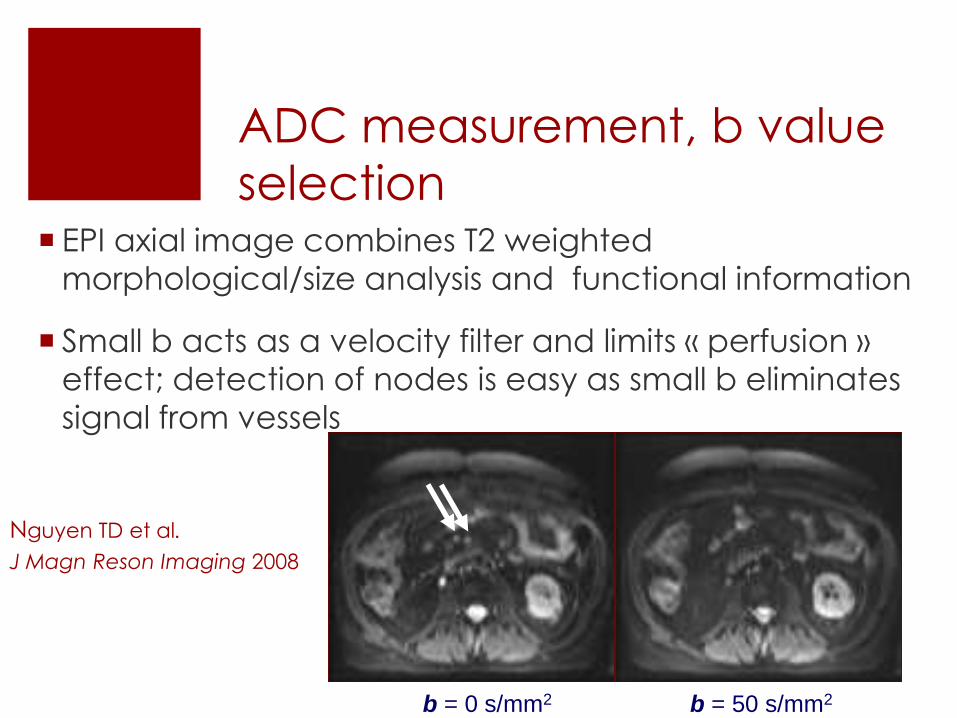
ADC measurement, b value
selection EPI axial image combines T2 weighted
morphological/size analysis and functional information
Small b acts as a velocity filter and limits « perfusion »
effect; detection of nodes is easy as small b eliminates
signal from vessels
b = 50 s/mm2b = 0 s/mm2
Nguyen TD et al.
J Magn Reson Imaging 2008
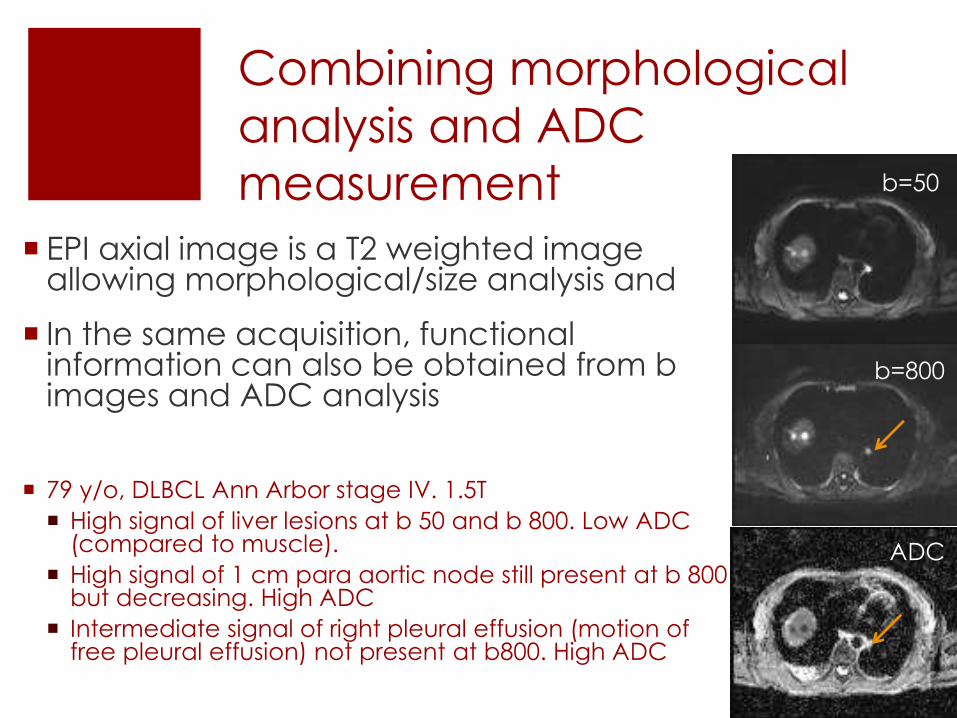
Combining morphological
analysis and ADC
measurement
EPI axial image is a T2 weighted image allowing morphological/size analysis and
In the same acquisition, functionalinformation can also be obtained from b images and ADC analysis
79 y/o, DLBCL Ann Arbor stage IV. 1.5T
High signal of liver lesions at b 50 and b 800. Low ADC (compared to muscle).
High signal of 1 cm para aortic node still present at b 800 but decreasing. High ADC
Intermediate signal of right pleural effusion (motion of free pleural effusion) not present at b800. High ADC
b=50
b=800
ADC

SNR, surface coils
Surface coils Body coil

SNR, surface coils Head Coil : 12 elements
Cervical Spine Coil : 4 elements
Thoracic-Lumbar Spine : 24 elements
Body coils (anterior) : 2x6 elements
Total = 52 elements Phased
array

SNR, 1.5 T vs 3 T
Acquisition Time : decreased
number of acquisitions at 3T
Susceptibility artifacts in clinical
situations
26 y/o. Hodgkin disease. 3T DWI
Supraclavicular 1.5 cm node; no artifactin this difficult area (interface air-tissue)
b 800
ADC

Moving table and stations 7 to 8 stacks, 11-cm thickness, 22 slices, 5 mm thickness
Only 11-cm to get each slice close to the center of the magnet

EPI sequence
Fat suppresion-water excitation or STIR
Reduced TE (50 msec) using parallelacquisition : acceleration factor of 2
Respiratory gating for accurate ADC measurements in moving regions, Lee.Y, et al. Radiology sep 2014
In our experience, acquisition time at1.5T with 4 nex : 50 to 60 mn. At 3T, 2 nex, 25 to 30 mn.
Lin C et al, Rahmouni A. Eur Radiol 2010
Lin C et al, Rahmouni A. Invest Radiol 2011
Toledano et al, Rahmouni A. Radiographics 2015
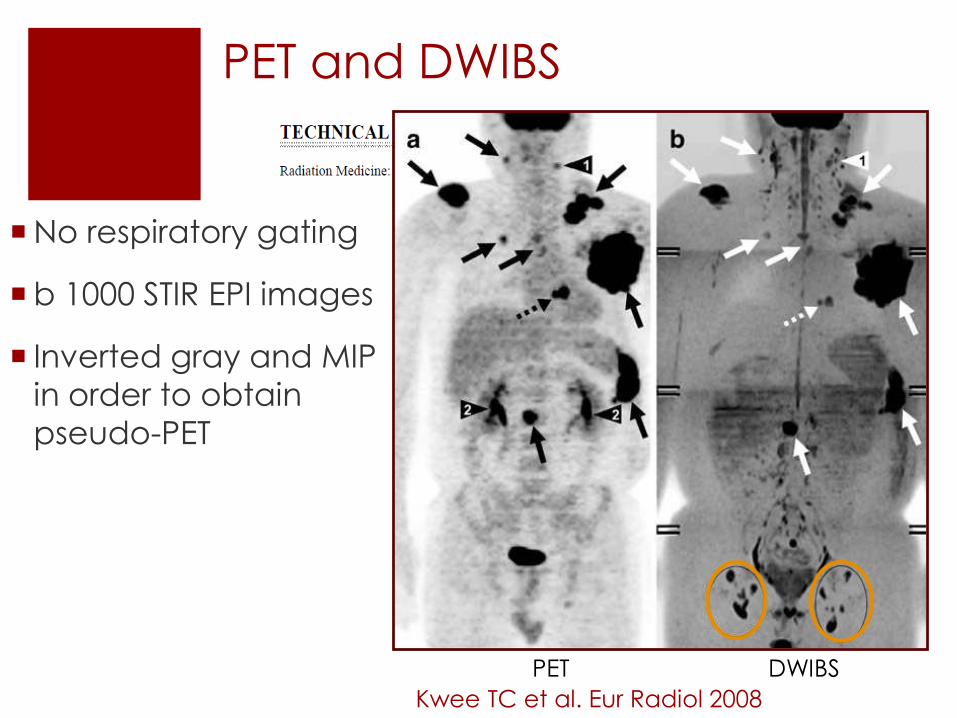
PET and DWIBS
PET DWIBS
Kwee TC et al. Eur Radiol 2008
No respiratory gating
b 1000 STIR EPI images
Inverted gray and MIP
in order to obtain
pseudo-PET

DWIBS versus ADC mapping
b 800: high signal node: restriction of diffusion ?
PET
ADC
ADC
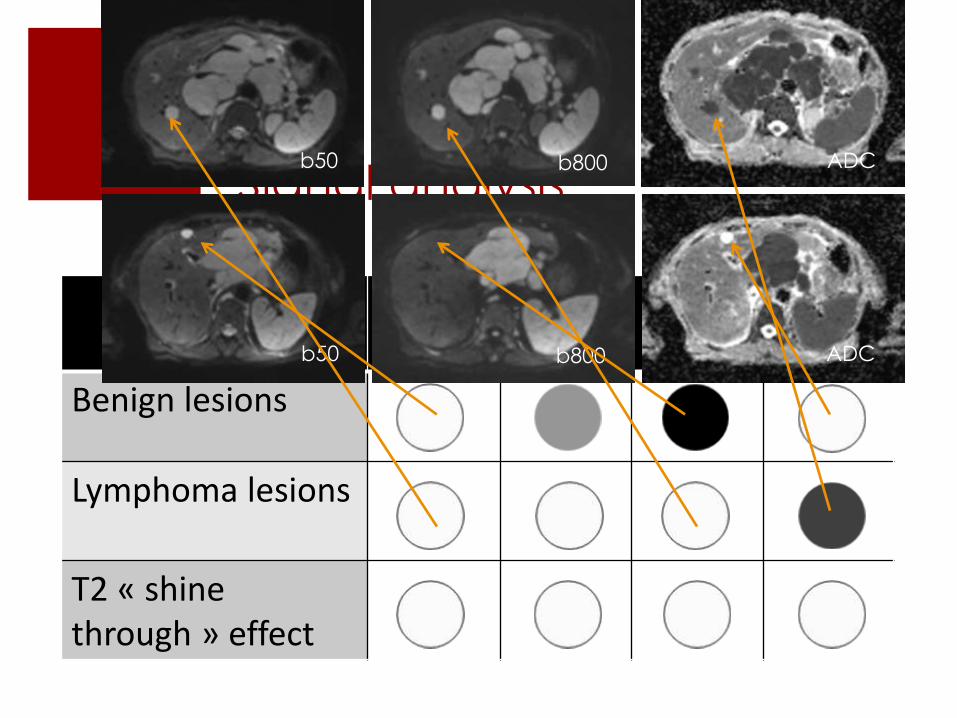
Signal analysis
b50 b400 b800 ADC
Benign lesions
Lymphoma lesions
T2 « shinethrough » effect
b50 b800 ADC
b50 b800 ADC

Staging-WB-DWI-MRI versus
PET
In our experience based on patients with DLBCL, DWI and PET/CT matched in 94% lymph noderegions.
All organs involved on PET/CT were detected on DWI; DWI detected some additional organlesions. Eur Radiol 2010
Concordance Kappa test DWI / PET variedbetween 0.7 and 0.94 among published studies
Tsuji. K, et al. JMRI 2014
Littooij. A, et al. Eur Radiol 2014
Mayerhoefer. ME, et al. Clin Cancer Res 2014
Including 140 patients. Sensitivity 100% for extra-
Nodol involvement. Sensitivity slightly less than PET/CT
For nodal involvement due to artifacts

Staging
Almost
concordant
staging:
additional
nodes of the
splenic
hilum:
indolent
lymphoma?
79 y/o, DLBCL stage IV. 1.5T

Staging
Almost
concordant
staging: stomach
involvement, low
ADC. Detection
on DWI of an
additional node
PET/CT
b50 b800
ADC
44 y/o. DLBCL. 1.5T

Staging
55 y/o female patient, DLBCL before treatment
Necrotic Axillary mass with concordant FDG-PET-CT findings
b800 ADC PET-CT

Staging
On PET/CT,
lesions might be
masked by
normal FDG
excretion,
which would
depend on the
color scale
adjustment. 1.5T
ADC
b 400
42 y/o, DLBCL
1.5T

Staging - discordances
• DWI showed
hepatic
involvement
with small focal lesions
• On PET/CT, FDG uptake of
liver was within
normal range
b50 b800
57 y/o associated DLBCL and follicular lymphoma. 1.5T

Staging - discordances
23 y/o HL, stage 2 on
PET/CT and enhanced
CT with no spleen
nodule
High signal sub-
centimetric nodules on
EPI. 3T
DW-MRI after treatment
was normal: specific HL
nodules?
b 50

Response to treatment
experimental data

Huang MQ et al. NMR Biomed 2008
treated
treated

Huang MQ et al. NMR Biomed 2008
H & E/mitosis Ki-67/proliferation index FITC/apoptosis index
treated
control
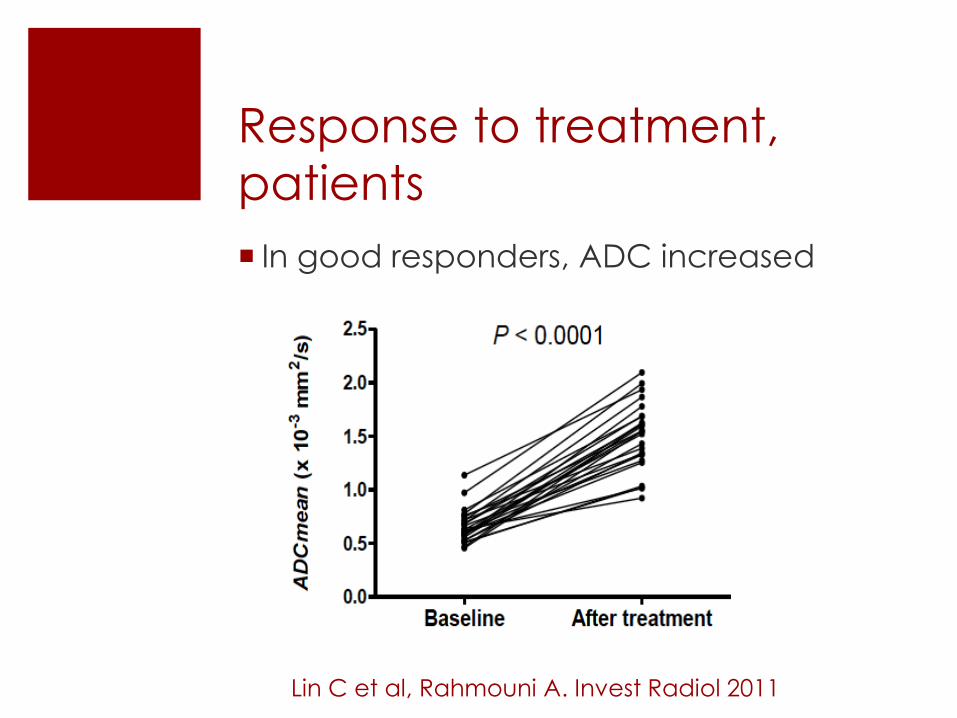
Response to treatment,
patients
In good responders, ADC increased
Lin C et al, Rahmouni A. Invest Radiol 2011

Response to treatment

Response to treatment
Good responder
b50 b800 ADC PET-CT
b50 b800 ADC PET-CT
29 y/o HL. Mediastinal mass at baseline. Low ADC; SUV9. Residual mass after 2
cycles of chemotherapy. High ADC; no FDG uptake. According to 1999
Cheson size criteria, the patient is in partial response (PR), but in complete
response (CR) according to Cheson 2014 criteria and ADC. 3T.
Baseline
2 cycles

Response to treatment
Partial response
b50
b50
ADC
ADC
PET/CT
PET/CT
51 y/o patient, DLBCL. Mediastinal mass at baseline. Low ADC; SUV16. After
two cycles of chemotherapy, the anterior mediastinal mass is heterogeneous,
with main regions showing restricted diffusion. Persistent low ADC and SUV 6.
According to Cheson size criteria, the patient is in partial response (PR) as well
as on PET/CT (Cheson 2014) and ADC.
Baseline
2 cycles

51 y/o patient, Hodgkin L on axillary biopsy
Single and low bone marrow uptake of left ilium Stage IV
SUV=10,8
SUV=3,4
Response to treatment
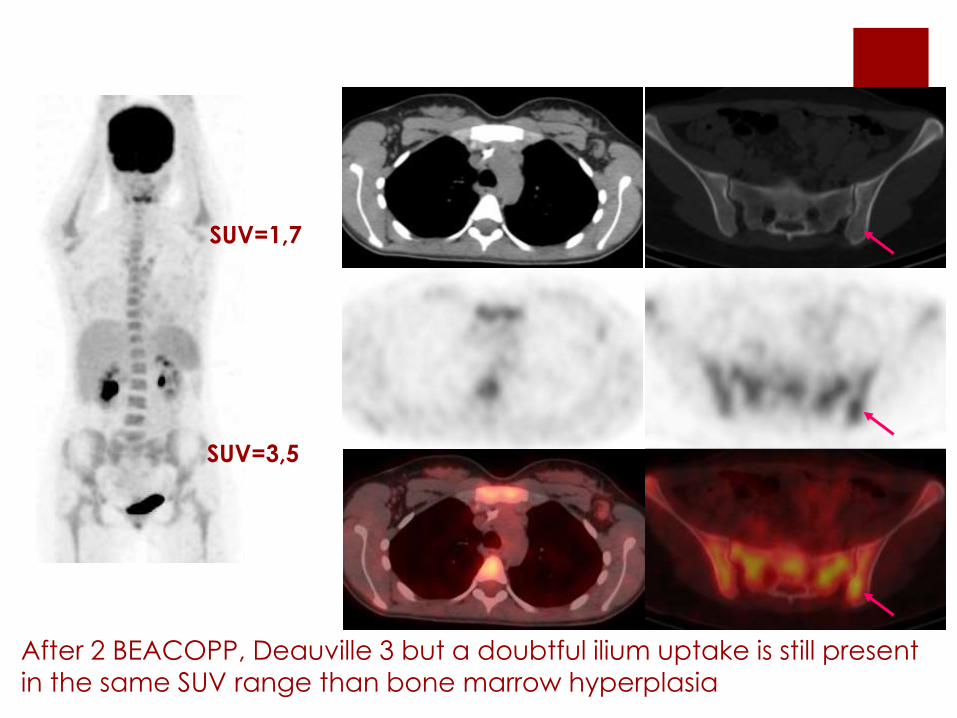
After 2 BEACOPP, Deauville 3 but a doubtful ilium uptake is still present
in the same SUV range than bone marrow hyperplasia
SUV=1,7
SUV=3,5

T1
T2
b50
b400
b800
MR before and after 2 cycles treatment was unchanged
• Signal does not change from b 50 to b 800
• ADC is restricted compared to muscle at 0.6
ADC
Biopsy under CT using MR/CT image
fusion Presence of one Reed Sternberg cell
→ BEACOPP

Response to treatment -
discordances
b50
b50
b50
b800
b800
b800
ADC
ADC
ADC PET/CT
PET/CT
PET/CT
1. Baseline - Mediastinal lymph nodes with low ADC and FDG uptake on PET/CT
2. At interim - increase in ADC signal of all the lymph nodes, with no significant restriction of diffusion, whereas PET/CT shows persistent abnormal FDG uptake. The patient
underwent a mediastinoscopy which showed inflammatory lymph nodes with no tumor.
3. After treatment completion - No restricted diffusion and no abnormal FDG uptake on PET/CT
34 y/o HL stage 2 . 3T

Response to treatment -
discordances
25 y/o HL. 3T
End of
treatment, 6 cycles BEACOPP
Residual
mediastinal
enlarged node
No FDG uptake
High ADC
CT follow-up
PET Post-contrast-CT ADC
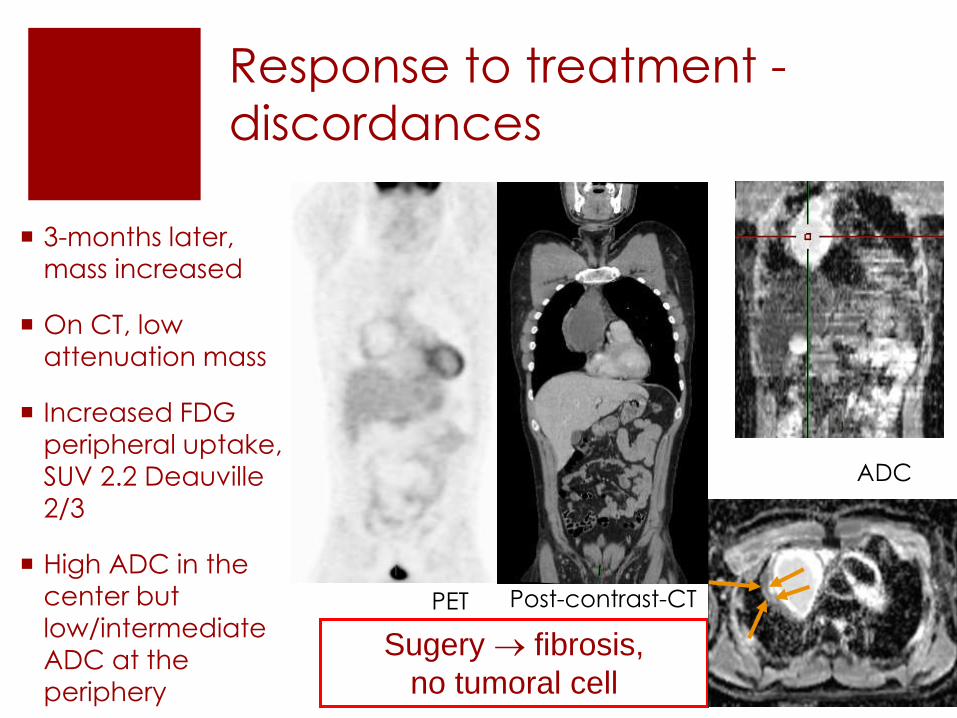
Response to treatment -
discordances
3-months later,
mass increased
On CT, low
attenuation mass
Increased FDG
peripheral uptake,
SUV 2.2 Deauville
2/3
High ADC in the center but
low/intermediate
ADC at the
periphery
Sugery fibrosis,
no tumoral cell
PET Post-contrast-CT
ADC

Artifacts and pitfalls –
patient related
Metal artifact
Pulmonary embolism mimicking lung nodules
55 y/o, DLBCL. Right colic mass appearing in different positions on
MRI and PET/CT, due to bowel movement
b50
b50
ADC
ADC
b800
b800
b50
b50 b800 ADC
b50 b800 ADC PET/CT

Pitfalls 28 y/o DLBCL stage
IV
At the end of the
treatment,
complete remission
Deauville 2; no
significant FDG
uptake
On CT follow-up,
after 3 months,
increased focal
mediastinal mass:
relapse?
PET at
staging
SUV11
4 cycles
SUV 1.8
End of
treatment
SUV1.7
Follow-up at
3 months
SUV 3.5

Pitfalls
ADC is high
Comparison of T1-w in
phase and T1-w out of
phase images
demonstrates the
presence of fat:
Thymic rebound
b800
b400
b50
ADC
T1IP
T1OP

Pitfalls, calcium
49 y/o. DLBCL, stage IV in
CR after treatment.
Low signal of the mesenteric
mass due to calcifications
b50
b800
b400
ADCBaseline, SUV 21 End of treatment, SUV 2
Conclusion 1
WB DWI MR imaging is a good technique for lesion detection comparable to PET-CT at staging
Potential interesting technique for responseassessement but small series
Limitations due to patient: motion-calcifiedmasses
Limitations due to technical problems: homogeneity of B0 and B1 especially for air-tissue interfaces: nodes-lung nodules

What’s new? iron
Some authors have described low signal of
lymphoma lesions on DWI in some patients
before treatment
Our preliminary results of complementary T2* GRE
sequences showed that MR was able to detect
Iron deposits in some lymphoma lesions (no
calcium on CT); See Cottereau AS poster
Dumont AE, Ford RJ, Becker FF: Siderosis of lymph
nodes patients with Hodgkin's disease. Cancer 1976

What’s new?
Baseline
2 Cycles and End treatment
Baseline
2 Cycles and End treatment

What’s new? Iron
Relationship:
To HL ++ and DLBCL+
To FDG uptake (all cases)
To inflammatory syndrom
On the prediction of HL treatment response. EJ
de Andreas-Galiana et al. Clin Transl Oncol 2015. No imaging studies; « Serum ferritin turned to be the
most discrimatory variable in predicting treatment
response »

What’s new? Simultaneous
PET-MR

PET/MR vs PET/CT
Afaq A et al. Clin Nucl Med 2016: comparison of
PET/MR and PET/CT in 66 patients with HL and
NHL presenting 95 nodal and 8 extranodal
lesions.
Additional 3 nodal and 1 extra nodal sites on
PET/MRI
Negative correlation of ADC and SUVmax ?
Ponisio MR et al. Pediatr Radiol 2016: 9 PET/MRI in
8 children undergoing PET/CT. « PET/MRI
performance is comparable to PET/CT for lesion
detection and SUV measurements »

Conclusion on WB-DWI MRI
Morphological and functional information at a
Whole body scale allowing for lesion detection
and response assessment
Can be Fast (<30mn), Routine, and Reliable
but limitations exist : respiratory artifacts,
calcium overload, magnetic susceptibility
artifacts…
Although WB-DWI seems appropriate for
lymphoma, its role is not defined: studies with
larger cohort required

Dr Chieh LIN, Taipei, Taiwan
Pr Alain LUCIANI, Dr MULE Sébastien, Dr Frederic PIGNEUR, Dr Sarah TOLEDANO,
Medical Imaging Department
Pierre ZERBIB, Chief MRI Technologist
Dr COTTEREAU Anne-Ségolène, Pr Emmanull ITTI, Pr Michel MEIGNAN, Nuclear
Medicine
Pr Corinne HAIOUN, MD, PhD, Dr Karim BELHADJ, Hematology
Alexandre VIGNAUD, PhD, CEA, Neurospin, Saclay, France
Un grand merci

Question 1
In order to optimize SNR and spatial resolution in
SS-EPI sequence, in whole body DWI MRI, the TE
must be:
a. The shortest possible
b. The longest possible
c. The same as the TR
d. The SNR and spatial resolution do not depend
on the TE in the SS-EPI sequence

Question 2
The effect of magnetic field inhomogeneities can be attenuated by
a. Parallel imaging
b. Correct positioning of the patient at the
center of the magnetic bore
c. Shortening the TE
d. Adding additional b-values

Question 3
In the case of good response to chemotherapy,
the changes in cellularity of the lymphoma
lesions on WB-DWI MRI is generally associated
with
a. A systematic significant decrease in the size
of all the lesions
b. An increase in the ADC value of the lesions
c. A decrease in the ADC value of the lesion
d. An increase in signal intensity on high b-value
DW images
e. A mediastinal cyst
