nada: 2013 dealers’ outlook/media/others/events/2013/automotive... · nada: 2013 dealers’...
TRANSCRIPT

NADA: 2013 Dealers’ Outlook
20th Annual Automotive Outlook Symposium Federal Reserve Bank of Chicago-Detroit Branch May 31, 2013
Jonathan Banks Executive Automotive Analyst NADA Used Car Guide
Angela Lisulo Economist NADA Industry Analysis Division
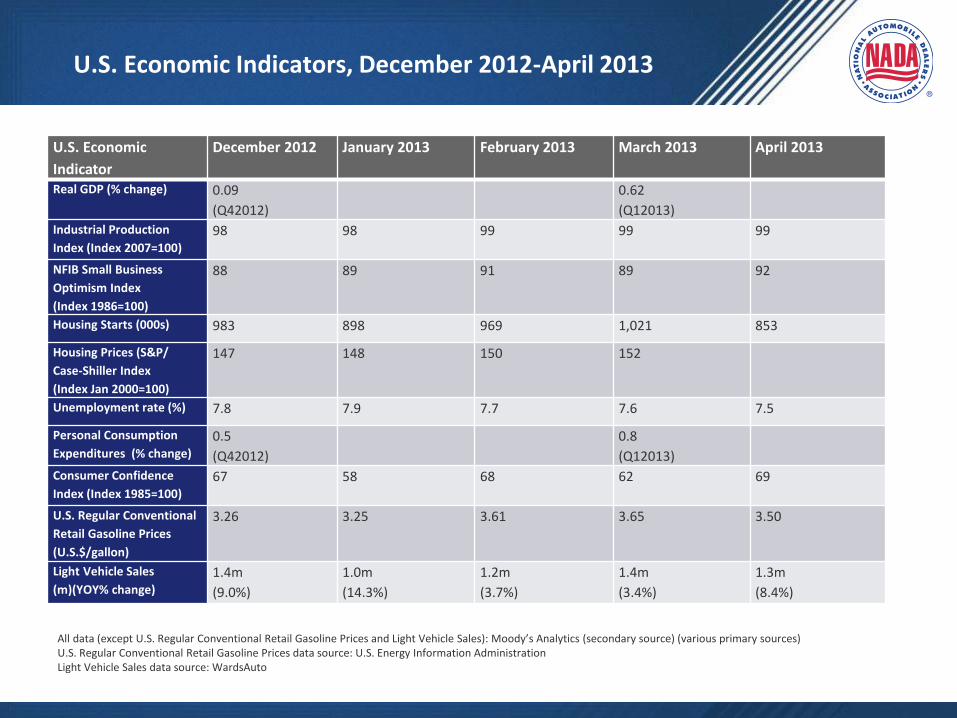
U.S. Economic Indicators, December 2012-April 2013
U.S. Economic
Indicator
December 2012 January 2013 February 2013 March 2013 April 2013
Real GDP (% change) 0.09
(Q42012)
0.62
(Q12013)
Industrial Production
Index (Index 2007=100)
98 98 99 99 99
NFIB Small Business
Optimism Index
(Index 1986=100)
88 89 91 89 92
Housing Starts (000s) 983 898 969 1,021 853
Housing Prices (S&P/
Case-Shiller Index
(Index Jan 2000=100)
147 148 150 152
Unemployment rate (%) 7.8 7.9 7.7 7.6 7.5
Personal Consumption
Expenditures (% change)
0.5
(Q42012)
0.8
(Q12013)
Consumer Confidence
Index (Index 1985=100)
67 58 68 62 69
U.S. Regular Conventional
Retail Gasoline Prices
(U.S.$/gallon)
3.26 3.25 3.61 3.65 3.50
Light Vehicle Sales
(m)(YOY% change)
1.4m
(9.0%)
1.0m
(14.3%)
1.2m
(3.7%)
1.4m
(3.4%)
1.3m
(8.4%)
All data (except U.S. Regular Conventional Retail Gasoline Prices and Light Vehicle Sales): Moody’s Analytics (secondary source) (various primary sources) U.S. Regular Conventional Retail Gasoline Prices data source: U.S. Energy Information Administration Light Vehicle Sales data source: WardsAuto
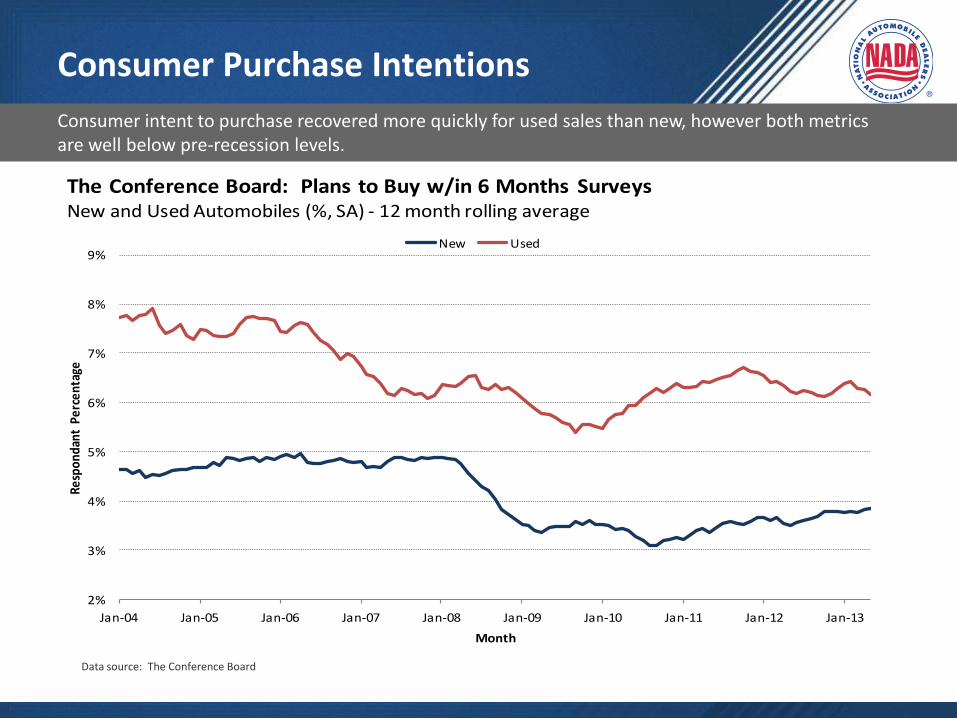
Consumer Purchase Intentions
2%
3%
4%
5%
6%
7%
8%
9%
Jan-04 Jan-05 Jan-06 Jan-07 Jan-08 Jan-09 Jan-10 Jan-11 Jan-12 Jan-13
Resp
onda
nt P
erce
ntag
e
Month
The Conference Board: Plans to Buy w/in 6 Months SurveysNew and Used Automobiles (%, SA) - 12 month rolling average
New Used
Source: The Conference Board
Consumer intent to purchase recovered more quickly for used sales than new, however both metrics are well below pre-recession levels.
Data source: The Conference Board
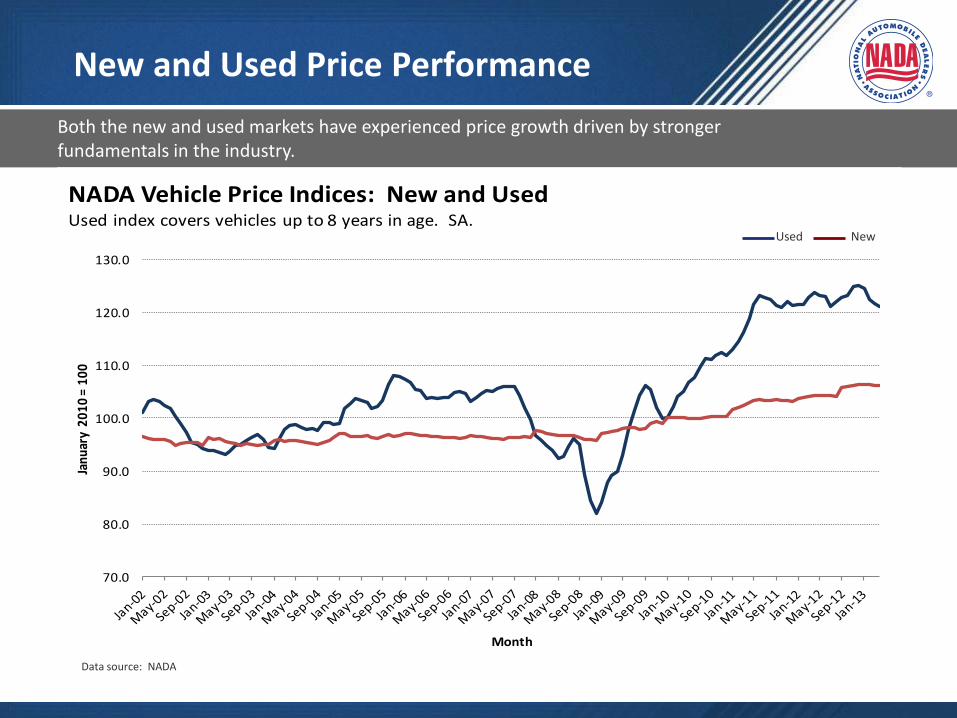
New and Used Price Performance
Both the new and used markets have experienced price growth driven by stronger fundamentals in the industry.
70.0
80.0
90.0
100.0
110.0
120.0
130.0
Janu
ary
2010
= 1
00
Month
NADA Vehicle Price Indices: New and UsedUsed index covers vehicles up to 8 years in age. SA.
Source: NADA
Used New
Data source: NADA
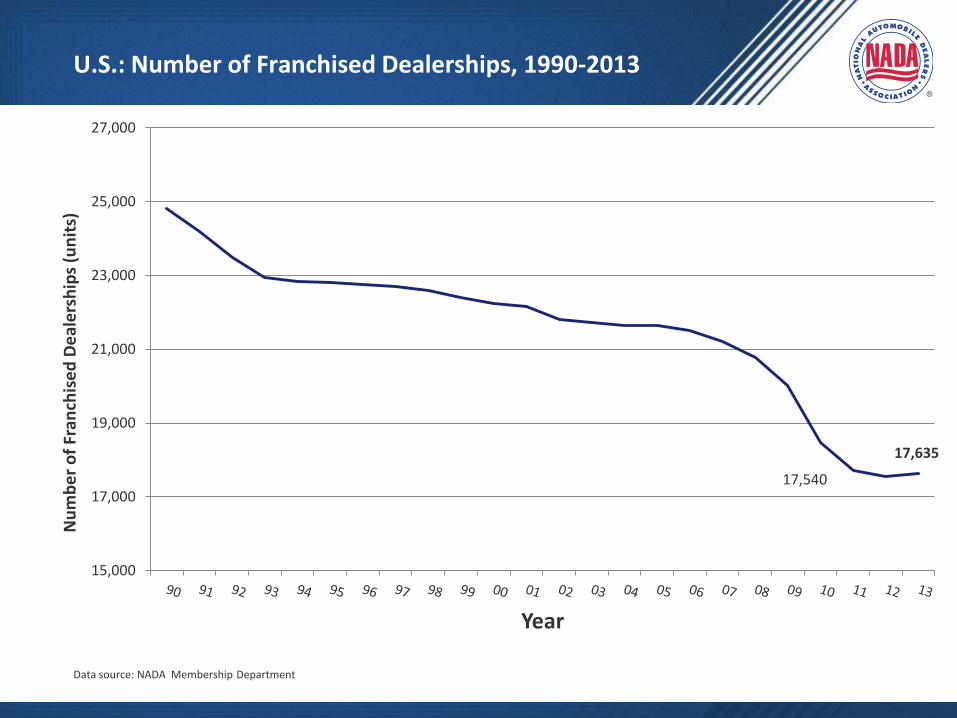
U.S.: Number of Franchised Dealerships, 1990-2013
Data source: NADA Membership Department
17,540
17,635
15,000
17,000
19,000
21,000
23,000
25,000
27,000
Nu
mb
er
of
Fran
chis
ed
De
ale
rsh
ips
(un
its)
Year
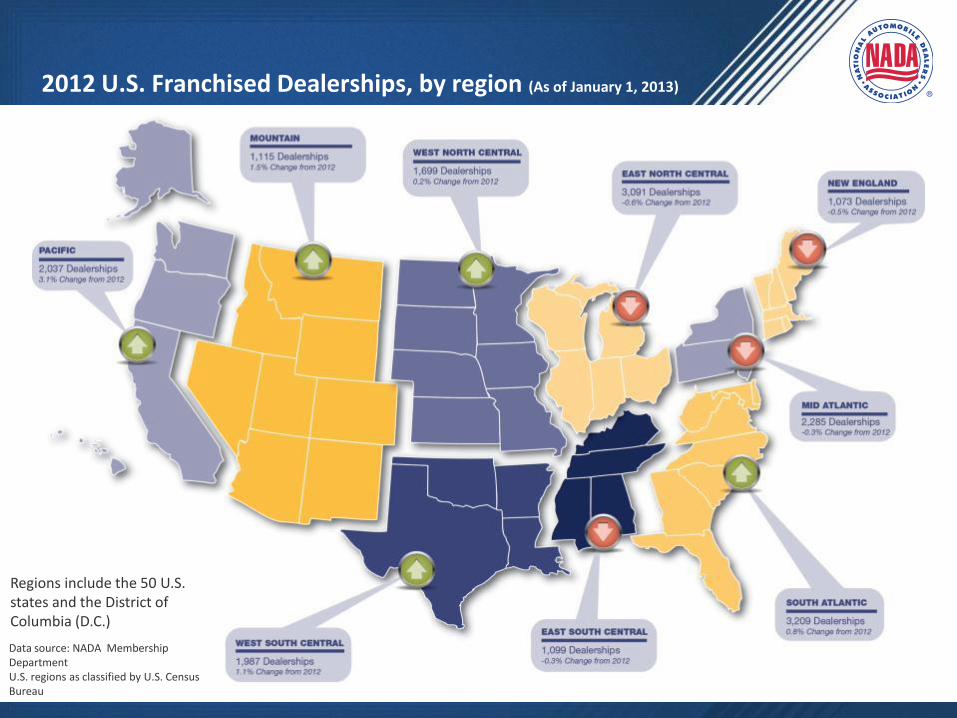
Regions include the 50 U.S. states and the District of Columbia (D.C.)
Data source: NADA Membership Department U.S. regions as classified by U.S. Census Bureau
2012 U.S. Franchised Dealerships, by region (As of January 1, 2013)
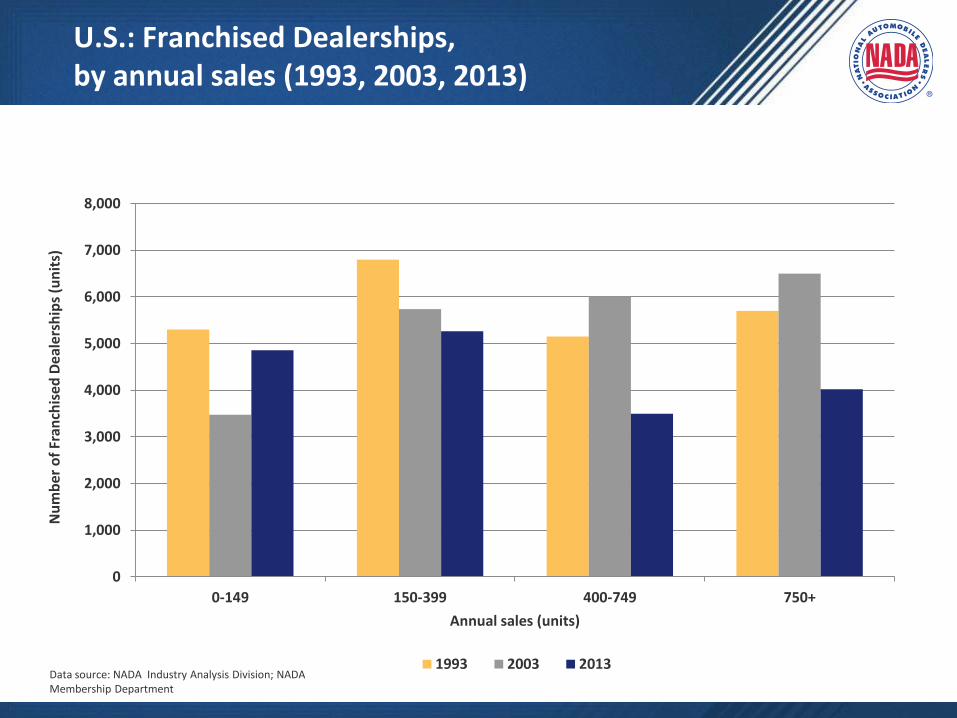
U.S.: Franchised Dealerships, by annual sales (1993, 2003, 2013)
0
1,000
2,000
3,000
4,000
5,000
6,000
7,000
8,000
0-149 150-399 400-749 750+
Nu
mb
er o
f Fr
anch
ise
d D
eal
ersh
ips
(un
its)
Annual sales (units)
1993 2003 2013Data source: NADA Industry Analysis Division; NADA Membership Department
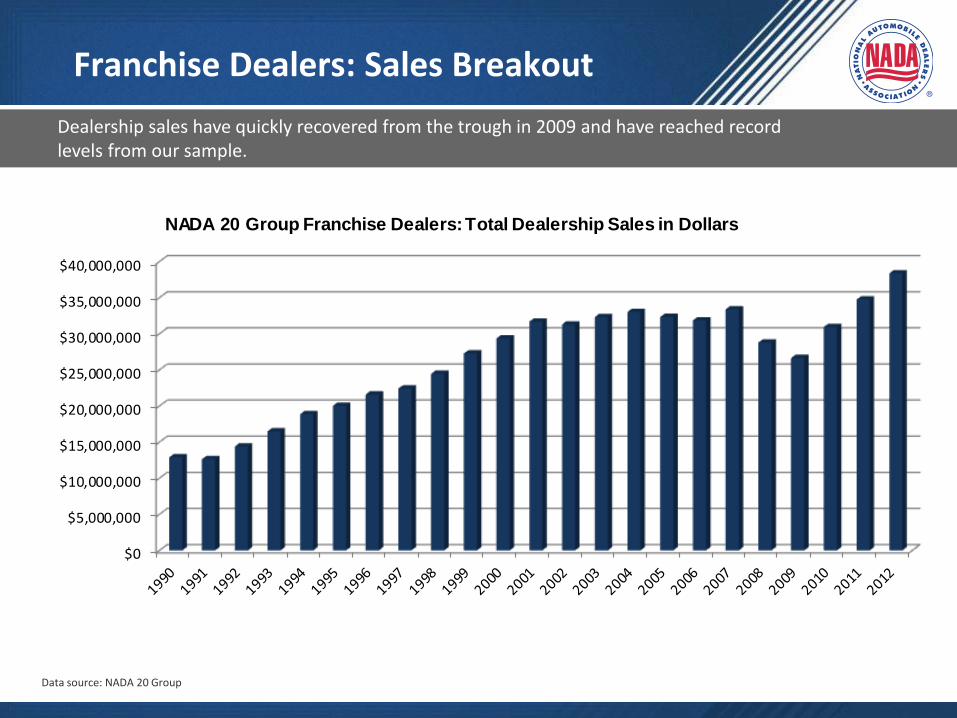
Franchise Dealers: Sales Breakout
Dealership sales have quickly recovered from the trough in 2009 and have reached record levels from our sample.
Data source: NADA 20 Group
$0
$5,000,000
$10,000,000
$15,000,000
$20,000,000
$25,000,000
$30,000,000
$35,000,000
$40,000,000
NADA 20 Group Franchise Dealers: Total Dealership Sales in Dollars
20.0%
25.0%
30.0%
35.0%
40.0%
45.0%
50.0%
55.0%
60.0%
65.0%
New Vehicle Sales
Used Vehicle Sales
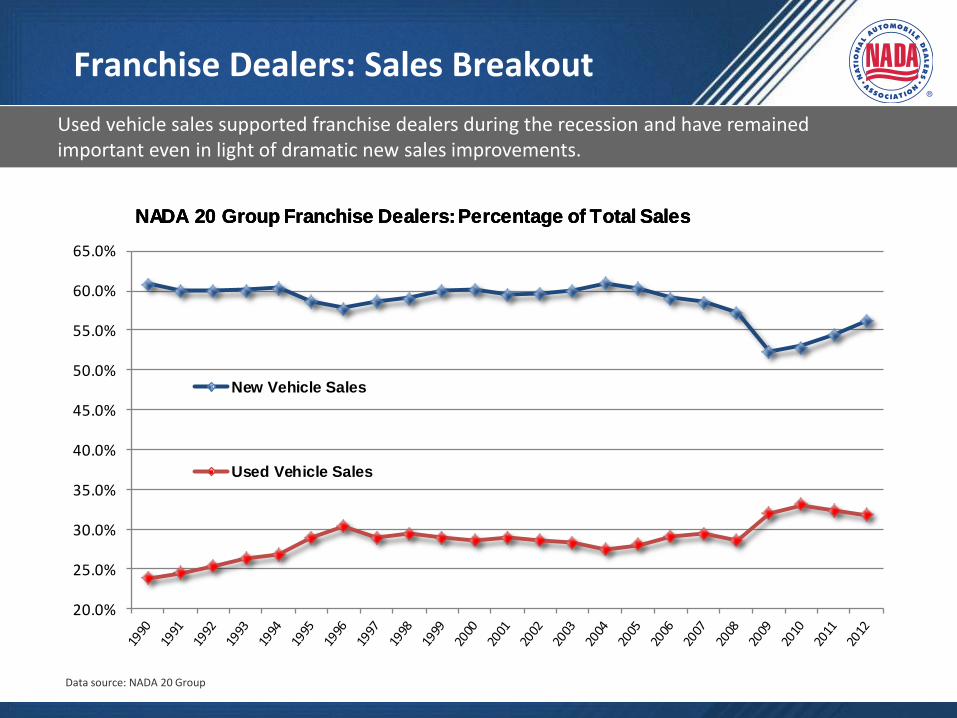
NADA 20 Group Franchise Dealers: Percentage of Total SalesNADA 20 Group Franchise Dealers: Percentage of Total SalesNADA 20 Group Franchise Dealers: Percentage of Total Sales
Franchise Dealers: Sales Breakout
Used vehicle sales supported franchise dealers during the recession and have remained important even in light of dramatic new sales improvements.
Data source: NADA 20 Group
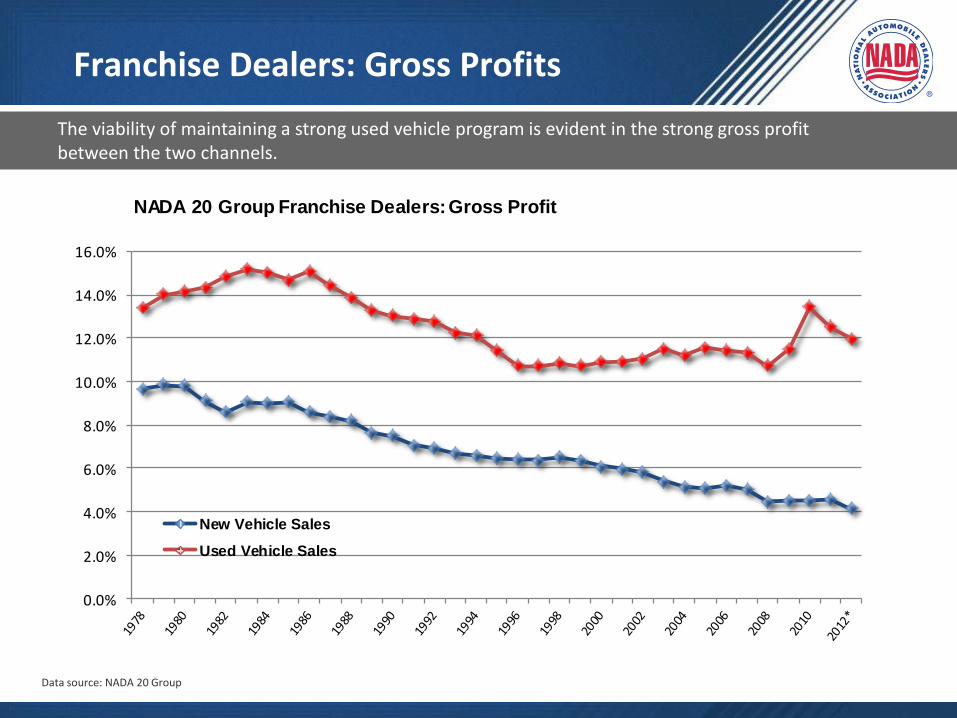
Franchise Dealers: Gross Profits
The viability of maintaining a strong used vehicle program is evident in the strong gross profit between the two channels.
0.0%
2.0%
4.0%
6.0%
8.0%
10.0%
12.0%
14.0%
16.0%
New Vehicle Sales
Used Vehicle Sales
NADA 20 Group Franchise Dealers: Gross Profit
Data source: NADA 20 Group
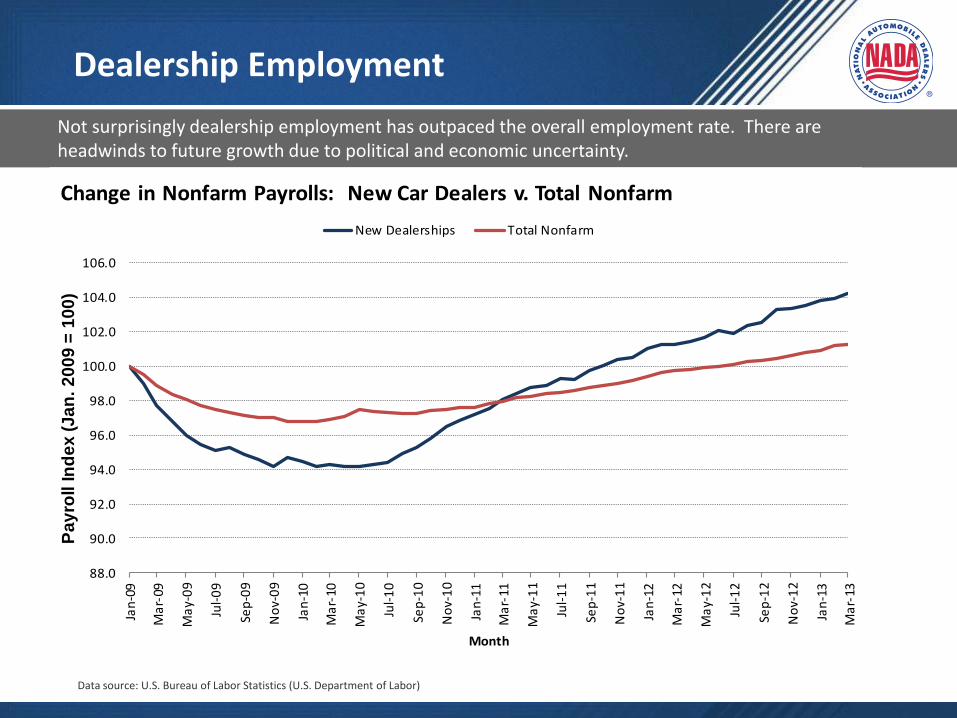
Dealership Employment
Not surprisingly dealership employment has outpaced the overall employment rate. There are headwinds to future growth due to political and economic uncertainty.
88.0
90.0
92.0
94.0
96.0
98.0
100.0
102.0
104.0
106.0
Jan
-09
Ma
r-09
Ma
y-0
9
Jul-
09
Sep
-09
No
v-0
9
Jan
-10
Ma
r-10
Ma
y-1
0
Jul-
10
Sep
-10
No
v-1
0
Jan
-11
Ma
r-11
Ma
y-1
1
Jul-
11
Sep
-11
No
v-1
1
Jan
-12
Ma
r-12
Ma
y-1
2
Jul-
12
Sep
-12
No
v-1
2
Jan
-13
Ma
r-13
Pa
yro
ll I
nd
ex
(J
an
. 2
00
9 =
10
0)
Month
Change in Nonfarm Payrolls: New Car Dealers v. Total Nonfarm
New Dealerships Total Nonfarm
Source: BLSData source: U.S. Bureau of Labor Statistics (U.S. Department of Labor)
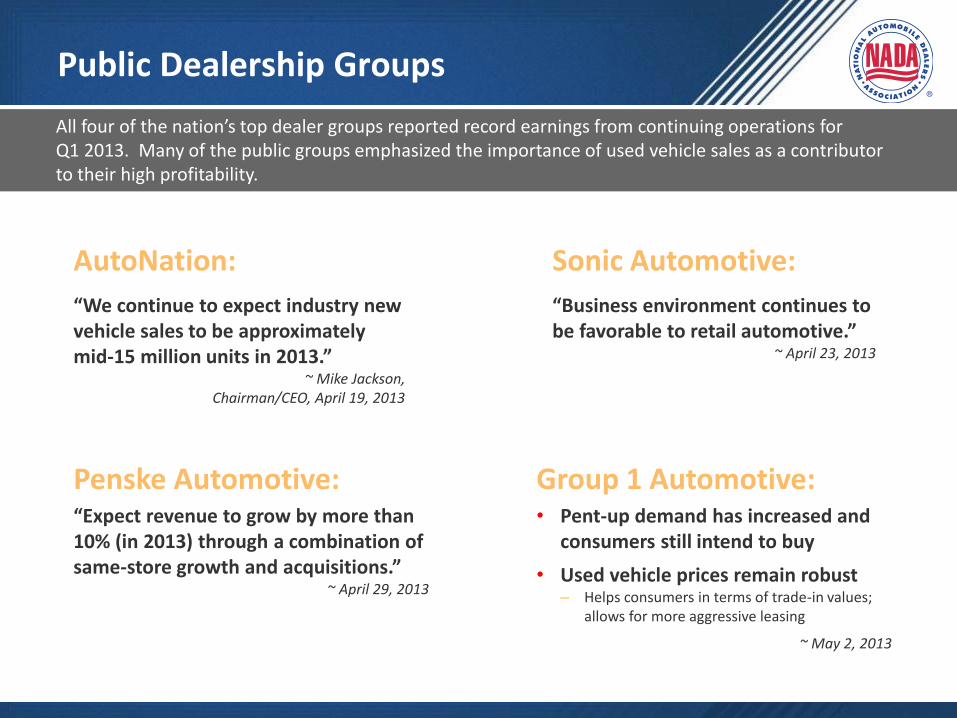
Public Dealership Groups
“We continue to expect industry new vehicle sales to be approximately mid-15 million units in 2013.”
~ Mike Jackson, Chairman/CEO, April 19, 2013
“Business environment continues to be favorable to retail automotive.”
~ April 23, 2013
“Expect revenue to grow by more than 10% (in 2013) through a combination of same-store growth and acquisitions.”
~ April 29, 2013
All four of the nation’s top dealer groups reported record earnings from continuing operations for Q1 2013. Many of the public groups emphasized the importance of used vehicle sales as a contributor to their high profitability.
• Pent-up demand has increased and consumers still intend to buy
• Used vehicle prices remain robust – Helps consumers in terms of trade-in values;
allows for more aggressive leasing
~ May 2, 2013
AutoNation:
Penske Automotive:
Sonic Automotive:
Group 1 Automotive:
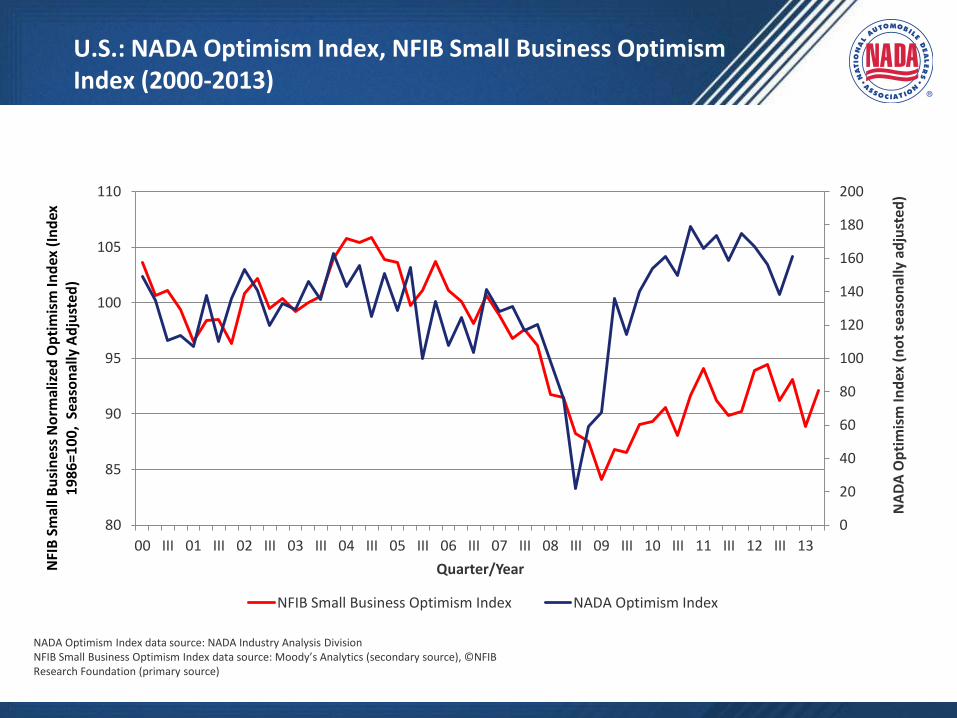
U.S.: NADA Optimism Index, NFIB Small Business Optimism Index (2000-2013)
NADA Optimism Index data source: NADA Industry Analysis Division NFIB Small Business Optimism Index data source: Moody’s Analytics (secondary source), ©NFIB Research Foundation (primary source)
0
20
40
60
80
100
120
140
160
180
200
80
85
90
95
100
105
110
00 III 01 III 02 III 03 III 04 III 05 III 06 III 07 III 08 III 09 III 10 III 11 III 12 III 13
NA
DA
Op
tim
ism
Ind
ex (
no
t se
aso
nal
ly a
dju
sted
)
NFI
B S
mal
l Bu
sin
ess
No
rmal
ized
Op
tim
ism
Ind
ex (
Ind
ex
19
86
=10
0,
Seas
on
ally
Ad
just
ed)
Quarter/Year
NFIB Small Business Optimism Index NADA Optimism Index
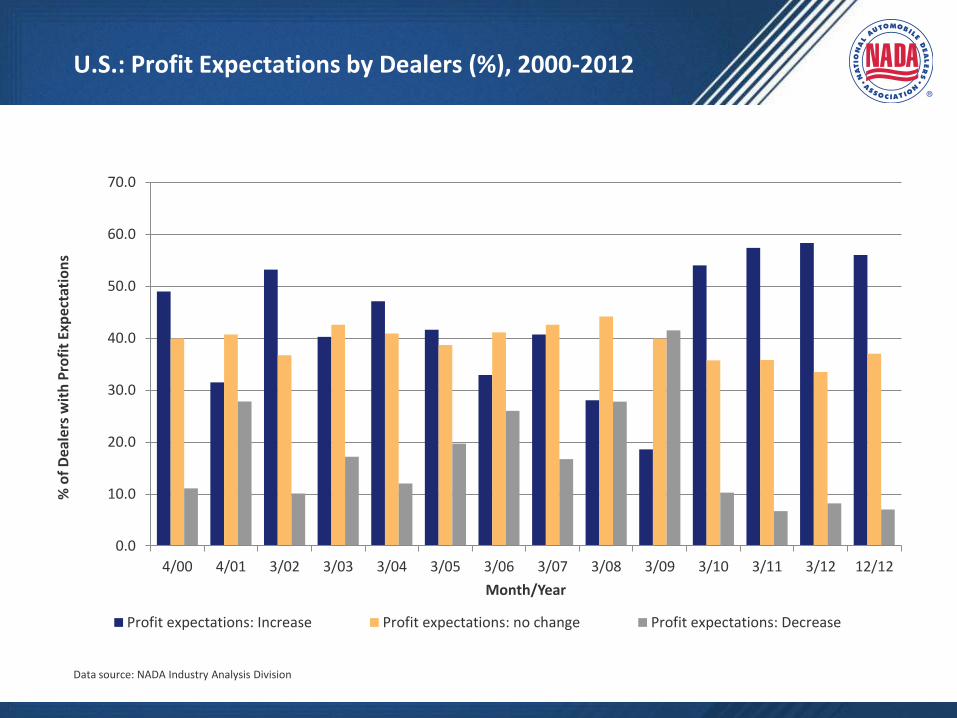
U.S.: Profit Expectations by Dealers (%), 2000-2012
0.0
10.0
20.0
30.0
40.0
50.0
60.0
70.0
4/00 4/01 3/02 3/03 3/04 3/05 3/06 3/07 3/08 3/09 3/10 3/11 3/12 12/12
% o
f D
eale
rs w
ith
Pro
fit
Exp
ecta
tio
ns
Month/Year
Profit expectations: Increase Profit expectations: no change Profit expectations: Decrease
Data source: NADA Industry Analysis Division