nasa tech n ical nasa tm x- 68025 memorandum · nasa tech n ical memorandum nasa tm x- 68025 cm x...
TRANSCRIPT
NASA TECH N ICALM E M O R A N D U M
NASA TM X- 68025
CM
X
INVESTIGATION OF AN ELECTRONIC IMAGE
ENHANCER FOR RADIOGRAPHS
by Alex VaryLewis Research CenterCleveland, Ohio
TECHNICAL PAPER proposed for presentation atSpring Conference of the American Societyfor Nondestructive TestingLos Angeles, California, March 13-16, 1972
https://ntrs.nasa.gov/search.jsp?R=19720010803 2018-05-27T09:35:20+00:00Z

INVESTIGATION OF AW ELECTRONIC IMAGE ENHANCER FOR RADIOGRAPHS
By Alex Vary
Lewis Research CenterCleveland^ Ohio
ABSTRACT
Radiographs of nuclear and aerospace components were studied with a closed-• circuit television system to determine the advantages of electronic enhancement
in radiographic nondestructive evaluation. The radiographic images were examinedon a television monitor under various degrees of magnification and enhancement.The enhancement was accomplished by generating a video signal whose amplitude isproportional to the rate of change of density. Points, lines, edges, and otherdensity variations that are faintly registered in the original image are renderedin sharp relief. Examples of the applications of this mode of enhancement arediscussed together with the system's dynamic response and resolution.
H INTRODUCTIONtoco¥ The interpretation of radiographs is often difficult because even thoughw essential details are faithfully recorded they are difficult to see because of
a lack of contrast or because of excessive density. In addition, the interpretermay fail to notice or detect small grey-scale density differences. The usualmethods of direct or optically-aided viewing require a high degree of eye-accomodationeven with high-level backlighting. For these reasons, there is a growing effort toincrease the amount of information retrievable from radiographs by means of imageenhancement techniques (refs. 1 through h). These efforts are required to makeradiography a more viable and objective tool in the field of nondestructive evaluation.
Various methods of electronic image enhancement are being considered, amongother techniques, for the purpose of increasing the flaw-detection capabilities ofradiography. A number of enhancement techniques appear to be competitive, and thereis a need to assess the relative merits and limitations of each. Therefore, thepurpose of this paper is to describe results obtained at the NASA-Lewis ResearchCenter with a video system that enhances radiographs by strongly accenting densitydifferences. Applications of this mode of enhancement were evaluated for the pur-pose of indicating its value for radiographic flaw-detection and interpretation.
This report consists of two major sections. The first section describes theapparatus, theory of operation, and the inherent resolution and density responseof the system. Salient features of the enhancement process are described andillustrated. The second describes results that were selected to illustrate potentialapplications of the system. Actual examples of the resolution and density responsecapability of the system are given. The major portion of the discussion is concernedwith illustrative examples of the uses of the enhancement process for flaw-detection,clarification of image details, and video-metrology. Lastly, some limitations ofthe system are mentioned in the discussion section.
APPAEATUS AND THEORY OF OPERATION
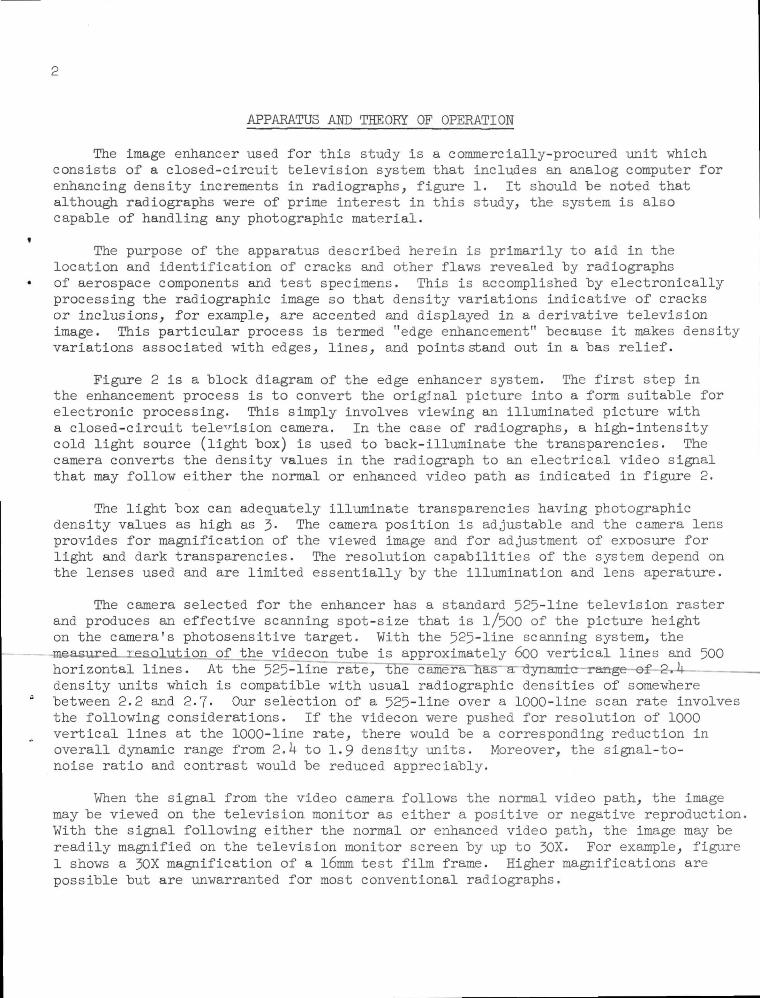
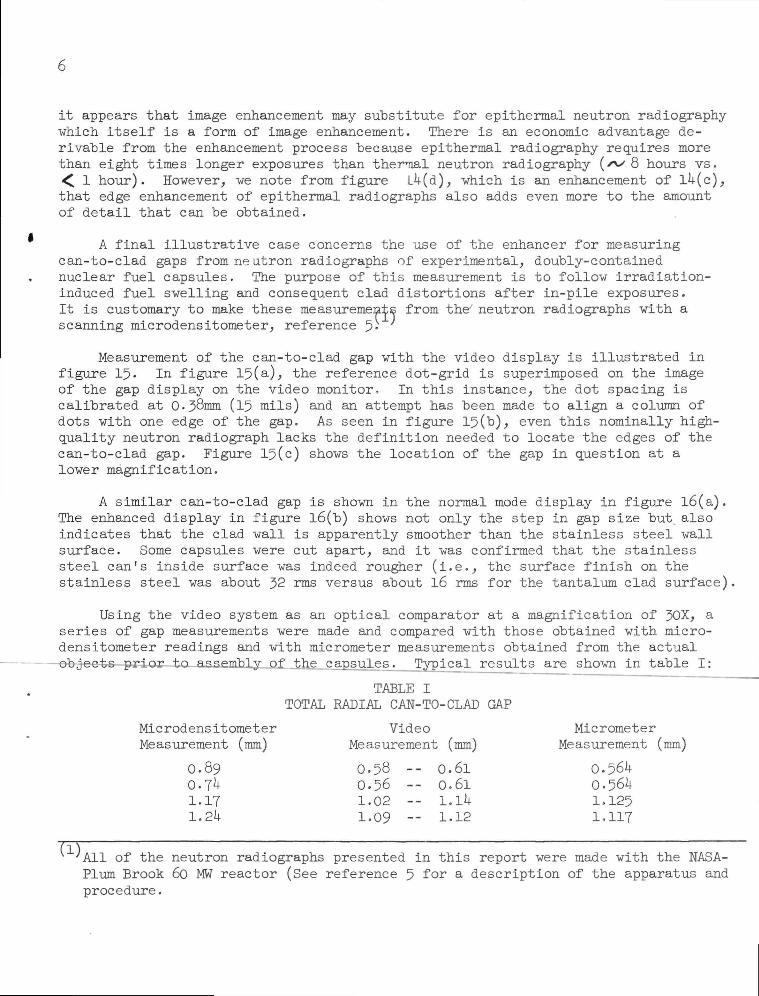
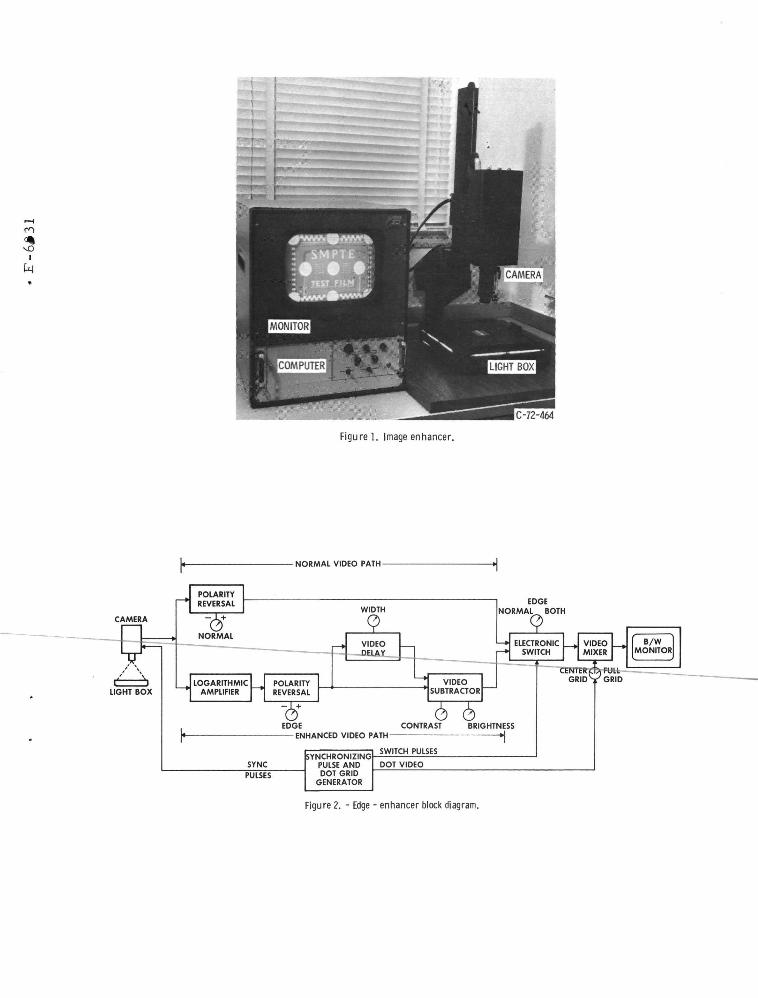
The image enhancer used for this study is a commercially-procured unit vhichconsists of a closed-circuit television system that includes an analog computer forenhancing density increments in radiographs, figure 1. It should be noted thatalthough radiographs were of prime interest in this study, the system is alsocapable of handling any photographic material.
The purpose of the apparatus described herein is primarily to aid in thelocation and identification of cracks and other flaws revealed by radiographsof aerospace components and test specimens. This is accomplished by electronicallyprocessing the radiographic image so that density variations indicative of cracksor inclusions, for example, are accented and displayed in a derivative televisionimage. This particular process is termed "edge enhancement" because it makes densityvariations associated with edges, lines, and points stand out in a bas relief.
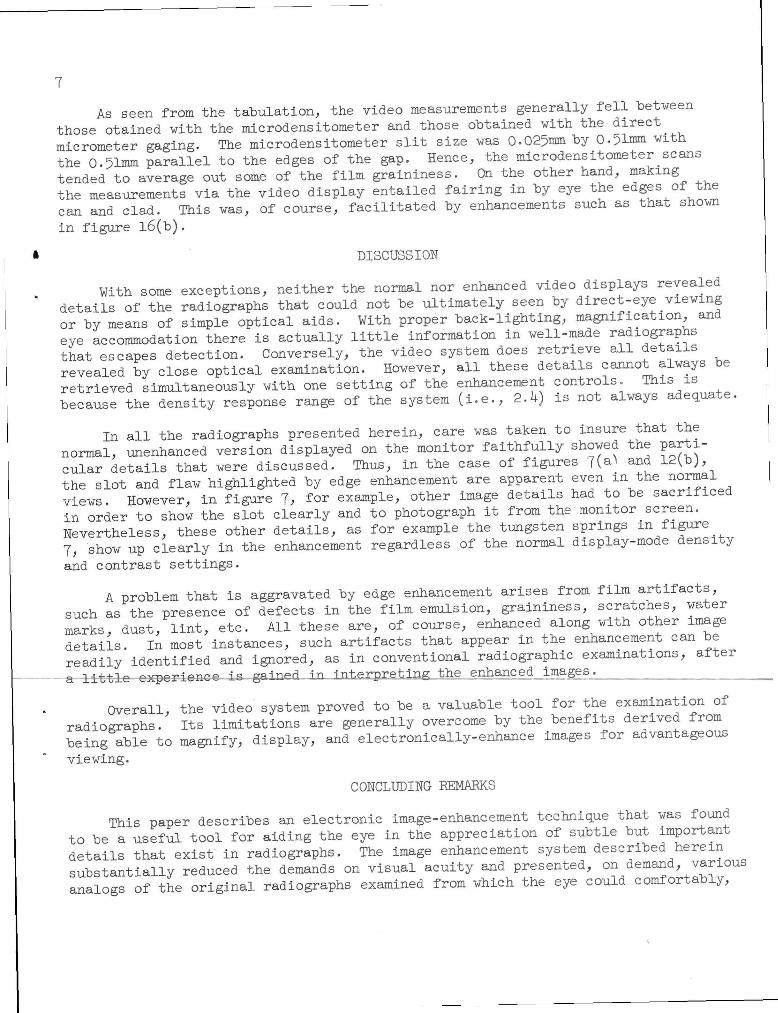
Figure 2 is a block diagram of the edge enhancer system. The first step inthe enhancement process is to convert the original picture into a form suitable forelectronic processing. This simply involves viewing an illuminated picture witha closed-circuit television camera. In the case of radiographs, a high-intensitycold light source (light box) is used to back-illuminate the transparencies. Thecamera converts the density values in the radiograph to an electrical video signalthat may follow either the normal or enhanced video path as indicated in figure 2.
The light box can adequately illuminate transparencies having photographicdensity values as high as 3. The camera position is adjustable and the camera lensprovides for magnification of the viewed image and for adjustment of exposure forlight and dark transparencies. The resolution capabilities of the system depend onthe lenses used and are limited essentially by the illumination and lens aperature.
The camera selected for the enhancer has a standard 525-line television rasterand produces an effective scanning spot-size that is 1/500 of the picture heighton the camera's photosensitive target. With the 525-line scanning system, themeasured resolution of the videcon tube is approximately 600 vertical lines and 500horizontal lines. At the 525-line rate, the camera has a dynamic--range of 2^4density units which is compatible with usual radiographic densities of somewherebetween 2.2 and 2.7- Our selection of a 525-line over a 1000-line scan rate involvesthe following considerations. If the videcon were pushed for resolution of 1000vertical lines at the 1000-line rate, there would be a corresponding reduction inoverall dynamic range from 2.U to 1.9 density units. Moreover, the signal-to-noise ratio and contrast would be reduced appreciably.
When the signal from the video camera follows the normal video path, the imagemay be viewed on the television monitor as either a positive or negative reproduction.With the signal following either the normal or enhanced video path, the image may bereadily magnified on the television monitor screen by up to 30X. For example, figure1 shows a 30X magnification of a l6mm test film frame. Higher magnifications arepossible but are unwarranted for most conventional radiographs.

The enhanced video path has a logarithmic amplifier that converts the camerasignal to a signal that is proportional to the film density. The camera outputsignal, E, is given by
E = K I?
where I is the light intensity transmitted by the radiograph, / is a constant forthe videcon tube, and K is the camera sensitivity factor. The light from the lightbox is attenuated by the radiograph to produce an intensity, I:
T - T To J
where I is the incident light from the light box and T is the transmittance ofthe film. Using these equations and the definition of density, the density, D,of the film is given by
D = log -=- = constant - -— log E
The output of the log-amplifier is therefore proportional to D. The edge polarityreversal circuit provides a positive or negative density signal to the edge enhance-ment circuit or video subtracter so that both positive or negative signals areavailable for the enhancement process.
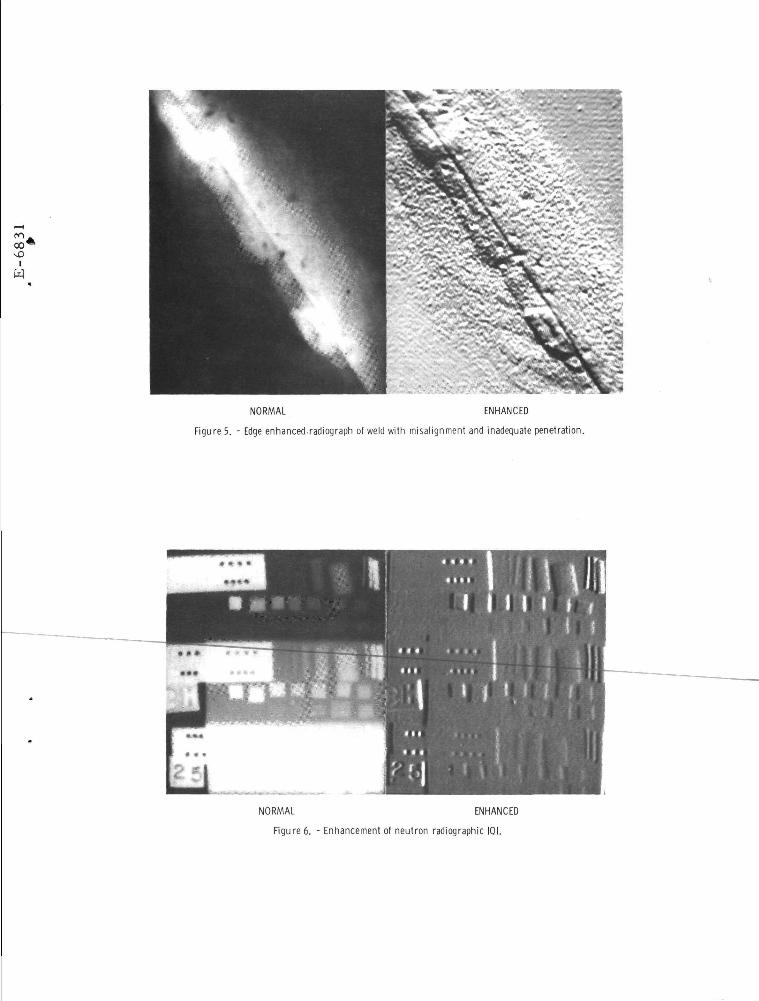
The enhancement is performed by delaying the density signal and subtractingit from itself in the video subtracter in the manner indicated in figure 3- Asseen in the examples of figures k and 5, "the result of the subtraction is toproduce a grey picture for large black or white areas and sharp black or whitelines about edges (i.e., distinct changes in contrast). Both positive or negativeradiographs or other types of transparencies are enhanced in the same way. Thebrightness of the lines in the enhancement is the same for edges having the samerate of change of density. This is true over the entire operating range of thelogarithmic amplifier of about 2.U density units. Conversely, the greater therate of change of density at edges, the greater is the brightness of the edgeenhancement. This is seen from examination of figure 6 which shows a neutronradiograph of a standard Image Quality Indicator (IQI) with and without enhancement.Without logarithmic conversion, edges in the darker parts of the radiograph wouldnot be properly enhanced.
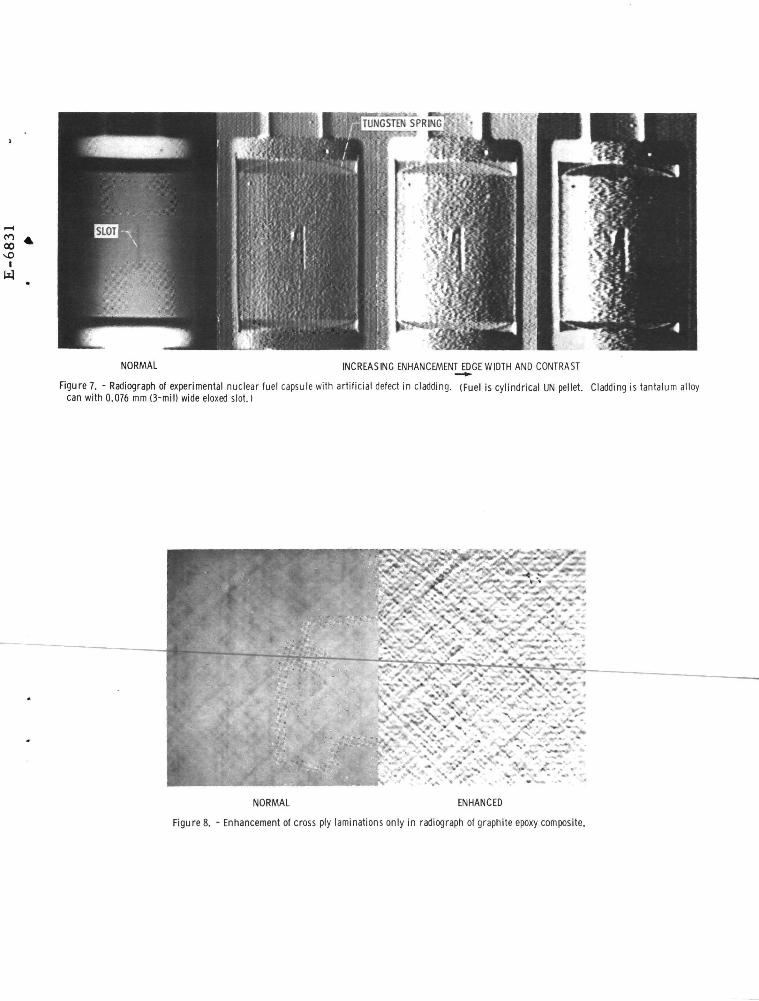
The difference signal is amplified by the subtracter to increase the sensitivityto subtle changes in density. The pseudo edge width is increased by increasingthe video delay for the same purpose. The amount of amplification is set by theedge contrast control, and the brightness of the background grey level is setby the edge brightness control. The effects of increasing the edge width andcontrast are seen in figure 7 which shows three different enhancements of a neutronradiograph taken for an experimental nuclear fuel element.
The normal and the enhanced picture videos are connected to the monitor bythe electronic switch. This switch allows the display of either the normal orenhanced picture. Or, both the normal and enhanced pictures can be displayedsimultaneously by high-speed switching pulses from the synchronizing generator.The enhanced picture is thereby displayed in a central rectangle surrounded bythe normal picture, as in figure h.
In addition to synchronizing the camera and monitor scanning systems andoperating the electronic switch, the synchronizing generator also provides areference dot-grid video signal that is added to the monitor video. The dot-gridvideo signal produces an array of dots on the screen, either in the central portionor over the entire picture. The dots are equally spaced vertically and horizon-tally to provide a reference grid for taking measurements of features in theradiographs. Thus, the enhancer system can serve as a video version of an opticalcomparator and with magnification as a micro-optical comparator. An example ofthe use of this feature is given (later in this paper).
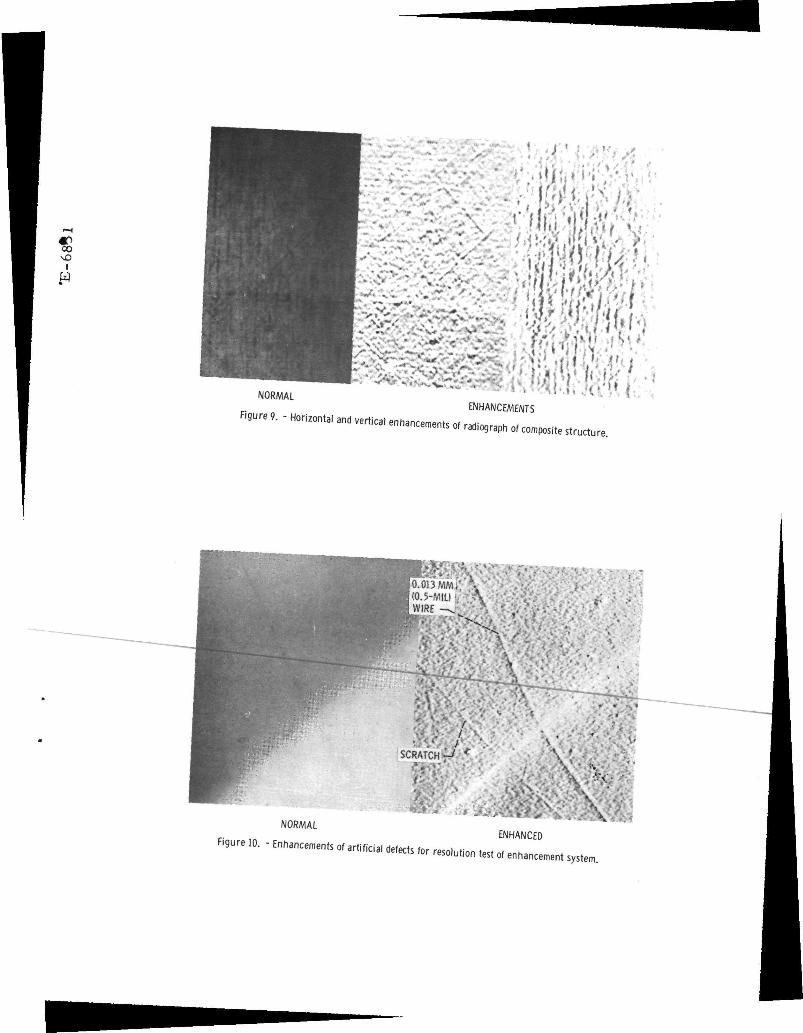
The mode of enhancement can be varied according to the way the originalpicture is presented (oriented with respect) to the video camera. This is becausethe enhancer will not respond to edges or lines that are parallel to the rasterscan lines. Hence, by rotating the light box (i.e., radiograph), one may factor-out certain edges or lines from the enhancement. For example, in figure 8, thevertical filaments (lines) of the graphite-epoxy composite shown in the radiographvanish in the enhancement and only the Vj-degree cross-ply fialments are enhanced.And, in figure 9> two different enhancements are produced from the same radiographof a similar composite material specimen by rotating the light box 9C degrees.
RESULTS
Resolution Capabilities
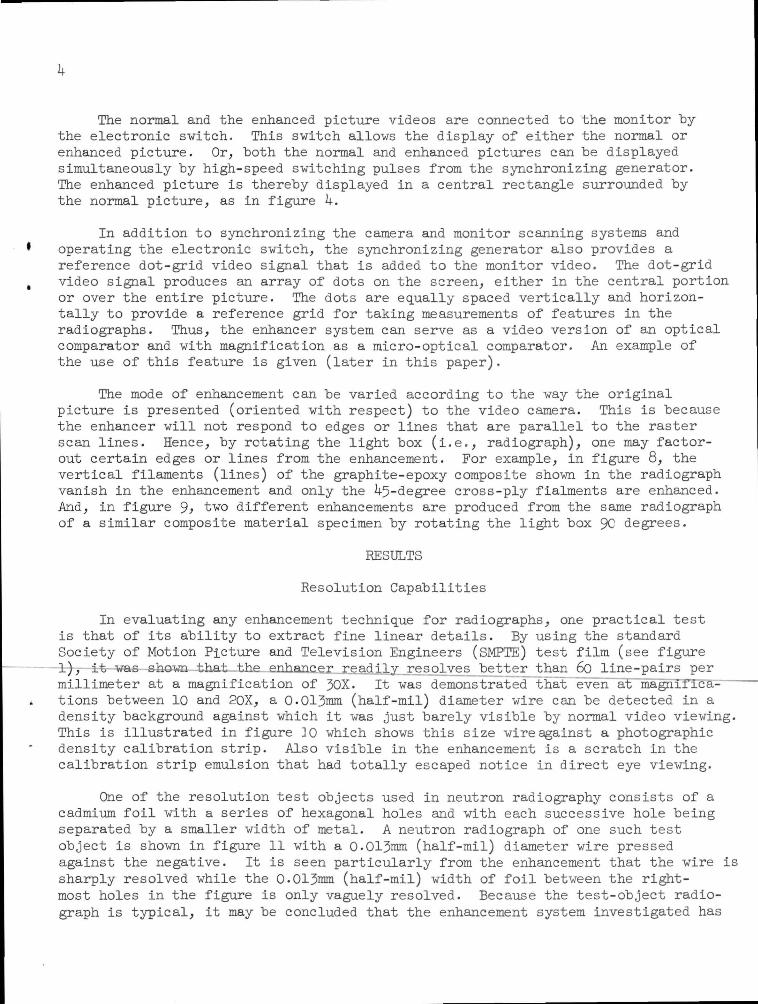
In evaluating any enhancement technique for radiographs, one practical testis that of its ability to extract fine linear details. By using the standardSociety of Motion Picture and Television Engineers (SMPTE) test film (see figurel), it was shown that the enhancer readily resolves better than 60 line-pairs permillimeter at a magnification of 30X. It was demonstrated that even at magnifica-tions between 10 and 20X, a 0.013mm (half-mil) diameter wire can be detected in adensity background against which it was just barely visible by normal video viewing.This is illustrated in figure ]0 which shows this size wire against a photographicdensity calibration strip. Also visible in the enhancement is a scratch in thecalibration strip emulsion that had totally escaped notice in direct eye viewing.
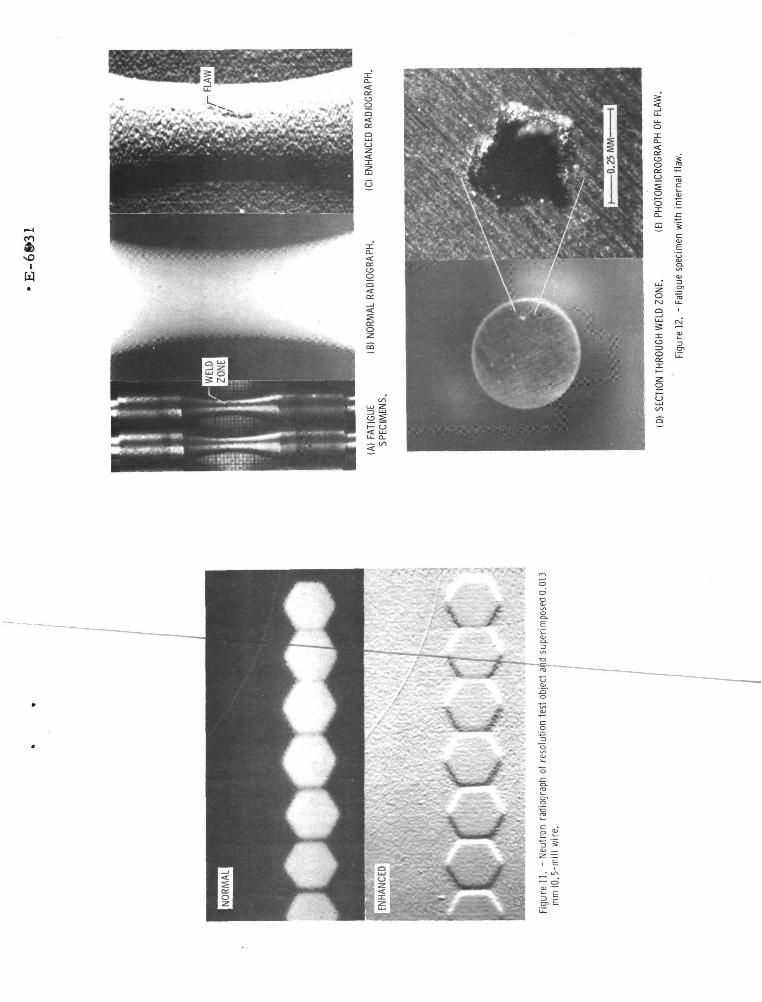
One of the resolution test objects used in neutron radiography consists of acadmium foil with a series of hexagonal holes and with each successive hole beingseparated by a smaller width of metal. A neutron radiograph of one such testobject is shown in figure 11 with a 0.013mm (half-mil) diameter wire pressedagainst the negative. It is seen particularly from the enhancement that the wire issharply resolved while the 0.013mm (half-mil) width of foil between the right-most holes in the figure is only vaguely resolved. Because the test-object radio-graph is typical, it may be concluded that the enhancement system investigated has
a resolving capability that exceeds that actually encountered in conventionalx-radiographs and neutron radiographs.
Typical Examples of Enhanced Images
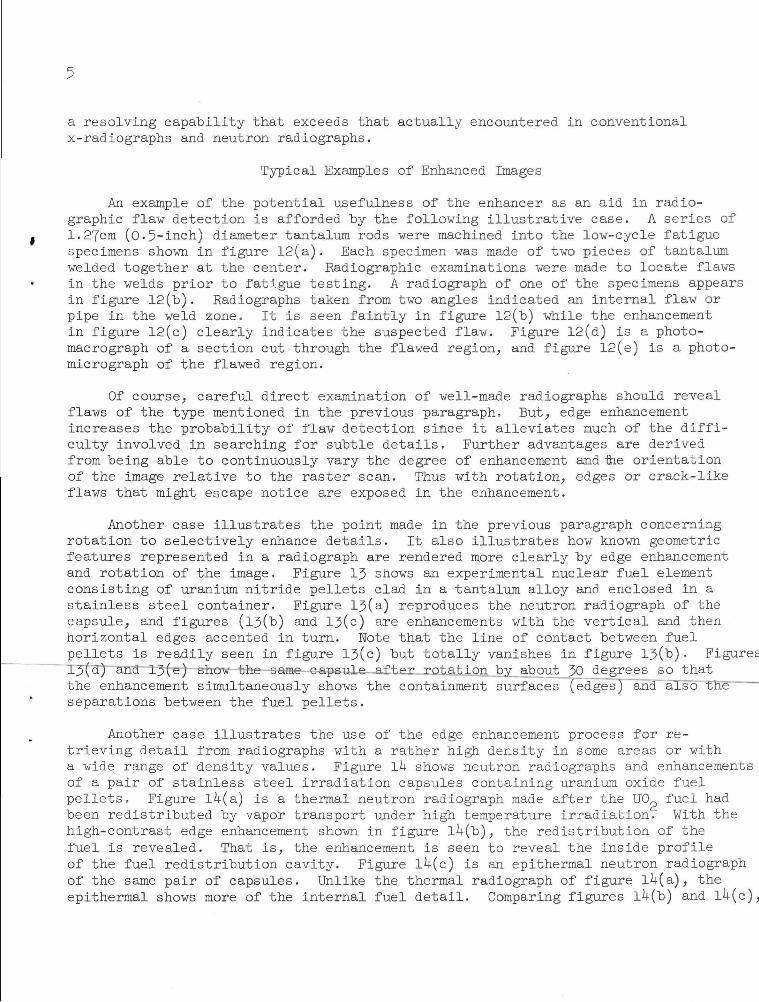
An example of the potential usefulness of the enhancer as an aid in radio-graphic flaw detection is afforded by the following illustrative case. A series of1.27cm (o.5-inch) diameter tantalum rods were machined into the low-cycle fatiguespecimens shown in figure 12(a). Each specimen was made of two pieces of tantalumwelded together at the center. Eadiographic examinations were made to locate flawsin the welds prior to fatigue testing. A radiograph of one of the specimens appearsin figure 12(b). Radiographs taken from two angles indicated an internal flaw orpipe in the weld zone. It is seen faintly in figure 12(b) while the enhancementin figure 12(c) clearly indicates the suspected flaw. Figure 12(d) is a photo-macrograph of a section cut through the flawed region, and figure 12(e) is a photo-micrograph of the flawed region.
Of course, careful direct examination of well-made radiographs should revealflaws of the type mentioned in the previous paragraph. But, edge enhancementincreases the probability of flaw detection since it alleviates much of the diffi-culty involved in searching for subtle details. Further advantages are derivedfrom being able to continuously vary the degree of enhancement and tie orientationof the image relative to the raster scan. Thus with rotation, edges or crack-likeflaws that might escape notice are exposed in the enhancement.
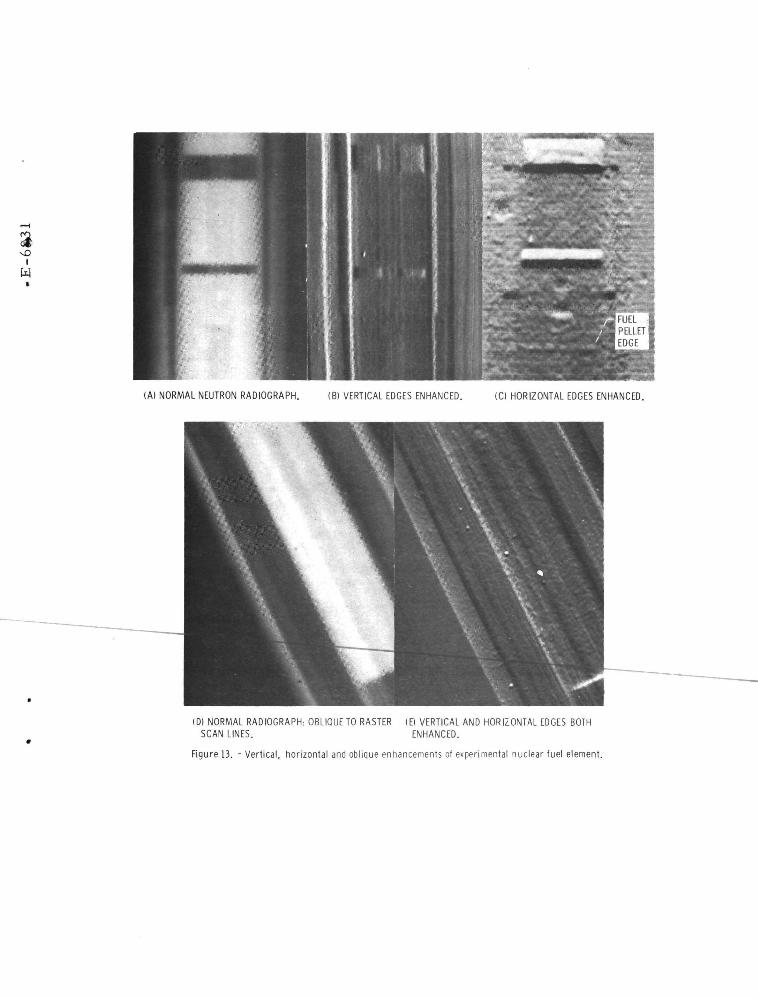
Another case illustrates the point made in the previous paragraph concerningrotation to selectively enhance details. It also illustrates how known geometricfeatures represented in a radiograph are rendered more clearly by edge enhancementand rotation of the image. Figure 13 snows an experimental nuclear fuel elementconsisting of uranium nitride pellets clad in a tantalum alloy and enclosed in astainless steel container. Figure 13(a) reproduces the neutron radiograph of thecapsule, and figures (l3(b) and 13(c) are enhancements with the vertical and thenhorizontal edges accented in turn. Note that the line of contact between fuelpellets is readily seen in figure 13(c) but totally vanishes in figure 13(t>)• Figures13(d) and 13(e) show the same capsule after rotation by about JO degrees so thatthe enhancement simultaneously shows the containment surfaces (edges) and also theseparations between the fuel pellets.
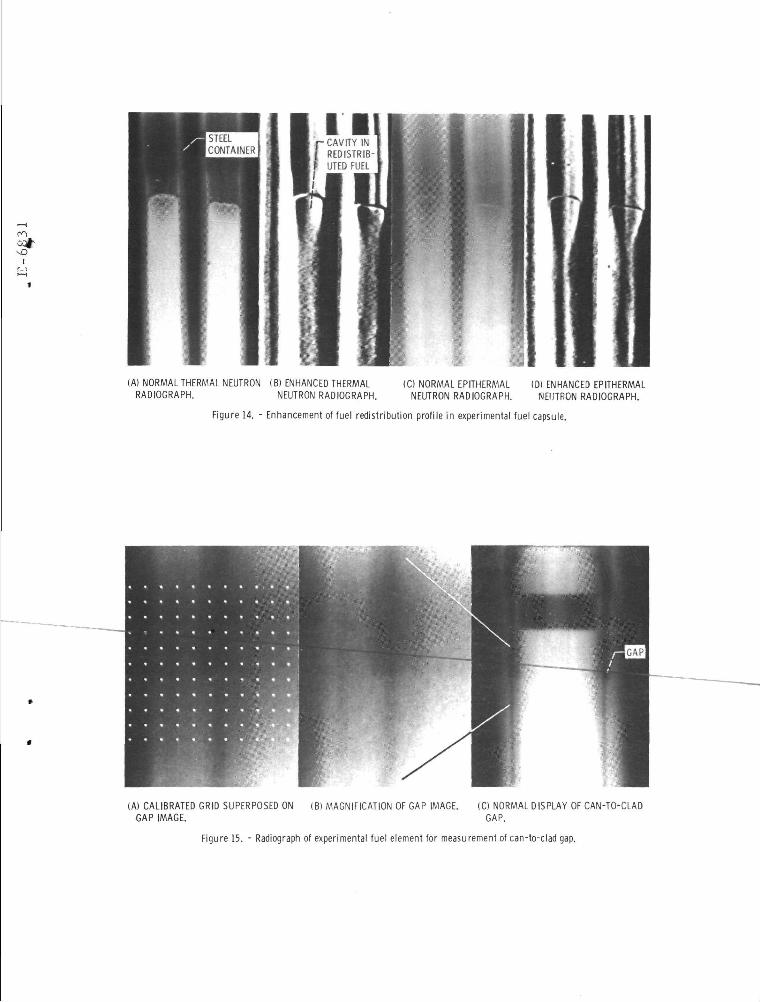
Another case illustrates the use of the edge enhancement process for re-trieving detail from radiographs with a rather high density in some areas or witha wide range of density values. Figure lU shows neutron radiographs and enhancementsof a pair of stainless steel irradiation capsules containing uranium oxide fuelpellets. Figure l -(a) is a thermal neutron radiograph made after the UOp fuel hadbeen redistributed by vapor transport under high temperature irradiation. With thehigh-contrast edge enhancement shown in figure l (b), the redistribution of thefuel is revealed. That is, the enhancement is seen to reveal the inside profileof the fuel redistribution cavity. Figure l -(c) is an epithermal neutron radiographof the same pair of capsules. Unlike the thermal radiograph of figure l4(a), theepithermal shows more of the internal fuel detail. Comparing figures lU(b) and lU(c)j
it appears that image enhancement may substitute for epithermal neutron radiographywhich itself is a form of image enhancement. There is an economic advantage de-rivable from the enhancement process because epithermal radiography requires morethan eight times longer exposures than thermal neutron radiography ('v 8 hours vs.^ 1 hour). However, we note from figure lA(d), which is an enhancement of lU(c),that edge enhancement of epithermal radiographs also adds even more to the amountof detail that can be obtained.
A final illustrative case concerns the use of the enhancer for measuringcan-to-clad gaps from neutron radiographs of experimental, doubly-containednuclear fuel capsules. The purpose of this measurement is to follow irradiation-induced fuel swelling and consequent clad distortions after in-pile exposures.It is customary to make these measurements from the" neutron radiographs with ascanning microdensitometer, reference 5>
Measurement of the can-to-clad gap with the video display is illustrated infigure 15. In figure 15(a), the reference dot-grid is superimposed on the imageof the gap display on the video monitor. In this instance, the dot spacing iscalibrated at O.jSmm (15 mils) and an attempt has been made to align a column ofdots with one edge of the gap. As seen in figure 15(b), even this nominally high-quality neutron radiograph lacks the definition needed to locate the edges of thecan-to-clad gap. Figure 15(c) shows the location of the gap in question at alower magnification.
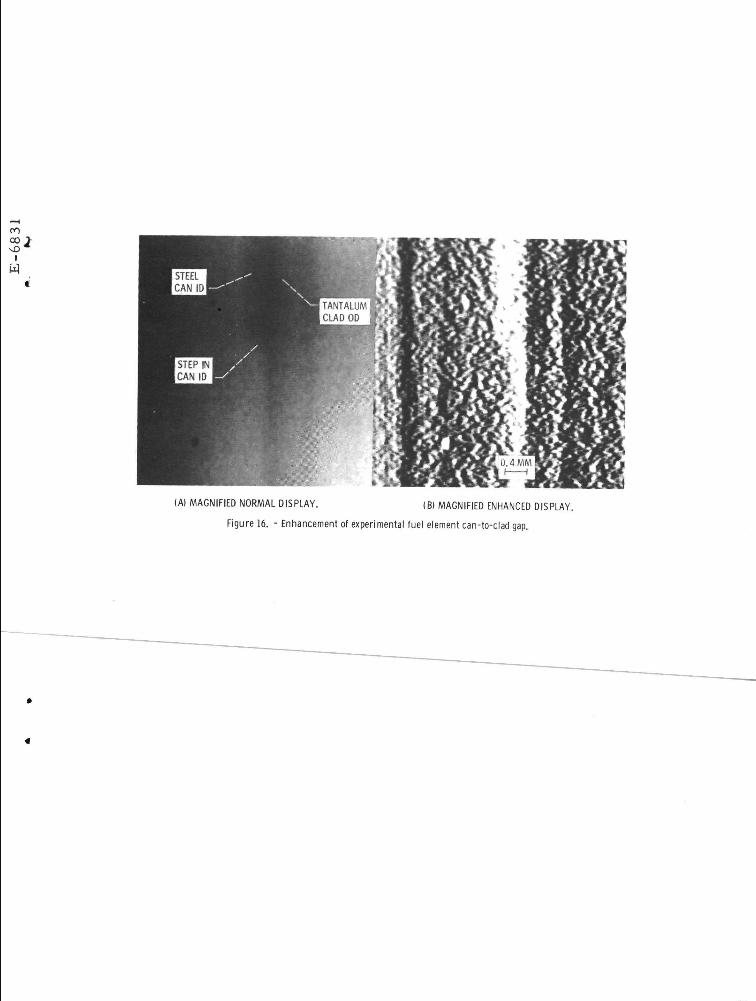
A similar can-to-clad gap is shown in the normal mode display in figure l6(a).The enhanced display in figure l6(b) shows not only the step in gap size but_ alsoindicates that the clad wall is apparently smoother than the stainless steel wallsurface. Some capsules were cut apart, and it was confirmed that the stainlesssteel can's inside surface was indeed rougher (i.e., the surface finish on thestainless steel was about 32 rms versus about 16 rms for the tantalum clad surface)
Using the video system as an optical comparator at a magnification of 30X, aseries of gap measurements were made and compared with those obtained with micro-densitometer readings and with micrometer measurements obtained from the actualobjects prior to assembly of the.capsules. Typical results are shown in table I:
TABLE ITOTAL RADIAL CAN-TO-CLAD GAP
MicrodensitometerMeasurement (mm)
0.890-7^1.171.2k
VideoMeasurement (mm)
0.58 -- 0.6l0.56 -- 0.6l1.02 -- 1.1k1.09 -- 1.12
MicrometerMeasurement (mm)
0.5°"0.561.125l.ll?
'All of the neutron radiographs presented in this report were made with the NASA-Plum Brook 60 MW reactor (See reference 5 for a description of the apparatus andprocedure.
As seen from the tabulation, the video measurements generally fell betweenthose otained with the microdensitometer and those obtained with themicrometer gaging. The microdensitometer slit size was 0.025mm by 0.51mm withthe 0.51mm parallel to the edges of the gap. Hence, the microdensitometer_tended to average out some of the film graininess. On the other hand, makingthe measurements via the video display entailed fairing in by eye the edges of tcan and clad. This was, of course, facilitated by enhancements such as that £
in figure l6(b).
DISCUSSION
With some exceptions, neither the normal nor enhanced video displays revealeddetails of the radiographs that could not be ultimately seen by direct-eye viewingor by means of simple optical aids. With proper back-lighting, magnification, andeye accommodation there is actually little information in well-made radiographsthat escapes detection. Conversely, the video system does retrieve all detailsrevealed by close optical examination. However, all these details cannot always beretrieved simultaneously with one setting of the enhancement controls,because the density response range of the system (i.e., 2,4) is not always adequ;
In all the radiographs presented herein, care was taken to insure that thenormal, unenhanced version displayed on the monitor faithfully showed the parti-cular details that were discussed. Thus, in the case of figures T(a and 12(bJ,the slot and flaw highlighted by edge enhancement are apparent even in the normalviews. However, in figure 1, for example, other image details had to be sacrificedin order to show the slot clearly and to photograph it from the monitor screenNevertheless, these other details, as for example the tungsten springs in figure7, show up clearly in the enhancement regardless of the normal display-moc
and contrast settings.
A problem that is aggravated by edge enhancement arises from film artifacts,such as the presence of defects in the film emulsion, graininess, scratches, watermarks, dust, lint, etc. All these are, of course, enhanced along with other imagedetails In most instances, such artifacts that appear in the enhancement can bereadily identified and ignored, as in conventional radiographic examinations, afteia little experience is-gained in interpreting the enhanced images.
Overall the video system proved to be a valuable tool for the examination ofradiographs.' Its limitations are generally overcome by the benefits derivedbeing able to magnify, display, and electronically-enhance images for advantageous
viewing.
CONCLUDING REMARKS
This paper describes an electronic image-enhancement technique that was foundto be a useful tool for aiding the eye in the appreciation of subtle butdetails that exist in radiographs. The image enhancement system describedsubstantially reduced the demands on visual acuity and presented, on demand, variousanalogs of the original radiographs examined from which the eye could comfortably,

regions of interest.
0Ver 100 samples of radioes of nuclear and eexamined and interpreted with the aid °he enhancersome detail that was either trussed orgeneral, electronic enhancement v^a th
enhancement. Invideo system proved to have
examining and interpreting
aided viewing methods.
Tfce syste, vas particuiarlythat »ere saen only as subtle the system that com
graphs .
REFERENCES
Anderson, R. T. and DeLacy, T. J. : Nondestructive Testing Applications forAdvanced Aerospace Materials and Components. GDC-ERR-132U, General Dynamics,Convair Division, December 1968, pp. 5-1 to 5~7-
Lohse, K. H. : Application of Photographic Extraction Techniques to Nondestruc-tive Testing of Graphites and Other Materials. AFML-TR- 70-162, Air ForceMaterials Laboratory, November 1970-
Oaks, A. E. : New and Refined Nondestructive Techniques for Graphite Billetsand Shapes. AFML-TR-70-212, Part II, Air Force Materials Laboratory, July
, PP- 137 to lUl.
Selzer, R. H. : Improving Biomedical Image Quality With Computers. TR-32-1336,Jet Propulsion Laboratory, October 1968.
Thaler, L. A. : The Measurement of Capsule Heat-Transfer Gaps Using NeutronRadiography. NASA TM X-67920, October 1971.
00
5I
N
Figure 1. Image enhancer.
-NORMAL VIDEO PATH-
LIGHT BOX
EDGE CONTRAST- ENHANCED VIDEO PATH
BRIGHTNESS
SYNC
PULSES
SWITCH PULSES
DOT VIDEO
Figure 2. - Edge - enhancer block diagram.

IDEALIZEDORIGINALPICTURE
A. VIDEOSIGNAL
wB. DELAYED
VIDEOSIGNAL
C ENHANCEDSIGNAL( A - B )
ENHANCEDPICTURE
Figure 3. - Edge enhancement process.
Figure 4. - Radiograph of tungsten wire clad in nickel with center portionenhanced.
I
w
NORMAL ENHANCED
Figure 5. - Edge enhanced.radiograph of weld with misalignment and inadequate penetration.
NORMAL ENHANCED
Figure 6. - Enhancement of neutron radiographic IQI.
00vOi
NORMAL INCREASING ENHANCEMENT EDGE WIDTH AND CONTRAST
Figure 7. - Radiograph of experimental nuclear fuel capsule with artificial defect in cladding. (Fuel is cylindrical UN pellet. Cladding is tantalum alloycan with 0.076 mm (3-mil) wide eloxed slot. I
NORMAL ENHANCED
Figure 8. - Enhancement of cross ply laminations only in radiograph of graphite epoxy composite.
00\0
IW
NORMAL
and .rtica,ENHANCEMENTS
of composite
",*, /SCRATCH-/ f
NORMAL
Figure 10. - Enhancements of artificial defectsENHANCED
for resolution test of enhancement system.
CO
I
w
o5
§ =
w>
(A) NORMAL NEUTRON RADIOGRAPH. (B) VERTICAL EDGES ENHANCED. (C) HORIZONTAL EDGES ENHANCED.
(D) NORMAL RADIOGRAPH: OBLIQUE TO RASTERSCAN LINES.
(E) VERTICAL AND HORIZONTAL EDGES BOTHENHANCED.
Figure 13. - Vertical, horizontal and oblique enhancements of experimental nuclear fuel element.
r-CAVITY IN| REDISTRIBP UTED FUEL
(A) NORMAL THERMAL NEUTRONRADIOGRAPH.
(Bl ENHANCED THERMALNEUTRON RADIOGRAPH.
(C) NORMAL EPITHERMALNEUTRON RADIOGRAPH.
ID) ENHANCED EPITHERMALNEUTRON RADIOGRAPH.
Figure 14. - Enhancement of fuel redistribution profile in experimental fuel capsule.
(A) CALIBRATED GRID SUPERPOSED ON (B) MAGNIFICATION OF GAP IMAGE. (C) NORMAL DISPLAY OF CAN-TO-CLADGAP IMAGE. GAP.
Figure 15. - Radiograph of experimental fuel element for measurement of can-to-clad gap.
01
°°vOI
(A) MAGNIFIED NORMAL DISPLAY. IB) MAGNIFIED ENHANCED DISPLAY.
Figure 16. - Enhancement of experimental fuel element can-to-clad gap.