national strategies concerning issues of childhood overweight and obesity and implications for...
TRANSCRIPT

National Strategies Concerning Issues of Childhood Overweight
and Obesity and Implications for Long-term Health
Van S. Hubbard, M.D., Ph.D.
CAPT, USPHS
Director, NIH Division of Nutrition Research Coordination
Defining Overweight and Obesity:
What are the Issues?
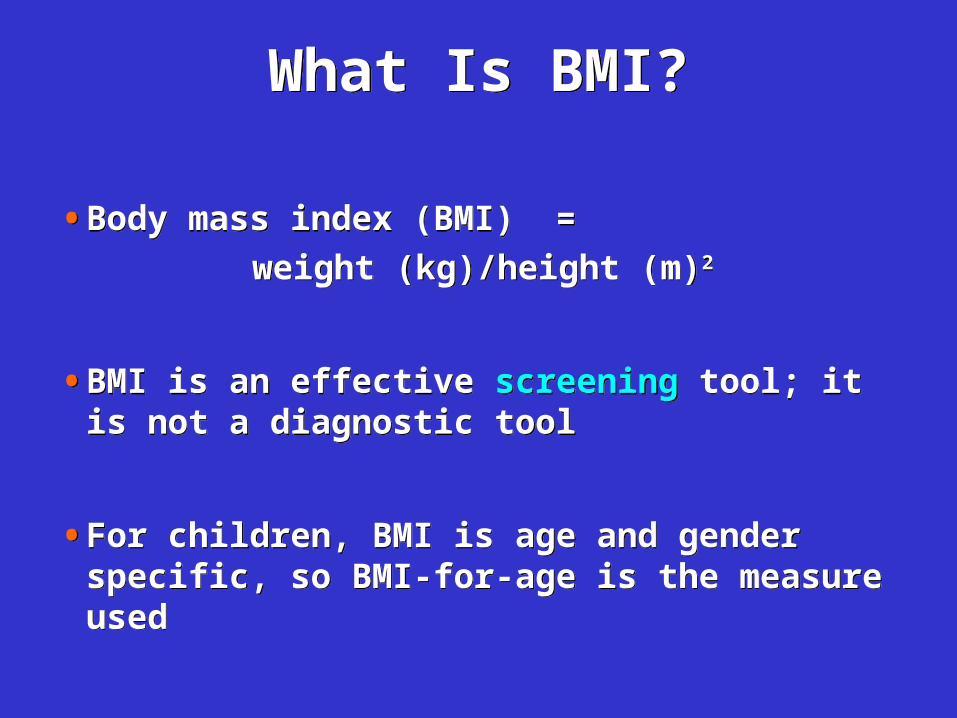
What Is BMI?What Is BMI?
• Body mass index (BMI) =
weight (kg)/height (m)2
• BMI is an effective screening tool; it is not a diagnostic tool
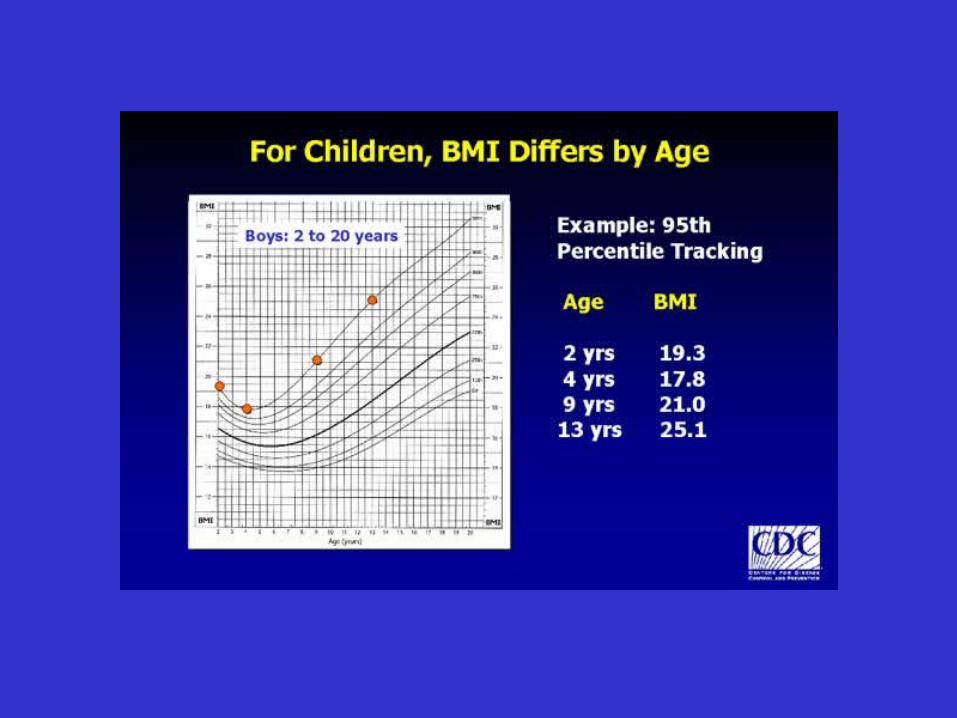
• For children, BMI is age and gender specific, so BMI-for-age is the measure used
• Body mass index (BMI) =
weight (kg)/height (m)2
• BMI is an effective screening tool; it is not a diagnostic tool
• For children, BMI is age and gender specific, so BMI-for-age is the measure used
CDC Growth Charts 2000
Centers for Disease Control and Prevention
National Center for Chronic Disease Prevention
and Health Promotion
Division of Nutrition and Physical Activity
Maternal and Child Nutrition Branch
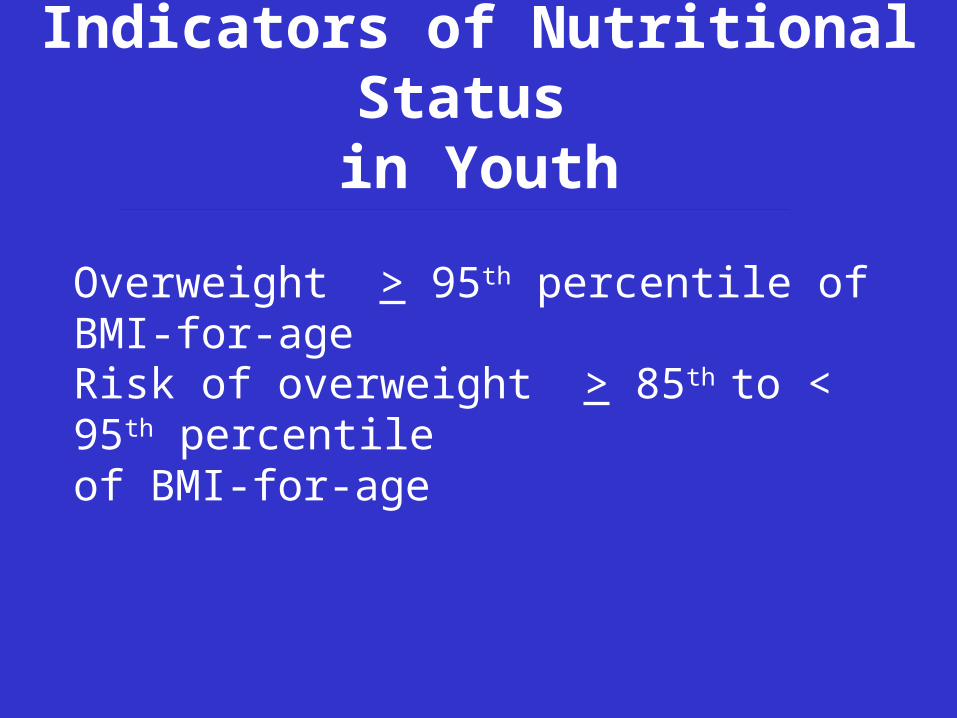
Indicators of Nutritional Status in Youth
Overweight > 95th percentile of BMI-for-age Risk of overweight > 85th to < 95th percentile of BMI-for-age
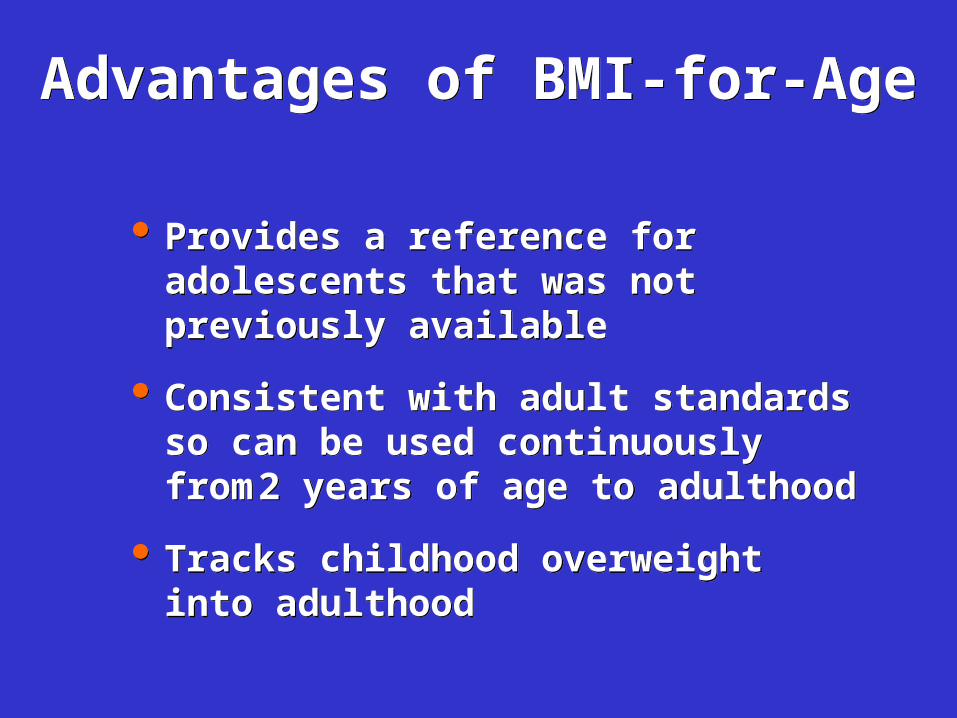
Advantages of BMI-for-AgeAdvantages of BMI-for-Age
Provides a reference for adolescents that was not previously available
Consistent with adult standards so can be used continuously from 2 years of age to adulthood
Tracks childhood overweight into adulthood
Provides a reference for adolescents that was not previously available
Consistent with adult standards so can be used continuously from 2 years of age to adulthood
Tracks childhood overweight into adulthood
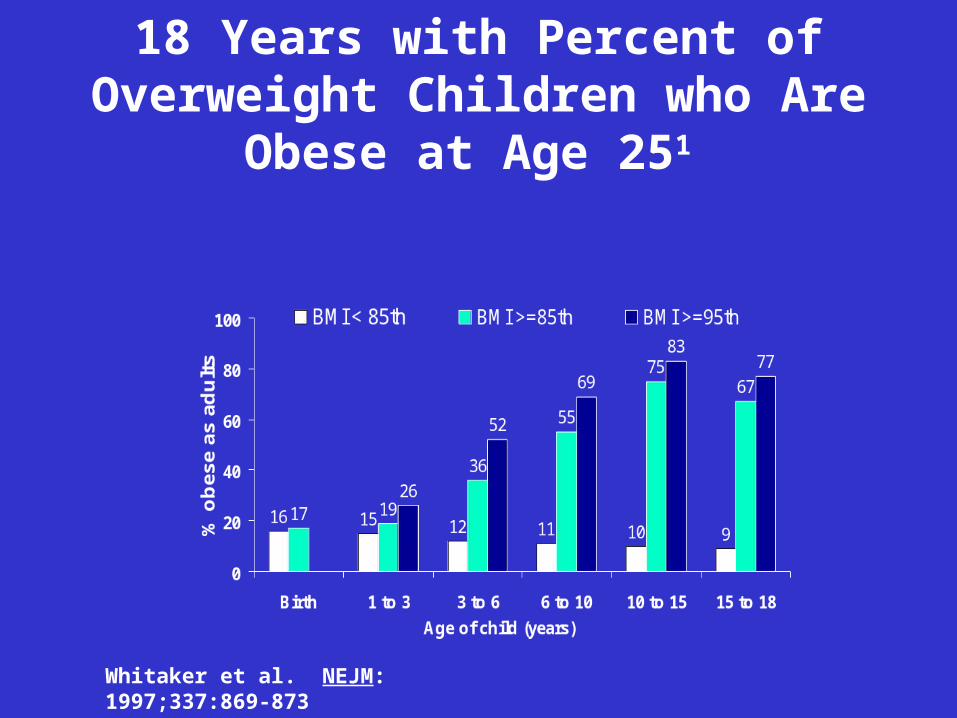
Tracking BMI-for-Age from Birth to 18 Years with Percent of Overweight Children who Are Obese at Age 251
Whitaker et al. NEJM: 1997;337:869-873

Correlation of BMI With Total Body Fat
0102030405060708090
100
0 10 20 30 40 50 60 70 80 90 100 110 120 130 140 150 160
Bod
y M
ass
Inde
x
Adipose Tissue (kg)
Zumoff, B et al. J Clin Endocrinol Metab. 1990; 70:929-931.

Obesity Classificationfor Adults
Obesity Classificationfor Adults
Overweight: BMI > 25 kg/m2
Obesity: BMI > 30 kg/m2
Overweight: BMI > 25 kg/m2
Obesity: BMI > 30 kg/m2
ObesityBMI Class25.0 – 29.9 Overweight30.0 – 34.9 Obesity I35.0 – 39.9 Obesity II> 40.0 Extreme Obesity III
NHLBI Guidelines, June 1998
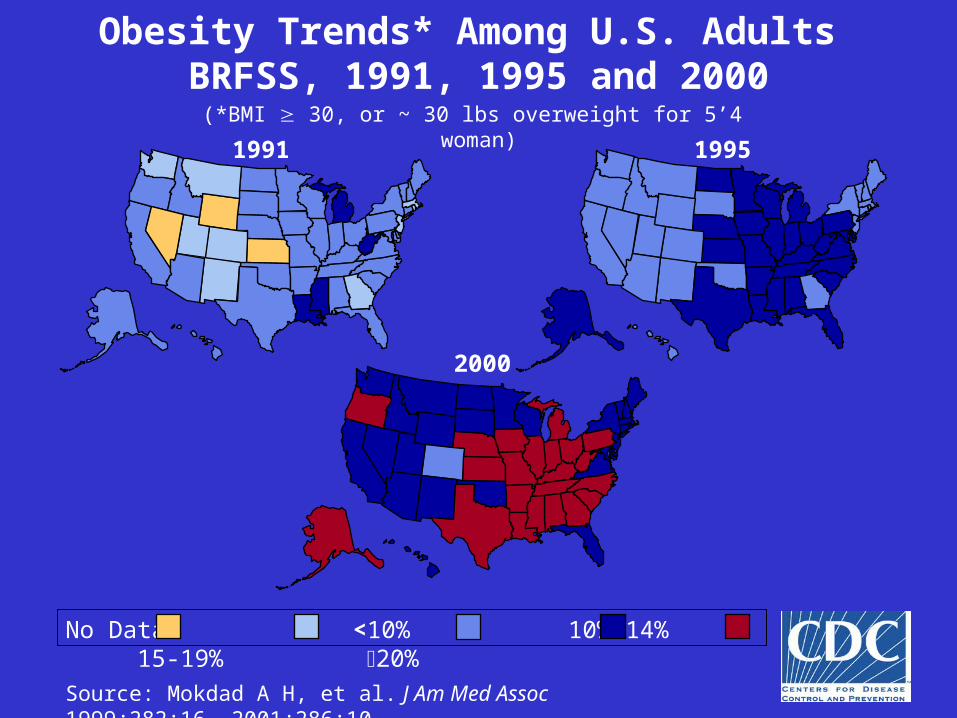
Obesity Trends* Among U.S. Adults BRFSS, 1991, 1995 and 2000(*BMI 30, or ~ 30 lbs overweight for 5’4” woman)
1991 1995
2000
Source: Mokdad A H, et al. J Am Med Assoc 1999;282:16, 2001;286:10.
No Data <10% 10%-14% 15-19% 20%
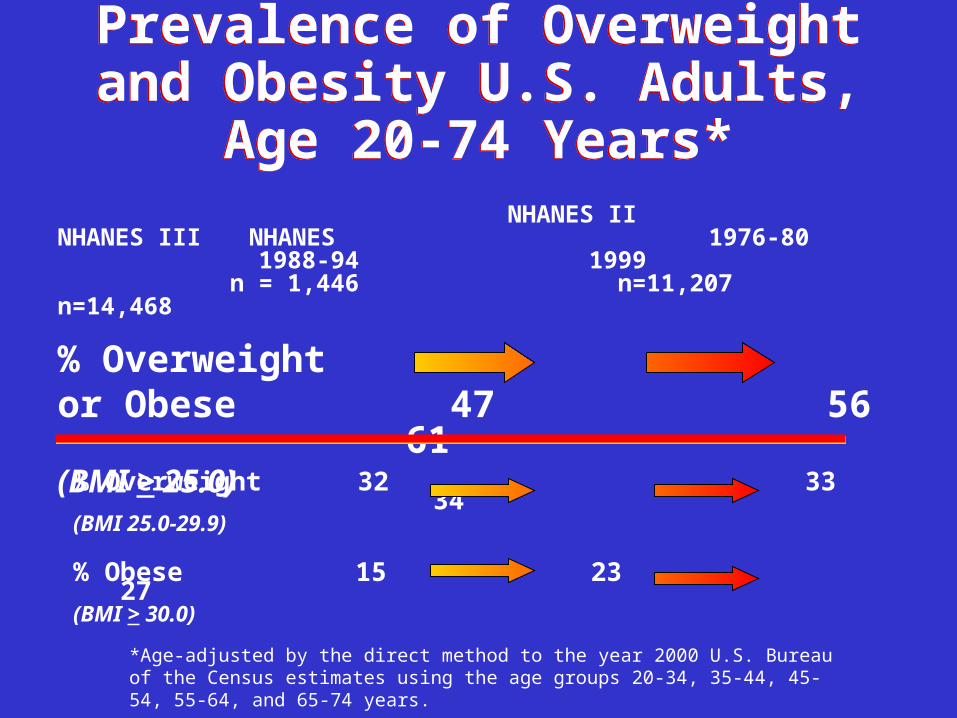
Prevalence of Overweight and Obesity U.S. Adults, Age 20-74 Years*
Prevalence of Overweight and Obesity U.S. Adults, Age 20-74 Years*
% Overweight 32 33 34(BMI 25.0-29.9)
% Obese 15 23 27(BMI > 30.0)
*Age-adjusted by the direct method to the year 2000 U.S. Bureau of the Census estimates using the age groups 20-34, 35-44, 45-54, 55-64, and 65-74 years.
NHANES II NHANES III NHANES 1976-80 1988-94 1999
n = 1,446 n=11,207 n=14,468
% Overweight or Obese 47 56 61(BMI > 25.0)
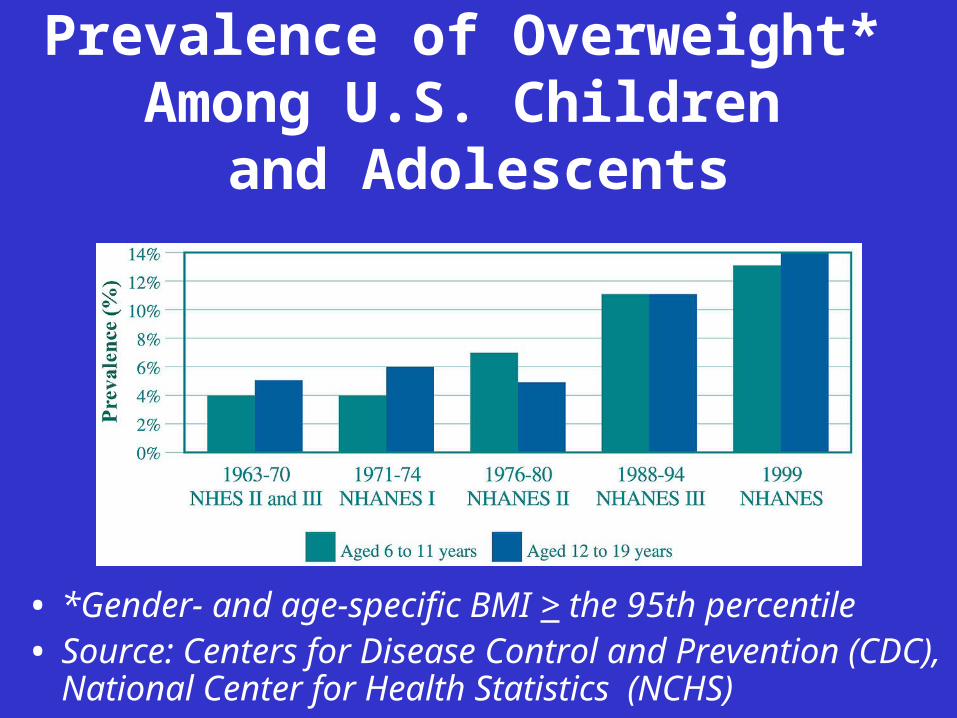
Prevalence of Overweight* Among U.S. Children
and Adolescents
• *Gender- and age-specific BMI > the 95th percentile• Source: Centers for Disease Control and Prevention (CDC),
National Center for Health Statistics (NCHS)
Degree of risk increases with degree of overweight
Risk influenced by Regional Fat Deposition
and Degree of Visceral Adiposity
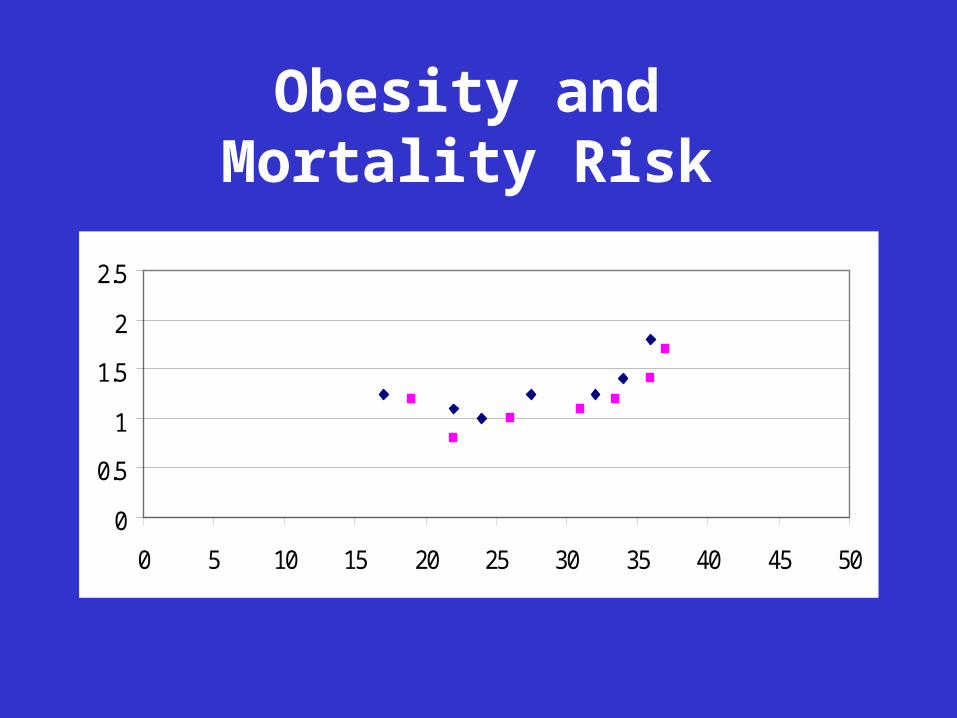
Obesity and Mortality Risk
0
0.5
1
1.5
2
2.5
0 5 10 15 20 25 30 35 40 45 50
Mortality Rate Associated with Obesity
Mortality Rate Associated with Obesity
• Obese individuals have a 50 to 100% increased risk of death from all causes, compared with normal-weight individuals.
• Most of the increased risk is due to cardiovascular causes.
• Obese individuals have a 50 to 100% increased risk of death from all causes, compared with normal-weight individuals.
• Most of the increased risk is due to cardiovascular causes.
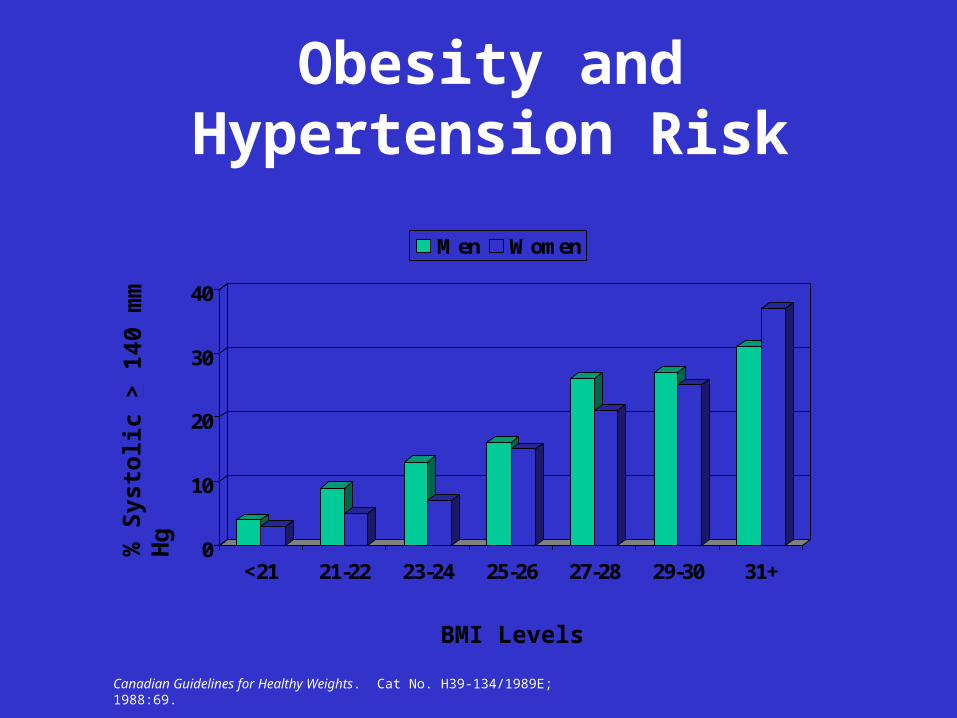
Obesity and Hypertension Risk
0
10
20
30
40
<21 21-22 23-24 25-26 27-28 29-30 31+
Men Women
% S
ysto
lic
> 1
4 0 m
m H
g
BMI Levels
Canadian Guidelines for Healthy Weights. Cat No. H39-134/1989E; 1988:69.
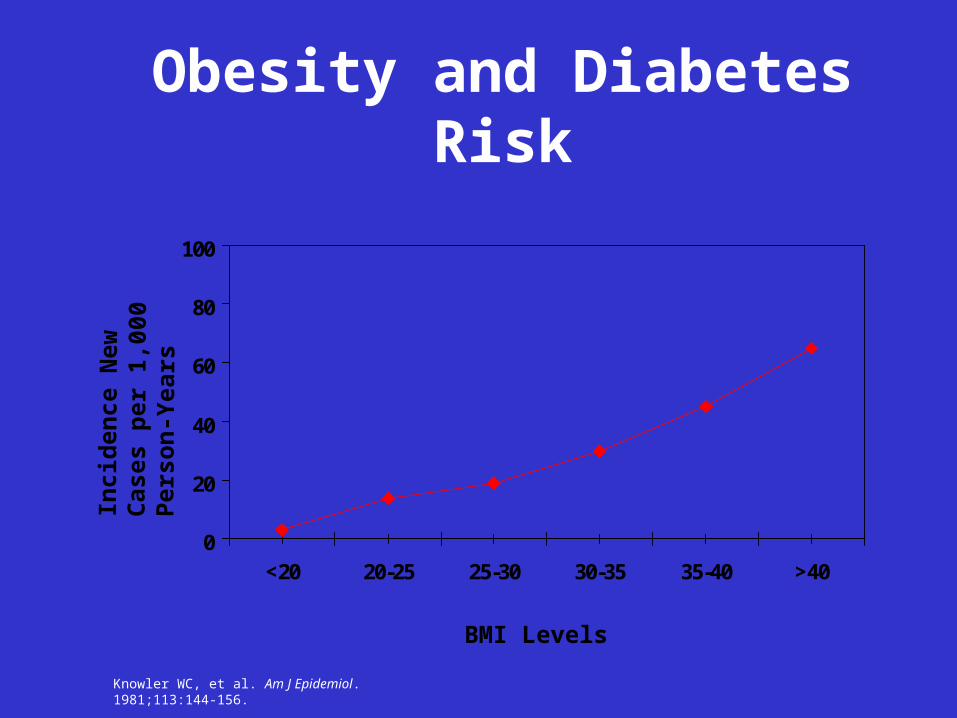
Obesity and Diabetes Risk
0
20
40
60
80
100
<20 20-25 25-30 30-35 35-40 >40
BMI Levels
Inci
den
ce N
ew C
ases
per
1,
0 00
Per
son-
Yea
rs
Knowler WC, et al. Am J Epidemiol. 1981;113:144-156.
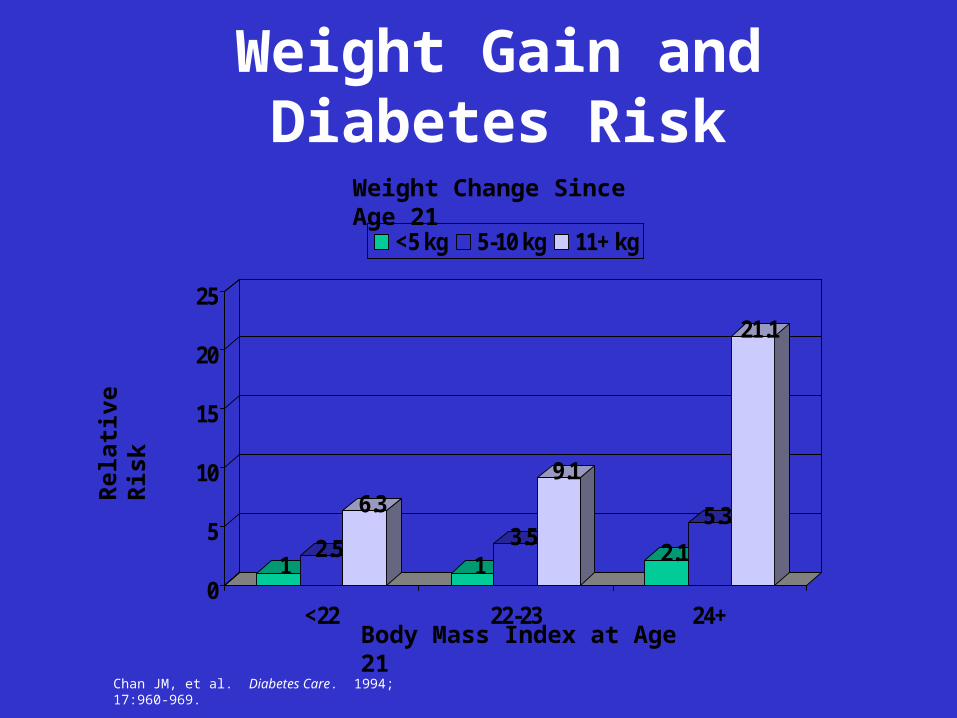
Weight Gain and Diabetes Risk
12.5
6.3
13.5
9.1
2.1
5.3
21.1
0
5
10
15
20
25
<22 22-23 24+
<5 kg 5-10 kg 11+ kg
Body Mass Index at Age 21
Rel
ativ
e R
isk
Weight Change Since Age 21
Chan JM, et al. Diabetes Care. 1994; 17:960-969.
Overarching Purpose:
TO CALL THE NATION’S ATTENTION TO THE EPIDEMIC OF OVERWEIGHT AND OBESITY AND IDENTIFY ACTIONS THAT
WE AS A NATION CAN UNDERTAKE
Overweight and Obesity: A Public Health Priority
• Prevention or intervention to improve health
• Need to be aware of social, cultural, and environmental influences
• Must have access to family and community support
• Everybody must do their share
Obesity is a Chronic Disease
• Often treated as a “subacute” illness, in which time-limited treatment will lead to a complete cure
GeneticsGenetics
• Humans have evolved genes favoring energy intake and storage.
• 70+ loci, genes, or markers may be involved in causing a susceptibility to obesity.
20-40% of Obesity Is Due to Genetic Factors20-40% of Obesity Is Due to Genetic Factors
Prevention and Intervention Strategies
• Modification toward more healthful lifestyles– Increase “purposeful” activity
– Decrease sedentary behaviors
– Improve dietary choices
– Use available support mechanisms
Issues Influencing Behavioral Change
• Appropriateness of messages– Reading level
– Racially/ethnically correct
– Scientifically sound

Issues Influencing Behavioral Change
• Consistency of messages
• Motivation to adopt modified behavior
• Availability of appropriate and accessible options or choices
Who Should Be Involved?
• Families
• Schools
• Businesses
• Health care organizations
• Communities
• Media
Families and Communities
• Cultural and environmental influences
• Access to safe activity
• Access to support mechanisms

Schools
• Food Service– Pricing– Vending machines
• Activity– General– Intramural– Varsity
• Health Education
Worksite
• Support of infrastructure for families and communities
• Data on work efficiency
• Value for the money
• Wellness programs
Health Care
• Awareness (early identification)
• Access
• Training
• Reimbursement
• Acceptance of chronic disease model
Media and Communications
• Improve recognition and translation of what is important– Media emphasizes conflict– Conflicts often presented without
appropriate filter
• Terminology
• Success stories

Why Should Groups Work Together?
• Efficiency and common resources– Many groups are consulting with the
same experts
– Many groups are seeking support from the same sources
– Many goals are overlapping
– Improved consistency of efforts
Monitoring Our Status
• Leading Health Indicators within Healthy People 2010 – Annual Report Card
• Subpopulations
• Measured versus self-report
• Cross-sectional versus longitudinal
• Modification of health risks
Summary
• Life-long modification of behaviors will be needed
• Prevention is the ultimate goal for those who are not overweight
• Improvement in health risk is the goal for all
• Everyone needs to become a Partner

Paul Ambrose

Let us all strive to make a difference