nava bharat ventures limited · salient features of the financial statements of subsidiaries 165...
TRANSCRIPT

45th Annual Report 2016-17
NAVA BHARAT VENTURES LIMITED
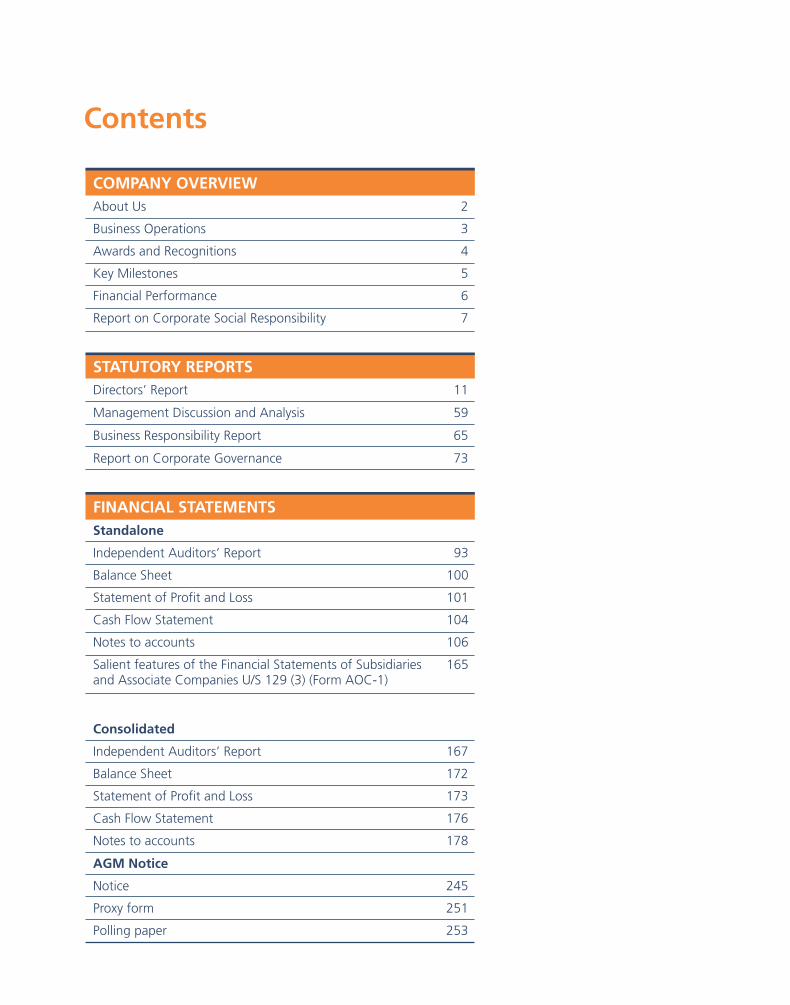
Contents
COMPANY OVERVIEW
STATUTORY REPORTS
About Us 2
Business Operations 3
Awards and Recognitions 4
Key Milestones 5
Financial Performance 6
Report on Corporate Social Responsibility 7
Directors� Report 11
Management Discussion and Analysis 59
Business Responsibility Report 65
Report on Corporate Governance 73
FINANCIAL STATEMENTSStandalone
Independent Auditors� Report 93
Balance Sheet 100
Statement of Profit and Loss 101
Cash Flow Statement 104
Notes to accounts 106
Salient features of the Financial Statements of Subsidiaries 165and Associate Companies U/S 129 (3) (Form AOC-1)
Consolidated
Independent Auditors� Report 167
Balance Sheet 172
Statement of Profit and Loss 173
Cash Flow Statement 176
Notes to accounts 178
AGM Notice
Notice 245
Proxy form 251
Polling paper 253

Corporate Information
BOARD OF DIRECTORS
WHOLETIME DIRECTORS
Mr. ASHOK DEVINENI, Chairman
Mr. P. TRIVIKRAMA PRASAD, Managing Director
Mr. G.R.K. PRASAD, Executive Director
Mr. C.V. DURGA PRASAD, Director (Business Development)
INDEPENDENT DIRECTORS
Mr. K. BALARAMA REDDI
Dr. E.R.C. SHEKAR
Dr. M.V.G. RAO
Dr. D. NAGESWARA RAO
Dr. C.V. MADHAVI
CHIEF FINANCIAL OFFICER
Mr.T. HARI BABU
COMPANY SECRETARY
Mr. VSN RAJU
BOARD COMMITTEES
AUDIT:
Mr. K.Balarama Reddi, Chairman
Dr. M.V.G.Rao
Dr. D.Nageswara Rao
STAKEHOLDERS RELATIONSHIP:
Mr. K. Balarama Reddi, Chairman
Mr. P.Trivikrama Prasad
Dr. M.V.G.Rao
NOMINATION AND REMUNERATION:
Mr. K.Balarama Reddi, Chairman
Dr. M.V.G.Rao
Dr. D.Nageswara Rao
CORPORATE SOCIAL RESPONSIBILITY:
Mr. D.Ashok, Chairman
Dr. D.Nageswara Rao
Dr. C.V. Madhavi
AUDITORS
M/s. BRAHMAYYA & CO
Chartered Accountants, Hyderabad
COST AUDITORS
M/s. NARASIMHA MURTHY & CO
Cost Accountants, Hyderabad
SECRETARIAL AUDITORS
M/s. P.S. RAO & ASSOCIATES
Company Secretaries, Hyderabad
BANKERS
STATE BANK OF INDIA
ANDHRA BANK
BANK OF INDIA
STATE BANK OF HYDERABAD
UCO BANK
STANDARD CHARTERED BANK
REGISTERED OFFICE
6-3-1109/1 ‘Nava Bharat Chambers’
Raj Bhavan Road Hyderabad - 500 082 (TG), India
REGISTRARS & SHARE TRANSFER AGENTS
KARVY COMPUTERSHARE PVT. LTD.
Karvy Selenium Tower B Plot 31-32, Gachibowli Financial District, Nanakramguda Hyderabad - 500 032, Telangana, India
WORKS
FERRO ALLOY DIVISION
Ferro Alloy Plant (TG) Paloncha - 507 154 Bhadradri Kothagudem District (TG)
Ferro Alloy Plant (Odisha) Kharagprasad Village - 759 121 Dhenkanal Dist.(Odisha)
POWER DIVISION
Power Plant (TG) Paloncha - 507 154 Bhadradri Kothagudem District (TG)
Power Plant (Odisha) Kharagprasad Village - 759 121 Dhenkanal Dist. (Odisha)
Dharmavaram - 534 430 Prathipadu Mandal East Godavari Dist. (A.P)
SUGAR DIVISION
Samalkot - 533 440 East Godavari Dist.(A.P.)
MACHINE BUILDING DIVISION
Nacharam Hyderabad - 500 076 (TG)

2 45th Annual Report 2016-17
Nava Bharat Ventures Limited is a diversified business organization with interests in power generation, ferro alloys, mining as well as sugar and downstream products.
The manufacturing facilities of the Company and its subsidiaries are spread over India and Southern Africa.
The Company has a four decade record of successful operations. It has developed in-house expertise and honed its skills in design, engineering, project management, operation and maintenance of plants in its business verticals.
The core values comprise conservation
of energy and natural resources, environment protection, workplace excellence, maintaining high standards of operational efficiency, nurturing and retaining talent and community development around its manufacturing facilities with initiatives focusing on health, education and development of employment-generating skills.
Minimising the impact on environment shall be a guiding principle in all our business endeavours.
We will be a diversified company with operations in different geographies and adding best value to the available natural resources.
We will ensure that our operations benefit the local community and the nation, while rewarding the stakeholders.
VISION
About Us

CO
MPA
NY
OV
ERV
IEW STA
TUTO
RY R
EPOR
TS FINA
NC
IAL STA
TEMEN
TS NO
TICE
Nava Bharat Ventures Limited 3
POWER Fuel Capacity (MW) Location
Coal 264 Paloncha, Telangana
150 Kharagprasad, Odisha
Bagasse 20 Dharmavaram, Andhra Pradesh
Total generating capacity 434
FERRO ALLOYS Product Capacity (TPA) Location
Manganese Alloys 1,25,000 Paloncha, Telangana
Chromium Alloys 75,000 Kharagprasad, Odisha
Total installed capacity 2,00,000
SUGARProducts: White Crystal Sugar, Rectified Spirit and Ethanol
Plant Capacity Location
Sugar Plant 4,000 tcd Samalkot, Andhra Pradesh
Distillery 20 klpd Samalkot, Andhra Pradesh
Ethanol Plant 30 klpd Samalkot, Andhra Pradesh
Co-gen Plant 9 MW Samalkot, Andhra Pradesh
Business operations
DOMESTIC
INTERNATIONAl
INTERNATIONAL PROJECT SNAPSHOT Country Activity Status
Zambia Integrated coal mining and power generation Coal mine operational. 2x150MW Power Plant commissioned and takeover is in progress
Integrated Sugar Project Under development
Tanzania Commercial agro-based investments Under development
Power Mining Agri-business

4 45th Annual Report 2016-17
Awards and recognitions
National Award for Excellence in Energy Management 2016 as Excellent Energy Efficient Unit from Confederation of Indian Industry (The Odisha Works and Sugar Division received this award). NBVL’s step down subsidiary NBEIL received the award as Energy Efficient Unit
“Increased Juice Drainage Area for all the Mills to Improve Milling Efficiency” implemented by Sugar Division, recognized by CII as an “Innovative Project”
Star Performer – Large Enterprise (Ferro Alloys) for Export Excellence for the year 2014-15 from EEPCINDIA, Southern Region
National Energy Conservation Awards 2016 Certificate of Merit from Bureau of Energy Efficiency, Govt. of India, Ministry of Power (The 114 MW Power Plant at Paloncha received this certificate)
Netmagic Futurist Award for IT -Excellence in Manufacturing Segment, focusing on deployment of Next Generation Business Applications, from Netmagic, India’s leading Managed Hosting and Cloud service provider

CO
MPA
NY
OV
ERV
IEW STA
TUTO
RY R
EPOR
TS FINA
NC
IAL STA
TEMEN
TS NO
TICE
Nava Bharat Ventures Limited 5
Key milestones
1975 19891980Commenced production of ferro silicon at Paloncha, A.P.
Commenced commercial production of manganese and chrome alloys.
Diversified into production of sugar and downstream products at Samalkot, A.P.
1997 20062004Diversified into power generation by catering to captive requirements and selling surplus power.
Company renamed as Nava Bharat Ventures Limited to reflect its multi-vertical business.
Spread its global footprints through Nava Bharat (Singapore) Pte. Limited.
2010 20162015Acquired a large coal mining Company (Maamba Collieries Limited) in Zambia.
Commissioned 300 MW power plant of Maamba Collieries Limited in Zambia.
Financial closure for integrated coal and power project of Maamba Collieries Limited in Zambia

6 45th Annual Report 2016-17

CO
MPA
NY
OV
ERV
IEW STA
TUTO
RY R
EPOR
TS FINA
NC
IAL STA
TEMEN
TS NO
TICE
Nava Bharat Ventures Limited 7
Report on corporate social responsibility
Health Education Livelihoods
Three pillars of CSR initiatives of the Company
1. HEALTH
Preventive health care is a pre-requisite for improving health. Lack of awareness on health care and lack of timely medical attention is causing many avoidable health problems, particularly in slum areas. To address this, Free Health Campaign is organized by Nava Bharat Ventures Ltd. (NBVL or the Company) in slum areas surrounding Paloncha, Telangana. Under this initiative, a medical team visits such areas, conducts examination and gives guidance and medicines to people, free of charge.
Free Health Campaign Impact
No. of visits 50 Improved awareness on health care and timely medical attention
No. of beneficiaries 8,700
Preventive health care is also provided by the Company at the Primary Health Center at Nava Bharat Eye Center, Paloncha, Telangana benefitting 6,286 inhabitants during the year.
EXPENDITURE IN FY 2016-17(` Lakhs)
Healthcare 19.66
Education 48.18
Livelihoods 241.87
Others 10.94
Total 320.652.004% of average net profit for past three years.
Free Health Campaign at Jagguthanda

8 45th Annual Report 2016-17
Schools are the temples of learning. Proper sanitation in schools is a vital requirement for providing congenial atmosphere for learning to all students, particularly girl students. Responding to this basic requirement, the Company constructed toilets at Batchu Foundation Municipal High School in Samalkot, Andhra Pradesh.
Construction of Toilets Impact
No. of students benefitted 850 Improved hygiene
Children of daily wage earners and other economically weaker sections study in government schools. To improve the academic performance of such students and encourage them to continue studies, free tutorials are organised by the Company, in government schools.
Free Tutorials Impact
No. of schools 20 Improved grades from C&D to A&B after attending tutorials
No. of students covered 1,000
Learning through experiments is essential for effective understanding of science subjects but most of the government high schools lack proper laboratory facilities. To fill this gap, the Company has taken up an initiative called “Nava Bharat Vignana Dayini” under which a mobile science laboratory visits various government schools and encourages students to carry out scientific experiments by themselves.
Nava Bharat Vignana Dayini Impact
No. of schools visited 28 Enriched practical scientific knowledge of students in government high schools
No. of students benefitted 6,000
2. EDUCATION
Education enlightens the minds of people. It is a building block for a vibrant and capable society. To promote education, the Company has taken several initiatives:
The Company extended financial assistance /grant-in-aid to schools providing quality education to students in rural and semi-urban areas.
Name of the School No. of students
Nava Bharat High School, Paloncha, Telangana
275
Brahmani Public School, Kharagprasad, Odisha
662
Toilet Block at BF Municipal High School, Samalkot
Free Tutorials, ZPHS Bollurugudem
Moblie Science Laboratory at ZPH School, LakshmidevipalliBrahmani Public School

CO
MPA
NY
OV
ERV
IEW STA
TUTO
RY R
EPOR
TS FINA
NC
IAL STA
TEMEN
TS NO
TICE
Nava Bharat Ventures Limited 9
Use of computers has become an integral part of education. To provide requisite computer education, the Company recruited instructors to teach, enhance skills and familiarise the students with operation of computers, in government schools.
Computer Education Impact
No. of schools 17 Improved computer literacyNo. of instructors employed 17
Proper infrastructure is a pre-requisite for congenial learning atmosphere in schools. The Company constructed a compound wall at Upper Primary School, Masania in Odisha and provided dual desks at Upper Primary School, Charadagadia, Odisha.
Infrastructure in Schools Impact
Compound wall
Upper Primary School, Masania, Odisha (No. of students:50)
Improved ambience and safe atmosphere for learning and playing
Dual desks Upper Primary School, Charadagadia, Odisha (No. of students benefitted: 88 )
Congenial atmosphere for learning
Communication skill in English has become a necessity for development of students. Students in rural areas and especially studying in government schools, lack this skill as they do not get appropriate environment to practice at homes and social set-up to acquire fluency and proficiency in English. To fill this gap, the Company is conducting Supplementary Spoken English Programme in government schools in villages.
Supplementary Spoken English Programme Impact
Classes covered 6th to 10th Improved oral communication skills in English
No. of schools 10
No. of students 2,087
3. LIVELIHOODS
Women empowerment is gaining significant importance everywhere and comprises improving the socio economic strength of women to make them confident enough to play their rightful role in society. To serve this noble cause, the Company has created a Women Empowerment Center (WEC) at Paloncha. WEC is housed in an exclusive building and imparts training in various fields under one roof:• Tailoring & Embroidery• Jute Product making• Palm Leaf Weaving• Sanitary Napkin making• Beautician course
Computer faculty at ZPH School, Lakshmidevipalli
Upper Primary School at Masania, Odisha
Jute Product making at Women Empowerment Center, Paloncha
Supplementary Spoken English session at ZPH School, Kommugudem

10 45th Annual Report 2016-17
Women Empowerment Center Impact
No. of Training courses conducted
5 Created self-employment opportunities for women with earnings of ` 4000 to ` 5000 per month.
No. of women trained during the year
274
New courses introduced during the year:
• Refrigeration & Air Conditioning Technician (in Tie-up with Daikin)
• Two-wheeler Technician (in Tie-up with TVS Motor)
Vocational Training Impact
No. of trades covered 6 Improved employability of youth with earnings of ` 9,000 to ` 23,000 per month in reputed organisations
No. of persons trained during the year
114
4. OTHER CSR INITIATIVES
Accessibility to certain rural areas posses a problem, particularly in monsoon. To mitigate this problem, the Company constructed two culverts in Samalkot under its Rural Development initiative.
Construction of Culverts Impact
Location Samalkot Facilitated and improved accessibility for transportation of agricultural products
No. of culverts constructed
2
With faster pace of economic development, the demand for skilled manpower in India is outstripping the supply, resulting in a significant shortage of skills across several existing trades. New types of skill requirements offering promising employment opportunities are also emerging. Nava Bharat Vocational Institute at Paloncha is contributing to skill development by imparting vocational training to unemployed youth in:
• Welding
• Fitting
• Electrical
• Plumbing
Palm Leaf Weaving at WEC, Paloncha
Two-wheeler Technician
Culvert in SamalkotAir Conditioning Technician

CO
MPA
NY
OV
ERV
IEW STA
TUTO
RY R
EPOR
TS FINA
NC
IAL STA
TEMEN
TS NO
TICE
Nava Bharat Ventures Limited 11
Directors’ reportDear members,
Your directors are pleased to present the 45th annual report and the Company’s audited financial statements (standalone and consolidated) for the financial year ended March 31, 2017.
FINANCIAl SUMMARY
The financial performance of the Company (standalone and consolidated), for the financial year ended March 31, 2017 is summarized below:
(` in lakhs)
Standalone Consolidated
12 months ended
31.03.2017
12 months ended
31.03.2016
12 months ended
31.03.2017
12 months ended
31.03.2016
Turnover/Income (Gross) 1,35,703.17 1,30,236.02 1,77,179.61 1,91,292.81
Profit before Finance charges, Depreciation and Taxation 21,231.00 18,784.42 33,752.06 45,121.24
Less: Finance charges (excluding amount capitalized) 5,008.88 3,172.36 8,651.18 8,767.57
Profit before Depreciation and Taxation 16,222.12 15,612.06 25,100.88 36,353.67
Less : Depreciation 3,707.61 3,392.47 9,040.00 8,371.42
Profit for the year after Depreciation 12,514.51 12,219.59 16,060.88 27,982.25
Less : Provision for taxation - Current tax 2,778.22 2,700.00 4,267.43 6,651.04
- Deferred tax 1,438.78 (206.19) 1,673.70 (3,044.56)
- MAT credit entitlement - (2,030.00) (587.21) (5,278.97)
Profit after Tax 8,297.51 11,755.78 10,706.96 29,654.74
Minority share - (profit) / loss - - (585.56) (1,290.54)
Surplus/deficit of subsidaries sold/written off during the year - - 98.20 -
Balance brought forward from last year 1,47,039.41 1,41,857.56 1,90,929.11 1,69,138.84
Profit available for Appropriation 1,55,336.92 1,53,613.34 2,01,148.71 1,97,503.04
Appropriations
Dividend on Equity Share Capital 2,529.43 4,215.71 2,529.43 4,215.71
Corporate Dividend Tax 514.93 858.22 514.93 858.22
General Reserve - 1,500.00 - 1,500.00
Surplus carried to Balance Sheet 1,52,292.56 1,47,039.41 1,98,104.35 1,90,929.11
1,55,336.92 1,53,613.34 2,01,148.71 1,97,503.04
ECONOMIC AND BUSINESS REVIEW
The global markets have stabilized post the Brexit event and US elections last year. According to the IMF, the world is expected to grow by 3.5% in 2017 led by pickup in advanced economies as well as in emerging economies. Advanced economies’ growth would be led by the USA which is expected to benefit from fiscal policy easing. Europe and Japan will also benefit from a cyclical recovery in global manufacturing and trade that started in the second half of 2016.
India’s GDP is expected to grow by 7.2% in 2017 as it will be affected by demonetization event which happened in November, 2016. However, GDP growth is expected to pick up to 7.7% in 2018 led by favourable macroeconomic scenario, political stability ongoing structural measures like passage of GST etc. Thus India is placed on a sweet spot and is gaining momentum both in domestic and international markets.

12 45th Annual Report 2016-17
REVIEW OF OPERATIONS
The performance of the Company has to be viewed as satisfactory in the overall perspective of cataclysmic changes, the power business has been subjected to, period end adjustments in respect of foreign currency assets and liabilities and significant volatility in the input costs and prices of Manganese Alloys while the Sugar business held its head high during the year under review. The Company, however, envisages that long term sustainability can only be achieved with a paradigm shift of focus centering around industrial consumption of power, monetization of idle or stranded operating assets and stiff conservation of resources.
Turnover for the year 2016-17 stood at ` 1,35,703.17 lakhs compared to ` 1,30,236.02 lakhs in the previous year and the profit after tax stood at ` 8,297.51 lakhs reduced from `11,755.78 lakhs in the previous year.
FERRO AllOYS
The Company witnessed significant volatility in both Manganese Alloy and Chromium Alloy businesses. While the conversion arrangement with Tata Steel Ltd., (TSL) provided stability and decent performance in respect of Ferro Chrome, Silico Manganese was subjected to wild swings in manganese ore costs as well as sales realizations. The overall performance in this business was significantly better than that in FY 2015-16 wherein the Company was able to secure better value addition for captive power than that obtained through sales on power exchange during the year. Accordingly, the Company has focused on higher production of Manganese Alloys and higher conversion volume of Ferro Chrome which will continue through FY 2017-18 and beyond.
POWER
During the period under review, the Power business, reflecting the sector trend, remained quite subdued. The power dispatches in Telangana and Andhra Pradesh were severely impacted by grid curtailments and were further impeded by low power exchange prices. The Power plants in Odisha trailed the weak trend in exchange prices being the only means of dispatch of power and so, operated at low plant load factor (PLF) with the second 60 MW Unit remaining idle throughout the year. Captive consumption of power in the production of manganese alloys and chrome alloys (under Conversion arrangement with TSL) mitigated the situation to some extent. The Company was able to source the coal at reasonable rates and remain competitive to effect sales through power exchange, principally aiming at recovery of a part of fixed costs and maintaining generation at near optimum loads.
The power segment comprises technical support fee forming part of the O & M services fee of the Zambian company to the extent of interim services prior to the 300 MW power plant achieving COD. This fee will form a separate revenue stream from FY 2017-18 onwards.
SUGAR
The Company’s sugar business was robust both in terms of revenues as well as profits in FY 2016-17, reflecting the buoyancy in this sector. This is expected to sustain during FY 2017-18 as well.
BONUS SHARES
Pursuant to the recommendations of the Board of directors and the approval of shareholders at the 44th Annual General Meeting (AGM), the Company allotted bonus shares in the ratio of 1:1 (i.e. one bonus equity share of ` 2/- each for every one existing equity share of ` 2/- each) to all the shareholders of record as on September 3, 2016 (record date). Consequently, the share capital of the Company increased to 17,85,75,482 equity shares of ` 2/- each aggregating to ` 35,71,50,964/- from 8,92,87,741 equity shares of ` 2/- each aggregating to ` 17,85,75,482/-.
DIVIDEND
Given the weak trend in the power business and the need to conserve resources, your Board of directors considered it fit to prune the dividend outgo and recommended a dividend on the equity shares at ` 1/- per equity share of ` 2/- each for the FY 2016-17 on the expanded share capital due to bonus issue of shares, subject to shareholders’ approval at the ensuing AGM. The aggregate dividend payout amounts to ` 16.86 crores, excluding corporate dividend tax of ` 3.43 crores.
RESERVES
No amounts were proposed to be transferred to Reserves for the period under review.
FIXED DEPOSITS
The Company has not accepted any deposits from Public and as such, no amount on account of principal or interest on deposits from public was outstanding as on the date of balance sheet.
lISTING OF EQUITY SHARES
The securities of the Company are listed at National Stock Exchange of India Limited (NSE) and BSE Limited (BSE).
During the year under review, the Company issued and allotted 8,92,87,741 fully paid-up bonus equity shares of ` 2/- each and the same have been listed on the NSE and BSE on September 16, 2016.
Further, the Company has no equity shares carrying differential rights.
INDIAN ACCOUNTING STANDARDS
The Ministry of Corporate Affairs (MCA) vide its notification Official Gazette dated February 16, 2015, notified the Indian Accounting Standards (Ind AS) applicable to certain class of companies. Ind AS has replaced the existing Indian
Directors’ ReportC
OM
PAN
Y O
VER
VIEW
STATU
TORY
REPO
RTS FIN
AN
CIA
L STATEM
ENTS N
OTIC
E
Nava Bharat Ventures Limited 13
GAAP prescribed under Section 133 of the Companies Act, 2013 read with Rule 7 of the Companies (Accounts) Rules, 2014.
Your Company has been covered under Ind AS with effect from April 1, 2016. The reconciliation and description of the effect of the transition from IGAAP to Ind AS have been provided in the notes to accounts to the financial statements.
SUBSIDIARY COMPANIES
The Company has Indian and overseas direct and step down subsidiaries.
Consolidated financial statements have been prepared by the Company in accordance with the requirements of Ind AS 110 issued by MCA and as per the provisions of the Companies Act, 2013.
As per the provisions of Section 136 of the Companies Act, 2013, separate audited financial statements of subsidiary companies are made available on the Company’s website www.nbventures.com and the Company shall furnish a hard copy of annual reports of the subsidiary companies to any shareholder on demand at any point of time.
The annual accounts of the subsidiary companies shall also be available for inspection by any shareholder in the registered offices of the holding Company and of the subsidiary companies concerned.
A report on the performance and financial position of each of the subsidiaries, associates and joint venture companies included in the consolidated financial statements pursuant to Rule 8(1) of Companies (Accounts) Rules, 2014 is enclosed as Annexure - 1 to this report.
Statement containing the salient features of the financial statement of subsidiaries and associate Companies for the year ending March 31, 2017 in Form AOC-1 (Pursuant to first proviso to Sub-Section (3) of Section 129 read with Rule 5 of Companies (Accounts) Rules, 2014) is enclosed at the end of the notes on Accounts to Financial Statements.
OVERSEAS CORPORATE STRUCTURE
The Company has overseas investments in Coal Mining, Power Generation, Operation & Maintenance Services and Commercial Agriculture, spread across different geographical regions. The Company has created different intermediate holding companies being wholly owned subsidiaries in Singapore to cater separately to; Power Generation through Nava Bharat (Singapore) Pte. Ltd; O&M Services through Nava Energy Pte. Ltd; and Commercial Agriculture through Nava Agro Pte. Ltd. This structure will facilitate investment pursuits in a focused manner, aside from induction of investors at appropriate time. All the investments henceforth will be routed through respective wholly owned subsidiaries in Singapore.
NAVA BHARAT (SINGAPORE) PTE. lIMITED (NBS)
NBS, a wholly owned subsidiary of the Company in Singapore, was the investment arm and holding Company of the overseas strategic investments while rendering trading services for ferro alloys within the Group. Henceforth, NBS will control the investments in coal and power generation, principal investment being in Zambia.
MAAMBA COllIERIES lIMITED (MCl)
MCL is a step down subsidiary of the Company in Zambia with NBS holding 64.69% of the equity stake while the balance 35.31% is held by ZCCM Investments Holdings Plc and others. MCL has the largest coal concession in Zambia and has revamped the Coal Mine operations and established a 300 MW (2 X 150 MW) Coal Fired Power Project at a net capital outlay of USD 843 million. The means of finance include long term debt of USD 590 Million, Equity funds of USD 253 Million from Sponsors and pre-COD power sale revenues. The 300 MW Power Plant was commissioned in phases by December 2016. Both the Units have since stabilized MCL is awaiting the approval of the Lenders and their Technical Advisors for Take Over of the Power Plant from the EPC Contractor and declare Commercial Operations Date (COD). As the Power Plant has been in a state of readiness, COD will be declared in consultation with all the stake holders in accordance with the prevailing IFRS regulations. Accordingly, the 300 MW Power Plant operations will form part of Consolidated Financials for a part of FY 2018 and thereafter.
For FY 2017, MCL made an operating profit of USD 2,296,998 (after tax) on a total income of USD 10,178,987, aided by Deferred Tax benefit, while the high grade coal operations have been flat owing to limited off take opportunities in and around Zambia. The Coal mining operations will get a fillip upon commencement of commercial operations in the 300 MW Power Plant which requires about 1.6 Million tons of coal per annum. The Coal mine has substantial SAMREC compliant coal resource which can address all the fuel requirements of not only the 300 MW Power Plant but also its expansion schemes for considerable length of time.
NAVA BHARAT lAO ENERGY PTE. lIMITED (NBlE)
NBLE, Singapore, was 100% owned by NBS and NBLE was holding 70% stake in Namphak Power Company Limited (NPCL), the Hydro Power Project Company in Laos. During FY 2016-17, Nava Bharat (Singapore) Pte. Ltd (NBS) exited from the Laos Hydro Power Project by divesting its entire stake of 100% in NBLE and so, indirect stake of 70% equity in the project company (NPCL), in favour of Chaleun Sekong Group (CS Group) of Laos. The sale process of NBLE to CS Group was completed in two tranches in FY 2016-17 whereby both NBLE and NPCL ceased to be subsidiaries of NBS and of Nava Bharat Ventures Limited.

14 45th Annual Report 2016-17
NAVA ENERGY PTE. lIMITED, SINGAPORE (NEPl)
NEPL, Singapore, is a wholly owned subsidiary (WOS) of the Company and is the intermediate holding company in Singapore, engaged in O&M services of power plants abroad. It will avail technical support from Nava Bharat Ventures Limited, the Holding Company, with requisite expertise and operating experience of power plants and supplement it with technical support from Original Equipment Manufacturers (OEMs) or EPC contractors, as required.
NEPL has secured the O&M contract from Maamba Collieries Ltd (MCL) for the latter’s 300 MW coal fired power plant in Zambia. For due performance of obligations under the O&M contract, NEPL has inter alia entered into a Long Term Technical Support Agreement with the Indian Holding Company which has also extended performance guarantee and bank guarantees as required under the O&M Contract with MCL. Your Company considers this as an opportunity to leverage its rich experience in power plant operations, gained assiduously over the last three decades while a distinct revenue stream is established in O&M services.
NEPL has set up a Zambian company, Nava Energy Zambia Limited (NEZL) as its WOS to facilitate compliance with local laws in engagement of subcontractors and employees to discharge the O&M Contract obligations.
The Company expects that its O& M experience in MCL will establish its foot print in this emerging service which it can leverage for further opportunities in this space.
NAVA ENERGY ZAMBIA lIMITED, ZAMBIA (NEZl)
Nava Energy Zambia Limited is a Zambian Step down subsidiary and a WOS of NEPL. NEZL has engaged qualified and experienced personnel and Sub-contractors in Zambia. It is set to render the O&M Services for the 300 MW Power Plant of MCL from the Commercial Operations Date, expected shortly, for an initial period of 10 years. In order to achieve smooth transition from the construction phase to operations phase, NEZL has established its presence at the site for the last one year to participate in all the commissioning activities.
During the Financial year 2017, the O&M operations at MCL did not commence and so, NEPL/NEZL have rendered only interim services by themselves and through sub-contractors as prescribed under the O& M Contract.
NAVA AGRO PTE. lIMITED, SINGAPORE (NAPl):
NAPL is a wholly owned subsidiary of the Company and is intended to be the intermediate holding company in Singapore to pursue investments in commercial agriculture and related businesses, initially in Africa. It is proposed to transfer the investments currently in Tanzania, held by NBS, into this holding company.
Kawambwa Sugar Limited (formerly Kariba Sugar Limited) (KSL) is a Zambian company which has been allocated 10,000 ha of land by the Government of Zambia to pursue Sugar business initially. During the year under review, NAPL acquired 100% shareholding of KSL. At present KSL is engaged in Environmental Impact Assessment Study and Detailed Feasibility evaluation for establishing a Sugar manufacturing plant on the land concession. An appropriate investment decision will be taken by your Board after evaluating the findings of EIA and the DPR.
KAWAMBWA SUGAR LIMITED, ZAMBIA (KSL) (formerly known as Kariba Sugar Limited)
Kawambwa Sugar Limited (KSL) was incorporated in Zambia and became a subsidiary of NAPL during FY 17. It has secured approval of the Government of Zambia for allocation of 10,000 Ha of land in Luena Farm Block, North Western province of Zambia to set up an Integrated Sugar Complex.
Kawambwa Sugar Limited has engaged Consultants to carry out Environmental Impact Assesment study and Detailed Feasibility and an appropriate investment decision will be taken shortly.
NB TANAGRO lIMITED, TANZANIA (NBTl)
NBTL is a Step down subsidiary in Tanzania and has been pursuing investment in Oil Palm. NBS holds 80% in NBTL while the balance 20% is held by National Development Corporation of Tanzania. NBTL currently awaits allocation of land from the Government. The shareholding of NBS is proposed to be transferred to NAPL as part of restructuring of investments in Agri space.
NB RUFIJI PVT. lIMITED, TANZANIA (NBRPl)
NBRPL is another step down subsidiary in Tanzania, pursuing investment in Oil Palm. NBRPL is a WOS of NBS and is engaged with Rufizi Development Authority for facilitating land allocation following which investment plans will be drawn up. The shareholding of NBS is proposed to be transferred to NAPL as part of restructuring of investments in Agri space.
KARIBA INFRASTRUCTURE DEVElOPMENT lIMITED, ZAMBIA (KIDl)
As the proposed multi facility Economic Zone project could not be established in Zambia, KIDL applied and was struck off from the register of companies and therefore ceased to be in existence.
INDIAN SUBSIDIARIES
NAVA BHARAT ENERGY INDIA lIMITED (NBEIl)
NBEIL is a step down, but wholly owned, subsidiary of the Company with 26% of equity directly held by NBVL and 74% being held through Nava Bharat Projects Limited (NBPL).

Directors’ ReportC
OM
PAN
Y O
VER
VIEW
STATU
TORY
REPO
RTS FIN
AN
CIA
L STATEM
ENTS N
OTIC
E
Nava Bharat Ventures Limited 15
Nava Bharat Energy India Limited (NBEIL) operated the 150 MW Independent Power Unit in Telangana on merchant basis with an average PLF of 53.71% during FY 2016-17. During the period under review, the grid off take was dismal and the alternative power market on IEX wasn’t remunerative. The situation is aggravated owing to increase in e-auction coal prices with no pass through arrangement.
NAVA BHARAT PROJECTS lIMITED (NBPl)
NBPL is a WOS of the Company and is engaged in project management support, trading/export of goods or equipments.
Enforcement Directorate, Hyderabad: The Enforcement Directorate, Hyderabad, (ED) vide its Provisional Attachment Order dated July 22, 2014 attached to the extent of ̀ 138.59 crores in respect of the investment made by the Company in the share capital of Nava Bharat Energy India Limited and the said Provisional Attachment Order was also confirmed by the Adjudicating Authority under Prevention of Money Laundering Act, 2002 vide Order dated May 20, 2015.
Subsequently, the ED issued a letter dated July 9, 2015 to Nava Bharat Projects Limited requesting to transfer entire 73,99,99,994 equity shares of `2/- each of face value of Nava Bharat Energy India Limited held by the Company within one week. Against the said confirmation Order of the Adjudicating Authority and letter dated July 9, 2015 of ED, an appeal was filed before the Appellate Tribunal constituted for hearing the appeals against the Order of the Adjudicating Authority under PMLA. The Appellate Tribunal granted stay against operation of the Letter dated July 9, 2015, subject to certain conditions vide Order dated July 30, 2015 and the said stay has been extended from time to time, until August 28, 2017 on which date the appeal stands posted for final hearing.
BRAHMANI INFRATECH PRIVATE lIMITED (BIPl)
BIPL is a subsidiary of the Company with 65.74% equity stake. Following the surrender of land of SEZ back to the Government, BIPL has been engaged in investments in urban lands and properties to diversify its portfolio and to pursue urban infrastructural development.
Following the cessation of SEZ activity and surrender of land, BIPL has been embroiled in protracted litigation including Arbitration of disputes with Mantri Group, its Co-developer and Technical Associate for SEZ.
The Arbitration Award by the Hon’ble Arbitrator is currently being disputed by BIPL and Mantri Group on separate grounds and is sub-judice.
Mantri Technology Parks Private Limited (MTPPL) sought for injunction restraining the asset management company / mutual funds in repaying to the Company on maturity, before the Civil Courts, Hyderabad, OP No 571/2015, under Section 9 of the Arbitration and Conciliation Act, 1996. The Company is contesting the same and is sub-judice.
BIPL and MTPPL both have filed cross applications before Civil Court Hyderabad, seeking reliefs against each other in setting aside the Arbitration Award no. 2/2013 under Sec 34 of the Arbitration and Conciliation Act, 1996 with regard to such portion of the Award favouring other party.
CLB matter: The Company Petition no. 42 of 2011 and its associated Applications CA 140 & 141 of 2012 filed by Malaxmi Infra Ventures Pvt. Ltd. one of the shareholders of BIPL in Company Law Board, Chennai Bench, were transferred to National Company Law Tribunal, Hyderabad Bench. The Hon’ble Hyderabad Bench, vide its Order dated January 31, 2017 held that the transaction for the cancellation of the land in question by APIIC is bonafide one and it is in the best interest of the BIPL and the same is legal. Interim Orders dated June 10, 2011 stand vacated and CA Nos.140 & 141 of 2012 also stand dismissed with no order as to costs and BIPL was directed to appoint Mr. Y. Harish Chandra Prasad as Director in accordance with its Articles of Association, within a reasonable time. On an Appeal filed by BIPL, the Hon’ble National Company Law Appellate Tribunal, New Delhi (NCLAT) seeking to set aside the Order to the extent of direction to appoint Mr. Y. Harish Chandra Prasad as director on the Board of BIPL. The Appeal was and the said impugned direction was set aside on April 17, 2017.
NAVA BHARAT REALTY LIMITED AND NAVA BHARAT SUGAR AND BIO FUELS LIMITED
Both, Nava Bharat Realty Limited and Nava Bharat Sugar and Bio Fuels Limited applied for strike off from the register of companies as there have been no operations in these Companies. They have therefore ceased to be subsidiaries of the Company.
KINNERA POWER COMPANY PVT.LTD (KPCPL) (Associate Company)
KPCPL is an associate of the Company with 26% equity stake and continues to hold the same as specified by National Highway Authorities of India (NHAI). As per the professed intention and there being no economic interest, the Company plans to fully off-load its stake in KPCPL in favour of Meenakshi Infra Group in due course as per the regulations. Accordingly, no economic interest from KPCPL is being factored in the consolidated financials nor the accounts of KPCPL appended in the Annual report of the Company.
OUTlOOK AND FUTURE PlANS
“Management Discussion and Analysis” contains a section on the Company’s outlook and future plans and members may please refer the same on this.
CHANGE IN THE NATURE OF BUSINESS
There has been no change in the nature of business of the Company during the year under review.

16 45th Annual Report 2016-17
CONSERVATION OF ENERGY, TECHNOLOGY ABSORPTION AND FOREIGN EXCHANGE
In accordance with the provisions of Section 134 (3)(m) of the Companies Act, 2013 read with Companies (Accounts) Rules, 2014, the required information relating to conservation of energy, technology absorption and foreign exchange earnings and outgo have been enclosed as Annexure - 2, to this Report.
CORPORATE SOCIAL RESPONSIBILITY (CSR)
Your Company is committed towards betterment of society and protection of environment with constant efforts to build and nurture long lasting relationships with the society. Further, the Company’s CSR initiatives/ activities aim at improving quality of life of the communities and stakeholders in general and communities around the Company’s manufacturing facilities, in particular, and, to contribute towards economic development of the society from which your Company draws resources for its operations.
Your Company continue to remain focused on improving the quality of life and engaging communities through education, livelihood, health, drinking water and sanitation, enhancing vocational skills, empowering women, etc. During the year under review, the Company spent over ` 320 Lakhs on CSR activities. The annual report on CSR activities, in terms of Section 135 of the Companies Act, 2013 read with rule 8 of Companies (Corporate Social Responsibility Policy) Rules, 2014, is enclosed as Annexure - 3 to this Report.
EXTRACT OF ANNUAL RETURN
In accordance with Section 134(3)(a) of the Companies Act, 2013, an extract of the annual return in the prescribed format is enclosed as Annexure - 4 to this Report.
CONTRACTS OR ARRANGEMENTS WITH RELATED PARTIES
The particulars of contracts or arrangements with related parties referred to in sub-section(1) of Sec.188 in Form No. AOC-2 pursuant to clause (h) of sub-section (3) of Section 134 of the Act and Rule 8(2) of the Companies (Accounts) Rules, 2014 are enclosed as Annexure - 5 to this Report.
The policy on materiality of related party transactions and also on dealing with the related party transactions as approved by the Audit committee and the Board of directors was placed on the website of the Company under the web link: http://www.nbventures.com/corporate_policies.htm
PARTICULARS OF LOANS, GUARANTEES OR INVESTMENTS
The details of loans given, guarantees provided and investments made during the Financial Year ended on March 31, 2017 are enclosed in Annexure - 6 to this Report in compliance with the provisions of Section 186 of the Companies Act, 2013 read with the Companies (Meetings of the Board and its Powers) Rules, 2014. The particulars of aggregate loans, guarantees and investments under Section 186 of the Companies Act, 2013 are disclosed in Financial Statements which may be read as part of this Report.
MANAGEMENT DISCUSSION AND ANALYSIS
The Management Discussion and Analysis Report for the year under review as stipulated under Regulation 34 of SEBI (Listing Obligations and Disclosure Requirements) Regulations, 2015 (SEBI LODR) is presented in a separate section forming part of this Report.
BUSINESS RESPONSIBILITY REPORT
As per regulation 34(f) of SEBI LODR, the annual report shall contain business responsibility report (BRR) describing the initiatives taken by the Company from environmental, social and governance perspective. However, SEBI having regard to the green initiative, clarified vide its press release dated November 30, 2015 that the Company can place BRR on its website and provide website link for the same in the annual report. Accordingly, the BRR is made available on the Company’s website at http://www.nbventures.com/corporate_policies.htm
CORPORATE GOVERNANCE
Your Company is committed to achieve the highest standards of Corporate Governance and adheres to the Corporate Governance requirements set by the Regulators/applicable laws.
A separate Report on Corporate Governance as stipulated under Regulation 34(3) of SEBI (LODR) Regulations, 2015 is attached hereto as a part of this report. The report on Corporate Governance also contains certain disclosures required under the Companies Act, 2013.
Disclosure under Reg. 34(3) & Schedule V of SEBI (Listing Obligations and Disclosure Requirements) Regulations, 2015.

Directors’ ReportC
OM
PAN
Y O
VER
VIEW
STATU
TORY
REPO
RTS FIN
AN
CIA
L STATEM
ENTS N
OTIC
E
Nava Bharat Ventures Limited 17
Related Party disclosure as per Schedule V of SEBI (LODR) Regulations, 2015 (` in lakhs)
S. No
In the accounts of Particulars
Amounts at the year
ended 2016-17
Maximum Amount of
Loans/ Advances/ Investments
outstanding during the year 2016-17
1 Nava Bharat Ventures Limited (NBVL)(Holding Company)
Loan Given to:-
Nava Bharat (Singapore) Pte. Ltd. (Wholly Owned Subsidiary of NBVL)
46,364.18 51,343.75
2 Nava Bharat Ventures Limited(Holding Company)
Investment by the Loanee i.e., Nava Bharat (Singapore) Pte. Ltd.(Wholly owned Subsidiary of NBVL)
In the shares of subsidiary companies i.e.,
1. Maamba Collieries Limited 83,828.68 83,828.68
2. Nava Energy Zambia Limited 0.58 0.58
DIRECTORS
The Board of directors of the Company has a combination of Executive, Non-Executive and Independent Directors. The Board comprises nine directors of which five constituting more than half of the total strength are Non-Executive and Independent Directors.
INDEPENDENT AND NON-EXECUTIVE DIRECTORS
As prescribed under LODR Regulations and as per Section 149(6) of the Companies Act, 2013, the particulars of Non-Executive and Independent Directors are as under:
Mr. K. Balarama Reddi, Dr. E.R.C. Shekar, Dr. M.V.G. Rao, Dr. D. Nageswara Rao and Dr. C.V. Madhavi.
They were appointed as Independent Directors by the shareholders at 42nd AGM on August 08, 2014 for a term of 5 (five) years.
WHOlETIME DIRECTORS
Mr. D. Ashok, Mr. P. Trivikrama Prasad, Mr. GRK Prasad and Mr. CV Durga Prasad
None of the directors on the Board is a member of more than ten Committees across all the Companies in which directorship is held. Necessary disclosures regarding committee positions in other public companies as on March 31, 2017 have been made by the Directors.
DEClARATIONS OF INDEPENDENT DIRECTORS
The independent directors declared pursuant to section 149(7) of the Companies Act, 2013 affirming that they meet the criteria of independence as provided in sub-section (6) of section149 of the Companies Act, 2013.
CHANGES IN DIRECTORS AND KEY MANAGERIAL PERSONNEL:
During the year under review, there was no change in the constitution of the Board.
However, Mr. P.Trivikrama Prasad was re-appointed as Managing Director, by the members with effect from March 19, 2017 for a period of 5 years at the Annual General Meeting held on August 24, 2016.
Mr.M.Subrahmanyam, Company Secretary & Vice President, retired on attaining superannuation and Mr.VSN Raju was appointed as Company Secretary & Vice President with effect from June 1, 2016.
DIRECTORS RETIRING BY ROTATION
Pursuant to the provisions of the Companies Act, 2013, Mr. G.R.K Prasad retires at the AGM and, being eligible, offered himself for re-appointment.
NUMBER OF MEETINGS OF THE BOARD
Regular meetings of the Board are held to discuss and decide on various business policies, strategies and other businesses. The schedule of the Board /Committee meetings are circulated to the Directors in advance to enable them to plan their schedule for participation in the meetings.
The Board met seven (7) times during the FY 2016-17 viz. on May 30, 2016, July 22, 2016, August 24, 2016, September 7, 2016, November 17, 2016, January 30, 2017 and March 10, 2017.
PERFORMANCE EVAlUATION OF THE BOARD
Pursuant to the provisions of the Companies Act, 2013 and SEBI (LODR) Regulations, 2015, the Board has carried out

18 45th Annual Report 2016-17
annual performance evaluation of its own performance, the Directors individually as well as the working of its Audit committee, Nomination and Remuneration committee, Corporate Social Responsibility committee and Stakeholders Relationship committee. A structured set of criteria was adopted after taking into consideration the inputs received from the Directors, covering various aspects of the Board’s functioning such as adequacy of the composition of the Board and its Committees, Board culture, execution and performance of specific duties, obligations and governance. Evaluation of the Board Members is conducted on an annual basis by the Board, Nomination and Remuneration committee and Independent Directors with specific focus on the performance and effective functioning of the Board and Individual Directors.
The Nomination and Remuneration committee and the Board of directors had laid down criteria for performance evaluation of directors, Committees and Board as a whole.
Performance indicators for evaluation of Independent Directors:
Independent Directors have three key roles – governance, control and guidance. Some of the performance indicators based on which the Independent Directors are evaluated are:
Ability to contribute to and monitor corporate governance practices.
Ability to contribute by introducing international best practices to address top management issues.
Active participation in long term strategic planning.
Commitment to the fulfillment of a Director’s obligations and fiduciary responsibilities.
Attendance: The performance evaluation of Independent or Non-Executive Members is done by the Board annually based on criteria of attendance and contributions at Board/Committee Meetings as also the role played other than at Meetings.
The evaluation process also considers the time spent by each of the Board Members, core competencies, personal characteristics, accomplishment of specific responsibilities and expertise.
REMUNERATION POlICY
The Company adopted a policy relating to the remuneration. This Policy covers the remuneration and other terms of employment for the Company’s Executive Team. The remuneration policy for Members of the Board and for Management, aims at improving the performance and enhancing the value of the Company by motivating and retaining them and to attract the right persons to the right jobs in the Company. The object of this Remuneration Policy is to make your Company a desirable workplace for
competent employees and thereby secure competitiveness, future development and acceptable profitability. In order to achieve this, it is imperative that the Company is in a position to offer competitive remuneration in all its operational locations.
Neither the Managing Director nor any Whole-time Director of the Company received any remuneration or commission from any of its Subsidiaries.
A detailed policy on remuneration of the Directors and Senior Management is placed on the Company’s website under the weblink: http://www.nbventures.com/corporate_policies.htm also enclosed as Annexure - 7 to this Report.
POLICY FOR SELECTION OF DIRECTORS AND DETERMINING DIRECTORS’ INDEPENDENCE
The Nomination and Remuneration committee identifies persons who are qualified to become directors and who may be appointed in senior management in accordance with the criteria laid down and recommend to the Board their appointment and removal.
THE CRITERIA FOR THE APPOINTMENT OF DIRECTORS, KMPS AND SENIOR MANAGEMENT
A person for appointment as director, KMP or in senior management should possess adequate qualification, expertise and experience for the position considered for appointment. The Committee decides whether qualification, expertise and experience possessed by a person are sufficient for the concerned position. The committee ascertains the credentials and integrity of the person for appointment as director, KMP or senior management level and recommends to the Board his / her appointment.
The Committee, while identifying suitable persons for appointment to the Board, will consider candidates on merit against objective criteria and with due regard for the benefits of diversity on the Board.
The Nomination and Remuneration committee shall assess the independence of directors at the time of appointment; re-appointment and the Board shall assess the same annually. The Board shall re-assess determination of independence when any new interests or relationships are disclosed by a Director.
The criteria of independence are determined as laid in the Companies Act, 2013 and SEBI (Listing Obligations and Disclosure Requirements) Regulations, 2015.
The Independent Directors shall abide by the Code for independent directors as specified in Schedule IV of the Companies Act, 2013.
COMMITTEES OF THE BOARD
Currently the Board has four committees: The Audit committee, Nomination and Remuneration Committee, Corporate Social Responsibility Committee, and Stakeholders Relationship Committee.

Directors’ ReportC
OM
PAN
Y O
VER
VIEW
STATU
TORY
REPO
RTS FIN
AN
CIA
L STATEM
ENTS N
OTIC
E
Nava Bharat Ventures Limited 19
A detailed note on the Board and its Committees is provided under the Corporate Governance Report section in this Report. The Composition of the Committees and compliances, as per the applicable provisions of the Act and Rules, are as follows:
Name of the Committee
Composition of the Committee
Remarks
Audit Committee Mr. K Balarama Reddi, Chairman The Audit committee of the Board of directors was constituted in conformity with the requirements of Section 177 of the Companies Act, 2013 and SEBI (LODR) Regulations and its role has been the same as stipulated in the Act and the Regulations mentioned above.
All recommendations made by the Audit committee during the year were accepted by the Board.
Dr. M.V.G.Rao, Member
Dr. D.Nageswara Rao, Member
Nomination and Remuneration Committee
Mr. K Balarama Reddi, Chairman The Nomination and remuneration committee of the Board of directors was constituted in conformity with the requirements of Section 178 of the Companies Act, 2013 and Regulation 19 of SEBI (LODR) Regulations, 2015 and its role has been the same as stipulated in the Act and the Regulations mentioned above.
Dr. M.V.G.Rao, Member
Dr. D.Nageswara Rao, Member
Corporate Social Responsibility Committee
Mr. D.Ashok, Chairman The Corporate Social Responsibility committee of the Board of directors was constituted in conformity with the requirements of Section 135 of the Companies Act, 2013.
The Committee monitored the implementation of the CSR Policy from time to time.
Dr. D.Nageswara Rao, Member
Dr. C.V.Madhavi, Member
Stakeholders Relationship Committee
Mr. K Balarama Reddi, Chairman The Stakeholders Relationship committee of the Board of directors was constituted in conformity with the requirements of Section 178 of the Companies Act, 2013 and Regulation 20 of SEBI (LODR) Regulations, 2015 and its role has been the same as stipulated in the Act and the Regulations mentioned above.
Mr. P Trivikrama Prasad, Member
Dr. M.V.G.Rao, Member
PARTICUlARS OF EMPlOYEES
The names and other particulars of employees in accordance with the provisions of Section 197(12) of the Companies Act, 2013, read with Rule 5(1) of the Companies (Appointment and Remuneration of Managerial Personnel) Rules, 2014, are enclosed as Annexure - 8 to this Report.
Particulars of every employee employed throughout the financial year and in receipt of remuneration of Rupees One Crore and Two lakhs or more, or employed for part of the year and in receipt of ` 8.50 lakhs or more per month, under Rule 5(2) of the Companies (Appointment and Remuneration of Managerial Personnel) Rules 2014, are enclosed as Annexure- 9 to this Report.
NAVA BHARAT VENTURES GENERAl EMPlOYEES BENEFITS SCHEME
Nava Bharat Ventures Employee Welfare Trust (established vide Indenture of Trust dated January 25, 2012) has been reconstituted and aligned with the SEBI (Share Based Employee Benefits) Regulations, 2014 by suitably amending the Trust Deed in line with the Regulations and General Employees Benefits Scheme with the current Regulations,
falling under Part D of the Regulations in accordance with the Special Resolution passed by the members in the 43rd Annual General Meeting held on August 27, 2015.
The scheme is in compliance of SEBI (Share Based Employee Benefits) Regulations 2014, as applicable. The Scheme is implemented as specified by SEBI in the Regulations.
Presently, the Trust holds 1.57% of the total paid up share capital of the Company as on March 31, 2017. Since Shares constitute about 91.52% of the total assets held by the EWT for GEBS, the Company and the Trust have to dispose of the surplus shares over and above 10% of its total assets, which the Trust can retain in accordance with SEBI Regulations, before October 28, 2019.
The Company and the Trust shall, after retaining 28,838 shares which it is eligible to retain under the Regulations, have to sell the surplus 27,71,162 shares within a period of five years from the date of the Regulations i.e. before October 28, 2019.

20 45th Annual Report 2016-17
Auditor’s Certificate pursuant to Regulation 13 of SEBI (Share Based Employee Benefits) Regulations, 2014 in respect of Nava Bharat Ventures General Employee Benefits Scheme, 2015 would be placed in the meeting.
The prescribed details are disclosed on the Company’s website under the link: http://www.nbventures.com/corporate_policies.htm
The Trustee shall not be eligible to exercise voting rights in General Meetings on the shares of the Company held by the Trust.
Pursuant to Rule 16 of Companies (Share Capital and Debentures) Rules, 2014, it is disclosed that the Trustee abstained from voting at the AGM held on August 24, 2016.
EMPlOYEES’ STOCK OPTION SCHEME
During the year under review, no employee stock options were granted. No ESOPs were also exercised as there were no outstanding options as at the beginning of the year.
DIRECTORS’ RESPONSIBIlITY STATEMENT
Directors confirm that:
(a) in the preparation of the annual accounts, the applicable accounting standards had been followed along with proper explanation relating to material departures;
(b) they selected such accounting policies and applied them consistently and made judgments and estimates that are reasonable and prudent so as to give a true and fair view of the state of affairs of the company at the end of the financial year and of the profit and loss of the company for that period;
(c) they took proper and sufficient care for the maintenance of adequate accounting records in accordance with the provisions of the Act for safeguarding the assets of the company and for preventing and detecting fraud and other irregularities;
(d) they prepared the annual accounts on a going concern basis;
(e) they laid down internal financial controls to be followed by the company and that such internal financial controls were adequate and operating effectively; and
(f) they devised proper systems to ensure compliance with the provisions of all applicable laws and that such systems were adequate and operating effectively.
STATUTORY AUDITORS & AUDITOR’S REPORT
M/s. Brahmayya & Co., Chartered Accountants, Hyderabad, the Statutory Auditors of the Company, holds office till the
conclusion of the ensuing Annual General Meeting (AGM). They were appointed as Auditors of the Company during the transitional period of 3 years at the 42nd AGM held on August 8, 2014 subject to ratification by the members at every AGM held after 42nd AGM. Their appointment was ratified at the 43rd and 44th AGM held on August 27, 2015 and August 24, 2016 till the conclusion of next AGM (44th and 45th AGM) respectively.
Certain figures forming part of the statement of assets and liabilities for the years ended March 31, 2016 and 2017 filed by the Company with stock exchanges earlier, have been further reclassified by the statutory auditors in the accompanying financial statements for better clarity under IND-AS regulations. This has no impact on the reported financial positions.
The Auditors’ Report on the financial statements of the company for financial year ended March 31, 2017 does not contain any reservation, qualification or adverse remarks and their report together with notes to Financial Statements are self-explanatory and hence do not call for any further comments under Section 134 of the Companies Act, 2013.
The term of the existing statutory auditors (M/s. Brahmayya & Co) expired and the transitional period of 3 years as allowed under the Act will also expire at the conclusion of 45th AGM of the Company.
The Board of directors upon the recommendations of Audit committee recommended the appointment of M/s. Walker Chandiok & Co., Chartered Accountants (Firm Regn. No. 001076N / N500013) for a period of 5 years as the auditors of Company from the conclusion of 45th AGM till the conclusion 50th AGM, subject to the approval of shareholders at the 45th AGM and ratification every year thereafter, in compliance with the mandatory rotation of statutory auditors as required under Companies Act, 2013.
COST AUDIT
The Board appointed M/s. Narasimha Murthy & Co., Cost Accountants, as Cost Auditors for conducting the audit of cost records of the Company for Sugar, Industrial Alcohol, Steel (Ferro Alloys) and Electricity for the Financial Year 2016-17 on the recommendations of the Audit committee. The same was ratified by the Members at the 44th Annual General Meeting held on August 24, 2016.
The Cost Audit reports for FY 2015-16 were filed with Ministry of Corporate Affairs on September 12, 2016.
Further, the Board of directors based on the recommendations of the audit committee, appointed M/s. Narasimha Murthy & Co., Cost Accountants, as Cost Auditors for conducting the audit of cost records of the Company for Sugar, Industrial Alcohol, Steel (Ferro Alloys) and Electricity for the FY 2017-18 and their remuneration be subject to ratification of members at the ensuing AGM.
Directors’ ReportC
OM
PAN
Y O
VER
VIEW
STATU
TORY
REPO
RTS FIN
AN
CIA
L STATEM
ENTS N
OTIC
E
Nava Bharat Ventures Limited 21
INTERNAL AUDITORS FOR COSTING SYSTEMS AND COST ACCOUNTING RECORDS
M/s. Sagar & Associates, Internal Auditors conducted internal audit of cost records for the Financial Year 2016-17.
The Board appointed M/s Sagar & Associates, as Internal Auditors for conduct of internal audit of cost records for the Financial Year 2017-18.
SECRETARIAL AUDIT
As per the provisions of Section 204 of the Companies Act, 2013, the Board of directors appointed M/s.P.S.Rao & Associates, Practicing Company Secretaries, to conduct secretarial audit pursuant to the recommendations of the Audit committee for the Financial Year 2016-17.
The Secretarial Audit Report for the financial year ended March 31, 2017 issued by Practicing Company Secretary is enclosed as Annexure - 10 to this Report and does not contain any reservation, qualification or adverse remarks.
Further, the Board appointed M/s.P.S.Rao & Associates, Practicing Company Secretaries to conduct secretarial audit pursuant to the recommendations of the Audit committee for the FY 2017-18.
MATERIAL CHANGES AND COMMITMENTS
There have been no material changes and commitments in the business operations of the Company from the financial year ended March 31, 2017 to the date of the signing of the Directors’ Report.
MATERIAL ORDERS PASSED BY THE REGULATORS
No significant and material orders were passed by the Regulators or courts or tribunals impacting the going concern status and company’s operations in future, except as stated otherwise.
INSURANCE
All the properties of the Company including buildings, plant and machinery and stocks have been adequately insured.
ADEQUACY OF INTERNAL FINANCIAL CONTROLS WITH REFERENCE TO THE FINANCIAL STATEMENTS
The Company has an Internal Control System, commensurate with the size, scale and complexity of its operations. The Company maintains all its records in SAP system and the work flow and approvals are routed through SAP.
The Internal Audit Department monitors and evaluates the efficacy and adequacy of internal control system in the Company, its compliance with operating systems, accounting procedures and policies at all locations of the Company and its subsidiaries. Based on the report of internal audit function, the Units undertake corrective action in their respective areas and strengthen the controls.
Significant audit observations and corrective actions thereon are presented to the Audit committee of the Board periodically.
The Board of directors of the Company have adopted various policies like related party transactions policy, whistle blower policy, policy to determine material subsidiaries and such other procedures for ensuring orderly and efficient conduct of its business for safeguarding its assets, prevention and detection of frauds and errors, accuracy and completeness of the accounting records, and timely preparation of reliable financial information.
TRANSFER OF AMOUNTS TO INVESTOR EDUCATION AND PROTECTION FUND
Pursuant to the provisions of Section 205A of the Companies Act, 1956 (Sec. 124 (5) of the Companies Act, 2013), an amount of ` 28,14,480/- relating to FY 2008-09, which remained unclaimed for a period of 7 years had been transferred by the Company on August 31, 2016 to the Investor Education and Protection Fund and credited on September 02, 2016.
VIGIL MECHANISM
The Company established a vigil mechanism for directors and employees to report genuine concerns pursuant to Sec. 177 of the Companies Act 2013. The vigil mechanism provided for adequate safeguards against victimisation of employees who use such mechanism and for direct access to the chairperson of the Audit committee in appropriate or exceptional cases.
The policy lays down the mechanism for making enquiry into whistle blower complaint received by the Company. Employees who may become aware of any alleged wrongful conduct are encouraged to make a disclosure to the Audit committee.
The details of such mechanism are communicated to all the directors and employees and it was also disclosed on the website of the Company http://www.nbventures.com/corporate_policies.htm
RISK MANAGEMENT POLICY
The Board formulated and implemented Risk Management Policy for the Company which identifies various elements of risks which in its opinion may threaten the existence of the Company and measures to contain and mitigate risks. The Company has adequate internal control systems and procedures to combat the risk. The Risk Management procedures are reviewed by the Audit committee and the Board on periodical basis.
DIVIDEND DISTRIBUTION POLICY
In compliance with the Regulation 43A of Securities and Exchange Board of India (Listing Obligations and Disclosure Requirements) (Second Amendment) Regulations, 2016,

22 45th Annual Report 2016-17
the Board formulated Dividend Distribution Policy for the Company and policy applies to the distribution of dividend by the Company in accordance with the provisions of the Companies Act, 2013 (“Act”) and the SEBI (Listing Obligations and Disclosure Requirements) Regulations, 2015 (SEBI Regulations).
The Dividend Distribution Policy is enclosed as Annexure -11 to this Report and also placed on the Company’s website under the weblink: http://www.nbventures.com/corporate_policies.htm
INDUSTRIAL SAFETY AND ENVIRONMENT
Utmost importance continues to be given to the safety of personnel and equipment in all the plants of the Company. The Company reviews thoroughly the various safety measures adopted and takes effective steps to avoid accidents. Safety drills are also conducted at regular intervals to train the employees for taking timely and appropriate action in case of accidents.
AWARDS
Your Company received the following awards/recognitions during 2016-17:
1. National Award for Excellence in Energy Management 2016 as Excellent Energy Efficient Unit from Confederation of Indian Industry (The Odisha Works and Sugar Division received this award). NBVL’s step down subsidiary NBEIL received the award as Energy Efficient Unit
“Increased Juice Drainage Area for all the Mills to Improve Milling Efficiency” implemented by Sugar Division, recognized by CII as an “Innovative Project”
2. National Energy Conservation Awards 2016 Certificate of Merit from Bureau of Energy Efficiency, Govt. of India, Ministry of Power (The 114 MW Power Plant at Paloncha received this certificate)
3. Star Performer – Large Enterprise (Ferro Alloys) for Export Excellence for the year 2014-15 from EEPCINDIA, Southern Region
4. Netmagic Futurist Award for IT - Excellence in Manufacturing Segment, focusing on deployment of Next Generation Business Applications, from Netmagic, India’s leading Managed Hosting and Cloud service provider
GREEN INITIATIVE IN CORPORATE GOVERNANCE BY HON’BLE MINISTRY OF CORPORATE AFFAIRS
The Ministry of Corporate Affairs (MCA) has taken a green initiative in Corporate Governance by allowing paperless compliances by the Companies and permitted the service of Annual Reports and documents to the shareholders through electronic mode subject to certain conditions and the Company continues to send Annual Reports and other communications in electronic mode to the members having email ids.
INDUSTRIAL RELATIONS
Industrial relations have been cordial during the year under review and your Directors appreciate the sincere and efficient services rendered by the employees of the Company at all levels towards successful working of the Company.
DISCLOSURE UNDER THE SEXUAL HARASSMENT OF WOMEN AT WORKPLACE (PREVENTION, PROHIBITION AND REDRESSAL) ACT, 2013
Your Company has zero tolerance towards sexual harassment at the workplace and the details of sexual harassment complaints as per the provisions of the Sexual Harassment of Women at Workplace (Prevention, Prohibition and Redressal) Act, 2013 and the Rules thereunder are as follows:
No of complaints received : Nil
No of complaints disposed off : NA
ACKNOWlEDGEMENT
Your Directors would like to express their grateful appreciation for the assistance, patronage and co-operation received from the Financial Institutions, the Company’s Bankers, Insurance companies, the Govt. of India, Governments of various countries, Govt. of Telangana, Govt. of Andhra Pradesh and Govt. of Odisha, the State utilities and Shareholders, during the year under review.
for and on behalf of the Board
P. Trivikrama Prasad Managing Director
Place : Hyderabad D. AshokDate : May 27, 2017 Chairman

Directors’ ReportC
OM
PAN
Y O
VER
VIEW
STATU
TORY
REPO
RTS FIN
AN
CIA
L STATEM
ENTS N
OTIC
E
Nava Bharat Ventures Limited 23
Annexure - 1 Performance and Financial Information of each of susidiaries under Rule 8 of Companies (Accounts) Rules, 2014 for the year ended March 31, 2017
(` in lakhs)
Sl. No.
Name of Subsidiary Company Share CapitalTurnover/ Total
IncomeProfit/(loss)
after Taxation
1 Nava Bharat (Singapore) Pte. Limited 102,844.17 10,261.26 (1,336.80)
2 Maamba Collieries Limited 125,499.94 6,600.56 1,397.05
3 Nava Energy Pte. Limited 0.64 1,890.73 493.23
4 Nava Energy Zambia Limited 0.51 4,669.50 103.27
5 Nava Agro Pte. Limited 0.64 - (1.61)
6 Kariba Sugar Limited 0.67 - (45.63)
7 NB Tanagro Limited 0.64 - -
Dormant
8 NB Rufiji Limited 0.64 - -
Dormant
9 Nava Bharat Energy India Limited 20,000.00 28,603.96 2,527.84
10 Nava Bharat Projects Limited 9,080.40 762.56 94.05
11 Brahmani Infratech Private Limited 6,312.50 514.88 221.17
Note: Indian Rupee equivalent figures have been arrived at by applying the year end interbank exchange rate of USD = ` 64.8450
for and on behalf of the Board
P. Trivikrama Prasad Managing Director
Place : Hyderabad D. AshokDate : May 27, 2017 Chairman

24 45th Annual Report 2016-17
Annexure - 2Particulars of Conservation of Energy, Technology absorption, Foreign Exchange earnings and outgo pursuant to the Provisions of Section 134 of the Companies Act, 2013 read with Companies (Accounts) Rules, 2014
(A) CONSERVATION OF ENERGY:
(i) The steps taken or impact on conservation of energy
I) Sugar Division:
i. Plugging of nozzles of Evaporator Condenser to reduce the water consumption, resulting in energy savings.
ii. Utilization of waste heat in Spent lees from distillery exhaust column (Qty-1.5 cu.m at 110 deg.c) for preheating the process condensate from 40 deg.c to 70 deg.c in PHE for stripping of Ammonical nitrate in stripper column, resulting in reduced steam consumption and thereby energy savings.
Due to the measures taken as mentioned above, the total estimated savings were 50,000 kWh per year in energy and 150 tonnes per year in coal consumption.
II) Power Division:
Power Plant (Telangana)
Installation of Waste Heat Recovery System-3 to recover the waste heat available in exit flue gases of furnace-3 of FAP. This waste heat is utilized for heating feed water in STG-3 regenerative system.
Power Plant (Odisha)
i. Utilization of existing VFD of ID fan of Unit-1, for VAM chilled water pump-1, resulting in energy savings.
ii. Reducing the bed ash conveying time from 90 sec to 70 sec and increasing vessel pressure from 0.4 to 0.5 kg/cm2 of bed ash conveying system in Unit-2, resulting in energy savings at AHP Compressor.
iii. Modification and providing thermal insulation around hopper heaters of ESP 1&2 in Unit-2, resulting in energy savings.
iv. Performance evaluation and replacing damaged APH tubes of Boiler 1 & 2 in Unit-2, resulting in improving APH
performance, boiler efficiency and ID fan energy savings.
v. Utilizing trans vector nozzles for cleaning of silo vent filter bags, resulting in energy savings.
vi. Normalizing the turbine heat rate, Condenser vacuum and specific steam consumption of Unit-2 (60 MW CPP) by eliminating deterioration of condensate water quality, arresting the water leakage from bottom of the turbine casing and arresting the leakage from HP heater-2 stuffing box, resulting in energy savings.
III) Ferro Alloy Division
Telangana
i Installation of 165 nos. of LED luminaires at Furnace floors, Raw Material Handling and Batch Weighing system areas.
ii. Replacement of 4 nos. of window air conditioners with inverter type air conditioners at training hall and PLC room of Gas Cleaning Plant.
iii. Reduction in duration of the cleaning cycle of Gas Cleaning Plant 3 and provision of Variable Frequency Drive (VFD) to 150HP Reverse Air (RA) fan motor.
iv. Operating of 2 nos. of 150HP pumps instead of 1No. each of 300HP & 150HP pumps by regulating the outlet valves of water cooling system of furnaces-1 and 3 and maintaining the water pressure and temperature within the acceptable range.
Odisha
i. Connecting tapping smoke blower-2 through common duct in Furnace-2 for the cooling of charging chutes and sealing of electrodes over the smoke hood, eliminated the operation of individual blowers and resulted in conservation of electrical energy.
ii. Installation of Variable Frequency Drives for Furnace-2 tapping smoke blower, resulting in conservation of electrical energy.

CO
MPA
NY
OV
ERV
IEW STA
TUTO
RY R
EPOR
TS FINA
NC
IAL STA
TEMEN
TS NO
TICE
Directors’ Report
Nava Bharat Ventures Limited 25
iii. Replacement of 35 nos. of 250 Watt Metal Halide Lamps with 45 Watt LED lamps in plant area lighting resulted in to conservation of electrical energy.
iv. Installation of Variable Frequency Drive for MRP slurry pump, resulting in conservation of electrical energy.
v. Installation of 2 nos. of Variable Frequency Drive along with Energy Efficient motors for Cooling Towers, resulting in conservation of electrical energy.
vi. Installation of Variable Frequency Drives for Furnace-1 tapping smoke blower, resulting in conservation of electrical energy.
vii. Optimization of briquetting plant operations by simultaneous operation of Muller mixer and Alfa mixer, resulting in conservation of electrical energy.
The total estimated savings on account of the various measures taken at all Units put together were 957583 kWh per year in energy and 3610 tonnes per year in coal consumption.
(ii) The steps taken by the Company for utilizing alternate sources of energy
I) Sugar Division/Power Division/Ferro Alloy Division(Telangana)
Nil
II) Ferro Alloy Division – Odisha:
Agreement executed with Bharat Petroleum Company Ltd for the installation of LPG-LOT manifold system and supply of LPG in 44.6 kg cylinders for replacing furnace oil for Dryer-2 burner. This will improve environment (no smoke emission to atmosphere), working conditions and overall efficiency of dryer.
(iii) The capital investment on energy conservation equipments
I) Sugar Division:
Nil
II) Power Division:
Power Plant (Telangana)
` 549.5 lakhs investment made for installation of Waste Heat Recovery Sytem-3.
Power Plant (Odisha)
Nil.
III) Ferro Alloy Division:
Telangana
i. ` 6.2 lakhs on procurement of LED lighting Luminaires.
ii. ` 2.16 lakhs on procurement of inverter type air conditioners.
iii. ` 5.6 lakhs for VFD.
iv. ` 1.5 lakhs on procurement of valves for regulating the furnace cooling water.
Odisha
i. ` 5.5 lakhs for the arrangement of duct to connect tapping smoke blower to charging chutes and electrode seals in Furnace-2.
ii. ` 1.98 lakhs on installation of VFD for Tapping Smoke Blower of Furnace-2.
iii. ` 1.91 lakhs for installation of LED lights.
iv. ` 1.93 lakhs on installation of VFDs for MRP slurry pump.
v. ` 2.0 lakhs on installation of VFDs and energy efficient motors for 2 nos. of Cooling Towers.
vi. ` 2.0 lakhs on installation of VFD for Furnace -1 Tapping Smoke Blower.
(B) TECHNOlOGY ABSORPTION:
(i) The efforts made towards technology absorption
I) Sugar Division:
Installation of 1No. of web camera at discharge point of sugar ETP treated effluent and 2 Nos. of web cameras at Distillery bio composting yard as per the CPCB guidelines and connection to PCB server.
II) Power Division:
Power Plant (Telangana)
i. Replacement of damaged bladder of Hydraulic accumulator in lube oil governing system of STG-2 with indigenously developed one.
ii. Installation of Dust extraction systems at CHP-1 & 2.
Power Plant (Odisha)
i. Conducting the compressed air leak test with leak detector and rectifying the identified abnormalities in Unit-2 Boiler and TG area.

26 45th Annual Report 2016-17
ii. Conducting insulation survey and rectifying the identified weak insulation areas in Unit-2 Boiler and TG area.
iii. Installation of flow meters in service water line and DM make up line of Unit-2.
iv. Providing atomizing water spray nozzles at coarse ash Silo in Unit-1.
v. Installation of airline respirator system for handling chlorine gas in Chlorine shed.
vi. Installation of de-humidifier in Unit-3 (60 MW IPP).
III) Ferro Alloy Division:
Telangana
i. Installation of de-dusting facility at Raw Material Handling System of Furnace-4.
ii. Upgradation of batch weighing system by replacing outdated weighing instruments and modifying PLC logics.
iii. Installation of Opacity monitor for Gas Cleaning Plant-2.
iv. Replacement of bag house of Sinter Plant-1 with Ventury Scrubber.
v. Installation of rain guns at sinter plant and extension of the water sprinkler system at Raw Material yard by providing 3 more rain guns.
vi. Provision of pressure transmitters instead of manometers, to Bag house chambers of Gas Cleaning Plant-3.
vii. Installation of Radio remote control for 5Ton and 20Ton EOT cranes at Finished Product shed.
Odisha
i. Installation of PVC solid woven belts in briquetting plant with mechanical fasteners.
ii. Installation of LPG – LOT manifold system for chrome ore dryers for heating of ore.
iii. Introduction of JCB mounted hydraulic rock breaker for breaking of FeCr metal cakes.
iv. Introduction of Pneumatic breaker attached to articulated hydraulic boom for breaking of skull from brick lined ladles.
v. Introduction of Refractory brick lined ladles for collection of hot metal.
vi. Introduction of Inverter based welding machines.
vii. Measuring and monitoring of compressed air utilization.
viii. Installation of Dry Fog System at ground hoppers & screen houses in Raw Material Handling areas.
(ii) The benefits derived like product improvement, cost reduction, product development or import substitution
I) Sugar Division:
Monitoring of discharge water quality at Sugar ETP and Compliance of Zero liquid discharge at distillery bio compost yard.
II) Power Division:
Power Plant (Telangana)
i. Cost savings due to import substitution.
ii. Control of dust emissions.
Power Plant (Odisha)
i. Reduction in energy consumption of compressor.
ii. Minimized heat loss due to radiation.
iii. Monitoring of water consumption.
iv. Suppression of fugitive dust.
v. Improved safety during handling of chlorine gas.
vi. Maintenance of moisture within limit, preventing rust & corrosion development and for effective preservation of Turbine.
III) Ferro Alloy Division:
Telangana
i. Improvement in environment conditions.
ii. Accurate and robust operation.
iii. Online monitoring of flue gas SPM level as per the norms of State Pollution Control Board.
iv. Improvement in environment conditions.
v. Suppression of dust during handling of raw material, by utilizing waste water.

CO
MPA
NY
OV
ERV
IEW STA
TUTO
RY R
EPOR
TS FINA
NC
IAL STA
TEMEN
TS NO
TICE
Directors’ Report
Nava Bharat Ventures Limited 27
vi. Effective and continuous monitoring of individual bag house pressures.
vii. Safe operation of EOT cranes.
Odisha
i. PVC solid woven belts introduced in briquetting plant with mechanical fasteners reduced the energy requirement and procurement cost of the belts.
ii. LPG–LOT manifold system for chrome ore dryers has reduced pollution.
iii. JCB mounted hydraulic rock breaker resulted in easy handling and processing of FeCr.
iv. Pneumatic breaker attached to articulate hydraulic boom reduced ladle cost.
v. Refractory brick lined ladles reduced cost of ladles.
vi. Inverter based welding machines reduced energy consumption.
vii. Measuring and monitoring of compressed air utilization led to better control.
viii. Fugitive emissions at ground hoppers & screen houses in Raw Material Handling areas are controlled.
(iii) In case of imported technology (imported during the last three years reckoned from the beginning of the financial year)
I. Sugar Division/Power Division/Ferro Alloy Division:
(a) The details of technology imported : NIL
(b) The year of import : Not Applicable
(c) Whether the technology been fully absorbed : Not Applicable
(d) If not fully absorbed, areas where absorption has not taken place, and the reasons thereof : Not Applicable
(iv) The expenditure incurred on Research and Development
I. Sugar Division/Power Division/Ferro Alloy Division:
NIL
(C) FOREIGN EXCHANGE EARNINGS AND OUTGO: ( ` in lakhs)
Current Year 31.03.2017 Previous Year 31.03.2016
Foreign Exchange Outgo:
i. CIF value of Imports 12,248.88 4,624.25
ii. Interest 253.67 39.81
iii. Others 82.31 44.32
Foreign exchange Earnings at FOB Value
i. Export of Goods 16,826.15 15,246.45
ii. Others 5,902.64 3,217.51
for and on behalf of the Board
P. Trivikrama Prasad Managing Director
Place : Hyderabad D. AshokDate : May 27, 2017 Chairman

28 45th Annual Report 2016-17
Annexure - 3Annual report on corporate social responsibility (CSR) activities(Pursuant to Rule 8 of Companies [Corporate Social Responsibility Policy] Rules, 2014)
1. A brief outline of the Company’s CSR Policy, including overview of projects or programs proposed to be undertaken and a reference to the web-link to the CSR policy and projects or programs
The Company endeavours to
• provide learning and acquiring knowledge through measures including formal schools;
• provide health care services through measures including preventive health care; and
• provide livelihood through measures including vocational training.
Web-link: http://www.nbventures.com/csr_programmes.htm
2. Composition of the CSR Committee Mr. D. Ashok Chairman of the Company Chairman
Dr. D.Nageswara Rao Independent Director Member
Dr. C.V.Madhavi Independent Director Member
3. Average net profit of the Company for last three financial years
` 16,001.50 lakhs
4. Prescribed CSR Expenditure (two percent of the amount as in item 3 above)
` 320.03 lakhs
5. Details of CSR spend during the financial year
a. Total amount spent for the financial year: ` 320.65 lakhs
b. Amount unspent, if any : Nil
c. Manner in which the amount spent during the financial year : Attached
6. In case the company has failed to spend the two per cent of the average net profit of the last three financial years or any part thereof, the Company shall provide the reasons for not spending the amount in its Board Report
Please refer to Item No.5 (b) above.
7. A responsibility statement of the CSR Committee that the implementation and monitoring of CSR policy, is in compliance with CSR objectives and policy of the Company
We hereby declare that implementation and monitoring of the CSR policy are in compliance with CSR objectives and policy of the Company.
T. Hari Babu P. Trivikrama Prasad D. AshokChief Financial Officer Managing Director Chairman CSR Committee

CO
MPA
NY
OV
ERV
IEW STA
TUTO
RY R
EPOR
TS FINA
NC
IAL STA
TEMEN
TS NO
TICE
Directors’ Report
Nava Bharat Ventures Limited 29
CSR
PR
OJE
CTS
/ P
RO
GR
AM
MES
, BU
DG
ET A
llO
CA
TIO
N T
OG
ETH
ER W
ITH
MO
DA
lITI
ES O
F EX
ECU
TIO
N F
OR
201
6-17
STA
TUS
AS
ON
31.
03.2
017
Sl.
No.
CSR
pro
ject
or
activ
ity id
entifi
edSe
ctor
in w
hich
the
Pr
ojec
t is
cov
ered
Proj
ects
or
Prog
ram
s (1
) Loc
al a
rea
or o
ther
(2) S
peci
fy t
he S
tate
and
dis
tric
t w
here
pro
ject
s or
pr
ogra
ms
wer
e un
dert
aken
Am
ount
O
utla
y (b
udge
t)
proj
ect
or
prog
ram
w
ise
` in
lakh
s
Am
ount
sp
ent
on t
he
proj
ects
or
prog
ram
s Su
b-he
ads:
(1) D
irect
ex
pend
iture
on
proj
ects
or
pro
gram
s.(2
) Ove
r-he
ads
Am
out
in `
Cum
ulat
ive
Expe
nditu
re
up t
o th
e da
te
of r
epor
ting
perio
d
Am
out
in `
Am
ount
sp
ent
dire
ctly
or
thr
ough
im
plem
entin
g ag
ency
Proj
ect
or
Prog
ram
Loca
l Are
a or
oth
erD
istr
ict
and
Stat
e
HEA
LTH
1Sa
fe d
rinki
ng
wat
er p
lant
s, n
ear
Palo
ncha
(i)
Mak
ing
avai
labl
e sa
fe
drin
king
wat
er
Proj
ect
Mac
hina
peta
, Pa
pako
llu, I
ndira
naga
rBh
adra
dri
Kot
hagu
dem
, Te
lang
ana
1.65
186,
810
186,
810
Naa
ndi
Foun
datio
n,
Hyd
erab
ad
2Pr
imar
y H
ealth
C
ente
r at
NBE
C,
Palo
ncha
(i)
Prom
otin
g pr
even
tive
heal
th c
are
Proj
ect
Palo
ncha
Bhad
radr
i K
otha
gude
m,
Tela
ngan
a
5.60
603,
544
603,
544
LV
PEI,
Hyd
erab
ad
3H
ealth
Cam
paig
n in
sur
roun
ding
ar
eas
of P
alon
cha
(i)
Prom
otin
g pr
even
tive
heal
th c
are
Proj
ect
Palo
ncha
Bhad
radr
i K
otha
gude
m,
Tela
ngan
a
6.00
590,
214
590,
214
Dire
ct
4G
ener
al H
ealth
C
amp-
Odi
sha
(i)
Prom
otin
g pr
even
tive
heal
th c
are
Proj
ect
Cha
rada
gadi
a,
Koc
hila
mad
a &
Sib
apur
Dhe
nkan
al, O
dish
a1.
5011
2,97
811
2,97
8D
irect
5C
onst
ruct
ion
of
toile
ts a
t Ba
tchu
Fo
unda
tion
Mun
icip
al H
igh
Scho
ol, A
yodh
ya-
ram
apur
am,
Sam
alko
t
(i)
Prom
otin
g sa
nita
tion
Proj
ect
Sam
alko
tEa
st G
odav
ari,
And
hra
Prad
esh
4.50
436,
453
436,
453
Dire
ct
6Sa
fe d
rinki
ng
wat
er t
o ki
ds(i)
M
akin
g av
aila
ble
Safe
dr
inki
ng w
ater
Proj
ect
Hyd
erab
adH
yder
abad
, Te
lang
ana
0.35
36,0
0036
,000
M/s
Sat
ya
Foun
datio
n,
Hyd
erab
ad
EDU
CA
TIO
N
7Fr
ee t
utor
ials
for
ec
onom
ical
ly
back
war
d st
uden
ts in
Gov
t.
scho
ols
(ii)
Prom
otin
g ed
ucat
ion
Proj
ect
Palo
ncha
(Md.
), K
otha
gude
m (M
d.),
Mul
akal
apal
li (M
d.)
Bhad
radr
i K
otha
gude
m,
Tela
ngan
a
3.00
262,
526
262,
526
D
irect

30 45th Annual Report 2016-17
Sl.
No.
CSR
pro
ject
or
activ
ity id
entifi
edSe
ctor
in w
hich
the
Pr
ojec
t is
cov
ered
Proj
ects
or
Prog
ram
s (1
) Loc
al a
rea
or o
ther
(2) S
peci
fy t
he S
tate
and
dis
tric
t w
here
pro
ject
s or
pr
ogra
ms
wer
e un
dert
aken
Am
ount
O
utla
y (b
udge
t)
proj
ect
or
prog
ram
w
ise
` in
lakh
s
Am
ount
sp
ent
on t
he
proj
ects
or
prog
ram
s Su
b-he
ads:
(1) D
irect
ex
pend
iture
on
proj
ects
or
pro
gram
s.(2
) Ove
r-he
ads
Am
out
in `
Cum
ulat
ive
Expe
nditu
re
up t
o th
e da
te
of r
epor
ting
perio
d
Am
out
in `
Am
ount
sp
ent
dire
ctly
or
thr
ough
im
plem
entin
g ag
ency
Proj
ect
or
Prog
ram
Loca
l Are
a or
oth
erD
istr
ict
and
Stat
e
8C
ompu
ter
facu
lty
in G
ovt.
Sch
ools
(ii)
Prom
otin
g ed
ucat
ion
Proj
ect
Palo
ncha
(Md.
), K
otha
gude
m (M
d.),
Mul
akal
apal
li (M
d.),
Teku
lapa
lli (M
d.)
Bhad
radr
i K
otha
gude
m,
Tela
ngan
a
6.30
601,
347
601,
347
Dire
ct
9N
ava
Bhar
at H
igh
Scho
ol(ii
) Pr
omot
ing
educ
atio
nPr
ojec
tPa
lonc
haBh
adra
dri
Kot
hagu
dem
, Te
lang
ana
21.0
01,
976,
936
1,97
6,93
6D
irect
10N
utrit
ious
foo
d to
st
uden
ts(ii
) Pr
omot
ing
educ
atio
nPr
ojec
tPa
lonc
haBh
adra
dri
Kot
hagu
dem
, Te
lang
ana
1.50
171,
752
171,
752
Dire
ct
11Su
pple
men
tary
Sp
oken
Eng
lish
Prog
ram
e,
Palo
ncha
(ii)
Prom
otin
g ed
ucat
ion/
liv
elih
ood
enha
ncem
ent
Proj
ect
Palo
ncha
(Md.
), K
otha
gude
m (M
d.),
Teku
lapa
lli (M
d)
Bhad
radr
i K
otha
gude
m,
Tela
ngan
a
4.35
439,
437
439,
437
Dire
ct
12M
obile
Sci
ence
La
bora
tory
fo
r G
ovt.
sch
ools
in
Kot
hagu
dem
are
a
(ii)
Prom
otin
g ed
ucat
ion
Proj
ect
Palo
ncha
(Md.
), K
otha
gude
m (M
d.),
Mul
akal
apal
li (M
d.),
Teku
lapa
lli (M
d.)
Bhad
radr
i K
otha
gude
m,
Tela
ngan
a
3.00
314,
866
314,
866
Dire
ct
13Br
ahm
ani P
ublic
Sc
hool
(ii)
Prom
otin
g ed
ucat
ion
Proj
ect
Kha
ragp
rasa
dD
henk
anal
, Odi
sha
5.63
563,
220
563,
220
Dire
ct
14N
imid
ha H
igh
Scho
ol(ii
) Pr
omot
ing
educ
atio
nPr
ojec
tN
imid
haD
henk
anal
, Odi
sha
0.30
30,0
0030
,000
Dire
ct
15Re
pairs
in C
lass
Ro
oms
at
Cha
rada
gadi
a U
P Sc
hool
(ii)
Prom
otin
g ed
ucat
ion
Proj
ect
Cha
rada
gadi
aD
henk
anal
, Odi
sha
0.74
23,5
0423
,504
Dire
ct
16C
ompo
und
Wal
l fo
r M
asan
ia
Scho
ol
(ii)
Prom
otin
g ed
ucat
ion
Proj
ect
Mas
ania
Dhe
nkan
al, O
dish
a3.
0028
7,60
228
7,60
2D
irect

CO
MPA
NY
OV
ERV
IEW STA
TUTO
RY R
EPOR
TS FINA
NC
IAL STA
TEMEN
TS NO
TICE
Directors’ Report
Nava Bharat Ventures Limited 31
Sl.
No.
CSR
pro
ject
or
activ
ity id
entifi
edSe
ctor
in w
hich
the
Pr
ojec
t is
cov
ered
Proj
ects
or
Prog
ram
s (1
) Loc
al a
rea
or o
ther
(2) S
peci
fy t
he S
tate
and
dis
tric
t w
here
pro
ject
s or
pr
ogra
ms
wer
e un
dert
aken
Am
ount
O
utla
y (b
udge
t)
proj
ect
or
prog
ram
w
ise
` in
lakh
s
Am
ount
sp
ent
on t
he
proj
ects
or
prog
ram
s Su
b-he
ads:
(1) D
irect
ex
pend
iture
on
proj
ects
or
pro
gram
s.(2
) Ove
r-he
ads
Am
out
in `
Cum
ulat
ive
Expe
nditu
re
up t
o th
e da
te
of r
epor
ting
perio
d
Am
out
in `
Am
ount
sp
ent
dire
ctly
or
thr
ough
im
plem
entin
g ag
ency
Proj
ect
or
Prog
ram
Loca
l Are
a or
oth
erD
istr
ict
and
Stat
e
17D
ual d
esks
at
Cha
rada
gadi
a U
P Sc
hool
(ii)
Prom
otin
g ed
ucat
ion
Proj
ect
Cha
rada
gadi
aD
henk
anal
, Odi
sha
1.00
98,2
4198
,241
Dire
ct
18Pr
ovid
ing
infr
astr
uctu
re t
o G
ovt.
Sch
ools
(ii)
Prom
otin
g ed
ucat
ion
Proj
ect
Sam
alko
tEa
st G
odav
ari,
And
hrap
rade
sh0.
5048
,754
48,7
54D
irect
LIV
ELIH
OO
DS
19N
ava
Bhar
at
Voca
tiona
l In
stitu
te (N
BVI),
Pa
lonc
ha
(ii)
Prom
otin
g em
ploy
men
t en
hanc
ing
voca
tiona
l ski
lls
Proj
ect
Palo
ncha
Bhad
radr
i K
otha
gude
m,
Tela
ngan
a
70.0
07,
851,
091
7,85
1,09
1D
irect
20C
onst
ruct
ion
of W
omen
Em
pow
erm
ent
cent
er, P
alon
cha
(iii)
Empo
wer
ing
w
omen
Proj
ect
Palo
ncha
Bhad
radr
i K
otha
gude
m,
Tela
ngan
a
143.
0014
,794
,177
14,7
94,1
77D
irect
21Eq
uipm
ent
for
Wom
en
Empo
wer
men
t ce
nter
(iii)
Empo
wer
ing
wom
enPr
ojec
tPa
lonc
haBh
adra
dri
Kot
hagu
dem
, Te
lang
ana
14.0
088
4,74
388
4,74
3D
irect
22Be
dsid
e Pa
tient
A
ssis
tant
Cou
rse-
New
(iii)
Empo
wer
ing
w
omen
Proj
ect
Palo
ncha
Bhad
radr
i K
otha
gude
m,
Tela
ngan
a
3.00
--
--W
e d
efer
red
this
pro
ject
as
asp
irant
s re
spon
se is
not
po
sitiv
e

32 45th Annual Report 2016-17
Sl.
No.
CSR
pro
ject
or
activ
ity id
entifi
edSe
ctor
in w
hich
the
Pr
ojec
t is
cov
ered
Proj
ects
or
Prog
ram
s (1
) Loc
al a
rea
or o
ther
(2) S
peci
fy t
he S
tate
and
dis
tric
t w
here
pro
ject
s or
pr
ogra
ms
wer
e un
dert
aken
Am
ount
O
utla
y (b
udge
t)
proj
ect
or
prog
ram
w
ise
` in
lakh
s
Am
ount
sp
ent
on t
he
proj
ects
or
prog
ram
s Su
b-he
ads:
(1) D
irect
ex
pend
iture
on
proj
ects
or
pro
gram
s.(2
) Ove
r-he
ads
Am
out
in `
Cum
ulat
ive
Expe
nditu
re
up t
o th
e da
te
of r
epor
ting
perio
d
Am
out
in `
Am
ount
sp
ent
dire
ctly
or
thr
ough
im
plem
entin
g ag
ency
Proj
ect
or
Prog
ram
Loca
l Are
a or
oth
erD
istr
ict
and
Stat
e
23Tr
aini
ng in
m
akin
g Pa
lm le
af
prod
ucts
(iii)
Empo
wer
ing
wom
enPr
ojec
tPa
lonc
haBh
adra
dri
Kot
hagu
dem
, Te
lang
ana
4.00
307,
253
307,
253
Indu
stre
e C
raft
Fo
unda
tion,
Be
ngal
uru
24D
evel
opm
ent
of
Voca
tiona
l Ski
lls,
Sam
alko
t
(ii)
Prom
otin
g em
ploy
men
t en
hanc
ing
voca
tiona
l ski
lls
Proj
ect
Sam
alko
tEa
st G
odav
ari,
And
hra
Prad
esh
4.00
349,
748
349,
748
Dire
ct
OTH
ER P
RO
GR
AM
S
25Pl
anta
tion
of
Med
icin
al P
lant
s at
Mah
atm
a G
andh
i Aus
odhi
ya
Ara
nya
at S
ogar
, K
amak
hyan
agar
, D
henk
anal
(iv) E
nsur
ing
envi
ronm
enta
l su
stai
nabi
lity
Proj
ect
Aus
odhi
ya A
rany
a, A
t-So
gar,
Kam
akhy
anag
arD
henk
anal
O
dish
a0.
5757
,000
57,0
00A
WH
AN
, A
t-C
haul
ia-
kham
ar,
Po-C
haul
ia,
Ps-S
adar
, DIs
t-D
henk
anal
, Pi
n-75
9001
, O
dish
a
26C
onst
ruct
ion
of c
ulve
rts,
Sa
mal
kot.
(x)
Rura
l de
velo
pmen
tPr
ojec
tSa
mal
kot
East
God
avar
i, A
ndhr
a Pr
ades
h0.
8095
,175
95,1
75D
irect
AD
MIN
ISTR
ATI
VE
EX
PEN
SES
27A
dmin
istr
ativ
e ex
pens
esSa
lary
of
Chi
ef
Adm
inis
trat
or
(SD
), Ve
hicl
e m
aint
enan
ce a
nd
fuel
exp
ense
s
8.00
941,
390
941,
390
Dire
ct
Gra
nd
To
tal
317.
2932
,064
,761
32,0
64,7
61
T. H
ari B
abu
P.
Tri
vikr
ama
Pras
ad
D. A
sho
kC
hief
Fin
anci
al O
ffice
r M
anag
ing
Dire
ctor
C
hairm
an
C
SR C
omm
ittee

CO
MPA
NY
OV
ERV
IEW STA
TUTO
RY R
EPOR
TS FINA
NC
IAL STA
TEMEN
TS NO
TICE
Directors’ Report
Nava Bharat Ventures Limited 33
Annexure - 4Form No. MGT- 9
Extract of Annual Return as on the financial year ended on 31.03.2017 [Pursuant to section 92(3) of the Companies Act, 2013 and rule 12(1) of the Companies
(Management and Administration) Rules, 2014]
I. REGISTRATION AND OTHER DETAIlS:
i) CIN : L27101TG1972PLC001549
ii) Registration Date : 07.11.1972
iii) Name of the Company : Nava Bharat Ventures Limited
iv) Category/Sub-Category of the Company : Company limited by shares/Indian non-government
v) Address of the Registered office and contact details : 6-3-1109/1, Nava Bharat Chambers, Raj Bhavan Road Hyderabad – 500 082, TelanganaTel: 91 40 23403501; Fax: 91 40 23403013E-mail: [email protected]:www.nbventures.com
vi) Whether listed company Yes / No : Yes
vii) Name, Address and Contact details of Registrars and Share Transfer Agents, if any
: Karvy Computershare Private Limited(Unit: Nava Bharat Ventures Limited)Karvy Selenium Tower B, Plot No. 31 & 32 Gachibowli, Financial District, Nanakramguda Hyderabad – 500 032, TelanganaTel: 91 40 6716 1500, 91 40 6716 1562Fax: 91 40 2300 1153 Mr. M. S. Madhusudhan/Mr. Mohd. MohsinuddinE-mail: [email protected]: www.karvycomputershare.com
II. PRINCIPAl BUSINESS ACTIVITIES OF THE COMPANY
All the business activities contributing 10% or more of the total turnover of the company as follows:
Sl. No.
Name and Description of main products / servicesNIC Code of the
Products / service% of total turnover
of the company
1 Ferro Alloys 24104 48.80
2 Power 35102 38.24
3 Sugar 10721 12.96

34 45th Annual Report 2016-17
III. PARTICUlARS OF HOlDING, SUBSIDIARY AND ASSOCIATE COMPANIES
Sl. No.
Name and Address of the Company CIN/GLNHolding /
Subsidiary/ Associate
% of shares
held
Applicable Section
1 Nava Bharat (Singapore) Pte. Limited120, Lower Delta Road, #05-14Cendex CentreSingapore - 169208
Not Applicable WOS 100.00 2 (87)
2 Maamba Collieries Limited Head Office: P.O.Box 99, Maamba Zambia
Not Applicable Subsidiary 64.69 2 (87)
3 Nava Energy Pte. Ltd.120, Lower Delta Road, #05-14 Cendex Centre Singapore -169208
Not Applicable WOS 100.00 2 (87)
4 Nava Energy Zambia LimitedIzuma House, P.O. Box 99, MaambaZambia
Not Applicable Subsidiary 100.00 2 (87)
5 Nava Agro Pte. Limited (from September 7, 2016)120, Lower Delta Road, #05-14Cendex Centre Singapore -169208
Not Applicable WOS 100.00 2 (87)
6 Kariba Sugar LimitedRegd. Off: Corporate Park, Plot No.20849Alick Nkhata Road, Mass Media AreaP.O.Box 31197, Lusaka, Zambia
Not Applicable Subsidiary 100.00 2 (87)
7 NB Tanagro Limited8th Floor, Amani Place, Ohio Street Dar es Salaam Tanzania
Not Applicable Subsidiary 100.00 2 (87)
8 NB Rufiji Private Limited8th Floor, Amani Place, Ohio Street Dar es Salaam Tanzania
Not Applicable Subsidiary 100.00 2 (87)
9 Nava Bharat Projects Limited6-3-1109/1, Nava Bharat Chambers Raj Bhavan RoadHyderabad – 500 082 Telangana
U70102TG2007PLC052362 WOS 100.00 2 (87)
10 Nava Bharat Energy India Limited6-3-1109/1, Nava Bharat Chambers Raj Bhavan RoadHyderabad – 500 082 Telangana
U40106TG2008PLC058560 Subsidiary 26.00 2 (87)
11 Brahmani Infratech Private Limited6-3-1109/1, Nava Bharat Chambers Raj Bhavan RoadHyderabad – 500 082Telangana
U40109TG1999PTC032289 Subsidiary 65.74 2 (87)

CO
MPA
NY
OV
ERV
IEW STA
TUTO
RY R
EPOR
TS FINA
NC
IAL STA
TEMEN
TS NO
TICE
Directors’ Report
Nava Bharat Ventures Limited 35
Sl. No.
Name and Address of the Company CIN/GLNHolding /
Subsidiary/ Associate
% of shares
held
Applicable Section
12 Kinnera Power Company Pvt Ltd6-3-1109/1, Nava Bharat ChambersRaj Bhavan RoadHyderabad – 500 082 Telangana
U40100TG1993PTC016204 Associate 26.00 2 (6)
IV. SHAREHOlDING PATTERN (EQUITY SHARE CAPITAl BREAKUP AS PERCENTAGE OF TOTAl EQUITY) i) Category-wise Shareholding
Category of Shareholders
No. of Shares held at the beginning of the year
No. of Shares held at the end of the year %
Change during
the yearDemat Physical Total% of Total
SharesDemat Physical Total
% of Total
Shares
A Promoters
(1) Indian
a) Individual / HUF 15543823 0 15543823 17.41 31127646 0 31127646 17.43 0.02
b) Central Govt. 0 0 0 0 0 0 0 0 0
c) State Govt (s) 0 0 0 0 0 0 0 0 0
d) Bodies Corp. 19048380 0 19048380 21.33 38186760 0 38186760 21.38 0.05
e) Banks/FI 0 0 0 0 0 0 0 0 0
f) Any other – TrustNav Energy Pvt. Ltd. (Holding shares of the Company (NBVL)for the benefit of the Company (NBVL))
4973510 0 4973510 5.57 9947020 0 9947020 5.57 0
Sub-total (A) (1) 39565713 0 39565713 44.31 79261426 0 79261426 44.38 0.07
(2) Foreign
a) NRIs - Individuals 0 0 0 0 0 0 0 0 0
b) Other individuals 0 0 0 0 0 0 0 0 0
c) Bodies Corp. 0 0 0 0 0 0 0 0 0
d) Banks/FI 0 0 0 0 0 0 0 0 0
e) Any other 0 0 0 0 0 0 0 0 0
Sub-total (A) (2):- 0 0 0 0 0 0 0 0 0
Total Shareholding of Promoters (A)=(A) (1) + (A) (2) 39565713 0 39565713 44.31 79261426 0 79261426 44.38 0.07
B Public Shareholding
(1) Institutions
a) Mutual Funds 20571 0 20571 0.02 12888267 0 12888267 7.22 7.20
b) Banks / FI 13141 1705 14846 0.02 139490 3410 142900 0.08 0.06
c) Central Govt. 0 0 0 0 0 0 0 0 0
d) State Govt (s) 0 0 0 0 0 0 0 0 0

36 45th Annual Report 2016-17
Category of Shareholders
No. of Shares held at the beginning of the year
No. of Shares held at the end of the year %
Change during
the yearDemat Physical Total% of Total
SharesDemat Physical Total
% of Total
Shares
e) Venture Capital Funds
0 0 0 0 0 0 0 0 0
f) Insurance Companies
0 0 0 0 0 0 0 0 0
g) FIIs/FPIs 26941037 0 26941037 30.17 25693463 0 25693463 14.39 (15.78)
h) Foreign Venture Capital Funds
0 0 0 0 0 0 0 0 0
i) Others (specify) 0 0 0 0 0 0 0 0 0
Sub-total (B) (1) 26974749 1705 26976454 30.21 38721220 3410 38724630 21.69 (8.52)
(2) Non-Institutions
a) Bodies Corporatei. Indian 2278504 1340 2279844 2.55 8051578 2680 8054258 4.51 1.96
ii. Overseas 0 0 0 0 0 0 0 0 0
b) Individuals
i Individual shareholders holding nominal share capital upto `1 lakh
7622851 739791 8362642 9.37 18741327 1133297 19874624 11.13 1.76
ii Individual shareholders holding nominal share capital in excess of `1 lakh
9546782 0 9546782 10.69 26301921 278500 26580421 14.88 4.19
c) Others (specify)
i Unclaimed Shares Suspense Account
602340 0 602340 0.67 1178790 0 1178790 0.66 (0.01)
ii Directors and Relatives
290131 0 290131 0.32 580262 0 580262 0.32 0
iii Nava Bharat Ventures Employee Welfare Trust – Held by the Trustee - Barclays Wealth Trustees (India) Pvt. Ltd.*
1400000 0 1400000 1.57 2800000 0 2800000 1.57 0
iv Clearing Members 6979 0 6979 0.01 205130 0 205130 0.11 0.10
v Trusts 4611 0 4611 0.01 72222 0 72222 0.04 0.03
vi Non Resident Indians(a) Repatriation(b) Non Repatriation
15512391012
52400
16036391012
0.180.10
841274198625
96100
850884198625
0.480.11
0.300.01
vii. Foreign Nationals 870 0 870 0.00 2610 0 2610 0.00 0.00
viii. NBFC 0 0 0 0 191600 0 191600 0.11 0.11
Sub-total (B) (2):- 21999203 746371 22745574 25.47 59165339 1424087 60589426 33.93 8.46

CO
MPA
NY
OV
ERV
IEW STA
TUTO
RY R
EPOR
TS FINA
NC
IAL STA
TEMEN
TS NO
TICE
Directors’ Report
Nava Bharat Ventures Limited 37
Category of Shareholders
No. of Shares held at the beginning of the year
No. of Shares held at the end of the year %
Change during
the yearDemat Physical Total% of Total
SharesDemat Physical Total
% of Total
Shares
Total Public Shareholding (B)=(B) (1) + (B) (2)
48973952 748076 49722028 55.69 97886559 1427497 99314056 55.62 (0.07)
C Shares held by Custodian for GDRs & ADRs
0 0 0 0 0 0 0 0 0
GRAND TOTAL (A+B+C) 88539665 748076 89287741# 100.00 177147985 1427497 178575482# 100.00 0
* Nava Bharat Ventures Employee Welfare Trust: Shares held by the Trustee – Barclays Wealth Trustees (India) Pvt. Ltd., held 1400000 equity shares (1.57%) at the beginning of the year and 2800000 equity shares (1.57%) at the end of the year, which is an employee benefit trust as per SEBI (Share Based Employee Benefits) Regulations, 2014 and is a non-promoter and non-public category.
#The difference in the paid-up capital as on 31.03.2016 (89287741 shares) and as on 31.03.2017 (178575482 shares) is on account of bonus shares issued by the Company in the ratio of 1:1 (i.e., one bonus equity share of ` 2/-each fully paid-up, for every one existing fully paid-up equity shares of ` 2/- each held) to the holders of the existing equity shares of the Company, whose names appear in the Register of Members as on the record date, ie., September 3, 2016.
(ii) Shareholding of Promoters
Sl. No.
Shareholder’s Name
Shareholding at the beginning of the year
Shareholding at the end of the year
% Change in shareholding
during the Year
No. of shares
% of total
shares of the
Company
% of shares pledged or
encumbered to total shares
No. of shares
% of total
shares of the
Company
% of shares pledged or
encumbered to total shares
1 Mr. Devineni Ashok 1113000 1.25 0 2226000 1.25 0 0
2 Mrs. Devineni Ramaa 261615 0.29 0 523230 0.29 0 0
3 Mr. Ashwin Devineni 1684606 1.89 0 3409212 1.91 0 0.02
4 Mr. Nikhil Devineni 1275000 1.43 0 2550000 1.43 0 0
5 Mrs. Devineni Bhaktapriya 4901450 5.49 0 9802900 5.49 0 0
6 Dr. Devineni Rajasekhar jointly with Mr. D.Ashok
7815 0.01 0 15630 0.01 0 0
7 Mrs. Alluri Nilima 505000 0.57 0 1050000 0.59 0 0.02
8 Mr. Pinnamaneni Trivikrama Prasad
1813836 2.03 0 3627672 2.03 0 0
9 Mr. Pinnamaneni Trivikrama Prasad (HUF)
351315 0.39 0 702630 0.39 0 0
10 Mrs. Pinnamaneni Rajashree 3518778 3.94 0 6997556 3.92 0 (0.02)
11 Mrs. Pinnamaneni Shruthi 111408 0.12 0 222816 0.12 0 0
TOTAL 15543823 17.41 0 31127646 17.43 0 0.02
Bodies Corporate:
12 Nav Developers Ltd. 7920181 8.87 0 15840362 8.87 0 0
13 A. N. Investments Pvt. Ltd. 4408349 4.94 0 8866698 4.97 0 0.03
14 S. R. T. Investments Pvt. Ltd. 3460000 3.88 0 6960000 3.90 0 0.02

38 45th Annual Report 2016-17
15 A9 Homes Pvt. Ltd. 1132000 1.27 0 2264000 1.27 0 0
16 V9 Avenues Pvt. Ltd. 1109990 1.24 0 2219980 1.24 0 0
17 AV Dwellings Pvt. Ltd. 1017860 1.14 0 2035720 1.14 0 0
TOTAL 19048380 21.33 0 38186760 21.38 0 0.05
TRUST:
18. Nav Energy Pvt. Ltd.(Holding shares of the Company [NBVL]for the benefit of the Company {NBVL})
4973510 5.57 0 9947020 5.57 0 0
TOTAL 4973510 5.57 0 9947020 5.57 0 0
GRAND TOTAL 39565713 44.31 0 79261426 44.38 0 0.07
The term “encumbrance” has the same meaning as assigned to it in regulation 28(3) of the SEBI (SAST) Regulations, 2011.
iii) Change in Promoters’ shareholding
Sl. No. Name of the Shareholder
Shareholding at the beginning of the
year
Cumulative Shareholding
during the year
No. of shares
% of total shares of the
company
No. of shares
% of total
shares of the
company 1. Mr. Devineni Ashok
At the beginning of the year Bonus shares credited on 16.09.2016*At the end of the year
11130001113000
1.25-
111300022260002226000
1.251.251.25
2. Mrs. Devineni RamaaAt the beginning of the yearBonus shares credited on 16.09.2016*At the end of the year
261615261615
0.29-
261615523230523230
0.290.290.29
3. Mr. Ashwin Devineni At the beginning of the yearBonus shares credited on 16.09.2016*Acquisition on 21.11.2016#At the end of the year
16846061684606
40000
1.89-
0.02
1684606336921234092123409212
1.891.891.911.91
4. Mr. Nikhil DevineniAt the beginning of the year Bonus shares credited on 16.09.2016*At the end of the year
12750001275000
1.43-
127500025500002550000
1.431.431.43
5. Mrs. Devineni BhaktapriyaAt the beginning of the year Bonus shares credited on 16.09.2016* At the end of the year
49014504901450
5.49-
490145098029009802900
5.495.495.49
6. Dr. Devineni Rajasekhar jointly with Mr. Devineni AshokAt the beginning of the yearBonus shares credited on 16.09.2016* At the end of the year
78157815
0.01-
78151563015630
0.010.010.01

CO
MPA
NY
OV
ERV
IEW STA
TUTO
RY R
EPOR
TS FINA
NC
IAL STA
TEMEN
TS NO
TICE
Directors’ Report
Nava Bharat Ventures Limited 39
Sl. No. Name of the Shareholder
Shareholding at the beginning of the
year
Cumulative Shareholding
during the year
No. of shares
% of total shares of the
company
No. of shares
% of total
shares of the
company 7. Mrs. Alluri Nilima
At the beginning of the yearAcquisition on 29.08.2016 (Inter se transfer among promoters and between relatives)**Bonus shares credited on 16.09.2016*At the end of the year
505000
20000525000
0.57
0.02-
505000
52500010500001050000
0.57
0.590.590.59
8. Mr. Pinnamaneni Trivikrama Prasad At the beginning of the year Bonus shares credited on 16.09.2016*At the end of the year
18138361813836
2.03-
181383636276723627672
2.032.032.03
9. Mr. Pinnamaneni Trivikrama Prasad (HUF)At the beginning of the year Bonus shares credited on 16.09.2016*At the end of the year
351315351315
0.39-
351315702630702630
0.390.390.39
10. Mrs.Pinnamaneni RajashreeAt the beginning of the year Transfer on 29.08.2016 (Inter se transfer amongPromoters and between relatives)** Bonus shares credited on 16.09.2016*At the end of the year
3518778(20000)
3498778
3.94(0.02)
-
35187783498778
69975566997556
3.943.92
3.923.92
11. Mrs. Pinnamaneni ShruthiAt the beginning of the year Bonus shares credited on 16.09.2016* At the end of the year
111408111408
0.12-
111408222816222816
0.120.120.12
12. Nav Developers LimitedAt the beginning of the yearBonus shares credited on 16.09.2016* At the end of the year
79201817920181
8.87-
79201811584036215840362
8.878.878.87
13. A N Investments Private Limited At the beginning of the year Bonus shares credited on 16.09.2016*Acquisition on 22.11.2016#At the end of the year
44083494408349
50000
4.94-
0.03
4408349881669888666988866698
4.944.944.974.97
14. S.R.T.Investments Private LimitedAt the beginning of the yearBonus shares credited on 16.09.2016*Acquisition on 21/22.11.2016#At the end of the year
34600003460000
40000
3.88-
0.02
3460000692000069600006960000
3.883.883.903.90
15. A9 Homes Private Limited At the beginning of the year Bonus shares credited on 16.09.2016*At the end of the year
11320001132000
1.27-
113200022640002264000
1.271.271.27
16 V9 Avenues Private Limited At the beginning of the year Bonus shares credited on 16.09.2016*At the end of the year
11099901109990
1.24-
110999022199802219980
1.241.241.24

40 45th Annual Report 2016-17
Sl. No. Name of the Shareholder
Shareholding at the beginning of the
year
Cumulative Shareholding
during the year
No. of shares
% of total shares of the
company
No. of shares
% of total
shares of the
company 17. AV Dwellings Private Limited
At the beginning of the yearBonus shares credited on 16.09.2016*At the end of the year
10178601017860
1.14-
101786020357202035720
1.141.141.14
18. Trust : Nav Energy Private Limited
(Holding shares of the Company{NBVL} for the benefit of the Company [NBVL]) At the beginning of the yearBonus shares credited on 16.09.2016*At the end of the year
49735104973510
5.57-
497351099470209947020
5.575.575.57
* The reason for increase in Promoters (Sl.Nos.1 to 18) shareholding during the year is due to issuance of bonus shares in the ratio of 1:1 on 07.09.2016 and credited on 16.09.2016. The Paid-up Capital before and after allotment of bonus shares was 89287741 equity shares and 178575482 equity shares respectively. As such, the percentage of total shares of the Company remains the same.
** The reason for increase in promoters (Sl.No.7 & 10) shareholding during the year is due to inter se transfer between promoters and among relatives.
# The reason for increase in promoters (Sl.Nos.3, 13 & 14) shareholding during the year is due to acquisition from the market.
(iv) Shareholding Pattern of top ten Shareholders (other than Directors, Promoters and Holders of GDRs and ADRs):
Sl. No. Name of the Shareholder
Shareholding at the beginning of the year
Cumulative Shareholding during
the year
No. of shares
% of total shares of the
company
No. of shares
% of total
shares of the
company
i. HC Mauritius Limited At the beginning of the year Sale on 29.07.2016 Sale on 12.08.2016 Sale on 19.08.2016 Sale on 26.08.2016 Sale on 02.09.2016 Bonus shares credited on 16.09.2016 Sale on 16.09.2016 Sale on 23.09.2016 Sale on 07.10.2016 Sale on 14.10.2016 Sale on 21.10.2016 Sale on 28.10.2016 Sale on 04.11.2016 At the end of the year
8482989(324000)(173000)(383667)(628333)(388070)6585919
(4926807)(629810)
(6176190)(284000)(451000)(668031)
(36000)
9.50(0.36)(0.19)(0.43)(0.70)(0.44)
-(2.76)(0.35)(3.46)(0.16)(0.25)(0.38)(0.02)
848298981589897985989760232269739896585919
131718388245031761522114390311155031
70403136000
00
9.509.148.958.527.827.387.384.624.270.810.650.400.020.000.00

CO
MPA
NY
OV
ERV
IEW STA
TUTO
RY R
EPOR
TS FINA
NC
IAL STA
TEMEN
TS NO
TICE
Directors’ Report
Nava Bharat Ventures Limited 41
Sl. No. Name of the Shareholder
Shareholding at the beginning of the year
Cumulative Shareholding during
the year
No. of shares
% of total shares of the
company
No. of shares
% of total
shares of the
company
ii. Retail Employees Superannuation PTY Ltd. as Trustee for Retail Employees Superannuation Trust At the beginning of the year Bonus shares credited on 16.09.2016 Sale 04.11.2016 At the end of the year
21701692170169
(84636)
2.43-
(0.05)
2170169434033842557024255702
2.432.432.382.38
iii. Morgan Stanley Asia (Singapore) Pte. At the beginning of the year Acquisition upto 02.09.2016 Bonus shares credited on 16.09.2016 Sale on 23.09.2016 At the end of the year
2103662 141252117787
(7618)
2.360.01
-(0.00)
21036622117787423557442279564227956
2.362.372.372.372.37
iv. J. Caird BMD MB At the beginning of the year Sale on 26.08.2016 Sale on 02.09.2016 Bonus shares credited on 16.09.2016 Sale on 16.09.2016 Sale on 31.03.2017 At the end of the year
1996987(14009)(12966)
1970012(362449)
(83726)
2.23(0.01)(0.01)
-(0.20)(0.05)
1996987198297819700123940024357757534938493493849
2.232.222.212.212.011.961.96
v. J. Caird MB At the beginning of the year Sale on 02.09.2016 Bonus shares credited on 16.09.2016 Sale on 16.09.2016 Sales on 31.03.2017 At the end of the year
1860542(7342)
1853200(337624)
(78840)
2.08(0.01)
-(0.19)(0.04)
186054218532003706400336877632899363289936
2.082.072.071.881.841.84
vi. Copthall Mauritius Investment Limited At the beginning of the year Sale on 24.06.2016 Sale on 30.06.2016 Sale on 08.07.2016 Sale on 15.07.2016 Sale on 22.07.2016 Bonus shares credited on 16.09.2016 Sale on 28.10.2016 Sale on 17.02.2017 At the end of the year
1664733(344539)(439167)(349000)(242000)(197099)
92928(5979)(6116)
1.86(0.39)(0.49)(0.39)(0.27)(0.22)
---
16647331320194
881027532027290027
92928185856179877173761173761
1.861.470.980.590.320.100.100.100.100.10
vii. Nava Bharat Ventures Employee Welfare Trust through Barclays Wealth Trustees (India) Pvt. Ltd. At the beginning of the year Bonus shares credited on 16.09.2016 At the end of the year
14000001400000
1.57-
140000028000002800000
1.571.571.57
viii. Credit Suisee (Singapore) Limited At the beginning of the year Sale on 03.06.2016 Sale on 10.06.2016 Sale on 17.06.2016 Sale on 24.06.2016 At the end of the year
1161600(82500)
(285500)(496600)(297000)
1.30(0.09)(0.32)(0.56)(0.33)
11616001079100
793600297000
00
1.301.210.890.330.000.00

42 45th Annual Report 2016-17
Sl. No. Name of the Shareholder
Shareholding at the beginning of the year
Cumulative Shareholding during
the year
No. of shares
% of total shares of the
company
No. of shares
% of total
shares of the
company
ix. Bay Pond MB At the beginning of the year Sale on 03.06.2016 Sale on 10.06.2016 Bonus shares credited on 16.09.2016 Sale on 30.12.2016 Sale on 06.01.2017 At the end of the year
1122683(69747)(42517)
1010419(20012)
(363948)
1.26(0.08)(0.05)
-(0.01)(0.20)
1122683105293610104192020838200082616368781636878
1.261.181.131.131.120.920.92
x. Sunitha Vemulapalli At the beginning of the year Bonus shares credited on 16.09.2016 At the end of the year
10083151008315
1.13-
100831520166302016630
1.131.131.13
xi. East Bridge Capital Master Fund Limited At the beginning of the year Bonus shares credited on 16.09.2016 At the end of the year
907838907838
1.02-
90783818156761815676
1.021.021.02
xii. Merrill Lynch Capital Markets Espana, S.A.S.V.At the beginning of the year Sale on 22.07.2016Sale on 29.07.2016At the end of the year
840640(463280)(377360)
0.94(0.52)(0.42)
840640377360
00
0.940.420.000.00
xiii. HDFC Trustee Company Limited - A/c HDFC Prudence Fund At the beginning of the year Acquisition on 16.09.2016 Acquisition on 30.09.2016 Acquisition on 07.10.2016 Acquisition on 25.11.2016 Acquisition on 02.12.2016 Acquisition on 23.12.2016 Acquisition on 03.02.2017 At the end of the year
01570000
6650001000000
116000139000
71800333000
0.000.880.370.560.060.080.040.19
015700002235000323500033510003490000356180038948003894800
0.000.881.251.811.871.951.992.182.18
xiv. Reliance Capital Trustee Company Limited - A/c: Reliance Growth Fund At the beginning of the year Acquisition on 23.09.2016 Acquisition on 30.09.2016 Acquisition on 07.10.2016 Acquisition on 28.10.2016 Acquisition on 11.11.2016 Acquisition on 18.11.2016 Acquisition on 25.11.2016 Acquisition on 02.12.2016 Acquisition on 30.12.2016 At the end of the year
03970551
6660001000000
5000050000
100000250000
59000105000
0.002.220.380.560.030.030.050.140.030.06
03970551463655156365515686551573655158365516086551614555162505516250551
0.002.222.603.163.193.223.273.413.443.503.50

CO
MPA
NY
OV
ERV
IEW STA
TUTO
RY R
EPOR
TS FINA
NC
IAL STA
TEMEN
TS NO
TICE
Directors’ Report
Nava Bharat Ventures Limited 43
(v) Shareholding of Directors and Key Managerial Personnel:
Sl. No.
Name of the Shareholder
Shareholding at the beginning of the year
Cumulative Shareholding during
the year
No. of shares
% of total shares of the
company
No. of shares
% of total shares of the
company1 Mr. D. Ashok
At the beginning of the year Bonus shares credited on 16.09.2016 At the end of the year
11130001113000
1.25-
111300022260002226000
1.251.251.25
2 Mr. P. Trivikrama Prasad At the beginning of the year Bonus shares credited on 16.09.2016 At the end of the year Mr. P.Trivikrama Prasad (HUF) At the beginning of the year Bonus shares credited on 16.09.2016 At the end of the year
18138361813836
351315351315
2.03-
0.39-
181383636276723627672
351315702630702630
2.032.032.03
0.390.390.39
3 Mr. G.R.K.Prasad At the beginning of the year Bonus shares credited on 16.09.2016 At the end of the year
3258632586
0.04-
325866517265172
0.040.040.04
4 Mr. C. V. Durga Prasad At the beginning of the year Bonus shares credited on 16.09.2016 At the end of the year
7091570915
0.08-
70915141830141830
0.080.080.08
5 Mr.T. Hari Babu – KMP At the beginning of the year Bonus shares credited on 16.09.2016 At the end of the year
26002600
0.00-
260052005200
0.000.000.00
V. INDEBTEDNESS
Indebtedness of the Company including interest outstanding/accrued but not due for payment
(Amount in `)
Secured Loansexcluding deposits
Unsecured Loans
Deposits TotalIndebtedness
Indebtedness at the beginning of the financial year i) Principal Amount ii) Interest due but not paid iii) Interest accrued but not due
386,53,78,440-
12,13,058
47,70,00,000-
2,52,73,992
---
434,23,78,440-
2,64,87,050
Total (i+ii+iii) 386,65,91,498 50,22,73,992 - 436,88,65,490
Change in Indebtedness during the financial year
Addition
Reduction
Net Change
31,18,36,455
(124,67,20,702)
(93,48,84,247)
-
(50,22,73,992)
(50,22,73,992)
-
-
-
31,18,36,455
(174,89,94,694)
(143,71,58,239)
Indebtedness at the end of the financial year
i) Principal Amount
ii) Interest due but not paid
iii) Interest accrued but not due
293,17,07,251
-
13,68,099
-
-
-
-
-
-
293,17,07,251
-
13,68,099
Total (i+ii+iii) 293,30,75,350 - - 293,30,75,350
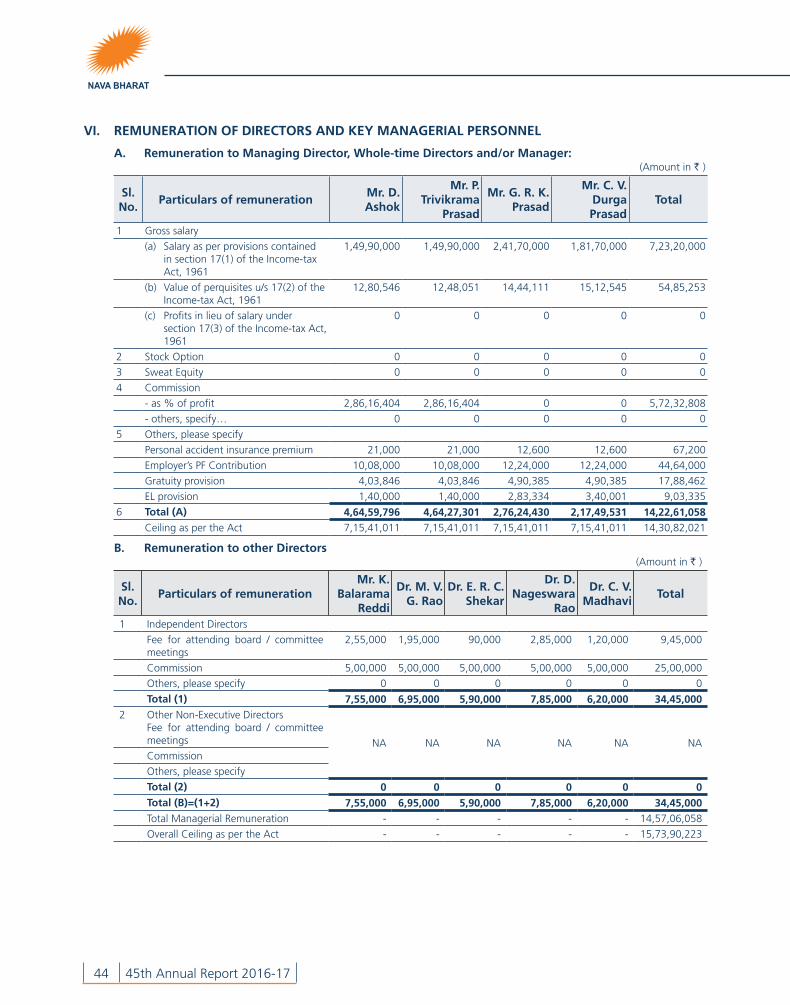
44 45th Annual Report 2016-17
VI. REMUNERATION OF DIRECTORS AND KEY MANAGERIAl PERSONNEl
A. Remuneration to Managing Director, Whole-time Directors and/or Manager:(Amount in ` )
Sl. No.
Particulars of remunerationMr. D. Ashok
Mr. P. Trivikrama
Prasad
Mr. G. R. K. Prasad
Mr. C. V. Durga Prasad
Total
1 Gross salary
(a) Salary as per provisions contained in section 17(1) of the Income-tax Act, 1961
1,49,90,000 1,49,90,000 2,41,70,000 1,81,70,000 7,23,20,000
(b) Value of perquisites u/s 17(2) of the Income-tax Act, 1961
12,80,546 12,48,051 14,44,111 15,12,545 54,85,253
(c) Profits in lieu of salary under section 17(3) of the Income-tax Act, 1961
0 0 0 0 0
2 Stock Option 0 0 0 0 0
3 Sweat Equity 0 0 0 0 0
4 Commission
- as % of profit 2,86,16,404 2,86,16,404 0 0 5,72,32,808
- others, specify… 0 0 0 0 0
5 Others, please specify
Personal accident insurance premium 21,000 21,000 12,600 12,600 67,200
Employer’s PF Contribution 10,08,000 10,08,000 12,24,000 12,24,000 44,64,000
Gratuity provision 4,03,846 4,03,846 4,90,385 4,90,385 17,88,462
EL provision 1,40,000 1,40,000 2,83,334 3,40,001 9,03,335
6 Total (A) 4,64,59,796 4,64,27,301 2,76,24,430 2,17,49,531 14,22,61,058
Ceiling as per the Act 7,15,41,011 7,15,41,011 7,15,41,011 7,15,41,011 14,30,82,021
B. Remuneration to other Directors(Amount in ` )
Sl.No.
Particulars of remunerationMr. K.
Balarama Reddi
Dr. M. V. G. Rao
Dr. E. R. C. Shekar
Dr. D. Nageswara
Rao
Dr. C. V. Madhavi
Total
1 Independent Directors
Fee for attending board / committee meetings
2,55,000 1,95,000 90,000 2,85,000 1,20,000 9,45,000
Commission 5,00,000 5,00,000 5,00,000 5,00,000 5,00,000 25,00,000
Others, please specify 0 0 0 0 0 0
Total (1) 7,55,000 6,95,000 5,90,000 7,85,000 6,20,000 34,45,000
2 Other Non-Executive Directors Fee for attending board / committee meetings NA NA NA NA NA NACommission
Others, please specify
Total (2) 0 0 0 0 0 0
Total (B)=(1+2) 7,55,000 6,95,000 5,90,000 7,85,000 6,20,000 34,45,000
Total Managerial Remuneration - - - - - 14,57,06,058
Overall Ceiling as per the Act - - - - - 15,73,90,223

CO
MPA
NY
OV
ERV
IEW STA
TUTO
RY R
EPOR
TS FINA
NC
IAL STA
TEMEN
TS NO
TICE
Directors’ Report
Nava Bharat Ventures Limited 45
C. Remuneration to Key Managerial Personnel other than MD/Manager/WTD(Amount in ` )
Sl.No.
Particulars of remuneration
Mr.T. Hari Babu Chief
Financial Officer
Mr. M. Subrahmanyam
Company Secretary & Vice President (upto
31.05.2016)
Mr. VSN RajuCompany Secretary
& Vice President
(From 01.06.2016)
Total
1 Gross salary
(a) Salary as per provisions contained in section 17(1) of the Income-tax Act, 1961
(b) Value of perquisites u/s 17(2) of the Income-tax Act, 1961
(c) Profits in lieu of salary under section 17(3) of the Income-tax Act, 1961
54,92,469
0
0
9,56,120
0
0
41,15,830
0
0
1,05,64,419
0
0
2 Stock Option 0 0 0 0
3 Sweat Equity 0 0 0 0
4 Commission - as % of profit - others, specify…
00
00
00
00
5 Others, please specifyPersonnel accident insurance premiumPF Employer’s ContributionEL Provision
6,6203,20,760
0
064,944
0
6,6202,20,000
0
13,2406,05,704
0
Total 58,19,849 10,21,064 43,42,450 1,11,83,363
VII. PENAlTIES / PUNISHMENT/ COMPOUNDING OF OFFENCES:
Type
Section of the
Companies Act
BriefDescription
Details of Penalty /
Punishment/ Compounding fees imposed
Authority [RD /
NCLT / COURT]
Appeal made,if any (give
details)
A. COMPANYPenalty
Punishment
Compounding
B. DIRECTORSPenalty
Punishment
Compounding
C. OTHER OFFICERS IN DEFAULTPenalty
Punishment
Compounding
for and on behalf of the Board
Place : Hyderabad P. Trivikrama Prasad D. AshokDate : May 27, 2017 Managing Director Chairman
NIL

46 45th Annual Report 2016-17
Annexure - 5Disclosure of Particulars of Contracts/Arrangements entered into by the Company with Related Parties referred to in Sub Section (1) of Section 188 of the Companies Act, 2013
AO
C 2
(Pu
rsu
ant
to c
lau
se (
h)
of
sub
-sec
tio
n (
3) o
f Se
ctio
n 1
34 o
f th
e A
ct a
nd
Ru
le 8
(2)
of
the
Co
mp
anie
s (A
cco
un
ts)
Ru
les,
201
4)
1.
Det
ails
of
con
trac
ts o
r ar
ran
gem
ent
or
tran
sact
ion
s:
Sl.
No
The
Nam
e o
f th
e R
elat
ed P
arty
an
d N
atu
re o
f R
elat
ion
ship
Nat
ure
of
con
trac
ts/
arra
ng
emen
ts /
tran
sact
ion
s
Du
rati
on
o
f th
e co
ntr
act
Salie
nt
term
s o
f co
ntr
acts
/ar
ran
gem
ents
/tr
ansa
ctio
ns
Just
ifica
tio
n f
or
ente
rin
g in
to
con
trac
ts
Am
ou
nt
pai
d a
s A
dva
nce
, if
an
y1
Mr.
D.A
shw
in
S/o
Mr.
D.A
shok
, C
hairm
an
Revi
sion
of
rem
uner
atio
n by
sub
sidi
ary
Nav
a Bh
arat
(S
inga
pore
) Pte
. Ltd
.
5 ye
ars
Rem
uner
atio
n of
USD
875
,000
pe
r an
num
w
ith
an
annu
al
incr
emen
t no
t ex
ceed
ing
25%
.
The
Com
pany
ha
s be
en
unde
rtak
ing
vario
us
new
ve
ntur
es i
n ov
erse
as t
hrou
gh
Nav
a Bh
arat
(Si
ngap
ore)
Pte
.Li
mite
d.
NIL
2M
r. D
.Nik
hil
S/o
Mr.
D.A
shok
, C
hairm
an
App
oint
men
t as
Man
ager
in
sub
sidi
ary
Nam
phak
Po
wer
Com
pany
Lim
ited,
La
os. U
pto
Oct
ober
,201
6.
5 ye
ars
Rem
uner
atio
n of
U
SD
4000
pe
r m
onth
w
ith a
n an
nual
in
crem
ent
no
t ex
ceed
ing
25%
.
App
oint
men
t an
d re
mun
erat
ion
com
men
sura
te
with
the
qua
lifica
tion
and
expe
rienc
e of
the
App
oint
ee.
NIL
Mr.
D.N
ikhi
lS/
o M
r. D
.Ash
ok,
Cha
irman
App
oint
men
t as
a
Man
ager
in t
he C
ompa
ny
w.e
.f 0
1.01
.201
7
N.A
.Re
mun
erat
ion
of `
2.2
5 La
khs
per
mon
th.
App
oint
men
t an
d re
mun
erat
ion
com
men
sura
te
with
the
qua
lifica
tion
and
expe
rienc
e of
the
App
oint
ee.
NIL
3N
ava
Bhar
at
(Sin
gapo
re) P
te.
Lim
ited
Who
lly o
wne
d Su
bsid
iary
Expo
rts
of F
erro
Allo
ys
aggr
egat
ed t
o
` 6
,016
.26
Lak
hs
N.A
.Ex
port
s of
Fer
ro A
lloys
wou
ld
not
exce
ed `
600
cro
res
in a
fin
anci
al y
ear.
The
Com
pany
rai
ses
Invo
ices
on
N
ava
Bhar
at
(Sin
gapo
re)
Pte.
Lim
ited
for
ship
men
ts o
n re
ceip
t of
exp
ort
orde
rs.
NIL
4M
aam
ba
Col
lierie
s Li
mite
dSt
ep D
own
Subs
idia
ry
Proj
ect
Man
agem
ent
and
Supp
ort
Serv
ices
inco
me
was
` 4
44.0
2 la
khs.
N.A
.Pr
ojec
t M
anag
emen
t an
d Su
ppor
t Se
rvic
es
may
no
t ex
ceed
`
18
cror
es
in
a fin
anci
al y
ear.
Fee
for
prov
idin
g pr
ojec
t su
ppor
t se
rvic
es is
bas
ed u
pon
the
prev
ailin
g ra
te
per
man
ho
ur c
harg
ed b
y a
3rd
part
y of
ferin
g si
mila
r se
rvic
es
to
Maa
mba
Col
lierie
s Li
mite
d.
NIL
5N
ava
Bhar
at
Ener
gy In
dia
Lim
ited
Step
Dow
n Su
bsid
iary
Leas
e re
nt r
ecei
ved,
sal
e of
fly
ash
bric
ks, u
tility
ch
arge
s re
ceiv
ed, s
ale
of
fixed
ass
ets
for `
561.
06
lakh
s, s
ecur
ity p
rovi
ded
by p
ledg
e of
sha
res
of
` 52
00 la
khs
in t
he
finan
cial
yea
r.
N.A
.Th
e pr
ovis
ion
of c
erta
in g
oods
, m
ater
ial
serv
ices
or
fa
cilit
y ex
tend
ed
to
the
Com
pany
’s st
ep
dow
n su
bsid
iary
, N
ava
Bhar
at
Ener
gy
Indi
a Li
mite
d fo
r op
erat
ion
of i
ts 1
50 M
W
Pow
er P
lant
at
Palo
ncha
. Th
e ag
greg
ate
valu
e no
t exc
eedi
ng
` 50
cro
res
in a
fina
ncia
l yea
r.
Nav
a Bh
arat
En
ergy
In
dia
Lim
ited
is f
ully
ow
ned
by t
he
Com
pany
the
Uni
t of
whi
ch
was
lo
cate
d,
in
the
sam
e C
ompa
ny’s
prem
ises
and
hen
ce
the
term
s an
d co
nditi
ons
will
be
dec
ided
mut
ually
.
NIL
Th
e Bo
ard
appr
oved
the
abo
ve t
rans
actio
ns a
t th
eir
resp
ectiv
e m
eetin
gs a
nd t
he s
ame
wer
e al
so a
ppro
ved
by t
he s
hare
hold
ers.

CO
MPA
NY
OV
ERV
IEW STA
TUTO
RY R
EPOR
TS FINA
NC
IAL STA
TEMEN
TS NO
TICE
Directors’ Report
Nava Bharat Ventures Limited 47
2.
Det
ails
of
mat
eria
l co
ntr
acts
or
arra
ng
emen
t o
r tr
ansa
ctio
ns
at a
rm’s
len
gth
bas
is:
Sl.
No
The
Nam
e o
f th
e R
elat
ed P
arty
an
d N
atu
re o
f R
elat
ion
ship
Nat
ure
of
con
trac
ts/
arra
ng
emen
ts /
tran
sact
ion
s
Du
rati
on
o
f th
e co
ntr
act
Salie
nt
term
s o
f co
ntr
acts
/ar
ran
gem
ents
/tr
ansa
ctio
ns
Just
ifica
tio
n f
or
ente
rin
g in
to
con
trac
ts
Am
ou
nt
pai
d a
s ad
van
ce,
if a
ny
1D
r.D.R
ajas
ekha
r
Brot
her
of
Mr
D.A
shok
, C
hairm
an
Rent
pai
d of
` 1
,29,
025/
- pe
r m
onth
for
Apr
il an
d M
ay, 2
016
and
`
1,29
,564
/- p
er m
onth
fr
om J
une,
201
6 to
Mar
ch,
2017
(inc
ludi
ng S
ervi
ce T
ax
of `
15,
625/
- pe
r m
onth
fo
r A
pril
and
May
, 201
6 an
d `
16,1
64/-
per
mon
th
from
Jun
e, 2
016
to M
arch
, 20
17)
N.A
.Re
nt
paid
fo
r th
e Re
gist
ered
Offi
ce o
f th
e C
ompa
ny a
t 3r
d Fl
oor
of
‘Nav
a Bh
arat
Cha
mbe
rs’
for
3000
Sft
.
The
Com
pany
has
let
out
2nd
Flo
or o
f th
e Pr
emis
es a
t a
rent
of
` 5,
69,9
13/-
pe
r m
onth
for
Apr
il an
d M
ay,
2016
and
`
4,88
,221
/- p
er m
onth
fro
m J
une,
201
6 to
Mar
ch, 2
017)
(inc
ludi
ng S
ervi
ce T
ax o
f `
69,8
33/-
per
mon
th f
or A
pril
and
May
, 20
16 a
nd `
61,
271/
- pe
r m
onth
fro
m
June
, 201
6 to
Mar
ch, 2
017)
adm
easu
ring
an a
rea
of 8
539
sft
at a
rent
of `
59/-
per
sf
t pe
r m
onth
for
Apr
il an
d M
ay,
2016
an
d `
50/-
per
sft
per
mon
th f
rom
Jun
e,
2016
to
M
arch
, 20
17.
The
rent
pa
id
by t
he C
ompa
ny i
s lo
wer
tha
n th
e re
nt
rece
ived
by
the
Com
pany
in
the
sam
e pr
emis
es.
Hen
ce,
rent
pai
d is
bel
ow t
he
arm
’s le
ngth
pric
e an
d in
the
ord
inar
y co
urse
of
busi
ness
.
NIL
2N
ava
Bhar
at
(Sin
gapo
re) P
te.
Lim
ited
a) G
uara
ntee
Com
mis
sion
on
Cor
pora
te
Gua
rant
ees
@ 2
.00%
an
d 2.
60%
i.e
` 75
3.94
la
khs
N.A
.Th
e in
com
e on
ac
coun
t of
gua
rant
ee
com
mis
sion
is `
753
.94
lakh
s.
The
Com
mis
sion
on
gu
aran
tees
an
d in
tere
st o
n lo
an a
re s
imila
r to
the
char
ges
by o
ther
s an
d on
an
arm
’s le
ngth
bas
is.
NIL
b) In
tere
st o
n Lo
an @
5%
pe
r an
naum
i.e
`
2,46
9.44
lakh
s
N.A
.Th
e In
tere
st in
com
e on
lo
an is
` 2
,469
.44
lakh
s.
3N
ava
Ener
gy P
te.
Ltd.
a) G
uara
ntee
Com
mis
sion
on
Cor
pora
te
Gua
rant
ees
@ 2
.00%
i.e
` 88
6.87
lakh
s
N.A
.Th
e in
com
e on
ac
coun
t of
gua
rant
ee
com
mis
sion
is `
886
.87
lakh
s.b)
Ren
derin
g te
chni
cal
supp
ort
(O&
M) s
ervi
ces
inco
me
was
` 1
,421
.28
Lakh
s
N.A
.Te
chni
cal s
uppo
rt
(O&
M) s
ervi
ces
`
1,42
1.28
Lak
hs
The
Com
mis
sion
on
gu
aran
tees
an
d in
com
e fr
om T
echn
ical
sup
port
(O
&M
) se
rvic
es
are
sim
ilar
to
the
char
ges
by
othe
rs a
nd o
n an
arm
’s le
ngth
bas
is.
NIL
The
Boar
d ap
prov
ed t
he a
bove
tra
nsac
tions
at
thei
r re
spec
tive
mee
tings
.
for
and
on b
ehal
f of
the
Boa
rd
Plac
e : H
yder
abad
P.
Triv
ikra
ma
Pras
ad
D. A
sho
kD
ate
: May
27,
201
7 M
anag
ing
Dire
ctor
C
hairm
an

48 45th Annual Report 2016-17
Annexure - 6Particulars of loans, guarantees or investments during the Financial Year 2016-17 under section 186 of the Companies Act, 2013
Nature of transaction (whether loan/guarantee/security/acquisition)
Purpose Date of making
loan/ acquisition/
giving guarantee/
providing security
Name and address of the person
or body corporate to whom
it is made or given
or whose securities
have been acquired
(listed/unlisted entities)
Amount of loan/
security/ acquisition /guarantee
Amount in `
Time period
for which it is made/
given
Date of passing
of Board Resolution
For Loans
Rate of Interest
Date of maturity
Towards Equity Share Capital
For making Nava Energy Pte Ltd., as a wholly owned subsidiary (directly)
15.06.2016 Nava Energy Pte Ltd.,120, Lower Delta Road, #05-14Cendex CentreSingapore -169208
67,190 _ 09.11.2015 _ _
For making Nava Agro Pte Ltd., as a wholly owned subsidiary (directly)
01.03.2017 Nava Agro Pte Ltd., 120, Lower Delta Road, #05-14,Cendex CentreSingapore -169208
67,020 _ 17.11.2016 _ _
Note: The aggregate investments made as on March 31, 2017 has been provided in the financial statement vide Note No.7.
for and on behalf of the Board
P. Trivikrama Prasad D. Ashok Managing Director ChairmanPlace : HyderabadDate : May 27, 2017

CO
MPA
NY
OV
ERV
IEW STA
TUTO
RY R
EPOR
TS FINA
NC
IAL STA
TEMEN
TS NO
TICE
Directors’ Report
Nava Bharat Ventures Limited 49
Annexure - 7REMUNERATION POlICY
PREAMBlE:
This Policy covers the remuneration and other terms of employment for the Company’s Executive Team. The remuneration policy for members of the Board and for Management aims at improving the performance and enhancing the value of the Company by motivating and retaining them and to attract the right persons to the right jobs in the Company.
1. The Objective:
The object of this Remuneration Policy is to make the Company a desirable workplace for competent employees and thereby secure competitiveness, future development and acceptable profitability. In order to achieve this, it is imperative that the Company is in a position to offer competitive remuneration in all operational locations. Remuneration of executives and other key employees shall take into consideration the remuneration of other employees of the Company and thereby aim to secure coordinated and fair Remuneration Policy for the Company.
2. Nomination and Remuneration Committee:
The Board of Directors appoints a Nomination and Remuneration Committee which shall consist of three members of the Board of Directors. The Committee shall work in accordance with a special mandate of the Board. The Nomination and Remuneration Committee shall be advisory to the Board of Directors and the Managing Director regarding terms of employment for the executives of the Company and setting a Remuneration Policy. The Committee shall also supervise that terms of employment of employees are in line with the Remuneration Policy.
3. Remuneration of the Board of Directors:
The Promoter Directors should be paid a profit related commission apart from salary and perquisites. The Working Directors shall be paid a monthly salary, according to decision taken by the Annual General Meeting in that respect, as specified in the Act. The Board of Directors shall take into account the time spent by the Board Members on their duties, their responsibilities, as well as the operational and economical performance of the Company. Additional payments may be effected to individual Board Members for specific projects which cannot
be classified as ordinary tasks for Board Members, as well as for work in Sub-Committees of the Board, as applicable subject to necessary approvals as per the Companies Act, 2013. Payments for such tasks shall be subject to approval by the other Board Members. The Company shall secure immunity for the Board of Directors and the KMP for all claims that can eventually be made against them, connected to their work on behalf of the Company.
4. Senior Executives – Terms of employment:
The amount of basic salaries and other remuneration shall take into account education, working experience and previous employment. Other details of remuneration and other benefits, as well as terms of notice, shall be mentioned in the employment contract. Bonuses and stock incentives shall also be included in the employment contract, as specified in the Remuneration Policy.
When stipulating the period of notice for termination of the employment contract, the period may be directly related to the nature or duration of the employment of the Senior Executives. The employment contract shall also stipulate the terms of notice.
The basic salary of the Senior Executives shall be revised periodically and shall be based on evaluation of the performance of the Senior Executives, the development of salaries for similar positions in comparable companies and the general performance and operations of the Company.
The employment contract should include and stipulate all payments due to the Senior Executives upon termination of the contract.
5. Incentives:
The employees may be paid incentives or offered stock incentives, based on specific plans prepared by the Board of Directors. Incentives shall be directly related to the working performance of the individual employees, their status and responsibility, the economical performance of the Company, the achievements of certain operational goals, including reaching certain budget targets. Such incentives can only be paid out to employees who are still working for the Company or when the incentives are due for payment for the period of service.

50 45th Annual Report 2016-17
6. Stock Incentives:
The Nomination and Remuneration Committee is authorized to make proposal to the Board of Directors, offering individual key employees of the Company stock incentives in the Company, in addition to the set terms in the individual employment contracts.
When evaluating whether key employees shall be offered stock incentives, the status and responsibilities, working performance and future prospects of each individual shall be taken into consideration. Such stock incentives can only be granted if the individuals are still working for the Company at the time when the incentives are awarded.
If the Board of Directors decides to offer stock incentives to key employees of the Company, a stock incentive plan shall be presented to shareholders meeting, for approval. The Board shall present to the Annual General Meeting the prescribed details of such stock incentive plan.
The Company shall enter into written stock incentive agreements with employees. The agreements shall always be subject to the conditions laid down in the relevant guidelines.
7. Terms of Reference:
The terms of reference of the Nomination and Remuneration Committee, inter alia, consist of reviewing the overall compensation policy, service agreements, performance incentive and other employment conditions of Executive Director(s) and Senior Management Personnel.
The recommendations of the Nomination and Remuneration Committee are considered and approved by the Board of Directors, subject to the approval of the shareholders, wherever necessary. Additionally the Nomination and Remuneration Committee has been vested with the powers for administration of Remuneration policy:
(a) The Nomination and Remuneration Committee shall identify persons who are qualified to become directors and who may be appointed in senior management in accordance with the criteria laid down, recommend to the Board their appointment and removal and shall carry out evaluation of every director’s performance.
(b) The Nomination and Remuneration Committee shall formulate the criteria for determining qualifications, positive attributes and independence of a director from time to time. The Committee recommends to the Board a policy, relating to the remuneration for the Directors, Key Managerial Personnel and Other Employees.
(c) The Nomination and Remuneration Committee, while formulating the policy under (b) above will ensure that:
i. The level and composition of remuneration is reasonable and sufficient to attract, retain and motivate Directors of the quality required to run the Company successfully;
ii. Relationship of remuneration to performance is clear and meets appropriate performance benchmarks; and
iii. Remuneration to Directors, Key Managerial personnel and senior management involves a balance between fixed and incentive pay reflecting short and long term performance objectives, appropriate to the working of the Company and its goals.
Provided that such Policy shall be disclosed in the Board’s Report.
The role and responsibilities of the position are the criteria for determining the qualification and positive attributes. The criteria for independence of independent directors are as specified under Section 149(6) of the Companies Act, 2013.
The Committee prescribes the details of qualifications, skills, etc., required as per the needs and also determines the remuneration with breakup at the time of appointment of Directors and all members of the Senior Management, one level below the Executive Directors including the functional heads.
The criteria for the appointment of directors, KMPs and senior management personnel are as follows:
A person for appointment as director, KMP or in senior management should possess adequate qualification, expertise and experience for the position considered for appointment. The Committee decides whether qualification, expertise and experience possessed by a person are sufficient for the concerned position. The Committee ascertains the credentials and integrity of the person for appointment as director, KMP or senior management level and recommends to the Board his / her appointment.
The Committee, while identifying suitable persons for appointment to the Board, will consider candidates on merit against objective

CO
MPA
NY
OV
ERV
IEW STA
TUTO
RY R
EPOR
TS FINA
NC
IAL STA
TEMEN
TS NO
TICE
Directors’ Report
Nava Bharat Ventures Limited 51
criteria and with due regard for the benefits of diversity on the Board.
The Nomination and Remuneration Committee presently comprises three (3) Directors who are all independent.
The details of composition of the Nomination and Remuneration Committee along with attendance of the Committee Members at the meetings held during the year would be disclosed in the Annual Report of the Company.
8. Remuneration – General Principles:
I. Guiding principles for remuneration and other terms of employment:
The guiding principle is that the remuneration and the other terms of employment for the Executives shall be reasonable, adequate and competitive in order to ensure that the Company could attract and retain competent Executives.
The annual report of the Company also sets out details of the total remuneration and benefits allowed to the Senior Executives drawing a total remuneration of above ` 60 lakhs per annum or such higher stipulated sum under the Companies Act, 2013.
The Nomination and Remuneration Committee considers a) the financial position and profitability of the Company; b) nature and responsibility of the position; and c) remuneration packages prevailing in industry or other organisations comparable in regard to the size and complexity of operations.
II. The principles for fixed salaries:
The Executives’ fixed salary shall be competitive and based on the individual Executive's responsibilities and performance.
III. The principal terms of variable salary and incentive schemes, including the relation between fixed and variable components of the remuneration and the linkage between performance and remuneration:
The Executives may receive variable salaries in addition to fixed salaries.
The variable salary may be based on inter alia the performance of the Company or the Unit where the Executive is employed. The performance will be related to the fulfilment of various improvement targets or the attainment of certain financial objectives.
Such targets will be set by the Board and may relate to inter alia operating income, operating margin or cash flow. The Board may under certain conditions decide to cancel or limit variable salary to be paid to the Executives.
IV. The principal terms of non-monetary benefits, superannuation, notice of termination and severance pay:
a) Non-monetary benefits:
The Executives may be provided customary non-monetary benefits such as Company cars and Company health care or medical allowance. In addition thereto in individual cases Company housing and other benefits may also be offered.
b) Long Term Incentives:
Long term incentives (“LTI’s”) may be provided to certain senior executives and eligible employees to reward creation of shareholder value, and provide incentives to create further value as well as to attract and retain executives.
The Company believes that the most significant value that can be created for shareholders will occur by way of Senior Executives’ delivering on the strategic outcomes and goals set by the Board from time to time.
c) Additional Arrangements:
In addition to the main conditions of employment, a number of additional arrangements apply to members of the Board of Management. These additional arrangements, such as expense and relocation allowances, medical insurance, accident insurance and Company car arrangements are broadly in line with those of other competitive companies. In the event of disablement, the employees are entitled to benefits in line with other companies. They also benefit from coverage under the Company’s Directors and Officers (D&O) policies. The Company policy forbids personal loans to Non-Executive Directors and the loans to Working Directors would be as permitted by the Companies Act, 2013.

52 45th Annual Report 2016-17
9. Performance Evaluation:
Legal Provisions:
1. Section 134(3)(p): The manner in which formal annual evaluation has been made by the Board of its own performance and that of its Committees and individual Directors shall be disclosed in the Board Report (self evaluation).
2. Section 178(2): The Nomination and Remuneration Committee shall carry out evaluation of every Director’s performance.
3. Schedule IV appended to the Companies Act stipulates that the performance evaluation of Independent Directors shall be done by the entire Board of Directors excluding the Directors being evaluated.
On the basis of the report of performance evaluation it shall be determined whether to extend or continue the term of appointment of the Independent Director.
The re-appointment of Independent Director shall be on the basis of report of performance evaluation.
The role and responsibilities of the Committee shall be as delineated in Part D, Para A of Schedule II of the SEBI (Listing Obligations and Disclosure Requirements) Regulations, 2015 read with Regulation 19(4) of the Regulations.
Criteria for evaluation of Independent Directors and Board:
Performance indicators for evaluation:
Independent Directors have three key roles – governance, control and guidance. Some of the performance indicators based on which the Independent Directors may be evaluated are:
• Ability to contribute to and monitorcorporate governance practices.
• Ability to contribute by introducinginternational best practices to address top management issues.
• Activeparticipationinlongtermstrategicplanning.
• Commitment to the fulfilment of adirector’s obligations and fiduciary responsibilities.
Attendance: The performance evaluation of Independent or non-executive members is done by the Board annually based on criteria of attendance and contributions at Board/Committee Meetings as also for the role played other than at Meetings.
Criteria formulated by Nomination Committee for evaluation of Independent Directors and Board Committees and Individual Directors:
In line with corporate governance guidelines, evaluation of all Board Members is done on an annual basis. This evaluation is done by the entire Board led by the Chairman of the Board with specific focus on the performance and effective functioning of the Board, Committees of the Board and individual Directors and report the recommendation to the Board. The evaluation process also considers the time spent by each of the Board Members, core competencies, personal characteristics, accomplishment of specific responsibilities and expertise.
10. Authority to decide on deviations from this Policy:
The Board of Directors may deviate from this Policy if there are reasons to do so in individual cases.

CO
MPA
NY
OV
ERV
IEW STA
TUTO
RY R
EPOR
TS FINA
NC
IAL STA
TEMEN
TS NO
TICE
Directors’ Report
Nava Bharat Ventures Limited 53
Annexure - 8The ratio of the remuneration of each director to the median employee’s remuneration and other details in terms of sub-section 12 of Section 197 of the Companies Act, 2013 read with Rule 5(1) of the Companies (Appointment and Remuneration of Managerial Personnel) Rules, 2014:
Sr.No. Requirements DisclosureI The ratio of the remuneration of each
director to the median remuneration of the employees for the financial year
Name of the Director RatioMr. D. Ashok, Chairman 128.88x
Mr. P. Trivikrama Prasad, MD 128.79xMr. GRK Prasad, ED 76.58xMr. CV Durga Prasad, Director (BD) 60.27xDr. ERC Shekar, Director 1.39xMr. K. Balarama Reddi, Director 1.39xDr. D. Nageswara Rao, Director 1.39xDr. MVG Rao, Director 1.39xDr. CV Madhavi, Director 1.39x
II The Percentage increase in remuneration of each director, CFO, CEO, CS in the financial year
Name of the Director % increase in remuneration
Mr. D. Ashok, Chairman NilMr. P. Trivikrama Prasad, MD NilMr. GRK Prasad, ED NilMr. CV Durga Prasad, Director (BD) NilDr. ERC Shekar, Director 25.00Mr. K. Balarama Reddi, Director 25.00Dr. D. Nageswara Rao, Director 25.00Dr. MVG Rao, Director 25.00Dr. CV Madhavi, Director 25.00Mr. T. Haribabu, CFO 25.08Mr. VSN Raju, CS & VP (w.e.f. 01.06.2016) Not Applicable
III The percentage increase in the median remuneration of employees in the financial year
Median remuneration of the employees decreased by 3.24%.
IV The number of permanent employees on the rolls of the Company
There were 900 permanent employees on the rolls as on March 31, 2017.
V Average percentile increase already made in the salaries of employees other than the managerial personnel in the last financial year and its comparison with the percentile increase in the managerial remuneration and justification thereof and point out if there are any exceptional circumstances for increase in the managerial remuneration.
The average percentage increase already made in the salaries of employees other than managerial personnel was 8.67%, which contains salary increases of senior staff who are given increases once in two years. The ratio of percentile increase in salaries of employees and managerial personnel is 1:2.17.
The remuneration of some of the managerial personnel is revised once in two years. There were no exceptional circumstances for increase in the managerial remuneration.
VI Affirmation that the remuneration is as per the remuneration policy of the Company.
Yes, it is confirmed that the remuneration is as per the remuneration policy of the Company.
for and on behalf of the Board
P. Trivikrama Prasad Managing Director
Place : Hyderabad D. AshokDate : May 27, 2017 Chairman

54 45th Annual Report 2016-17
Stat
emen
t o
f Pa
rtic
ula
rs o
f Em
plo
yees
pu
rsu
ant
to t
he
Pro
visi
on
s o
f R
ule
5 (
2) o
f th
e C
om
pan
ies
(Ap
po
intm
ent
and
Rem
un
erat
ion
) R
ule
s, 2
014
Sl.
No.
Nam
e &
Des
igna
tion
Rem
uner
atio
n re
ceiv
ed
(` in
lakh
s)
Nat
ure
of
empl
oyem
ent,
w
heth
er
cont
ract
ual o
r ot
herw
ise
Qua
lifica
tion
and
expe
rienc
e of
the
em
ploy
ee
Dat
e of
C
omm
ence
men
t of
em
ploy
emen
tA
ge
The
last
em
ploy
emen
t he
ld
befo
re jo
inin
g th
e C
ompa
ny
The
perc
enta
ge
of e
quity
sha
res
held
by
the
empl
oyee
in
the
Com
pany
w
ithin
the
m
eani
ng o
f cl
ause
(iii)
of
sub-
rule
(2) o
f Ru
le 5
Whe
ther
the
em
ploy
ee is
a
rela
tive
of
any
dire
ctor
or
man
ager
of
the
com
pany
1M
r. D
. Ash
ok
Cha
irman
464
.20
Con
trac
tual
M.B
.A. (
U.S
.A.)
35
yea
rs
28.0
8.19
8160
…
Not
App
licab
le
(No
empl
oyee
w
as in
rec
eipt
of
re
mun
erat
ion
abov
e th
e re
mun
erat
ion
of M
anag
ing
Dire
ctor
/ W
hole
-tim
e D
irect
or)
Yes
2M
r. P.
Triv
ikra
ma
Pras
ad
Man
agin
g D
irect
or 4
63.8
8 C
ontr
actu
alM
.B.A
. (U
.S.A
.)
35 y
ears
01.0
8.19
8163
…Ye
s
3M
r. G
RK. P
rasa
d
Exec
utiv
e D
irect
or 2
75.8
5 C
ontr
actu
alB.
Sc.,
F.C
.A. &
F.
C.S
. 36
yea
rs
16.0
8.19
9559
Gen
eral
Man
ager
, D
CL
Poly
ster
s Lt
d.N
o
4M
r. C
.V. D
urga
Pra
sad
Dire
ctor
(Bus
ines
s D
evel
opm
ent)
217
.10
Con
trac
tual
B.C
om
44 y
ears
01.0
7.19
7365
…N
o
5M
r. J.
Ram
esh
Exec
utiv
e V
ice
Pres
iden
t (F
AP-
O)
329
.04
Con
trac
tual
B.C
om.,
M.B
.A.
34 y
ears
01.0
4.19
9760
Dire
ctor
N
av C
hrom
e Lt
d.,
No
6M
r. P.
J.V.
Sar
ma
Seni
or E
xecu
tive
V
ice
Pres
iden
t
(Str
ateg
y &
Pla
nnin
g)
137
.85
Con
trac
tual
B.Te
ch.,
AIC
WA
, PSD
FM
36 y
ears
02.0
8.20
1058
Regi
onal
Dire
ctor
, IC
ICI L
omba
rd
Gen
eral
Insu
ranc
e C
o. L
td.
No
7M
r. A
. Ven
kata
Rao
Ex
ecut
ive
Vic
e Pr
esid
ent
154
.04
Con
trac
tual
B.E.
(Mec
hani
cal)
43 y
ears
01.0
7.19
7469
…N
o
8M
r. N
Pra
bhak
ar
Vic
e Pr
esid
ent
68.
42
Con
trac
tual
B.Sc
., A
NSI
(Sug
ar
Tech
nolo
gy)
36 y
ears
07.0
9.19
9859
Chi
ef C
hem
ist,
Th
e A
ndhr
a Su
gars
Li
mite
d
No
9M
r. T
Har
i Bab
u C
hief
Fin
anci
al O
ffice
r 5
8.20
A
s pe
r C
ompa
ny’s
Rule
s
B.C
om.
A.C
.A.
29 Y
ears
08.0
7.19
9356
Man
ager
(A
ccou
nts)
, Suc
hitr
a C
ompo
nent
s Lt
d
No
10M
r. P
Ram
esh
C
hief
Gen
eral
Man
ger
(PP
- O
& M
)
50.
78
As
per
Com
pany
’s Ru
les
B.Te
ch.,
(Mec
hani
cal)
29 y
ears
01.0
8.19
9651
Resi
dent
En
gine
er, I
ndw
ell
Con
stru
ctio
ns
No
Not
es: 1
. G
ross
rem
uner
atio
n in
clud
es s
alar
y, t
axab
le a
llow
ance
s, c
omm
issi
on,
valu
e of
per
quis
ites
as p
er t
he I
ncom
e-Ta
x Ru
les,
196
2 an
d C
ompa
ny’s
cont
ribut
ion
to P
rovi
dent
and
Su
pera
nnua
tion
Fund
s.
2.
Th
e ex
perie
nce
show
n ab
ove
refe
rs t
o th
e to
tal p
erio
d in
yea
rs o
f ca
reer
.
for
and
on b
ehal
f of
the
Boa
rd
Plac
e : H
yder
abad
P.
Triv
ikra
ma
Pras
ad
D. A
sho
kD
ate
: May
27,
201
7 M
anag
ing
Dire
ctor
C
hairm
an
Annexure - 9

CO
MPA
NY
OV
ERV
IEW STA
TUTO
RY R
EPOR
TS FINA
NC
IAL STA
TEMEN
TS NO
TICE
Directors’ Report
Nava Bharat Ventures Limited 55
Annexure - 10Form No. MR-3
SECRETARIAL AUDIT REPORT [Pursuant to section 204(1) of the Companies Act, 2013 and rule No.9 of the Companies (Appointment and
Remuneration of Managerial Personnel) Rules, 2014]
ToThe MembersNava Bharat Ventures Limited Hyderabad
We have conducted the secretarial audit of the compliance of applicable statutory provisions and the adherence to good corporate practices by Nava Bharat Ventures Limited, (hereinafter called the company). Secretarial Audit was conducted in a manner that provided us a reasonable basis for evaluating the corporate conducts/statutory compliances and expressing our opinion thereon.
Based on our verification of the Company’s books, papers, minute books, forms and returns filed and other records maintained by the company and also the information provided by the Company, its officers, agents and authorized representatives during the conduct of secretarial audit, we hereby report that in our opinion, the company has, during the audit period covering the financial year ended on March 31, 2017 has complied with the statutory provisions listed hereunder and also that the Company has proper Board-processes and compliance-mechanism in place to the extent, in the manner and subject to the reporting made hereinafter:
We have examined the books, papers, minute books, forms and returns filed and other records maintained by the company according to the provisions of:
(i) The Companies Act, 2013 (the Act) (applicable Sections as on date) and the Rules made under that Act;
(ii) The Companies Act, 1956 (applicable Sections as on date) and the Rules made under that Act;
(iii) The Securities Contracts (Regulation) Act, 1956 (‘SCRA’) and the rules made there under;
(iv) The Depositories Act, 1996 and the Regulations and Bye-laws framed there under;
(v) Foreign Exchange Management Act, 1999 and the rules and regulations made there under to the extent of Foreign Direct Investment and Overseas Direct Investment;
(vi) The following Regulations and Guidelines prescribed under the Securities and Exchange Board of India Act, 1992 (‘SEBI Act’):-
(a) The Securities and Exchange Board of India (Substantial Acquisition of Shares and Takeovers) Regulations, 2011;
(b) The Securities and Exchange Board of India (Prohibition of Insider Trading) Regulations, 2015;
(c) The Securities and Exchange Board of India (Share Based Employee Benefits) Regulations, 2014 and Securities and Exchange Board of India (Employee Stock Option Scheme and Employee Stock Purchase Scheme) Guidelines, 1999 (since repealed);
(d) The Securities and Exchange Board of India (Issue of Capital and Disclosure Requirements) Regulations, 2009;
(e) The Securities and Exchange Board of India (Depositories and Participants) regulations, 1996;
(vii) Provisions of the following Regulations and Guidelines prescribed under the Securities and Exchange Board of India Act, 1992 (‘SEBI Act’) were not applicable to the Company under the financial year under report:-
(a) The Securities and Exchange Board of India (Issue and Listing of Debt Securities) Regulations, 2008;
(b) The Securities and Exchange Board of India (Delisting of Equity Shares) Regulations, 2009; and
(c) The Securities and Exchange Board of India (Buyback of Securities) Regulations, 1998;
(viii) The industry specific laws that are applicable to the company are as follows:
(a) Electricity Act, 2003;
(b) Sugar Factories Control Act, 1950;
(c) Sugar Cess Act 1982;
(d) Food Safety And Standards Act, 2006;
56 45th Annual Report 2016-17
(e) The Essential Commodities, Act 1955;
(f) Mines Act, 1952;
(g) Mines and Mineral (Regulation and Development) Act, 1957;
(h) Explosives Act, 1884;
(i) Indian Boilers Act, 1923;
(j) Central Electricity Authority (Measures relating to Safety and Electric Supply) Regulations, 2010;
(k) Central Electricity Authority (Safety Requirements for Construction, Operation and Maintenance of Electrical Plants and Electric Lines) Regulations 2011;
(l) The Water (Prevention And Control Of Pollution) Act, 1974;
(m) The Air (Prevention And Control Of Pollution) Act, 1981; and
(n) The Environment (Protection) Act, 1986.
We have also examined compliance with the applicable clauses of the following:
i) Secretarial Standards SS-1 and SS-2 with respect to meetings of the board of directors and general meetings respectively issued and notified by The Institute of Company Secretaries of India which came into force w.e.f. 1st July, 2015 under the provisions of section 118(10) of the Act.
ii) Securities and Exchange Board of India (Listing Obligations and Disclosure Requirements) Regulations, 2015.
During the period under review, the Company has complied with the provisions of the Acts, Rules, Regulations, Guidelines, Standards, etc. mentioned above.
We further report that
The Board of Directors of the Company is duly constituted with proper balance of Executive Directors, Non-Executive Directors and Independent Directors. There were no changes in the composition of the Board of Directors during the period under review.
Adequate notice is given to all directors to schedule the Board Meetings, agenda and detailed notes on agenda were sent at least seven days in advance, and a system exists for seeking and obtaining further information and clarifications on the agenda items before the meeting and for meaningful participation at the meeting.
As a general practice of the Board, decisions are taken on unanimous consent.
We further report that there are adequate systems and processes in the company commensurate with the size and operations of the company to monitor and ensure compliance with applicable laws, rules, regulations and guidelines.
We further report that the Company has obtained the approval of shareholders at the Annual General Meeting held on August 24, 2016 for the following matters;
a) To issue Bonus shares in the ratio of One share for every existing share held.
b) To appoint Mr.P.Trivikrama Prasad as Managing Director and pay remuneration for a period of 5 years w.e.f. March 19, 2017.
c) To enter into transactions with Mamba Collieries Limited, a Related Party as specified under section 188.
We further report that during the year the Equity Share Capital increased to `35,71,50,964/- from `17,85,75,482/- on issue of bonus shares.
for P.S. Rao & Associates Company Secretaries
P.S.RaoPlace: Hyderabad Company Secretary Date : May 27, 2017 ACS NO: 9769
C P NO: 3829
Note: This report is to be read with our letter of even date which is annexed as ‘Annexure A’ and forms an integral part of this report.

CO
MPA
NY
OV
ERV
IEW STA
TUTO
RY R
EPOR
TS FINA
NC
IAL STA
TEMEN
TS NO
TICE
Directors’ Report
Nava Bharat Ventures Limited 57
‘ANNEXURE A’
ToThe MembersNava Bharat Ventures Limited Hyderabad
Our report of even date is to be read along with this letter.
1. Maintenance of secretarial record is the responsibility of the management of the company. Our responsibility is to express an opinion on these secretarial records based on our audit.
2. We have followed the audit practices and processes as were appropriate to obtain reasonable assurance about the correctness of the contents of the Secretarial records. The verification was done on test basis to ensure that correct facts are reflected in secretarial records. We believe that the processes and practices, we followed provide a reasonable basis for our opinion.
3. We have not verified the correctness and appropriateness of financial records and Books of Accounts of the company.
4. Where ever required, we have obtained the Management representation about the compliance of laws, rules and regulations and happening of events etc.
5. The compliance of the provisions of Corporate and other applicable laws, rules, regulations, standards is the responsibility of management. Our examination was limited to the verification of procedures on test basis.
6. The Secretarial Audit report is neither an assurance as to the future viability of the company nor of the efficacy or effectiveness with which the management has conducted the affairs of the company.
for P.S. Rao & Associates Company Secretaries
P.S.RaoPlace: Hyderabad Company Secretary Date : May 27, 2017 ACS NO: 9769
C P NO: 3829

58 45th Annual Report 2016-17
Annexure - 11DIVIDEND DISTRIBUTION POLICY
This policy applies to the distribution of dividend by Nava Bharat Ventures Limited (the “Company”) in accordance with the provisions of the Companies Act, 2013 (“Act”) and the SEBI (Listing Obligations and Disclosure Requirements) Regulations, 2015 (SEBI Regulations).
Definitions:
The terms referred to in the policy will have the same meaning as defined under the Act and the Rules made thereunder, and the SEBI Regulations.
Background:
SEBI has, vide its notification dated July 8, 2016 issued Securities and Exchange Board of India (Listing Obligations and Disclosure Requirements) (Second Amendment) Regulations, 2016 and amended Securities and Exchange Board of India (Listing Obligations and Disclosure Requirements) Regulations, 2015 to insert Regulation 43A after the Regulation 43. As per Regulation 43A, the top five hundred listed entities based on market capitalization (calculated as on March 31 of every financial year) are required to formulate a dividend distribution policy which shall be disclosed in their annual reports and on their websites.
This Policy sets out the parameters that shall be taken into account by the Board of directors of the Company to determine the distribution of dividend to its shareholders and/or retaining profits earned by the Company. The Board of directors may in extraordinary circumstances, deviate from the parameters listed in this policy.
Parameters:
a. The circumstances under which the shareholders may or may not expect dividend:
The Company shall comply with the relevant statutory requirements that are applicable to the Company in declaring dividend or retained earnings. Generally, the Board shall determine the dividend for a particular period after taking into consideration the financial performance of the Company, the advice of executive management, and other parameters described in this policy.
b. The financial /internal parameters that shall be considered while declaring dividend:
The Board of directors of the Company shall consider the following financial parameters while declaring dividend or recommending dividend to shareholders:
¾ Capital allocation plans including:
• ExpectedcashrequirementsoftheCompanytowards working capital, capital expenditure in technology and Infrastructure etc.;
• Investments required towardsexecutionofthe Company’s strategy;
• FundsrequiredforanyacquisitionsthattheBoard of directors may approve; and
• Anysharebuy-backplans.
¾ Minimum cash required for contingencies or unforeseen events;
¾ Funds required to service any outstanding loans;
¾ Liquidity and return ratios; and
¾ Any other significant developments that require cash investments.
c. External factors that shall be considered for declaration of dividend:
The Board of directors of the Company shall consider the following external parameters while declaring dividend or recommending dividend to shareholders:
• Any significant changes in macro-economicenvironment affecting India or the geographies in which the Company operates, or the business of the Company or its clients;
• Any political, tax and regulatory changes in thegeographies in which the Company operates;
• Any significant change in the business ortechnological environment resulting in the Company making significant investments to effect the necessary changes to its business model;
• Any changes in the competitive environmentrequiring significant investment.
d. Policy as to how the retained earnings shall be utilized:
The consolidated profits earned by the Company can either be retained in the business and used for various purposes as outlined above or it can be distributed to the shareholders.
e. Provisions in regard to various classes of shares:
The provisions contained in this policy shall apply to all classes of Shares of the Company. It may be noted that currently the Company has only one class of shares, namely, equity shares.
Review:
This policy will be reviewed and amended as and when required, by the Board.
limitation and Amendment:
In the event of any conflict between the Act or the SEBI Regulations or any other statutory enactments (“Regulations”) and the provisions of this policy, the Regulations shall prevail over this policy. Any subsequent amendment / modification in the Regulations, in this regard shall automatically apply to this policy.

CO
MPA
NY
OV
ERV
IEW STA
TUTO
RY R
EPOR
TS FINA
NC
IAL STA
TEMEN
TS NO
TICE
Management Discussion and Analysis
Nava Bharat Ventures Limited 59
Management discussion and analysis
The Management discussion and analysis provides an overview of the financial, operational and strategic progress made by your Company in the year 2016-17. The discussion shared below should be read together with the Directors’ report and the audited financial statements that form part of the Annual report
INDUSTRY STRUCTURE AND DEVElOPMENTS
Power
Power demand in the country has increased rapidly and is expected to rise further in the years to come. In order to meet the increasing demand for power in the country, massive addition to the installed generating capacity is required. The Government of India’s focus on attaining ‘Power for all’ has attracted large investments from the government over the last 5 years which has led to India being one of the largest producer & consumer of power in the world. The 12th Five-Year Plan (2012-2017) attracted an investment of ~US$250 billion from the government of India which resulted in a capacity expansion of 95.1 GW (excluding 25.5 GW of renewable capacity) to a total capacity of 319.6 GW. This went well beyond the targeted capacity addition of 88.5 GW, thus achieving 107.5% of the planned target. Similarly, capacity addition in FY17 was 17,518 MW against the target of 13,384 MW. Resultant to these extraordinary capacity additions, the annual growth in power generation in FY17 increased by 5.7% (~1250 BU). Though the Government’s focus is on renewable energy space, especially solar power, thermal power is by far the preferred method of producing power, given the abundance of coal availability in the country and currently accounts for 60.1% of the installed generating capacity. Intense energy conservation measures adopted by the Government helped it pare the supply deficit.
Although the quantity of coal produced in FY17 is less as compared to the previous two years, the country has seen a huge ramp up in the production of domestic coal in the last 3 years. Coal inventory at stations continues to impress, with only 1 plant facing sub-critical inventory level in March 2017. The Coal Ministry is currently working on a plan to increase the share of domestic coal that can be blended with the imported variety to cut down imports. Further, the Coal Ministry is also encouraging private investments in coal mining and has already identified coal blocks that will be bid out for commercial mining which could improve competition and keep coal prices under control. The wider availability of domestically mined coal and reduction in imports could benefit the power producers.
The power sector has continued to face constraints due to the distressed health of State-level distribution utilities, which form the primary clientele of the power generation companies. The recent policies adopted by the Government involves the implementation of a new scheme – Ujwal Discom Assurance Yojana (UDAY) which focuses on financial restructuring, revival and turnaround of discoms.
India used to have a small but vibrant market for merchant trading of power as compared to the more mature markets. However, merchant tariffs continue to face downward pressure due to excess capacity and low demand. PPAs have also dried up due to the weak financial position of the discoms. However, the successful implementation of the UDAY scheme is expected to bring in stable demand and could potentially lead to higher PPAs being entered in to.
Your Company operates 114 MW coal fired power facility in Telangana, a 20 MW mixed fuel thermal power plant in A.P. and a coal fired power facility with a capacity of 150 MW in Odisha. Coal for the power plants is primarily obtained through coal linkages while the rest is procured through e-auctions domestically. Nava Bharat Energy India Limited, a step-down subsidiary of Nava Bharat Ventures Limited operates a 150 MW coal fired power plant in Telangana which also obtains coal through e-auctions domestically in preference to imported coal.
Ferro Alloys
Ferro alloys are used in the production of iron and steel. These alloys impart distinctive qualities to steel and cast iron and serve important functions during production. Ferro Alloys impart resistance to corrosion, improve hardness and tensile strength at high temperature, give wear and abrasion resistance and other properties like creep strength to Steel.
South Africa is the leading supplier of Ferro Manganese & Silico Manganese in the world and the largest consumer of the two Manganese alloys is China. South Africa is also the leading supplier of Ferro Chrome. Due to capacity constraints, South Africa produces ~35% of global ferrochrome output despite producing ~60% of global chrome ore output. China is the world’s largest stainless steel producer. It accounts for ~65% of global Ferrochrome demand and is the largest importer of chrome ore. Thus, Ferro Alloy prices fluctuate based on the demand and supply of Ferro Alloys and Steel in China. A similar effect is seen in the prices of manganese and chrome ore which vary in line with demand emanating from China.

60 45th Annual Report 2016-17
The production growth and prices in the Iron and Steel Industry are the key drivers of demand for Ferro Alloys. The pricing controls imposed by the Government of India helped the domestic primary steel producers sustain the pricing competition from imports. Stainless Steel has achieved double digit production growth over the last two years while prices have also witnessed a good jump in the recent months. The surge in Ferro Alloy prices during the year under review was for a limited period in the fourth quarter, again emanating directly from a surge in demand from China. As such, the market scenario continues to be volatile.
Your Company operates smelters for the production of Manganese alloys (Ferro Manganese & Silico Manganese) and Chromium alloys (Ferro Chrome) in Telangana and Odisha States with manufacturing capacities of 125,000 TPA & 75,000 TPA respectively.
Sugar
India is the world’s largest consumer and the 2nd largest producer of Sugar in the world. Sugar directly and indirectly contributes over US$11 billion to the government exchequer annually. Sugar is an essential input for soft drinks/sweetened beverages, convenience foods, fast food, candy / sweets, confectionery, baking products and the respective industries. The industry is largely influenced by a lot of regulations in India. These regulations center around the economic interest of the marginal farmer, domestic prices, and the perishable nature of cane. Efforts are being made to reduce these regulatory hurdles to usher in a market driven industry.
The sugar industry is likely to be hit significantly during the current year on account of lower cane availability in Maharashtra and Karnataka due to poor monsoons last year. The expected decline in the sugar production coupled with the decline in the domestic sugar stocks and the impact of global sugar deficit scenario has firmed up the domestic sugar price. The sugar prices are expected to remain firm in the near term, given the tight stock position.
Nava Bharat Ventures operates a Sugar facility at Samalkot, Andhra Pradesh with crushing capability of 4,000 TCD of Sugarcane. It operates a 20 klpd distillery for producing rectified spirit, which is utilised in the production of Ethanol.
OPPORTUNITIES AND THREATS
Power
The demand for power is expected to rise from 1,174 TWh in FY15 to 1,895 TWh in FY22. Expansion in industrial activity, growing population, increasing penetration & per-capita usage will provide a boost to the demand for power. The power sector has been allowed 100% FDI inflows which has stimulated investments in the sector that have reached US$11.43 billion during the period April 2000 to
December 2016, accounting for 4% of total FDI inflows in India. Additionally, investment for 7 new transmission systems that includes strengthening of national grid has been sanctioned and will provide further impetus to the sector. The overall targets for capacity creation is about 100GW in the 13th 5-year plan, largely pertaining to thermal additions. The impetus to renewable power sources will continue which will help capacities to improve from 37 GW in FY16 to 175 GW in FY22.
Under the Govt.’s vision to provide power to every citizen by year 2019, new acts and policies have been announced to bring in overall development of the sector. Electricity Act (2003), National Tariff Policy (2006) and New renewable energy policy have been announced. Further, implementation of Deen Dayal Upadhyay Gram Jyoti Yojana (DDUGJY) & Integrated Power Development Scheme for rural & urban areas respectively have incentivized the sector. Implementation of Ujwal Discom Assurance Yojana (UDAY) has been brought in to provide relief to the financially stressed discoms. Amendment in National Tariff Policy (2016) has been made, wherein government is focusing more on sustainable utilisation of renewable energy resources.
A notable development in the sector holding a contra view is one of poor offtake. A combination of deceleration of industrial consumption, energy conservation and large addition of renewable energy has created an apparent surplus power situation across the country. The immediate fall out of this is a significant reduction in merchant power tariffs which hovered around variable costs of large power plants. As such this particular market segment in the power sector faces a bleak future and is accentuated by the increase in domestic coal prices. Given the low merchant power tariffs and large volumes available on the power exchange, discoms have moved away from medium to long term contracts and have been preferring short term purchases on the power exchange. Significant generating capacity, either operational or under development, is threatened by this weak and un-remunerative offtake outlook.
State Electricity Boards have traditionally borne a major chunk of the agricultural subsidy burden which has impacted the financial health of the SEBs. This hurdle has still persisted among a few SEBs and is likely to impact the power sector going ahead.
Overseas Investments
Maamba Collieries Limited (MCL), is a step- down subsidiary of Nava Bharat Ventures Limited and has implemented a 300 MW thermal power project in Zambia with a net investment outlay of about USD 843 million. Nava Bharat (Singapore), the wholly owned subsidiary of the Company holds about 65% equity in Maamba Collieries, while the balance (35%) is owned by ZCCMIH , which is the mineral investments holding Company of the Government of

CO
MPA
NY
OV
ERV
IEW STA
TUTO
RY R
EPOR
TS FINA
NC
IAL STA
TEMEN
TS NO
TICE
Management Discussion and Analysis
Nava Bharat Ventures Limited 61
Republic of Zambia. MCL has the largest coal concession in Zambia with estimated resource of 193 million tonnes comprising high grade and thermal grade coal, spread over 1,070 hectares out of a total concession area of 7,900 hectares at Maamba, in Sinazongwe district of Southern Province.
The 300 MW power plant was commissioned during the year under review and is set to operate commercially from the current year. This plant will be Zambia’s first thermal power plant and will go a long way in reducing the country’s dependence on other power sources and power imports.
The Company would derive significant spurt in revenues and profits on a consolidated basis from FY2018 onwards following the commercial operations of this well integrated 300 MW power plant in Zambia.
Ferro Alloys
Ferro alloy industry is mainly driven by demand from the iron and steel industry. Steel prices have been on the rise due to improvement in demand and due to import curbs. Steel prices in China hit the highest level in two and a half years as a significant amount of capacity was cut in 2016 to make its domestic steel sector more efficient. The government’s increased spending in social and infrastructure projects has pulled this sector from the slump, faster than expected. Apart from buoyant domestic demand, the restrictions on
steel imports from China have opened up new opportunities for Indian companies. The buoyant domestic steel demand in China may lead to further rise in iron ore, coal and steel prices globally which, in-turn, could benefit the overall Ferro Alloy Industry.
Sugar
India’s sugar production fell from a high of 28.3 million tonnes in 2013-14 to 25.1 million tonnes in 2015-16, and hit a seven-year low of 21.3 million tonnes in 2016-17 after two consecutive years of drought starting 2014. With sugar production falling, sugar prices have hit a new high of `38,000 per MT at the end of February 2017. Prices would remain high given the tight supply situation.
The Ethanol Blending Programme (EBP) has continued to remain in focus as the government has increased the mandated Ethanol blending from 5% to 10% and asked OMCs to target 10% blending of ethanol in as many States as possible. With this and the reforms in pricing and excise duties, the earnings of the Sugar industry are expected to rise. Realisations for Ethanol will get support and in addition the surplus Sugar situation will get addressed.
SEGMENT-WISE PERFORMANCE
Your Company’s focus on driving a profitable operation in light of dynamic operating conditions during FY17 is depicted in the table below:
Sr. No.
ParticularsFerro Alloys Power Sugar
31st March 2017
31st March 2016
31st March 2017
31st March 2016
31st March 2017
31st March 2016
1 Production (MT)/(MU)* 1,39,658 95,051 1,145 1,337 33,645 38,873
2 Sales (MT)/(MU)* 1,34,622 1,02,189 995 1,187 36,594 38,367
3 Revenue (` in lakhs) 63,067 67,609 49,427 64,569 16,750 14,632
4 PBIDT (` in lakhs) 1,203 405 16,585 20,441 3,431 311
* Ferro Alloys include 62,267 MT (previous year: 32,112 MT) on account of conversion for Tata Steel Ltd. Power in gross generation
OUTlOOK
Power
The Indian power sector has an investment potential of ̀ 15 trillion (US$ 225 billion) in the next 4–5 years, thereby providing immense opportunities in power generation, distribution, transmission and equipment. The government’s immediate goal is to generate 2 trillion units (kilowatt hours) of energy by 2019. This means doubling the current production capacity to provide 24x7 electricity for residential, industrial, commercial and agricultural use.
The Indian government’s debt restructuring of the financially weak distribution utilities, under the Ujwal Discom Assurance Yojana (UDAY) is likely to improve the companies’ financial capacity to make timely payments to power generators. An improvement in domestic coal availability has substantially mitigated coal supply risk and the risk of under-recovery in fuel costs due to reliance on costlier coal imports for thermal independent power producers. The improving financial profile of distribution utilities, which are key off-takers, will benefit power producers through a reduction in the receivable cycle, and, a modest improvement in the plant load factor over the long term.
Weaknesses in the sector do exist in terms of large underutilized capacities, muted demand, bunched capacity addition, soft merchant power prices, lack of power purchase agreements and weak discoms

62 45th Annual Report 2016-17
Ferro Alloy
The demand for Ferro Alloys is linked to the demand for Steel. India is expected to become the world’s second largest producer of crude steel in the next 10 years, moving up from the third position, as its capacity is projected to increase to about 300 MT by 2025. Huge scope for growth is offered by India’s comparatively low per capita steel consumption and the expected rise in consumption due to increased growth in the infrastructure, automobile and railway sectors. Further, restrictions on steel imports from China will open up new opportunities for Indian companies which, inturn, would improve demand for Ferro Alloys.
The manganese alloy industry faces an adverse competition in exports from the product of Malaysian origin owing to low costs of principal inputs in that country.
Your Company is allowed to export Silico manganese to USA without dumping margin and is placed advantageously vis a vis other Indian producers and therefore affords it to widen its market reach.
Nava Bharat Ventures renewed its agreement for conversion of Chrome Ore to Ferro Chrome with Tata Steel Limited for a period of 4 years commencing from April 2016, to produce up to 70,000 MT per annum of High Carbon Ferro Chrome at its Ferro Alloy Plant in Odisha. This has led to reasonable stability for this part of the business.
Sugar
The Indian Sugar Mills Association (ISMA) had lowered its estimates for sugar production during the 2016-17 season (October-September) to 21.3 mt in January 2017 from 23.4 mt in September 2016 due to drought in key cane growing States such as Maharashtra and Karnataka. Sugar prices in the domestic market are expected to remain firm in the near term, given the deficit situation in the country and international markets.
Global sugar deficit is likely to contract in the Sugar Season 2018 with higher production levels, particularly with India registering production of 25 million metric tons, amid improving acreage levels in Maharashtra and Karnataka. Production recovery is likely to constrain any further increase in prices.
The long-term prices and profitability of Indian sugar companies will remain highly cyclical and dependent on domestic and international supply-demand trends. The price trends in the international markets will be one of the key determinants of future profitability.
RISKS
Power
Indian power companies continue to face risks with regard to the financial conditions faced by the State Electricity
Boards –which still form the primary customer base of the generated power. The introduction of ‘UDAY’ initiative by the Govt could provide some relief going ahead, however, short term risks may persist. Given the continued losses on every unit of power sold, the energy requirement projected by discoms remains constrained, leading to fewer PPAs being announced. Approximately 45,000 MW of coal and gas based capacities remain at risk due to lack of PPAs, inadequate fuel supply, and aggressive bidding both for projects and coal blocks. Due to constrained energy requirement of discoms, capacities without PPAs continue to increase, which exposes them to offtake-related risks. While there has been a significant improvement in coal availability, the existing output is still insufficient to operate the installed capacities at the normative PLF of 85%. Amendments to the National Tariff Policy (NTP) need to see implementation expeditiously to have a meaningful impact on the sector.
Ferro Alloy
Ferro Alloys are purely dependent on the demand for Steel in the country. Although, the picture for India in terms of steel demand looks bright, all major steel companies are under stress due to debt burden on the balance sheet. Further, cheaper steel imports from countries like China can cause havoc to the domestic steel companies which can impact the demand for Ferro Alloys. Highly volatile prices of Chrome ore and manganese ore also pose a risk to the realizations of the domestic ferro alloy producers.
Sugar
With higher cane prices announced by States such as Uttar Pradesh, Punjab and Haryana, low sugar recovery being achieved in Tamil Nadu, Andhra Pradesh and other states, and, lower capacity utilization in drought-affected areas of Maharashtra, Karnataka and Telangana, the all-India average cost of production of sugar during the current 2016-17 Sugar Season, will be higher at ` 35 to ` 36 per kilo, ` 2 more than the previous year’s cost of production. Lower-than-average rainfall will adversely affect Sugarcane production in major parts of Maharashtra and Karnataka.
Internal control systems and their adequacy
By design, the internal control systems of your Company have information on the dynamic face of the business. There is a pre-defined set of rules overviewed by the Board and the top management. There are sufficient risk-mitigation tools in place, which facilitate continuity in operations, safeguard of assets and other resources and compliance with the legal & regulatory procedures so as to adhere to the internal policies that have been articulated. The Company’s internal control system has been developed in order to:
• Followup-to-datepolicies,procedures,managementguidelines, listing requirements and various circulars from regulatory and statutory authorities;

CO
MPA
NY
OV
ERV
IEW STA
TUTO
RY R
EPOR
TS FINA
NC
IAL STA
TEMEN
TS NO
TICE
Management Discussion and Analysis
Nava Bharat Ventures Limited 63
• ProtecttheassetsofyourCompanyfromfraud,lossormisuse;
• Actuponthecorporatestrategy;
• Adoptcompleteaccuracyinmeasurementandfollowbestpracticesforbothinternalandexternalreporting;
• RespondquicklytorisksemergingfromtheGrouptowhichyourCompanybelongs;and
• Ensuresuitableactionandrapidexecutionofcorrectionalmeasures,dependingonthesituation.
While internal control systems and procedures are an important part of the overall corporate governance for the company, the stability of operations along with accuracy of financial information and orderly compliance have equal importance.
In line with the stated internal policies and procedures, the Audit committee of your Company has taken on board the internal audit reports submitted regularly during the year 2016-17. The observations have received due cognizance and implementation of remedial measures has been overseen continually.
Financial Performance with respect to Operational Performance
FY 2017 ` in lakhs
FY 2016 ` in lakhs
% change
Net sales/ income from operations 97,934.00 102,633.81 (4.58)
Other income 6,458.94 6,240.67 3.50
Total income (1+2) 1,04,392.94 1,08,874.48 (4.12)
Total expenditure 91,878.43 96,654.89 (4.94)
Operating profit 16,789.32 14,490.67 15.86
Operating margin % 17.14 14.12 -
Finance charges 5,008.88 3,172.36 57.89
Gross profit after finance charges but before depreciation and tax 16,222.12 15,612.06 3.91
% of Gross profit after finance charges but before depreciation and tax to total income 15.54 14.34 -
Depreciation 3,707.61 3,392.47 9.29
Profit/Loss after exceptional items and before tax 12,514.51 12,219.59 2.41
Provision for
-Current tax 2,778.22 2,700.00 2.90
-Deferred tax 1,438.78 (206.19) (797.79)
-MAT credit entitlement 0.00 (2030.00) (100.00)
Total 4,217.00 463.81 809.21
Profit/Loss after tax 8,297.51 11,755.78 (29.41)
Return on capital employed % 5.97 5.09 -
The details of performance have been discussed in the foregoing paragraphs read with Directors’ report.
The fully-diluted book value of every equity share belonging to your Company was ` 151.50 as on March 31, 2017. During FY 2016-17, the price of the equity shares of your Company ranged from ` 153 per share to ` 269 per share on National Stock Exchange of India Limited and ` 154 per share to ` 269 per share on the BSE Limited before bonus issue and ranged from ` 103 per share to ` 152 per share on National Stock Exchange of India Limited and ` 103 per share to ` 152 per share on the BSE Limited after bonus issue.

64 45th Annual Report 2016-17
HUMAN RESOURCES
Nava Bharat believes that Human Resources are critical factors for success of the organization. The Company harnesses the potential of its Human Resources through a four pronged strategy i.e. performance management, talent engagement, capability development and maintaining cordial industrial relations.
It also believes that for continuous organizational success, it is pertinent to review HR processes and systems on an ongoing basis.
Performance Management
A structured process is in place for objectively evaluating the performance of employees against pre-defined performance targets. In order to drive high performance culture, the organization embarked on metrics driven performance management system in the year 2014. This has been further fortified by devising variable pay programmes linked to individual performance and achievement of defined indexes at Unit level.
Talent Engagement
The Company believes in developing a committed, engaged and efficient employee base. Towards fulfilling this objective, continuous improvements are brought about in infrastructural as well as work environment. To create an engaging culture, annual celebrations on the occasions of Republic Day, Safety Week and World Environment Day were conducted & prizes awarded to the winners of various programmes organized during these celebrations. To improve work-life balance, facilities were developed within the residential colony.
Capability Development
With a view to up-skill/ re-skill employees, multiple programmes were conducted spanning technical as well as behavioral competencies. The competencies were built through on-the-job, internal and external training sessions by engaging expert faculty.
Industrial Relations
The Company maintained cordial industrial relations throughout the year without losing a single manday on account of any industrial strife/ disturbance.
The number of permanent employees on the rolls of the Company stood at 900 as on March 31, 2017.
Cautionary Forward-looking Statements
Some of the statements included in this document could be forward looking in nature. These statements may include forecasts for financial growth, future plans & strategies, intentions and viewpoints which may concern the regular course of business from time to time. These statements are made based on the information available and the Management takes no obligation to periodically update these statements given the change in market dynamics. The actual events may unfold differently than these forward-looking statements mention, given the risks and uncertainties associated with the business. Some of these risks may include uncertain market conditions that may lead to reduced spending on the products and services that your Company deals in, the ability to build, create and acquire new businesses and also grow the existing businesses, availability of skilled manpower and retention of qualified professionals, exchange-rate fluctuations and other common risks associated with industry as a whole.

CO
MPA
NY
OV
ERV
IEW STA
TUTO
RY R
EPOR
TS FINA
NC
IAL STA
TEMEN
TS NO
TICE
Report on Corporate Governance
Nava Bharat Ventures Limited 65
Report on corporate governance[Pursuant to Schedule V C of the SEBI (Listing Obligations and Disclosure Requirements) Regulations, 2015]
(1) Company’s philosophy on Corporate governance:
The core philosophy of the Company on the code of governance is conducting business in a fair and transparent manner and enhancing stakeholders’ value.
The Company will continue to focus on its resources, strengths and strategies for creation and safeguarding of shareholders’ wealth and interests.
The Company believes in maintaining high standards of corporate behavior towards the communities that it is in touch with and the environment on which it has an impact, for orderly and responsible growth and creating long term value for its shareholders.
The Company is committed to fair and ethical business practices with transparency, accountability for performance, compliance with applicable laws and timely disclosure of reliable information.
The Company implemented the norms of governance as provided in Chapter IV and Schedule II of the Securities and Exchange Board of India (Listing Obligations and Disclosure Requirements) Regulations, 2015.
(2) Board of Directors:
(a) Composition and category of directors (e.g. promoter, executive, non-executive, independent non-executive, nominee director - institution represented and whether as lender or as equity investor):
The Board was constituted in accordance with Companies Act, 2013 and SEBI (LODR) Regulations, 2015. The Board of Directors of the Company has a combination of Executive, Non-executive and Independent directors. The Board comprises nine directors, of which five are non-executive and independent (including a Woman director) and more than half of the total strength of the Board comprises Independent directors (5 out of 9).
The category of each of the directors of the Board is detailed hereunder:-
ExecutiveNon-executive and independent
Mr. D. Ashok Chairman (Promoter)
Mr. K. Balarama Reddi Independent Director
Mr. P.Trivikrama Prasad Managing Director (Promoter)
Dr.E.R.C.Shekar Independent Director
Mr. G. R. K. Prasad Executive Director
Dr. M.V.G. Rao Independent Director
Mr. C. V. Durga Prasad Director (Business Development)
Dr. D. Nageswara Rao Independent Director
Dr. C.V.Madhavi Independent / Woman Director
(b) Attendance of each director at the meeting of the Board of directors and the last Annual General meeting:
Name of the Director
Number of Board Meetings
Attendanceat Last
AGM held on 24.08.2016Held Attended
Mr. D. AshokChairman
7 7 Yes
Mr. P. Trivikrama Prasad Managing Director
7 7 Yes
Mr. K. Balarama ReddiIndependent Director
7 7 Yes
Dr. E.R.C. Shekar Independent Director
7 6 Yes
Dr. M.V.G. Rao Independent Director
7 6 Yes
Dr. D. Nageswara RaoIndependent Director
7 7 Yes
Dr. C.V.Madhavi Independent Director
7 6 Yes
Mr. C. V. Durga Prasad Director (Business Development)
7 6 Yes
Mr. G. R. K. Prasad Executive Director
7 7 Yes

66 45th Annual Report 2016-17
(c) Number of other Board of directors or committees in which a director is a member or chairperson:
None of the directors on the Board is a member of more than ten committees or chairman of more than five committees across all companies in which directorship is held. Necessary disclosures regarding committee positions in other public companies as on March 31, 2017 have been made by the directors.
None of the directors of the company is serving on the Boards of more than seven listed companies and no whole-time director is serving as Independent director in more than three listed companies.
Name of the Director, Designation and Category
Director Identification Number
No. of Directorships in other Companies
Committee Chairmanships and Memberships in other Companies
Pvt. Public Chairmanship Membership
Mr. D. AshokChairmanExecutive (Promoter)
00006903 5 4 0 0
Mr. P. Trivikrama PrasadManaging DirectorExecutive
00006887 6 2 0 0
Mr. K. Balarama ReddiIndependent DirectorNon-Executive
00012884 4 6 2 6
Dr. E.R.C. ShekarIndependent DirectorNon-Executive
00013670 1 2 2 -
Dr. M.V.G. RaoIndependent DirectorNon-Executive
00012704 3 2 3 -
Dr. D. Nageswara RaoIndependent DirectorNon-Executive
02009886 5 1 - -
Dr. C.V.MadhaviIndependent DirectorNon-Executive
06472632 - - - -
Mr. C. V. Durga PrasadDirector (Business Development)Executive
00006670 1 - - -
Mr. G. R. K. PrasadExecutive DirectorExecutive
00006852 2 5 - 1
(d) Number of meetings of the Board of directors held and dates on which held:
In compliance with the provisions of Regulation 17 of SEBI (LODR) Regulations, 2015, the intervening period between two Board meetings was within the maximum gap of one hundred and twenty days.
During the financial year, seven Board meetings were held as detailed below:
May 30, 2016 July 22, 2016 August 24, 2016 September 7, 2016
November 17, 2016 January 30, 2017 March 10, 2017
(e) Disclosure of relationships between directors inter-se:
No Inter-se relationship exists among directors within the meaning of Section 2 (77) of Companies Act, 2013 read with Rule 4 of Companies (Specification of definitions details) Rules, 2014. However, Mr. P. Trivikrama Prasad, Managing Director, is related to Chairman (as Chairman’s sister’s husband) and Mr. D. Ashok, Chairman is related to Managing Director, as such.

CO
MPA
NY
OV
ERV
IEW STA
TUTO
RY R
EPOR
TS FINA
NC
IAL STA
TEMEN
TS NO
TICE
Report on Corporate Governance
Nava Bharat Ventures Limited 67
(f) Number of shares and convertible instruments held by non-executive directors:
No non-executive director holds any equity shares in their names in the Company.
(g) Web link where details of familiarisation programmes imparted to Independent directors:
The details of the programmes conducted by the Company were disclosed on the Company’s website under the web link:
http:/ /www.nbventures.com/corporate_policies.htm
(3) Audit committee:
The Audit committee of the Board of directors was constituted in conformity with the requirements of Section 177 of the Companies Act, 2013 and Regulation18 of SEBI (LODR) Regulations, 2015.
(a) Brief description of terms of reference:
The role of the Audit committee is as prescribed under the Act and SEBI (LODR) Regulations, 2015 and includes the following:
i. Overseeing the Company’s financial reporting process and the disclosure of its financial information to ensure that the financial statements are correct, sufficient and credible;
ii. Recommendation of appointment etc., of the statutory auditors and their fee for audit and other services;
iii. Examination and review of annual financial statements/audit report with particular reference to directors’ responsibility statement, changes in accounting policies, major accounting entries involving estimates, disclosure of related party transactions, qualifications in the draft audit report, etc.;
iv. Discussions with internal auditors on significant findings and with Statutory Auditors of the nature and scope of audit and on areas of concern;
v. Review of quarterly financial statements, uses and application of funds raised, performance of statutory and internal auditors, adequacy of internal control system and internal audit function;
vi. Review of management discussion and analysis report on financial condition and results of operations, significant related party transactions, internal control
weaknesses reported by the statutory auditors and internal auditors and the appointment and remuneration of internal auditors;
vii. Review and monitor the auditor’s independence and performance, and effectiveness of audit process;
viii. Approval or any subsequent modification of transactions of the company with related parties;
ix. Scrutiny of inter-corporate loans and investments;
x. Evaluation of internal financial controls and risk management systems; and
xi. Review of the functioning of the Whistle Blower mechanism.
(b) Composition, Name of members and chairperson:
The composition of the Audit committee and the details of meetings attended by its members are given below:
Name of the Director CategoryChairman/Member
Mr. K. Balarama Reddi Independent Director
Chairman
Dr. M. V. G. Rao Independent Director
Member
Dr. D. Nageswara Rao Independent Director
Member
(c) Meetings and attendance during the year 2016-17:
During the year, six meetings of the Audit committee were held as detailed below. All members, except Dr.M.V.G.Rao, attended all the six meetings during the FY 2016-17. Dr.M.V.G.Rao had attended four meetings out of six.
May 28, 2016 July 22, 2016 August 23, 2016
November 16, 2016
January 30, 2017
March 9, 2017
(4) Nomination and Remuneration committee:
The Nomination and Remuneration committee of the Board of directors was constituted in conformity with the requirements of Section 178 of the Companies Act, 2013 and Regulation 19 of SEBI (LODR) Regulations, 2015 and its role has been the same as stipulated in the Act and the Regulations mentioned above.

68 45th Annual Report 2016-17
(a) Brief description of terms of reference:
The functioning and terms of reference of the Nomination and Remuneration committee are as prescribed under the erstwhile listing agreement and SEBI (LODR) Regulations, 2015. It determines the Company’s policy on all elements of the remuneration packages of the directors including the executive directors. The role of the Committee includes the following:
1. Formulation of the criteria for determining qualifications, positive attributes and independence of a director and recommending to the Board of directors a policy relating to, the remuneration of the directors, Key managerial personnel and other employees;
2. Formulation of criteria for evaluation of performance of Independent directors and the Board of directors;
3. Devising a policy on diversity of Board of directors;
4. Identifying persons who are qualified to become directors and who may be appointed in senior management in accordance with the criteria laid down, and recommending to the Board of directors for their appointment and removal.
5. Evaluation of every director’s performance.
(b) Composition, name of members and chairperson:
The Nomination and Remuneration committee comprised three Independent directors.
Name of the Director CategoryChairman/Member
Mr. K. Balarama Reddi Independent Director
Chairman
Dr. M. V. G. Rao Independent Director
Member
Dr. D. Nageswara Rao Independent Director
Member
(c) Meetings and attendance during the year 2016-17:
During the year, four meetings of the Nomination and Remuneration committee were held as detailed below. All members, except Dr.M.V.G.Rao, attended all the four
meetings during the FY 2016-17. Dr.M.V.G.Rao had attended three meetings out of four.
May 28, 2016 July 22, 2016
November 16, 2016 March 9, 2017
(d) Performance evaluation criteria for Independent directors:
Independent directors have three key roles – governance, control and guidance. Some of the performance indicators, based on which the Independent directors are evaluated, are:
• Contribution to and monitoringCorporate Governance practices.
• Ability to contribute to address topmanagement issues.
• Activeparticipationinlongtermstrategicplanning.
• Commitment to the fulfilment ofobligations and responsibilities.
The performance evaluation of independent or non-executive members is done by the Board annually based on criteria of attendance and contributions at Board/Committee meetings as also the role played by them other than at meetings.
Criteria formulated by Nomination and Remuneration committee for evaluation of Board committees and individual directors:
In line with Corporate governance guidelines, evaluation of all Board members is done on an annual basis. This evaluation is done by the entire Board led by the Chairman of the Board with specific focus on the performance and effective functioning of the Board, committees of the Board and individual directors and reported to the Board. The evaluation process also considers the time spent by each of the Board members, core competencies, personal characteristics, accomplishment of specific responsibilities and expertise.
The entire Board of directors (excluding the director being evaluated) held the performance evaluation of Independent directors and on the basis of performance evaluation, the Board decided to continue the term of appointment of Independent directors.
Performance evaluation was done by the respective bodies on March 10, 2017.

CO
MPA
NY
OV
ERV
IEW STA
TUTO
RY R
EPOR
TS FINA
NC
IAL STA
TEMEN
TS NO
TICE
Report on Corporate Governance
Nava Bharat Ventures Limited 69
(5) Remuneration of Directors:
The Company’s remuneration policy for directors, key managerial personnel and other employees is enclosed to the Directors’ report vide Annexure - 7. Further, the Company has adopted specific criteria for performance evaluation of Independent directors, Board, Committees and other individual directors.
The Company’s remuneration policy is directed towards rewarding performance based on review of achievements periodically. The remuneration policy is in consonance with the existing industry practice.
(a) All pecuniary relationship or transactions of the non-executive directors :
The Board, at its meeting held on May 8, 2015 and Annual General Meeting on August 27, 2015 approved payment of remuneration/ commission to the Non-executive directors for each year for a period of 5 years commencing from April 1, 2016, as the Board may from time to time determine (to be divided equally amongst the non-executive directors) not exceeding 1% of the net profits of the Company in any financial year subject to an overall ceiling of ` 25 lakhs per annum for every financial year to be paid and distributed equally among all
the non-executive directors of the Company for each year; in addition to the sitting fees of ` 15,000/- per meeting in respect of all Committees or Board meetings effective from August 27, 2015.
(b) Criteria of making payments to non - executive directors:
Keeping in view the size, scale and complexity of the Company’s operations and the level of involvement of the non-executive directors in the supervision and control of the Company and their guidance for the growth of the Company as Members of the Board and also as Chairman or Members of the relevant Committees of the Board, the Board and Shareholders decided that such remuneration/commission should be commensurate with their roles which have undergone significant qualitative changes.
(c) Disclosures with respect to remuneration in addition to disclosures required under the Companies Act, 2013:
(i) all elements of remuneration package of individual directors summarized under major groups, such as salary, benefits, bonuses, stock options, pension, etc for the FY 2016-17 :
Name of the Director Sitting Fee(Board &
Committees) (` ) Salaries (` )
Perquisitesand
Allowances (` )
Commission and incentiveas approvedby General
Body (` ) Total (` )
Mr. D. Ashok, Chairman 0 84,00,000 94,03,792 2,86,16,404 4,64,20,196
Mr. P. Trivikrama Prasad, Managing Director
0 84,00,000 93,71,297 2,86,16,404 4,63,87,701
Dr. E. R. C. Shekar 90,000 0 0 5,00,000 5,90,000
Dr. M. V. G. Rao 1,95,000 0 0 5,00,000 6,95,000
Mr. K. Balarama Reddi 2,55,000 0 0 5,00,000 7,55,000
Dr. D. Nageswara Rao 2,85,000 0 0 5,00,000 7,85,000
Dr. C. V. Madhavi 1,20,000 0 0 5,00,000 6,20,000
Mr. C. V. Durga Prasad,Director (Business Development)
0 1,02,00,000 1,15,09,931 0 2,17,09,931
Mr. G. R. K. Prasad, Executive Director
0 1,02,00,000 1,13,84,830 60,00,000 2,75,84,830
(ii) Details of fixed component and performance linked incentives, along with the performance criteria:
Except Mr. G.R.K Prasad, Executive Director, who was allowed a fixed incentive per annum of ` 60.00 lakhs as shown above, no other director was allowed any fixed or performance linked incentives.

70 45th Annual Report 2016-17
(iii) Service contracts, notice period, severance fees:
There are no specific contracts nor any severance fees. Terms of appointment are as decided by the Board and General Body.
(iv) Stock option details, if any including issue at a discount as well as the period over which accrued and over which exercisable:
The Company has no options outstanding as at the beginning of the year and has not granted any stock options during the financial year 2016-17.
(6) Stakeholders relationship committee:
The Company has Stakeholders relationship committee at the Board level, which consists of three directors namely Mr.K.Balarama Reddi, Dr.M.V.G.Rao and Mr.P.Trivikrama Prasad as at the end of the financial year.
(a) Name of Non-executive Director heading the Committee
Mr. K. Balarama Reddi, Non-executive and Independent Director chairs the Stakeholders relationship committee. It deals with the complaints of the Shareholders on a regular basis.
(b) Name and Designation of Compliance Officer
Mr. M. SubrahmanyamCompany Secretary& Vice President(upto May 31, 2016)
Mr. VSN RajuCompany Secretary& Vice President(with effect from June 1, 2016)
(c) Number of Shareholders’ complaints received so far
15
(d) Number not solved to the satisfaction of Shareholders
Nil
(e) Number of pending complaints
Nil
(7) General Body meetings:
(a) Location and time where last three annual general meetings held:
Nature of Meeting
Date and Time
Venue of Meeting
44th Annual general meeting
August 24, 2016at 10.00 a.m.
Hotel Marigold, By and beside Green Park Hotel Hyderabad – 500 016
43rd Annual general meeting
August 27, 2015at 10.00 a.m.
Hotel Marigold, By and beside Green Park Hotel Hyderabad – 500 016
42nd Annual general meeting
August 8, 2014at 10.00 a.m.
Hotel Marigold, By and beside Green Park Hotel Hyderabad – 500 016
(b) Special resolutions passed in the previous three Annual general meetings:
Nature of Meeting
Number of Special
resolutions passed
44th Annual general meeting - August 24, 2016
Nil
43rd Annual general meeting - August 27, 2015
Three
42nd Annual general meeting - August 8, 2014
Five
(c) Special resolutions passed last year through postal ballot – details of voting pattern:
No postal ballot was conducted during the financial year 2016-17.
(d) Person conducted the postal ballot exercise:
Not applicable.
(e) Special resolutions proposed to be conducted through postal ballot:
No resolutions are proposed to be conducted now through postal ballot.
(f) Procedure for postal ballot:
The procedure for postal ballot will be as per Section 110 of the Companies Act, 2013 read with Rule 22 of the Companies (Management and Administration) Rules, 2014.

CO
MPA
NY
OV
ERV
IEW STA
TUTO
RY R
EPOR
TS FINA
NC
IAL STA
TEMEN
TS NO
TICE
Report on Corporate Governance
Nava Bharat Ventures Limited 71
(8) Means of communication:
(a) Quarterly results:
The quarterly, half-yearly and annual results of the Company were normally published by the Company in the newspapers.
Annual reports with audited financial statements are sent to the shareholders through electronic/physical mode.
(b) Newspapers wherein results normally published:
The results are normally published by the Company in the newspapers (Financial Express) in English version, circulating in the whole of India and in regional newspaper (Mana Telangana) in the vernacular language in all editions.
(c) Any website, where displayed:
The results are also displayed on the Company’s website: www.nbventures.com
(d) Whether it also displays official news releases:
The news letters and press releases from time to time were also displayed on the Company’s website.
(e) Presentations made to institutional investors or to the analysts:
The presentations to institutional investors or to the analysts are covered in the Company’s website.
News items are sent to the Stock Exchanges i.e. National Stock Exchange of India Limited and BSE Limited, where shares of the Company were listed and the Exchanges display the same on their websites.
(9) General shareholder information:
(a) Annual General Meeting date, time and venue:
Date August 9, 2017
Time 10.00 A.M
Venue Hotel Marigold By and beside Green Park Hotel Hyderabad – 500 016 Telangana
For the Financial year April, 2016 to March, 2017:
Board meeting for consideration of Audited Accounts and recommendation of Dividend for 2016-17
May 27, 2017
Posting of Annual Report
July 17, 2017
Book Closure dates August 4, 2017 to August 9, 2017
Last date for receipt of Proxy forms
August 7, 2017
Date of the 45th Annual General Meeting
August 9, 2017
Dividend on Equity Shares
` 1/- per share (50%) of face value of ` 2/-each
Dividend pay-out date Within 30 days from the date of declaration
As required under Regulation 36 (3) of SEBI (LODR) Regulations, 2015, the particulars of Directors seeking re-appointment at the forthcoming Annual General Meeting (AGM) were given in the Annexure to the Notice and Explanatory Statement of the Annual General Meeting to be held on August 9, 2017.
(b) Financial year:
The financial year of the Company starts from 1st April every year and ends on 31st March of subsequent year.
Financial Calendar:
Financial year 2016-17 (April 1, 2016 to March 31, 2017)
1 First Quarter Results August 24, 2016
2 Second Quarter and Half Year Results
November 17, 2016
3 Third Quarter Results January 30, 2017
4 Annual Results (Audited)
May 27, 2017
(c) Dividend payment date:
The dividend would be paid within 30 days from the date of declaration for the financial year 2016-17, if approved by the members.
(d) The name and address of each stock exchange(s) at which the listed entity's securities are listed and a confirmation about payment of annual listing fee to each of such stock exchange(s):

72 45th Annual Report 2016-17
National Stock Exchange of India Ltd Exchange Plaza, 5th Floor Plot No.C/1, ‘G’ Block Bandra-Kurla Complex Bandra(E), Mumbai-400 051
BSE Limited P.J.Towers Dalal Street, Fort, Mumbai - 400 001
The Listing fee was remitted to the above stock exchanges for FY 2017-18.
(e) Stock code:
Stock Codes/Symbol:
Bombay Stock Exchange Scrip Code/Trading Symbol ‘513023’ / ‘NBVENTURES’
National Stock Exchange Trading Symbol ‘NBVENTURES’
Corporate Identity Number (CIN):
The Corporate Identity Number (CIN), allotted by the Ministry of Corporate Affairs, the Government of India is L27101TG1972PLC001549 and the Company’s Registration Number is 1549 of 1972-73.
International Securities Identification Number (ISIN):
ISIN is a unique identification number allotted to dematerialised scrip. The ISIN has to be quoted in each transaction relating to dematerialised shares of the Company. The ISIN for the equity shares of the Company is INE725A01022.
(f) Market price data- high, low during each month in last financial year:
Market price data: High/Low (daily closing prices) on National Stock Exchange of India Limited during each month in the Financial Year 2016-17:
MonthEquity Shares of ` 2/-each
Closing NIFTY 50High
(`)Low
(`)Closing
(`)Volume
(No.)
2016
April 164.85 159.10 159.10 406102 7849.80
May 180.85 155.75 180.85 1779263 8160.10
June 239.60 176.95 239.60 11570763 8287.75
July 262.20 232.75 234.55 8688500 8638.50
August 260.00 227.25 238.70 7781142 8786.20
September 132.30 107.85 132.30 20479299 8611.15
October 144.35 130.95 140.95 13356400 8625.70
November 148.85 107.20 125.20 13237739 8224.50
December 123.75 108.55 110.55 2854851 8185.80
2017
January 122.40 111.40 113.40 5592491 8561.30
February 115.60 111.40 112.60 3600717 8879.60
March 127.95 113.65 125.25 6299835 9173.75

CO
MPA
NY
OV
ERV
IEW STA
TUTO
RY R
EPOR
TS FINA
NC
IAL STA
TEMEN
TS NO
TICE
Report on Corporate Governance
Nava Bharat Ventures Limited 73
Market Price Data: High/Low (daily closing prices) on BSE Limited during each month in the FY 2016-17:
MonthEquity Shares of ` 2/-each Closing
S&P BSE SENSEX
Closing S&P BSE
SmallCAP
Closing S&P BSE
AllCapHigh
(`)Low
(`)Closing
(`)Volume
(No.)
2016
April 164.70 161.30 161.40 86593 25606.62 11020.59 2995.35
May 180.95 154.55 180.95 350226 26667.96 11142.42 3093.90
June 239.40 176.70 239.40 2395904 26999.72 11801.32 3174.42
July 261.85 232.80 235.45 2085026 28051.86 12309.95 3334.55
August 259.90 228.00 238.25 2016209 28452.17 12648.79 3404.51
September 132.70 107.60 132.70 4753162 27865.96 12780.80 3367.68
October 144.20 130.75 140.95 3192089 27930.21 13583.14 3427.86
November 148.50 106.70 125.15 3552984 26652.81 12329.65 3227.23
December 123.45 108.55 110.70 543936 26626.46 12046.13 3181.83
2017
January 122.00 111.55 113.45 876202 27655.96 12935.66 3362.46
February 115.75 111.70 112.50 496964 28743.32 13690.81 3511.02
March 127.25 113.40 125.60 1142368 29620.50 14433.86 3642.95
(g) Performance in comparison to broad-based indices such as BSE sensex, CRISIL index etc.:
The Company is not forming part of NIFTY 50. Overall performance of the scrip of the Company in comparison to NIFTY 50 is as follows:

74 45th Annual Report 2016-17
The Company is not forming part of S&P BSE Sensex. Overall performance of the scrip of the Company in comparison to S&P BSE Sensex is as follows:
The Company is forming part of S&P BSE SmallCap. Overall performance of the scrip of the Company in comparison to BSE SmallCap is as follows:
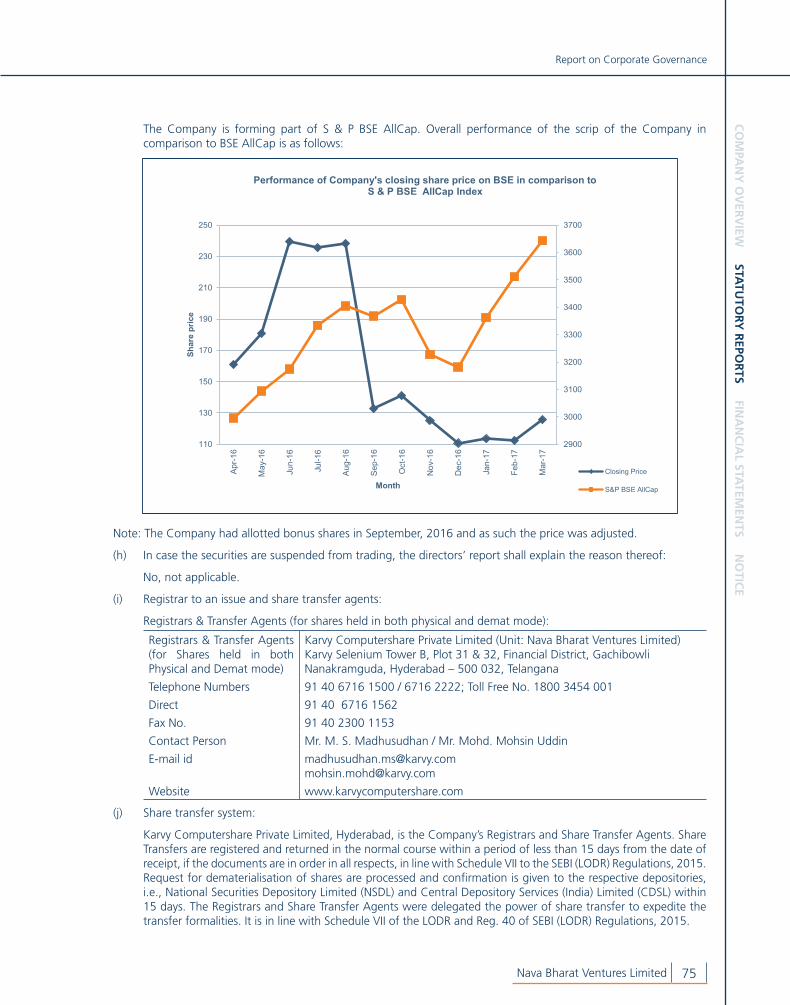
CO
MPA
NY
OV
ERV
IEW STA
TUTO
RY R
EPOR
TS FINA
NC
IAL STA
TEMEN
TS NO
TICE
Report on Corporate Governance
Nava Bharat Ventures Limited 75
The Company is forming part of S & P BSE AllCap. Overall performance of the scrip of the Company in comparison to BSE AllCap is as follows:
Note: The Company had allotted bonus shares in September, 2016 and as such the price was adjusted.
(h) In case the securities are suspended from trading, the directors’ report shall explain the reason thereof:
No, not applicable.
(i) Registrar to an issue and share transfer agents:
Registrars & Transfer Agents (for shares held in both physical and demat mode):
Registrars & Transfer Agents (for Shares held in both Physical and Demat mode)
Karvy Computershare Private Limited (Unit: Nava Bharat Ventures Limited)Karvy Selenium Tower B, Plot 31 & 32, Financial District, Gachibowli Nanakramguda, Hyderabad – 500 032, Telangana
Telephone Numbers 91 40 6716 1500 / 6716 2222; Toll Free No. 1800 3454 001
Direct 91 40 6716 1562
Fax No. 91 40 2300 1153
Contact Person Mr. M. S. Madhusudhan / Mr. Mohd. Mohsin Uddin
E-mail id [email protected]@karvy.com
Website www.karvycomputershare.com
(j) Share transfer system:
Karvy Computershare Private Limited, Hyderabad, is the Company’s Registrars and Share Transfer Agents. Share Transfers are registered and returned in the normal course within a period of less than 15 days from the date of receipt, if the documents are in order in all respects, in line with Schedule VII to the SEBI (LODR) Regulations, 2015. Request for dematerialisation of shares are processed and confirmation is given to the respective depositories, i.e., National Securities Depository Limited (NSDL) and Central Depository Services (India) Limited (CDSL) within 15 days. The Registrars and Share Transfer Agents were delegated the power of share transfer to expedite the transfer formalities. It is in line with Schedule VII of the LODR and Reg. 40 of SEBI (LODR) Regulations, 2015.

76 45th Annual Report 2016-17
(k) Distribution of shareholding:
Range of equityshares held
As on March 31, 2017Shareholders Shareholding
Number % Number %1 160 0.74 160 0.002 – 10 1647 7.63 8927 0.0011 – 50 3344 15.50 117158 0.0751 – 100 3544 16.43 326586 0.18101 – 200 3258 15.10 589281 0.33201 – 500 3421 15.86 1280133 0.72501 – 1000 2511 11.64 2043616 1.141001 – 5000 2479 11.49 5862425 3.285001 – 10000 519 2.41 3918196 2.2010001 and above 689 3.20 164429000 92.08Total: 21572 100.00 178575482 100.00
(l) Dematerialization of shares and liquidity:
Dematerialization shares as on March 31, 2017:
Number ofshares
% of totalshares
Number of shareholders
% of total shareholders
177147985 99.20 21046 97.56
Shareholders, who continue to hold shares in physical form, are requested to dematerialise their shares at the earliest and avail of the various benefits of dealing in securities in electronic/dematerialised form. The shareholders have the option to hold Company’s shares in demat form through the National Securities Depository Limited (NSDL) or Central Depository Services (India) Limited (CDSL). The system for getting the shares dematerialised is as under:
• Sharecertificate(s)alongwithDematRequisitionForm(DRF)istobesubmittedbytheshareholdertotheDepository Participant(DP) with whom he/ she has opened a Depository Account;
• DPprocessestheDRFandgeneratesauniquenumberviz.DRN;
• DPforwardstheDRFandsharecertificatestotheCompany’sRegistrars&ShareTransferAgents;
• TheCompany’sRegistrars&ShareTransferAgentsafterprocessingtheDRF,confirmstherequesttotheDepositories by cancellation of physical share certificates; and
• Uponconfirmation,theDepositorygivesthecredittoshareholderinhis/herdepositoryaccountmaintainedwith DP.
The break-up of shares in demat and physical form as on March 31, 2017 is as follows:
ParticularsNo. of Shares
of ` 2/-each% of
Shares
Demat Segment
NSDL 159175734 89.14
CDSL 17972251 10.06
Sub-total:- 177147985 99.20
Physical Segment 1427497 0.80
Total 178575482 100.00
CO
MPA
NY
OV
ERV
IEW STA
TUTO
RY R
EPOR
TS FINA
NC
IAL STA
TEMEN
TS NO
TICE
Report on Corporate Governance
Nava Bharat Ventures Limited 77
(m) Outstanding Global Depository Receipts or American Depository Receipts or warrants or any convertible instruments, conversion date and likely impact on equity:
No GDRs/ADRs/Warrants or any Convertible instruments have been issued by the Company during the year under review or outstanding as at the end of the Financial Year 2016-17.
Allotment of Bonus Shares:
During the year, the Company had allotted 8,92,87,741 fully paid-up equity shares of ` 2/-each to the shareholders of the Company in proportion of 1:1 and consequently, the number of shares increased from 8,92,87,741 to 17,85,75,482.
(n) Commodity price risk or foreign exchange risk and hedging activities:
The Company hedges the forex risk on export receivables and on import payables, keeping in view the exchange parity at the time of export or import, as the case may be, and the indicative forex movements. However, where the delivery date is yet to be finalized, the Company will weigh the options of open exposure, partial booking etc., over the export/import trade cycle period and decide.
(o) Plant locations:
The Company’s plants are located at:
Paloncha-507 154Bhadradri Kothagudem DistrictTelangana
Kharagprasad village – 759 121, Dhenkanal District, Odisha
Samalkot - 533 440East Godavari DistrictAndhra Pradesh
Dharmavaram - 534 430, Prathipadu Mandal, East Godavari DistrictAndhra Pradesh
(p) Address for correspondence:
Registered Office
Nava Bharat Ventures Ltd.6-3-1109/1’Nava Bharat Chambers’Raj Bhavan Road Hyderabad – 500 082Telangana, India
Telephone Numbers
91 40 2340 3501/2340 3540
Fax Number 91 40 2340 3013
Website www.nbventures.com
e-mail [email protected]
Grievance Redressal Division e-mail id [email protected]
(10) OTHER DISClOSURES:
(a) Disclosures on materially significant related party transactions that may have potential conflict with the interests of listed entity at large:
All material transactions entered into with related parties as defined under the Act and Regulation 23 of SEBI Listing Regulations during the financial year were in the ordinary course of business. These have been approved by the Audit committee. The Board has approved a Policy for related party transactions which has been uploaded on the Company’s Website at the following link:
http:/ /www.nbventures.com/corporate_policies.htm
There have been no materially significant related party transactions, monetary transactions or relationships between the Company and its Directors, the Management, subsidiaries or relatives, except for those disclosed in the Board’s report. Detailed information on materially significant related party transactions is enclosed as Annexure - 5 to the Board’s report and Note No.7 of the Standalone financial statement.
Related party disclosure in the format prescribed in Schedule V(A) of the SEBI (LODR) Regulations, 2015 is also provided in Directors’ Report.
(b) Details of non-compliance by the listed entity, penalties, strictures imposed on the listed entity by stock exchange(s) or the board or any statutory authority, on any matter related to capital markets, during the last three years:
No strictures or penalties have been imposed on the Company by the Stock Exchanges or by the Securities and Exchange Board of India (SEBI) or by any statutory authority on any matters related to capital markets during the last three years.
(c) Details of establishment of vigil mechanism, whistle blower policy, and affirmation that no personnel has been denied access to the audit committee:
No personnel had been denied access to the Audit committee.
The Company established a mechanism for Whistle Blower Policy and no personnel had

78 45th Annual Report 2016-17
been denied access to the Audit committee. The Policy was placed on the website of the Company under the web link http://www.nbventures.com/corporate_policies.htm
(d) Details of compliance with mandatory requirements and adoption of the non-mandatory requirements:
a. Mandatory Requirements
The Company complied with all the mandatory requirements enumerated in Regulation 17 to 27 of SEBI (LODR) Regulations, 2015 relating to all matters specified therein, i.e., (1) Board of directors; (2) Audit committee;(3) Nomination and Remuneration committee; (4)Remuneration of directors; (5) Stakeholders’ Relationship committee (6) General Body meetings (7) Means of communication; (8) General shareholder information; and (9) CEO and CFO Certification; and Compliance.
b. Web link where policy for determining ‘material’ subsidiaries is disclosed:
The company had formulated a policy for determining ‘material’ subsidiaries and the policy was disclosed on the Company’s website under the web link:
http://www.nbventures.com/corporate_policies.htm
c. Web link where policy on dealing with related party transactions:
The Board has formulated a policy for related party transactions and revised it in the light of SEBI (LODR) Regulations, 2015 which was disclosed on the Company’s website under the web link: http://www.nbventures.com/corporate_policies.htm
d. Disclosure of commodity price risks and commodity hedging activities:
The Company’s ferro alloy operations, to some extent Sugar operations and power generation based on imported coal are subjected to the world-wide commodity
risk and the fiscal policies on import or export. Currently, the Company does not have recourse to any hedging mechanism to mitigate the volatility of prices. However, it does regulate the production of manganese alloys duly considering the international market indices from time to time, both for import of feed stock and export of finished product to sustain reasonable earnings, as much as possible.
(11) Non-compliance of any requirement of corporate governance report of sub-paras (2) to (10) above, with reasons thereof:
All the above requirements are complied with.
(12) The extent to which the discretionary requirements as specified in Part E of Schedule II have been adopted:
Discretionary Requirements
The Company has adopted / complied with the discretionary requirements specified in Part E of Schedule II as detailed below:
i. The Board:
Since the Chairperson is an Executive Chairman, the maintenance of Office to the Non-executive Chairperson at the Company’s expense is not applicable.
ii. Shareholders’ rights:
All the quarterly financial results and communication to stock exchanges are placed on the Company’s Website: www.nbventures.com apart from publishing the same in the Newspapers.
iii. Modified opinion(s) in audit report:
There are no modified opinions in the Audit Reports.
iv. Separate Posts of Chairman and CEO:
The Company has separate posts of Chairman and Managing Director.
v. Reporting of internal auditor:
The Internal auditor reports to the Chairman of the Audit committee directly.

CO
MPA
NY
OV
ERV
IEW STA
TUTO
RY R
EPOR
TS FINA
NC
IAL STA
TEMEN
TS NO
TICE
Report on Corporate Governance
Nava Bharat Ventures Limited 79
(13) The disclosures of the compliance with corporate governance requirements specified in Regulation 17 to 27 and clauses (b) to (i) of sub-regulation (2) of Regulation 46 are as follows:
Regulation Particulars of RegulationsCompliance
Status Yes/No
17 Board of Directors Yes
18 Audit Committee Yes
19 Nomination and Remuneration Committee Yes
20 Stakeholders Relationship Committee Yes
21 Risk Management Committee NA
22 Vigil Mechanism Yes
23 Related Party Transactions Yes
24 Corporate Governance Requirements with respect to Subsidiary of listed entity Yes
25 Obligations with respect to Independent Directors Yes
26 Obligation with respect to Directors and Senior Management Yes
27 Other Corporate Governance Requirements Yes
46(2) (b) to (i) Website Yes
Policy for determining materiality of an event or information and for making disclosures to Stock Exchanges:
As required under Regulation 30 of SEBI(LODR) Regulations, 2015, the Board of directors of the Company approved the Policy for determining materiality of an event or information and for making disclosures to Stock Exchanges effective from 1st December, 2015 and has been hosted on the website of the Company at http://www.nbventures.com/corporate_policies.htm
Preservation of Documents:
The Company adopted the policy on preservation of documents in accordance with regulation 9 of the SEBI (LODR) Regulations, 2015, which was placed on the Website of the Company at http://www.nbventures.com/corporate_policies.htm
Corporate governance requirements with reference to Subsidiary Companies:
Independent directors viz. Mr. K. Balarama Reddi and Dr. M. V. G. Rao are the directors on the Boards of the non-listed Indian Subsidiary Companies as at the end of the financial year 2016-17, as detailed below:
Name of the Independent Director
Director on the Board of Subsidiary Companies
Mr. K. Balarama Reddi
1. Nava Bharat Projects Limited
2. Nava Bharat Energy India Limited
3. Brahmani Infratech Private Limited
Dr. M. V. G. Rao 1. Nava Bharat Projects Limited
2. Nava Bharat Energy India Limited
3. Brahmani Infratech Private Limited
As per Regulation 24 of SEBI (LODR) Regulations, 2015, the financial statements, significant transactions, investments and the minutes of the board meetings of the subsidiary companies are considered at the meetings of the Audit committee / Board of directors of the Company, as the case may be.
Meetings of Independent directors:
The Company’s Independent directors met on March 10, 2017, without the presence of Non-independent directors. The meeting was attended by all the Independent directors.

80 45th Annual Report 2016-17
The Independent directors in the meeting reviewed the performance of Non-independent directors and the Board as a whole. Further, reviewed the performance of the Chairperson of the Company and also assessed the quality, quantity and timeliness of flow of information from the Management to the Board for effective functioning of the Board and performance of its duties.
Prohibition of Insider trading:
In compliance with the provisions of SEBI (Prohibition of Insider Trading) Regulations, 2015 (as amended from time to time) and to preserve the confidentiality and prevent misuse of unpublished price sensitive information, the Company has adopted a Code of Conduct for Prohibition of Insider Trading. This Policy also provides for periodical disclosures from the designated employees as well as pre-clearance of transactions by such persons.
The code is applicable to General Managers and above levels, who are likely or may reasonably be expected to have access to the unpublished price sensitive information relating to the Company and the same is being implemented as a self-regulatory mechanism.
Website:
The Company’s website www.nbventures.com contains a separate dedicated section: ‘Investors’, where shareholders’ information is available. The Annual report of the Company is also available on the website in a user-friendly and downloadable form.
NSE Electronic Application Processing System (NEAPS):
The NEAPS is a web based application designed by NSE for Corporates. The Shareholding Pattern, Corporate Governance Report and various other Reports are filed electronically on NEAPS. The Company is also filing various Reports through NEAPS.
BSE Corporate Compliance & Listing Centre (the ‘Listing Centre’):
BSE Listing Centre is a web-based application designed for Corporates. All periodical compliance filings like shareholding pattern, corporate governance report, financial results, among others are also filed electronically on the Listing Centre.
SEBI Complaints Redress System (SCORES):
The Investor complaints are processed in a centralised web-based complaints redress system. The salient features of this system are: Centralised database of all complaints, online upload of Action Taken Reports (ATRs) by concerned companies and online viewing by investors of actions taken on the complaint and its current status.
Declaration signed by the chief executive officer stating that the members of board of directors and senior management personnel have affirmed compliance with the code of conduct of board of directors and senior management:
Code of Conduct:
The Company has in place a comprehensive Code of Conduct (the Code) applicable to all the senior management personnel and directors including independent directors to such extent as may be applicable to them depending on their roles and responsibilities. The Code covers duties of independent directors also gives guidance and support needed for ethical conduct of business and compliance of law. A policy on obligation of directors and senior management personnel and for disclosure of committee positions and commercial transitions pursuant to Reg.26(2) and (5) is in place.
A copy of the Code has been put on the Company’s website (www.nbventures.com). The Code has been circulated to Directors and Management Personnel, and its compliance is affirmed by them annually.
All the Board members and the senior management personnel have confirmed compliance with the Code.
Declaration on compliance with Code of Conduct is annexed.
Compliance Certificate
A compliance certificate under Regulation 17(8) of SEBI (LODR) Regulations, 2015 signed by the Company’s Managing Director and Chief Financial Officer is annexed to this Report.
Compliance certificate from either the auditors or practicing company secretaries regarding compliance of conditions of corporate governance:
Compliance certificate from the Auditors of the Company regarding compliance of conditions of corporate governance pursuant to para E of Schedule V to SEBI (LODR) Regulations, 2015 is annexed to the Corporate Governance Report.
Unclaimed Equity Dividends and Shares:
Section 124 (5) of the Companies Act, 2013 and rules made thereunder mandates that dividends that are not encashed or claimed, within seven years from the date of its transfer to the unpaid dividend account will be transferred to the Investor Education and Protection Fund (IEPF).

CO
MPA
NY
OV
ERV
IEW STA
TUTO
RY R
EPOR
TS FINA
NC
IAL STA
TEMEN
TS NO
TICE
Report on Corporate Governance
Nava Bharat Ventures Limited 81
The details of unclaimed dividend as on March 31, 2017 are as follows:
Sl. No.
Financial Year
Date of Declaration of Equity Dividends
Dividend per share
(`)
% of Equity Dividend
Date of transfer
to Unpaid Dividend A/c
Amount outstanding as on 31.03.2017
(`)
Due date for transfer to
IEPF
1 2015-2016 24.08.2016 3.00 150 23.09.2016 2,215,041/- 23.09.2023
2 2014-2015 27.08.2015 5.00 250 28.09.2015 3,565,240/- 28.09.2022
3 2013-2014 08.08.2014 5.00 250 08.09.2014 3,486,700/- 08.09.2021
4 2012-2013 16.08.2013 5.00 250 16.09.2013 3,455,990/- 16.09.2020
5 2011-2012 08.08.2012 4.00 200 07.09.2012 1,725,464/- 07.09.2019
6 2010-2011 28.07.2011 6.00 300 27.08.2011 2,263,542/- 27.08.2018
7 2009-2010 16.08.2010 9.00 450 16.09.2010 3,164,103/- 16.09.2017
The Company is sending periodic communication to the concerned shareholders, advising them to lodge their claims with respect to unclaimed dividend. Shareholders are informed that once unclaimed dividend is transferred to IEPF, no claim shall lie in respect thereof with the Company.
Section 124 (6) read with the ‘Investor Education and Protection Fund Authority (Accounting, Audit, Transfer and Refund) Rules, 2016’ (‘Rules’), requires that all shares, in respect of which dividend has not been paid or claimed for seven consecutive years or more (relevant shares), shall be transferred by the Company in the name of IEPF along with statement containing such details as may be prescribed by the authority from time to time.
The Company also sent individual communication to the concerned members whose shares are liable to be transferred to IEPF Account as required under the said rules and the Company published notices in the newspapers inviting the members’ attention to the aforesaid rules.
Guidance for Investor to file claim
The shareholders are requested to note that, after the above-referred transfer(s) is made, refunds from the IEPF can be claimed only by complying with the provisions of Rule 7 of the said Rules.
Disclosures with respect to unclaimed suspense account:
The Unclaimed Equity Shares are held in Nava Bharat Ventures Limited –Unclaimed Suspense Account maintained with Karvy Stock Broking Limited, vide Client I.D.No.18391954.
In accordance with the requirement of Clause F of Schedule V of SEBI (Listing Obligations and Disclosure Requirements) Regulations, 2015, the Company reports the following details in respect of equity shares lying in the suspense account in demat:
Sl. No.
ParticularsNo. of
Shareholders
No. of Equity Shares of ` 2/-
each
(a) aggregate number of shareholders and the outstanding shares in the suspense account lying at the beginning of the year
1260 602340
(b) number of shareholders who approached the Company for transfer of shares from suspense account before allotment of bonus shares (Record date September 3, 2016)
3 4455
(c) number of shareholders to whom shares were transferred from suspense account before allotment of bonus shares (Record date September 3, 2016)
3 4455
i. aggregate number of shareholders and the outstanding shares in the suspense account lying as on record date for the purpose of Bonus issue
1257 597885

82 45th Annual Report 2016-17
Sl. No.
ParticularsNo. of
Shareholders
No. of Equity Shares of ` 2/-
each
ii. allotment of bonus shares in the ratio of 1:1 on September 7, 2016 1257 597885
iii. aggregate number of shareholders and the outstanding shares in the suspense account lying after the allotment of Bonus shares in the ratio of 1:1 on September 7, 2016
1257 1195770
iv. number of shareholders who approached the Company for transfer of shares from suspense account after the allotment of bonus shares (Record date September 3, 2016)
3 16980
v. number of shareholders to whom shares were transferred from suspense account after allotment of bonus shares (Record date September 3, 2016)
3 16980
(d) aggregate number of shareholders and the outstanding shares in the suspense account lying at the end of the year
1254 1178790
(e) The total no.of shares for which voting rights shall remain frozen till the rightful owner of such shares claims the shares
1254 1178790
The dividend on the shares in the Unclaimed Suspense Account will be remitted to the Shareholders on their claiming the shares, till which time, the dividend will be available in the Unpaid Dividend Bank Account.
for and on behalf of the Board
P. Trivikrama Prasad Managing Director
Place : Hyderabad D. AshokDate : May 27, 2017 Chairman

CO
MPA
NY
OV
ERV
IEW STA
TUTO
RY R
EPOR
TS FINA
NC
IAL STA
TEMEN
TS NO
TICE
Report on Corporate Governance
Nava Bharat Ventures Limited 83
CEO and CFO Certificationfor FY ended 31.03.2017
(Pursuant to Regulation 17(8) of SEBI (LODR) Regulations, 2015)
The Board of directorsNava Bharat Ventures LimitedHyderabad
A. We have reviewed financial statements and the cash flow statement for the year ended March 31, 2017 and that to the best of our knowledge and belief:
1. these statements do not contain any materially untrue statement or omit any material fact or contain statements that might be misleading;
2. these statements together present a true and fair view of the company’s affairs and are in compliance with existing accounting standards, applicable laws and regulations.
B. There are, to the best of our knowledge and belief, no transactions entered into by the company during the year which are fraudulent, illegal or violative of the company’s code of conduct.
C. We accept responsibility for establishing and maintaining internal controls for financial reporting and that we have evaluated the effectiveness of internal control systems of the company pertaining to financial reporting and we have disclosed to the auditors and the Audit committee, deficiencies in the design or operation of such internal controls, if any, of which we are aware and the steps we have taken or propose to take to rectify these deficiencies.
D. We have indicated to the Auditors and the Audit committee, wherever applicable;
1. significant changes in internal control over financial reporting during the year;
2. significant changes in accounting policies during the year and that the same have been disclosed in the notes to the financial statements; and
3. instances of significant fraud of which we have become aware and the involvement therein, if any, of the management or an employee having a significant role in the company’s internal control system over financial reporting.
for Nava Bharat Ventures Limited
P. Trivikrama Prasad Managing Director
Place : Hyderabad T. Hari BabuDate : May 27, 2017 Chief Financial Officer

84 45th Annual Report 2016-17
Declaration on Compliance with code of conduct
Compliance of Code of Conduct for Directors and Senior Management Personnel pursuant to the provisions as provided under Schedule V of SEBI(LODR) Regulations, 2015.
The Board laid down a Code of Conduct for all Board members and Senior Management Personnel of the Company. The Code of Conduct was also posted on the Website of the Company.
The Members of the Board and senior management personnel have affirmed compliance with the code of conduct on an annual basis in respect of the financial year ended March 31, 2017.
On behalf of the BoardFor Nava Bharat Ventures Limited
P. Trivikrama PrasadManaging Director
Place: Hyderabad Date : May 27, 2017
Auditors’ Certificate on corporate governance
Nava Bharat Ventures LimitedHyderabad.
We have examined the compliance of conditions of corporate governance by NAVA BHARAT VENTURES LIMITED, Hyderabad, for the year ended on March 31, 2017, as stipulated in Securities and Exchange Board of India(Listing Obligations and Disclosure Requirements) Regulations, 2015 as per the listing agreement entered into by the said Company with stock exchanges.
The compliance of conditions of Corporate Governance is the responsibility of the management. Our examination was limited to a review of the procedures and implementation thereof, adopted by the Company for ensuring compliance of the conditions of the Corporate Governance as stipulated in the said Clause. It is neither an audit nor an expression of opinion on the financial statements of the Company.
In our opinion and to the best of our information and according to the explanations given to us, and based on the representations made by the Directors and the Management, we certify that the Company has complied with the conditions of Corporate Governance as stipulated in the above mentioned Listing Agreement.
We state that such compliance is neither an assurance as to the future viability of the Company nor of the efficiency or effectiveness with which the management has conducted the affairs of the Company.
for Brahmayya & Co.,Chartered Accountants
Firm’s Registration No.000513S
P. ChandramouliPartner
Membership No.025211Place : Hyderabad Date : May 27, 2017

CO
MPA
NY
OV
ERV
IEW STA
TUTO
RY IN
FOR
MA
TION
FINA
NC
IAL STA
TEMEN
TS - Stand
alon
e NO
TICE
Independent auditors’ report
Nava Bharat Ventures Limited 85
Independent auditors’ report
To The Members of Nava Bharat Ventures Limited, Hyderabad.
REPORT ON THE STANDAlONE IND AS FINANCIAl STATEMENTS:
We have audited the accompanying Standalone Ind AS Financial statements of NAVA BHARAT VENTURES LIMITED (“the Company”), which comprise the Balance Sheet as at 31st March 2017, the Statement of Profit and Loss (including Other Comprehensive Income), the Cash Flow Statement and the Statement of Changes in Equity for the year then ended and a summary of the significant accounting policies and other explanatory information.
MANAGEMENT’S RESPONSIBIlITY FOR THE STANDAlONE FINANCIAl STATEMENTS:
The Company’s Board of Directors is responsible for the matters stated in Section 134(5) of the Companies Act, 2013 (“the Act”) with respect to the preparation of these Standalone Ind AS Financial statements that give a true and fair view of the state of affairs, profit or loss including other comprehensive income, cash flows and changes in equity of the Company in accordance with the accounting principles generally accepted in India, including the Indian Accounting Standards (Ind AS) specified under Section 133 of the Act.
This responsibility also includes maintenance of adequate accounting records in accordance with the provisions of the Act for safeguarding of the assets of the Company and for preventing and detecting frauds and other irregularities; selection and application of appropriate accounting policies; making judgments and estimates that are reasonable and prudent; and design, implementation and maintenance of adequate internal financial controls, that were operating effectively for ensuring the accuracy and completeness of the accounting records, relevant to the preparation and presentation of the Standalone Ind AS Financial statements that give a true and fair view and are free from material misstatement, whether due to fraud or error.
AUDITOR’S RESPONSIBIlITY:
Our responsibility is to express an opinion on these Standalone Ind AS Financial statements based on our audit.
We have taken into account the provisions of the Act, the accounting and auditing standards and matters which are required to be included in the audit report under the provisions of the Act and the Rules made thereunder.
We conducted our audit of the Standalone Ind AS Financial statements in accordance with the Standards on Auditing specified under Section 143(10) of the Act. Those Standards require that we comply with ethical requirements and plan and perform the audit to obtain reasonable assurance about whether the Standalone Ind AS Financial statements are free from material misstatement.
An audit involves performing procedures to obtain audit evidence about the amounts and the disclosures in the Standalone Ind AS Financial statements. The procedures selected depend on the auditor’s judgment, including the assessment of the risks of material misstatement of the Standalone Ind AS Financial statements, whether due to fraud or error. In making those risk assessments, the auditor considers internal financial control relevant to the Company’s preparation of the Standalone Ind AS Financial statements that give a true and fair view in order to design audit procedures that are appropriate in the circumstances. An audit also includes evaluating the appropriateness of the accounting policies used and the reasonableness of the accounting estimates made by the Company’s Directors, as well as evaluating the overall presentation of the Standalone Ind AS Financial statements.
We believe that the audit evidence we have obtained is sufficient and appropriate to provide a basis for our audit opinion on the Standalone Ind AS Financial statements.
OPINION:
In our opinion and to the best of our information and according to the explanations given to us the aforesaid Standalone Ind AS Financial statements give the information required by the Act in the manner so required and give a true and fair view in conformity with the accounting principles generally accepted in India including the Ind AS, of the state of affairs of the Company as at 31st March 2017, its profit, its cash flows and the changes in equity for the year ended on that date.

86 45th Annual Report 2016-17
REPORT ON OTHER lEGAl AND REGUlATORY REQUIREMENTS:
1. As required by the Companies (Auditor’s Report) Order, 2016 (“the Order”) issued by the Central Government of India in terms of section 143 (11) of the Act, we give in the “Annexure A”, a statement on the matters specified in paragraphs 3 and 4 of the Order.
2. As required by Section 143 (3) of the Act, we report that:
(a) We have sought and obtained all the information and explanations which to the best of our knowledge and belief were necessary for the purposes of our audit.
(b) In our opinion, proper books of account as required by law have been kept by the Company so far as it appears from our examination of those books.
(c) The Balance Sheet, the Statement of Profit and Loss, the Cash Flow Statement and the Statement of Changes in Equity dealt with by this Report are in agreement with the books of account.
(d) In our opinion, the aforesaid Standalone Ind AS Financial statements comply with the Accounting Standards specified under Section 133 of the Act.
(e) On the basis of the written representations received from the directors as on 31st March 2017 taken on record by the Board of Directors, none of the directors is disqualified as on 31st March 2017 from being appointed as a director in terms of Section 164 (2) of the Act.
(f) With respect to the adequacy of the internal financial controls over financial reporting of the Company and the operating effectiveness of such controls, refer to our separate Report in “Annexure B”.
(g) With respect to the other matters to be included in the Auditor’s Report in accordance with Rule 11 of the Companies (Audit and Auditors) Rules, 2014, in our opinion and to the best of our information and according to the explanations given to us:
i. The Company has disclosed the impact of pending litigations on its financial position in its Standalone Ind AS Financial statements – Refer Note 30 to the Standalone Ind AS Financial statements
ii. The Company did not have any long-term contracts including derivative contracts for which there were any material foreseeable losses.
iii. There has been no delay in transferring amounts, required to be transferred, to the Investor Education and Protection Fund by the Company.
iv. The Company has provided requisite disclosures in the financial statements as to holdings as well as dealings in Specified Bank Notes during the period from 8th November 2016 to 30th December 2016. Based on audit procedures and relying on the management representation we report that the disclosures are in accordance with books of account maintained by the Company and as produced to us by the Management – Refer Note:55
for Brahmayya & Co.,Chartered Accountants
Firm’s Registration No.000513S
P. ChandramouliPlace : Hyderabad PartnerDate : May 27, 2017 Membership No.025211

CO
MPA
NY
OV
ERV
IEW STA
TUTO
RY IN
FOR
MA
TION
FINA
NC
IAL STA
TEMEN
TS - Stand
alon
e NO
TICE
Independent auditors’ report
Nava Bharat Ventures Limited 87
Annexure - A to the Auditors’ Report:
v. In respect of all other immovable properties, we are given to understand that the title deeds are with Security trustee and are held in the name/ erstwhile name of the Company or in the name of amalgamated Company.
2. The inventory has been physically verified during the year by the management. In our opinion, the frequency of verification is reasonable. No material discrepancies were noticed on such verification between the physical stocks and book records.
3.a. During the year, the Company has not granted any loans, secured or unsecured to Companies, firms, limited liability partnerships or other parties covered in the register maintained under Section 189 of the Companies Act, 2013.
b. In our opinion and according to the information and explanations given to us, in respect of the unsecured loan granted to a Company in earlier year, the terms and conditions of the grant of such loan are not, prima facie, prejudicial to the interest of the Company.
c. The schedule of repayment of principal and payment of interest has been stipulated and the repayments are as per the said stipulations.
d. There were no overdue amounts in respect of the said loans.
4. In our opinion and according to the information and explanations given to us, the Company has complied with the provisions of section 185 and 186 of the Act, with respect to the loans and investments made.
5. The Company has not accepted any deposits from the public. Hence the provisions of Sections 73 to 76 or any other relevant provisions of the Companies Act, 2013, and the rules framed there under, do not apply to this Company.
6. The maintenance of cost records has been specified by the Central Government under section 148(1) of the Companies Act, 2013 for the Products of Company. We have broadly reviewed the cost records maintained by the Company pursuant to sub-section
The Annexure referred to in Para 1 under the heading of "Report on Other Legal and Regulatory Requirements” of our report of even date, to the members of NAVA BHARAT VENTURES LIMITED, HYDERABAD, for the year ended March 31, 2017.
1.a. The Company has maintained proper records showing full particulars, including quantitative details and situation of fixed assets.
b. As explained to us, the management has physically verified the fixed assets during the year and there is a regular programme of physical verification which, in our opinion, is reasonable having regard to the size of the Company and the nature of the assets. No discrepancies were noticed on such verification.
c. According to the information and explanations furnished by the Management and based on the records examined by us, regarding the title deeds of the immovable property other than self-constructed buildings and including investment Property, we report that:
i. In respect of immovable properties of lands that have been taken on lease and disclosed as fixed assets in the financial statements, the lease agreements are in the name of the company/amalgamated Company, where the Company is the lessee in the agreements.
ii. The title in respect of the land costing `15.71 lakhs admeasuring 14.06 acres and 23 guntas is yet to be transferred in the name of the Company.
iii. The title in respect of land costing `26.06 lakhs admeasuring 5.05 acres allotted by APIIC Limited is yet to be transferred in the name of the Company.
iv. The long-term lease period relating to the land situated at Samalkot, East Godavari District on which the Buildings of Sugar Manufacturing facility were constructed was expired on 12.8.1996.

88 45th Annual Report 2016-17
(1) of section 148 of the Companies Act, 2013 and are of the opinion that prime facie the prescribed accounts and records have been made and maintained. We have however not made a detailed examination of the cost records with a view to determine whether they are accurate or Complete.
7.a. According to the records, the company is generally regular in depositing undisputed statutory dues including provident fund, employees’ state insurance, income-tax, sales-tax, service tax, duty of customs, duty of excise, value added tax, cess and all other material statutory dues with the appropriate authorities. However, the extent of the arears of outstanding statutory dues as at March 31, 2017 for a period of more than six months from the date they became payable are as follows.
Name of the Statute Nature of the dues Amount `
Period to which the amount relates
Due DateDate of
payment
AP AL (CFNAP) Act, 2006
Land Conversion Tax 151,061 2010 -11 - Not yet paid
OSPCB Water Cess
52,560 2008-09 30.04.2009
Not yet paid60,994 2009-10 30.04.2010
11,518 2011-12 30.04.2012
O S Govt. Ground Rent7,592 2009-10 31.03.2010
Not yet paid5,955 2011-12 31.03.2012
East Coast RailwaysWater way line Charges
1,80,9322002-03 to
2009-1031.03.2010 Not yet paid
The A.P. Electricity Duty Act, 2003 (as amended)
Electricity Duty
72,60,2822003-04 to
2007-0815.04.2008
Not yet paid
4,07,520 2008- 09 30.04.2009
4,37,520 May 2010 30.06.2010
2,51,868 Jun 2010 31.07.2010
5,35,680 July 2010 31.08.2010
5,14,944 Aug 2010 30.09.2010
53,24,777 Sept 2010 31.10.2010
52,39,1262003-.04 to
2010-1130.04.2012
48,979 April 2011 31.05.2011
6,45,905 May 2011 30.06.2011
4,95,380 March 2012 30.04.2012
7,12,759 2012-13 30.05.2013
5,59,577 2013-14 30.05.2014
6,44,816 2014-15 30.05.2015
6,15,821 2015-16 30.05.2016

CO
MPA
NY
OV
ERV
IEW STA
TUTO
RY IN
FOR
MA
TION
FINA
NC
IAL STA
TEMEN
TS - Stand
alon
e NO
TICE
Independent auditors’ report
Nava Bharat Ventures Limited 89
b. According to the records of the Company and the information and explanations given to us, there were no dues of income tax or sales tax or service tax or duty of customs or duty of excise or value added tax have not been deposited on account of any dispute except the following.
Name of the StatuteNature of Dues
Amount `Period to which amount relates
Forum where dispute is pending
AP (Ag. Produce & Live Stock) Marketing Act, 1966
Agricultural Market Cess
28,15,396 1980-81 to 1989-90The Secretary, Agricultural Marketing Committee, Visakhapatnam
AP Municipalities Act, 1965
Property Tax
1,49,952 1995-96 to 2000-01 Hon’ble High Court of AP
2,00,798 1995-96 to 2000-01 Hon’ble High Court of AP
9,19,512 2011-2016 Appeal yet to be filed
Various Sales Tax Acts
Central Sales Tax
2,20,130 2004-05Asst. Commissioner of Sales Tax, Range-II, Cuttack
64,87,532 2000-01 STAT, Hyderabad
APGST 79,35,607 2003-04Asst. Commissioner of Commercial Taxes, Warangal
Central Excise Act, 1944
Excise Duty
1,98,33,272 2004-05 to 2009-10 CESTAT, Bangalore
7,37,00,285 2012-13 CESTAT, Bangalore
55,29,064 1997-98 CESTAT, New Delhi
13,690,286 2000-01 to 2001-02 Hon’ble High Court of AP
12,25,648 2000-01 to 2005-06Commissioner of Central Excise(Appeals), Visakhapatnam
Service Tax
59,10,310Oct 2007 – March
2017Commissioner of Central Excise(Appeals), Visakhapatnam
1,18,23,188 2009-14Commissioner of Service Tax (Appeals), Hyderabad
16,51,329 2014-15Commissioner of Service Tax (Appeals), Hyderabad
92,28,030 2011-16Commissioner of Customs and Central Excise (Appeals), Hyderabad
13,54,843April 2012 – March
2014Deputy Commissioner of Central Excise, Kakinada
21,03,640April 2011 – March
2017Assistant Commissioner of Central Excise, Kakinada
4,82,96,986 2007-08 CESTAT, Kolkata
The AP Non-Agricultural Land Assessment Act, 1963
NALA TAX 12,25,116 1993-94 to 1998-99 Hon’ble High Court of AP
Customs Act, 1962 Customs Duty17,61,860 1985-87 Hon’ble High Court of AP
2,06,05,922 2012-13 CESTAT, Chennai
The A.P. Electricity Duty Act, 2003.
Electricity Duty 6,61,33,219 2008-09 to 2016-17 Hon’ble High Court of AP
The A.P. Electricity Duty Act, 2003.
Electricity Duty 98,90,981* 2003-13 Hon’ble Supreme Court of India
* Net of amounts paid under protest

90 45th Annual Report 2016-17
8. In our opinion and according to the information and explanations given to us, the Company has not defaulted in repayment of loans or borrowings to any financial institutions and Banks.
9. In our opinion and according to the information and explanations given to us the term loans were applied for the purpose for which the loans were raised and the Company did not raise any money by way of initial public offer or further public offer (including debt instruments) during the year.
10. According to the information and explanations given to us, no material fraud by the Company or on the Company by its officers or employees has been noticed or reported during the course of our audit.
11. According to the information and explanations give to us and based on our examination of the records of the Company, the Company has paid/provided for managerial remuneration in accordance with the requisite approvals mandated by the provisions of section 197 read with Schedule V to the Act.
12. In our opinion and according to the information and explanations given to us, the Company is not a Nidhi Company. Accordingly, paragraph 3(xii) of the Companies (Auditor’s Report) Order 2016 is not applicable
13. According to the information and explanations given to us and based on our examination of the records of the Company, transactions with the related parties are in compliance with sections 177 and 188 of the Act where applicable and details of such transactions have been disclosed in the financial statements as required by the applicable accounting standards.
Annexure - B to the Auditors’ ReportReport on the Internal Financial Controls under Clause (i) of Sub-section 3 of Section 143 of the Companies Act, 2013 (“the Act”)
14. According to the information and explanations give to us and based on our examination of the records of the Company, the Company has not made any preferential allotment or private placement of shares or fully or partly convertible debentures during the year.
15. According to the information and explanations given to us and based on our examination of the records of the Company, the Company has not entered into non-cash transactions with directors or persons connected with him. Accordingly, paragraph 3(xv) of the Companies (Auditor’s Report) Order 2016 is not applicable.
16. The Company is not required to be registered under section 45-IA of the Reserve Bank of India Act 1934.
for Brahmayya & Co.,Chartered Accountants
Firm’s Registration No.000513S
P. ChandramouliPlace : Hyderabad PartnerDate : May 27, 2017 Membership No.025211
We have audited the internal financial controls over financial reporting of NAVA BHARAT VENTURES LIMITED, HYDERABAD (“the Company”) as of 31 March 2017 in conjunction with our audit of the financial statements of the Company for the year ended on that date.
MANAGEMENT’S RESPONSIBIlITY FOR INTERNAl FINANCIAl CONTROlS
The Company’s management is responsible for establishing and maintaining internal financial controls based on the internal control over financial reporting criteria established by the Company considering the essential components of
internal control stated in the Guidance Note on Audit of Internal Financial Controls Over Financial Reporting issued by the Institute of Chartered Accountants of India (‘ICAI’). These responsibilities include the design, implementation and maintenance of adequate internal financial controls that were operating effectively for ensuring the orderly and efficient conduct of its business, including adherence to company’s policies, the safeguarding of its assets, the prevention and detection of frauds and errors, the accuracy and completeness of the accounting records, and the timely preparation of reliable financial information, as required under the Companies Act, 2013.

CO
MPA
NY
OV
ERV
IEW STA
TUTO
RY IN
FOR
MA
TION
FINA
NC
IAL STA
TEMEN
TS - Stand
alon
e NO
TICE
Independent auditors’ report
Nava Bharat Ventures Limited 91
AUDITOR’S RESPONSIBIlITY
Our responsibility is to express an opinion on the Company's internal financial controls over financial reporting based on our audit. We conducted our audit in accordance with the Guidance Note on Audit of Internal Financial Controls Over Financial Reporting (the “Guidance Note”) and the Standards on Auditing, to the extent applicable to an audit of internal financial controls, both applicable to an audit of Internal Financial Controls and, both issued by the Institute of Chartered Accountants of India. Those Standards and the Guidance Note require that we comply with ethical requirements and plan and perform the audit to obtain reasonable assurance about whether adequate internal financial controls over financial reporting was established and maintained and if such controls operated effectively in all material respects.
Our audit involves performing procedures to obtain audit evidence about the adequacy of the internal financial controls system over financial reporting and their operating effectiveness. Our audit of internal financial controls over financial reporting included obtaining an understanding of internal financial controls over financial reporting, assessing the risk that a material weakness exists and testing and evaluating the design and operating effectiveness of internal control based on the assessed risk. The procedures selected depend on the auditor’s judgment, including the assessment of the risks of material misstatement of the financial statements, whether due to fraud or error.
We believe that the audit evidence we have obtained is sufficient and appropriate to provide a basis for our audit opinion.
MEANING OF INTERNAl FINANCIAl CONTROlS OVER FINANCIAl REPORTING
A company's internal financial control over financial reporting is a process designed to provide reasonable assurance regarding the reliability of financial reporting and the preparation of financial statements for external purposes in accordance with generally accepted accounting principles. A company's internal financial control over financial reporting includes those policies and procedures that:
1. pertain to the maintenance of records that, in reasonable detail, accurately and fairly reflect the transactions and dispositions of the assets of the company;
2. provide reasonable assurance that transactions are recorded as necessary to permit preparation of financial statements in accordance with generally accepted accounting principles, and that receipts and expenditures of the company are being made only in accordance with authorisations of management and directors of the company; and
3. provide reasonable assurance regarding prevention or timely detection of unauthorised acquisition, use, or disposition of the company's assets that could have a material effect on the financial statements.
INHERENT lIMITATIONS OF INTERNAl FINANCIAl CONTROlS OVER FINANCIAl REPORTING
Because of the inherent limitations of internal financial controls over financial reporting, including the possibility of collusion or improper management override of controls, material misstatements due to error or fraud may occur and not be detected. Also, projections of any evaluation of the internal financial controls over financial reporting to future periods are subject to the risk that the internal financial control over financial reporting may become inadequate because of changes in conditions, or that the degree of compliance with the policies or procedures may deteriorate.
OPINION
In our opinion, the Company has, in all material respects, an adequate internal financial controls system over financial reporting and such internal financial controls over financial reporting were operating effectively as at 31 March 2017, based on the internal control over financial reporting criteria established by the Company considering the essential components of internal control stated in the Guidance Note on Audit of Internal Financial Controls Over Financial Reporting issued by the Institute of Chartered Accountants of India.
for Brahmayya & Co.,Chartered Accountants
Firm’s Registration No.000513S
P. ChandramouliPlace : Hyderabad PartnerDate : May 27, 2017 Membership No.025211

Balance sheetas at 31st March, 2017
` in lakhs
Particulars Note No.
As at March 31, 2017
As at March 31, 2016
As at March 31, 2015
ASSETSNon-current assets(a) Property, Plant and Equipment 4 83,099.02 84,507.59 82,035.44 (b) Capital work-in-progress 735.00 474.69 675.56 (c) Investment Property 5 252.98 258.68 264.38 (d) Intangible assets 6 433.35 464.94 442.10 (e) Financial Assets
(i) Investments 7 109,262.05 109,318.35 106,590.22 (ii) Loans 8 49,039.04 31,668.64 2,422.91 (iii) Other financial assets 9 1,958.68 2,244.54 2,359.82
(f) Other non-current assets 10 23,039.66 22,770.79 20,548.38 267,819.78 251,708.22 215,338.81
Current assets(a) Inventories 11 23,334.99 21,559.57 34,383.76 (b) Financial Assets
(i) Trade receivables 12 9,794.46 17,090.17 22,013.27 (ii) Cash and cash equivalents 13 2,132.51 189.89 2,401.03 (iii) Bank balances other than (ii) above 14 110.24 74.46 63.16 (iv) Loans 15 - 21,688.33 3,751.10 (v) Others financial assets 16 7,827.01 8,001.36 4,571.97
(c) Current Tax Assets (Net) 660.65 296.45 870.88 (d) Other current assets 17 10,256.97 7,091.65 10,214.67
54,116.83 75,991.88 78,269.84 Total Assets 321,936.61 327,700.10 293,608.65 EQUITY AND LIABILITIESEquity (a) Equity Share capital 18 3,572.77 1,787.01 1,787.01 (b) Other Equity 19 266,962.36 263,354.38 256,638.03
270,535.13 265,141.39 258,425.04 LiabilitiesNon - current liabilities(a) Financial Liabilities
(i) Borrowings 20 15,015.17 24,396.57 2,818.15 (ii) Other financial liabilities 21 37.72 42.92 45.65
(b) Deferred tax liabilities (net) 22 4,223.96 2,710.78 2,898.72 (c) Other Non-current liabilities 23 - - 0.40 (d) Provisions 24 1,182.42 780.80 463.05
20,459.27 27,931.07 6,225.97 Current liabilities(a) Financial Liabilities
(i) Borrowings 25 6,310.54 11,481.14 6,316.65 (ii) Trade payables 26 7,138.29 8,559.31 6,048.92 (iii) Other financial liabilities 27 14,662.25 10,059.15 12,151.55
(b) Other current liabilities 28 2,134.30 3,431.35 3,114.86 (c) Provisions 29 696.83 1,096.69 1,325.66
30,942.21 34,627.64 28,957.64 Contingent Liabilities and Commitments 30Total Equity and Liabilities 321,936.61 327,700.10 293,608.65 Notes to the financial statements 1-57
per our report of even date for and on behalf of the Boardfor Brahmayya & Co.,Chartered AccountantsFirm’s Registration Number: 000513S G.R.K. Prasad
Executive DirectorP. ChandramouliPartner T. Hari Babu P. Trivikrama PrasadMembership Number: 025211 Chief Financial Officer Managing Director
VSN RajuPlace: Hyderabad Company Secretary & D. AshokDate : May 27, 2017 Vice President Chairman
92 45th Annual Report 2016-17
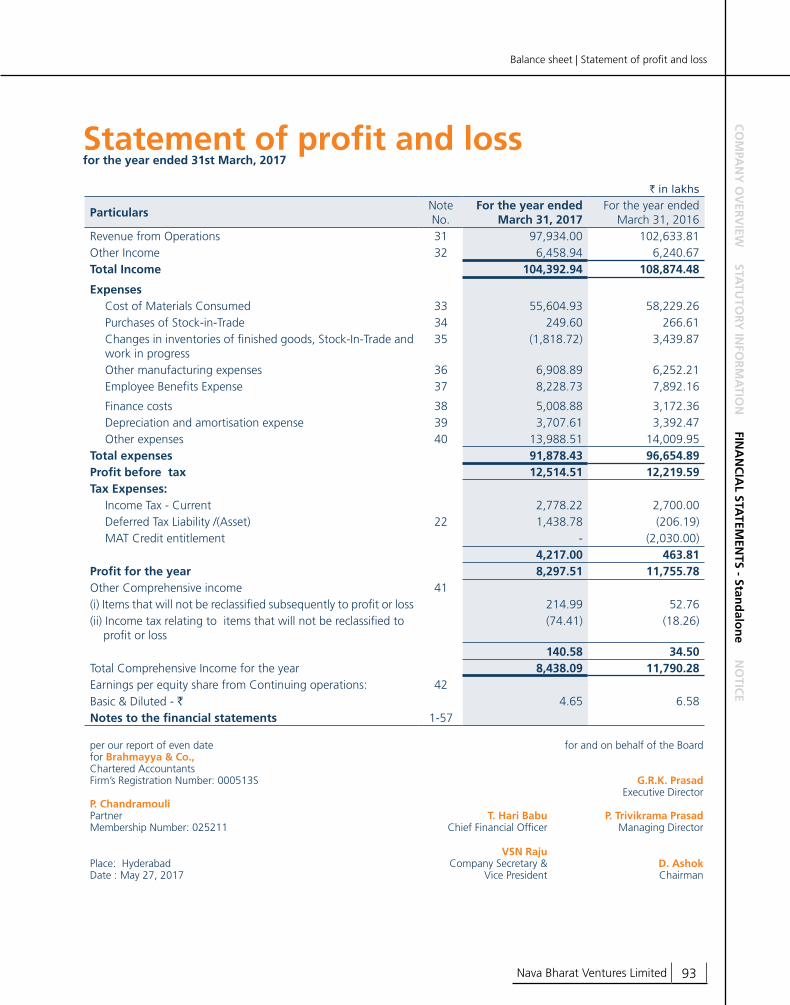
Statement of profit and lossfor the year ended 31st March, 2017
` in lakhs
ParticularsNote No.
For the year ended March 31, 2017
For the year ended March 31, 2016
Revenue from Operations 31 97,934.00 102,633.81 Other Income 32 6,458.94 6,240.67 Total Income 104,392.94 108,874.48
ExpensesCost of Materials Consumed 33 55,604.93 58,229.26 Purchases of Stock-in-Trade 34 249.60 266.61 Changes in inventories of finished goods, Stock-In-Trade and work in progress
35 (1,818.72) 3,439.87
Other manufacturing expenses 36 6,908.89 6,252.21Employee Benefits Expense 37 8,228.73 7,892.16
Finance costs 38 5,008.88 3,172.36 Depreciation and amortisation expense 39 3,707.61 3,392.47 Other expenses 40 13,988.51 14,009.95
Total expenses 91,878.43 96,654.89 Profit before tax 12,514.51 12,219.59 Tax Expenses:
Income Tax - Current 2,778.22 2,700.00 Deferred Tax Liability /(Asset) 22 1,438.78 (206.19)MAT Credit entitlement - (2,030.00)
4,217.00 463.81 Profit for the year 8,297.51 11,755.78 Other Comprehensive income 41(i) Items that will not be reclassified subsequently to profit or loss 214.99 52.76 (ii) Income tax relating to items that will not be reclassified to profit or loss
(74.41) (18.26)
140.58 34.50 Total Comprehensive Income for the year 8,438.09 11,790.28 Earnings per equity share from Continuing operations: 42Basic & Diluted - ` 4.65 6.58 Notes to the financial statements 1-57
per our report of even date for and on behalf of the Boardfor Brahmayya & Co.,Chartered AccountantsFirm’s Registration Number: 000513S G.R.K. Prasad
Executive DirectorP. ChandramouliPartner T. Hari Babu P. Trivikrama PrasadMembership Number: 025211 Chief Financial Officer Managing Director
VSN RajuPlace: Hyderabad Company Secretary & D. AshokDate : May 27, 2017 Vice President Chairman
Balance sheet | Statement of profit and lossC
OM
PAN
Y O
VER
VIEW
STATU
TORY
INFO
RM
ATIO
N FIN
AN
CIA
L STATEM
ENTS - Stan
dalo
ne N
OTIC
E
Nava Bharat Ventures Limited 93
A. E
QU
ITY
SH
AR
E C
API
TAL
` in
lakh
s
For
the
perio
d/ye
ar e
nded
At
the
begi
nnin
gC
hang
e in
equ
ityA
t th
e en
d
Mar
ch 3
1, 2
017
1,78
7. 0
11,
785.
763,
572.
77
Mar
ch 3
1, 2
016
1,78
7. 0
1 -
1,
787.
01
Apr
il 01
, 201
51,
787.
01
-
1,78
7.01
B. O
THER
EQ
UIT
Y`
in lakh
s
Part
icul
ars
Cap
ital
Rese
rve
Cap
ital
Rede
mpt
ion
Rese
rve
Secu
ritie
s Pr
emiu
m
Rese
rve
Gen
eral
Re
serv
eTr
easu
ry
Shar
esO
ther
Re
serv
e
Surp
lus
In
Stat
emen
t O
f Pr
ofit
And
Los
s
Act
uaria
l G
ain/
(Los
s)
-OC
ITo
tal
Bal
ance
as
at
Ap
ril 0
1, 2
015
60.
20
826
.39
26,
214.
22
87,
852.
40 (
206.
34)
33.
60
141
,857
.56
-
256
,638
.03
Profi
t fo
r th
e ye
ar -
-
-
-
-
-
1
1,75
5.78
-
1
1,75
5.78
Tran
sfer
to
gene
ral r
eser
ve -
-
-
1
,500
.00
-
-
(1,5
00.0
0) -
-
Div
iden
d on
Eq
uity
Cap
ital
-
-
-
-
-
-
(4,2
15.7
1) -
(4
,215
.71)
Cor
pora
te
Div
iden
d Ta
x -
-
-
-
-
-
(8
58.2
2) -
(8
58.2
2)
Oth
er
Com
preh
ensi
ve
inco
me
for
the
year
-
-
-
-
-
-
-
34.
50
34.
50
Bal
ance
as
at
Mar
ch 3
1, 2
016
60.
20
826
.39
26,
214.
22
89,
352.
40
(20
6.34
) 3
3.60
1
47,0
39.4
1 3
4.50
2
63,3
54.3
8
Statement of changes in equityfor the year ended 31st March, 2017
94 45th Annual Report 2016-17

B. O
THER
EQ
UIT
Y`
in lakh
s
Part
icul
ars
Cap
ital
Rese
rve
Cap
ital
Rede
mpt
ion
Rese
rve
Secu
ritie
s Pr
emiu
m
Rese
rve
Gen
eral
Re
serv
eTr
easu
ry
Shar
esO
ther
Re
serv
e
Surp
lus
In
Stat
emen
t O
f Pr
ofit
And
Los
s
Act
uaria
l G
ain/
(Los
s)
-OC
ITo
tal
Bal
ance
as
at
Mar
ch 3
1, 2
016
60.
20
826
.39
26,
214.
22
89,
352.
40
(20
6.34
)33
.60
147
,039
.41
34.5
0 2
63,3
54.3
8
Profi
t fo
r th
e ye
ar -
-
-
-
-
-
8
,297
.51
-
8,2
97.5
1
Div
iden
d on
Eq
uity
Cap
ital
-
-
-
-
-
-
(2,5
29.4
3) -
(2
,529
.43)
Cor
pora
te
Div
iden
d Ta
x -
-
-
-
-
-
(5
14.9
3) -
(5
14.9
3)
Bonu
s is
sue
of
equi
ty s
hare
s -
-
-
(1
,785
.75)
-
-
-
-
(1,7
85.7
5)
Oth
er
Com
preh
ensi
ve
inco
me
for
the
year
-
-
-
-
-
-
-
140
.58
140
.58
Bal
ance
as
at
Mar
ch 3
1, 2
017
60.
20
826
.39
26,
214.
22
87,
566.
65
(20
6.34
)33
.60
152
,292
.56
175
.08
266
,962
.36
per
our
repo
rt o
f ev
en d
ate
for
and
on b
ehal
f of
the
Boa
rd
for
Bra
hm
ayya
& C
o.,
Cha
rter
ed A
ccou
ntan
ts
Firm
’s Re
gist
ratio
n N
umbe
r: 0
0051
3SG
.R.K
. Pra
sad
Exec
utiv
e D
irect
or
P. C
han
dra
mo
uli
Part
ner
T. H
ari B
abu
P. T
rivi
kram
a Pr
asad
Mem
bers
hip
Num
ber:
025
211
Chi
ef F
inan
cial
Offi
cer
Man
agin
g D
irect
or
VSN
Raj
uPl
ace:
Hyd
erab
adC
ompa
ny S
ecre
tary
&D
. Ash
ok
Dat
e : M
ay 2
7, 2
017
Vic
e Pr
esid
ent
Cha
irman
Statement of changes in equityfor the year ended 31st March, 2017
CO
MPA
NY
OV
ERV
IEW STA
TUTO
RY IN
FOR
MA
TION
FINA
NC
IAL STA
TEMEN
TS - Stand
alon
e NO
TICE
Statement of changes in equity
Nava Bharat Ventures Limited 95

Cash flow statementfor the year ended 31st March, 2017
` in lakhs
ParticularsFor the year ended
March 31, 2017For the year ended
March 31, 20161 Cash flow from operating activities:
A. Profit before tax 12,514.51 12,219.59 B. Adjustment for non-cash transactions:
a. Depreciation and amortisation expenses 3,707.61 3,392.47 b. Amortisation of prepaid lease rentals 4.06 5.01 c. Property, plant and equipment discarded 98.12 7.95 d. Investments written off 27.00 - e. Other notional incomes
i. Deferred Rental Income (4.29) (2.43)ii. Interest income of Employee Loans (11.27) (16.33)iii. Income on employee retention deposits (1.44) (1.82)
f. Provisions written back:Excess provisions/ Credit Balances written back (76.34) (266.01)
3,743.45 3,118.84 C. Adjustment for investing and financing activities:
a. Interest Income:i. Changes in fair value of financial assets (187.46) (150.82)ii. From bank deposits and others (3,133.08) (1,966.09)
b. Income from Investments:i. Change in fair value 30.24 (46.25)ii. Gains on sale of investments (22.22) (43.48)iii. Dividend Income (14.53) (29.03)
c. Gain on sale of property, plant and equipment (35.98) (2.62)d. Fair Value of Guarantee Commission income - (53.59)e. Interest paid on borrowings (finance cost) 3,021.23 2,698.89
(341.80) 407.01 D. Adjustment for changes in working capital:
a. Decrease / (Increase) in inventories (1,775.43) 12,824.20 b. Decrease / (Increase) in trade receivables 7,295.71 4,923.10 c. Decrease / (Increase) in other bank balances (35.77) (11.30)d. Decrease / (Increase) in other financial assets
(Excluding fair value income) 660.39 (3,145.16)e. Decrease / (Increase) in other current and non - current assets (3,710.60) 3,725.65 f. (Decrease) / Increase in trade payables (1,421.03) 2,510.39 g. (Decrease) / Increase in other financial liabilities 4,421.37 (2,273.56)h. (Decrease) / Increase in other current liabilities (1,214.07) 563.70 i. (Decrease) / Increase in provisions 216.75 141.54
4,437.32 19,258.56

CO
MPA
NY
OV
ERV
IEW STA
TUTO
RY R
EPOR
TS FINA
NC
IAL STA
TEMEN
TS (Stand
alon
e) NO
TICE
Nava Bharat Ventures Limited 97
` in lakhs
ParticularsFor the year ended
March 31, 2017For the year ended
March 31, 2016
E. Cash generated from operations (A+B+C+D) 20,353.48 35,004.00 Less: Direct taxes paid (net of refunds) (3,657.35) (2,983.80)
Net cash flow from operating activities (I) 16,696.13 32,020.20 II. Cash flows from investing activities
a. Purchase of fixed assets, including CWIP (2,588.44) (5,700.54)b. Proceeds from sale of fixed assets 4.25 14.33 c. Loans given to subsidiary 4,317.93 (47,182.96)d. Investment in subsidiary (1.34) (2,628.30)e. Purchase of financial instruments (Investments) (4,000.00) (2,400.00)f. Proceeds from sale of financial instruments (Investments) 4,022.62 2,443.48 g. Dividend Income received 14.53 29.03 h. Interest Income received 3,405.42 1,166.06 Net cash flow from/ (used in) investing activities (II) 5,174.97 (54,258.90)
III. Cash flows from financing activitiesa. Proceeds from long term borrowings - 29,040.00 b. Repayment of long term borrowings (9,202.53) (7,309.44)c. Proceeds from short term borrowings - 5,164.50 d. Repayment of short term borrowings (5,170.60) - e. Dividend paid for the year (2,538.12) (4,208.96)f. Interest paid for the year (3,017.23) (2,658.54)Net cash flow (used in) financing activities (III) (19,928.48) 20,027.56
IV. Net (decrease) in cash and cash equivalents (I + II + III) 1,942.62 (2,211.14)Cash and cash equivalents at the beginning of the year 189.89 2,401.03
V. Cash and cash equivalents at the end of the year 2,132.51 189.89 VI. Components of cash and cash equivalents:
a. Cash on hand 12.19 6.07 b. Cheques, Drafts and Stamps on hand - - c. With banks:
i. On Current Account 2,120.32 180.74 ii. On Deposit Account having original maturity of less than
three months - 3.08 Total cash and cash equivalents (Note No. 13) 2,132.51 189.89
per our report of even date for and on behalf of the Boardfor Brahmayya & Co.,Chartered AccountantsFirm’s Registration Number: 000513S G.R.K. Prasad
Executive DirectorP. ChandramouliPartner T. Hari Babu P. Trivikrama PrasadMembership Number: 025211 Chief Financial Officer Managing Director
VSN RajuPlace: Hyderabad Company Secretary & D. AshokDate : May 27, 2017 Vice President Chairman
Cash flow statement

Notesto the financial statements for the year ended 31st March, 2017
98 45th Annual Report 2016-17
1 CORPORATE INFORMATION:
Nava Bharat Ventures Limited (“the Company”) was incorporated on November 07, 1972 under the Companies Act, 1956. The Company is listed on Bombay Stock Exchange (BSE) and National Stock Exchange (NSE). At present the Company is engaged in the business of manufacture of Ferro alloys, Sugar and generation of Power.
These Financial Statements were approved by the Board of Directors and authorised for issue on May 27, 2017.
2 BASIS OF PREPARATION:
These are the first Financial Statements prepared by the Company complying in all material respects with the notified Accounting Standards under the Companies (Indian Accounting Standards) Rules, 2015 as amended by the Companies (Indian Accounting Standards) (Amendment) Rules, 2016 and the relevant provisions of the Companies Act, 2013 and in accordance with the generally accepted accounting principles in India.
The Company has consistently applied the accounting policies used in the preparation of opening balance sheet as at April 01, 2015 throughout all periods presented in these financial statements, as if these policies had always been in effect and are covered by Ind AS 101 ‘’First-time adoption of Indian Accounting Standards’’. The transition was carried out from accounting principles generally accepted in India (‘’Previous GAAP’’) as defined in Ind AS 101. The reconciliation of effects of the transition as required by Ind AS 101 is disclosed in Note No. 57 to these financial statements.
The financial statements have been prepared on a historical cost basis, except for financial instruments which have been measured at fair value at the end of each reporting period, as explained in the accounting policies mentioned below.
3 SIGNIFICANT ACCOUNTING POlICIES:
a) Significant accounting estimates, assumptions and judgements:
The preparation of Company’s financial statements requires management to make accounting estimates, assumptions and judgements that affect the reported amounts of revenues, expenses, assets and liabilities and the accompanying disclosures of contingencies at the end of the reporting period. Uncertainty about these assumptions and estimates could result in
outcomes that require a material adjustment to the carrying amounts of assets or liabilities affected in future periods.
Estimates and assumptions:
The key assumptions concerning the future and other key sources of estimation of uncertainty at the reporting date, that have a significant risk of causing a material adjustment to the carrying amounts of assets and liabilities within the next financial years, are described below. The assumptions and estimates made by the company are based on parameters available when the financial statements were prepared. Existing circumstances and assumptions about future developments, however, may change due to market change or circumstances arising that are beyond the control of the Company. Such changes are reflected in the assumptions when they occur.
i. Impairment of non-current assets:
Impairment exists when the carrying value of an asset or cash generating unit exceeds its recoverable amount, which is the higher of its fair value less cost of disposals and its value in use. The fair value less cost of disposals is calculated based on available data from binding sales transactions, conducted at arm’s length, for similar assets or observable market prices less incremental costs for disposing of the asset. The value in use calculation is based on a Discounted Cash Flow (“DCF”) model. The value in use is sensitive to the discount rate (generally weighted average cost of capital) used for the DCF model as well as the expected future cash-inflows and the growth rate used for exploration purposes.
ii. Defined Benefit Plans:
The present value of the gratuity obligation is determined using actuarial valuation. An actuarial valuation involves making various assumptions that may differ from actual developments in the future. These include the determination of the discount rate, rate of increment in salaries and mortality rates. Due to complexities involved in the valuation and its long-term nature, a defined benefit obligation is highly sensitive to changes in these assumptions. All the assumptions are reviewed at each reporting date.
iii. Fair Value measurement of financial instruments:
When the fair values of financial assets and financial liabilities on reporting date cannot

CO
MPA
NY
OV
ERV
IEW STA
TUTO
RY R
EPOR
TS FINA
NC
IAL STA
TEMEN
TS (Stand
alon
e) NO
TICE
Notesto the financial statements for the year ended 31st March, 2017
Notes
Nava Bharat Ventures Limited 99
be measured based on quoted prices in active markets, their fair value is measured using valuation techniques i.e., the DCF model. The inputs to these models are taken from observable markets.
iv. Life Time Expected credit loss on trade receivables:
Trade Receivables do not carry any interest and are stated at their transaction value as reduced by life time expected credit losses (“LTECL”). Management has evaluated LTECL for different class of its debtors as follows:
Debtors:
ParticularsUp to 1 Year
1-2 years
2-3 years
3-4 years
4-5 years
Beyond 5 years
Expected loss Rate (%)
0.00 20.00 50.00 100.00 100.00 Write-off
v. Contingencies:
Management judgement is required for estimating the possible inflow/outflow of resources, if any, in respect of contingencies/claims/litigations against the Company/by the Company as it is not possible to predict the outcome of pending matters with accuracy.
vi. Property, Plant and Equipment
Based on evaluations done by technical assessment team, the management has adopted the useful life and residual value of its Property, Plant and Equipment. Management believes that the assigned useful lives and residual value are reasonable.
vii. Intangibles:
Internal technical or user team assess the useful lives of Intangible assets. Management believes that assigned useful lives are reasonable.
viii. Income Taxes:
Management judgment is required for the calculation of provision for income taxes and deferred tax assets/liabilities. The Company reviews at each balance sheet date the carrying amount of deferred tax assets/liabilities. The factors used in estimates may differ from actual outcome which could lead to significant adjustment to the amounts reported in the financial statements.
Judgements:
In the process of applying the Company’s accounting policies, management has made the following judgements, which have the most significant effect on the amounts recognised in the financial statements.
i. Operating lease commitments - Company as a lessee:
The Company has taken on lease certain commercial properties for its business operations and the lease rentals for the said properties are subject to escalations during the tenure of lease. However, as these escalations were in the nature of general inflation to compensate for the lessor’s expected inflationary cost increase, the company is directly charging the lease payments to the statement of profit and loss instead of following straight line method of charging lease payments.
ii. Water Drawing Rights:
The Company has obtained the water drawing rights, for its power projects, from Government authorities initially for a period of 5 - 10 years as the case may be. The management of the company believes that the water drawing rights will be extended further. Hence, the company has considered the useful life of water pipelines as 40 years to amortise the erection cost of pipeline, in line with the life of thermal power plants.
b) Current Vs Non-current classifications:
The Company presents assets and liabilities in the balance sheet based on current / non-current classification.
An asset is treated as current when it satisfies the below mentioned criteria:
i. Expected to be realised or intended to be sold or consumed in normal operating cycle;
ii. Held primarily for the purpose of trading;
iii. Expected to be realised within twelve months after the reporting period, or
iv. Cash or cash equivalent unless restricted from being exchanged or used to settle a liability for at least twelve months after the reporting period.
All other assets are classified as non-current assets.

Notesto the financial statements for the year ended 31st March, 2017
100 45th Annual Report 2016-17
A liability is classified as current when it satisfies the below mentioned criteria:
i. Expected to settle the liability in normal operating cycle;
ii. Held primarily for the purpose of trading;
iii. Due to be settled within twelve months after the reporting period, or
iv. There is no unconditional right to defer the settlement of the liability for at least twelve months after the reporting period
All other liabilities are classified as non-current.
Deferred tax assets and liabilities are classified as non-current assets and liabilities.
The operating cycle is the time between the acquisition of assets for processing and their realisation in cash and cash equivalents.
c) Property, Plant and Equipment:
Property, plant and equipment are stated at cost net of input tax credits, less accumulated depreciation and accumulated impairment losses, if any. Cost comprises the purchase price and all attributable cost, to bring the asset to its working condition for its intended use. Borrowing costs relating to acquisition of property, plant and equipment which take substantial period of time to get ready for its intended use are also included to the extent they relate to the period till such assets are ready to put to use.
The Company adopted cost model as its accounting policy, in recognition of the property, plant and equipment and recognises transaction value as the cost.
Capital work in progress includes cost of property, plant and equipment under installation/under development as at the balance sheet date.
An item of Property, Plant and Equipment is derecognised upon disposal or when no future economic benefits are expected from its use. Any gain or loss arising on derecognition of the asset (calculated as the difference between the net disposal proceeds and the carrying amount of the asset) is recognised in the Statement of Profit and Loss. Property, Plant and Equipment which are found to be not usable or retired from active use or when no further benefits are expected from their use are
removed from property, plant and equipment and the carrying amount net of scrap value, if any is charged to Statement of Profit and Loss.
The improvements/modifications carried on the lease hold land/property are recognised as lease hold improvements and are written off over the primary lease period or the life of such improvement whichever is lower.
Estimated useful life of the assets are as follows:
Type of the AssetMethod of
Depreciation
Useful life considered
(years)Building - Factory SLM 3 - 60Building - Others SLM 3 - 60Plant and Machinery SLM 3 - 40Furniture and Fixtures WDV 8 - 10Vehicles WDV 8 - 10Office Equipment WDV 5 - 15Air Conditioners and Coolers WDV 5Railway Sidings SLM 15Other Assets WDV 3 - 40
d) Investment Properties:
Property that is held for long-term rental yields or for capital appreciation or both, and that is not occupied by the Company, is classified as investment property. Investment property is measured initially at its cost, including related transaction costs and where applicable borrowing costs. Subsequent to initial recognition, investment properties are stated at cost less accumulated depreciation and accumulated impairment loss, if any.
Subsequent expenditure is capitalised to the asset’s carrying amount only when it is probable that future economic benefits associated with the expenditure will flow to the Company and the cost of the item can be measured reliably. All other repairs and maintenance costs are expensed when incurred. When part of an investment property is replaced, the carrying amount of the replaced part is derecognised.
Investment properties are depreciated using the straight-line method over their estimated useful lives. The useful life of buildings, classified as Investment properties, is considered as 60 years. The useful life has been determined based on technical evaluation performed by the management’s expert.

CO
MPA
NY
OV
ERV
IEW STA
TUTO
RY R
EPOR
TS FINA
NC
IAL STA
TEMEN
TS (Stand
alon
e) NO
TICE
Notesto the financial statements for the year ended 31st March, 2017
Notes
Nava Bharat Ventures Limited 101
Investment properties are derecognised either when they have been disposed of or when they are permanently withdrawn from use and no future economic benefit is expected from their use. The difference between the net disposal proceeds and the carrying amount of the asset is recognised in profit or loss in the period of derecognition.
e) Intangible Assets:
Computer software:
Computer software are recognised at cost and are amortised over the useful life as estimated by the Management which is about 3 years for all of the intangible computer software assets.
Water Drawing Rights:
Cost incurred towards obtaining the initial water drawing rights, for its power projects, from Government and the cost incurred by the company in erecting water pipelines to draw water from the resources which are recognised as Intangible assets are amortised over the estimated useful life of 40 years.
Intangible assets with indefinite useful lives are not amortised, but are tested for impairment annually, either individually or at the cash-generating unit level. The assessment of indefinite life is reviewed annually to determine whether the indefinite life continues to be supportable. If not, the change in useful life from indefinite to finite is made on a prospective basis.
An intangible asset is derecognized on disposal, or when no future economic benefits are expected from their use. Gains or losses arising from derecognition of an intangible asset, measured as the difference between the net disposal proceeds and the carrying amount of the asset, and are recognized in the Statement of Profit and Loss.
f) Impairment of non-financial assets:
i. The carrying amounts of assets are reviewed at each balance sheet date if there is any indication of impairment based on internal/external factors. An impairment loss is recognized wherever the carrying amount of an asset exceeds its recoverable amount. The recoverable amount is the greater of the asset’s net selling price and value in use. In assessing value in use, the estimated future cash flows are discounted to their present value at the weighted average cost of capital. After impairment, depreciation is provided on the revised carrying amount of the asset over its remaining useful life.
ii. Reversal of impairment losses recognised in prior years is recorded when there is an indication that the impairment losses recognised for the asset are no longer existing or have decreased.
g) leases:
The determination of whether an arrangement is (or contains) a lease is based on the substance of the arrangement at the inception of the lease. The arrangement is, or contains, a lease if fulfilment of the arrangement is dependent on the use of a specific asset or assets and the arrangement conveys the right to use the asset(s), even if that right is not explicitly specified in an arrangement.
Classification on inception of lease:
a. Operating lease:
Leases where the lessor effectively retains substantially all the risks and benefits of ownership of the leased item, are classified as operating leases.
b. Finance Lease:
A lease is classified as a finance lease where the lessor transfers substantially all the risks and rewards incidental to the ownership of the leased item.
Accounting of Operating leases:
a. Where the Company is the lessee:
Lease payment in case of operating leases are charged to profit and loss statement on straight line basis over the lease term. In case the escalation in operating lease payments are in line with the expected general inflation rate then the lease payments are charged to statement of profit and loss instead of straight line method.
b. Where the Company is the lessor:
Lease income is recognised in the Statement of Profit and Loss on a straight-line basis over the lease term. Assets subject to operating leases are included in fixed assets. Costs, including depreciation is recognised as an expense in the Statement of Profit and Loss.
h) Inventories:
Raw materials, stores and spares, work in progress, traded and finished goods are stated at the lower of cost and net realisable value. Costs are assigned to individual items of inventory and are determined based on weighted average method.

Notesto the financial statements for the year ended 31st March, 2017
102 45th Annual Report 2016-17
Cost of raw materials and traded goods comprises cost of purchases and includes all other costs incurred in bringing the inventories to their present location and condition. Cost of work-in-progress and finished goods comprises direct materials, direct labour and an appropriate proportion of variable and fixed overhead expenditure, the latter being allocated based on normal operating capacity.
Net realisable value is the estimated selling price in the ordinary course of business less the estimated costs of completion and the estimated costs necessary to make the sale.
Spare parts, stand-by equipment and servicing equipment are recognised in accordance with this Ind AS-16 when they meet the definition of Property, Plant and Equipment. Otherwise, such items are classified as inventory. Spare parts, stand-by equipment and servicing equipment are stated at the lower of cost or net realisable value.
i) Revenue recognition:
Revenue is measured at the fair value of consideration received or receivable and is recognized to the extent that it is probable that the economic benefits will flow to the Company. Specifically, the following basis is adopted for various sources of income:
i. Sale of goods:
Revenue is recognised when the significant risks and rewards of ownership of goods have passed to the buyer, which generally coincides with delivery. Amounts disclosed as revenue are inclusive of excise duty and net of returns, trade allowances, rebates, value added taxes. Revenue from export sales is recognised on the date of bill of lading, based on the terms of export.
ii. Sale of Thermal Power
Revenue is recognised based on Joint Meter Reading (JMR) at the contracted rates periodically. Amounts disclosed as revenue are net of rebates.
iii. Income from services:
Revenue from conversion of ferro alloy and other service income is recognised based on proportionate completion method. Proportionate completion is measured by the management on the most appropriate basis for different class of services.
iv. Guarantee Commission:
Guarantee commission is recognised as an income over the life of financial guarantee contract on a time proportion basis.
v. Interest/dividend:
Interest income is recognised on a time proportion basis taking into account the amount outstanding and the rate applicable. Dividend income is recognised when the right to receive payment is established.
vi. Export Benefits:
Export benefits in the form of Duty Drawback are recognised on accrual and Focus Product Scheme (FPS) are recognised on realisation.
vii. Other Sundry Incomes:
Insurance claims and conversion escalations are accounted for on realisation.
j) Foreign currency transactions:
i. Functional and Reporting Currency:
The Company’s functional and reporting currency is Indian National Rupee.
ii. Initial Recognition:
Foreign currency transactions are recorded in the reporting currency, by applying to the foreign currency amounts the exchange rate between the reporting currency and the foreign currency at the date of the transaction.
iii. Conversion on reporting date:
Foreign currency monetary items are reported using the closing rate. Non-monetary items that are measured in terms of historical cost in a foreign currency are translated using the exchange rates at the dates of the initial transactions.
iv. Exchange Differences:
Exchange difference arising on the settlement of monetary items or on reporting monetary items of Company at rates different from those at which they were initially recorded during the year or reported in previous financial statements are recognised as income or as expenses in the year in which they arise.

CO
MPA
NY
OV
ERV
IEW STA
TUTO
RY R
EPOR
TS FINA
NC
IAL STA
TEMEN
TS (Stand
alon
e) NO
TICE
Notesto the financial statements for the year ended 31st March, 2017
Notes
Nava Bharat Ventures Limited 103
k) Government Grants and Subsidies:
Government grants are recognised where there is reasonable assurance that the grant will be received and all attached conditions will be complied with.
Government grants relating to income are deferred and recognised in the profit or loss over the period necessary to match them with the costs that they are intended to compensate and presented within other income.
Government grants relating to the purchase of property, plant and equipment are included in non-current liabilities as deferred income and are credited to profit or loss on a straight-line basis over the expected lives of the related assets and presented within other income.
Government grants relating to loans or similar assistance with an interest rate below the current applicable market rate are initially recognised and measured at fair value. The effect of this favourable interest is regarded as a government grant and is measured as the difference between the initial carrying value of the loan and the proceeds received. The loan is subsequently measured as per the accounting policy applicable to financial liabilities.
l) Retirement and other employee benefits:
i. Employer’s contribution to Provident Fund/Employee State Insurance which is in the nature of defined contribution scheme is expensed off when the contributions to the respective funds are due. There are no other obligations other than the contribution payable to the fund.
ii. Gratuity liability is in the nature of defined benefit obligation. Such liability is provided based on independent actuarial valuation on projected unit credit method made at the end of each financial year as per the requirements of Ind AS 19 “Employee Benefits”. Actuarial gain/(loss) in the valuation are recognised as other comprehensive income for the period.
iii. Compensated absences which are in the nature of defined benefit obligation are provided for based on estimates of independent actuarial valuation on projected unit credit method made at the end of each financial year as per the requirements of Ind AS 19 “Employee Benefits”.
m) Borrowing Costs:
Borrowing costs directly attributable to the acquisition, construction or production of an asset that necessarily
takes a substantial period of time to get ready for its intended use or sale are capitalised as part of the cost of the asset. All other borrowing costs are expensed in the period in which they occur. Borrowing costs consist of interest and other costs that an entity incurs in connection with the borrowing of funds. Borrowing cost also includes exchange differences to the extent regarded as an adjustment to the borrowing costs.
n) Segment Reporting:
Operating segments are reported in a manner consistent with the internal reporting provided to the Executive Management/Chief operating decision maker (“CODM”).
The board of directors of the company has identified the Chairman as the CODM.
o) Dividends:
Annual dividend distribution to the shareholders is recognised as a liability in the period in which the dividend is approved by the shareholders. Any interim dividend paid is recognised on approval by Board of Directors. Dividend payable and corresponding tax on dividend distribution is recognised directly in equity.
p) Earnings Per Share:
Basic earnings per share are calculated by dividing the profit for the period attributable to equity shareholders by the weighted average number of equity shares outstanding during the period, net off treasury shares.
For the purpose of calculating diluted earnings per share, the profit for the period attributable to equity shareholders and the weighted average number of shares outstanding during the period are adjusted for the effects of all dilutive potential equity shares.
q) Provisions:
Provisions are recognised when there is a present legal or constructive obligation that can be estimated reliably, as a result of a past event, when it is probable that an outflow of resources embodying economic benefits will be required to settle the obligation and a reliable estimate can be made of the amount of the obligation. Provisions are not recognised for future operating losses.
Any reimbursement that the Company can be virtually certain to collect from a third party with respect to the obligation is recognised as a separate asset. However, this asset may not exceed the amount of the related provision.

Notesto the financial statements for the year ended 31st March, 2017
104 45th Annual Report 2016-17
Provisions are reviewed at each reporting date and adjusted to reflect the current best estimate. If it is no longer probable that an outflow of economic resources will be required to settle the obligation, the provisions are reversed. Where the effect of the time value of money is material, provisions are discounted using a current pre-tax rate that reflects, where appropriate, the risks specific to the liability. When discounting is used, the increase in the provisions due to the passage of time is recognised as a finance cost.
r) Contingencies:
Where it is not probable that an inflow or an outflow of economic resources will be required, or the amount cannot be estimated reliably, the asset or the obligation is not recognised in the statement of balance sheet and is disclosed as a contingent asset or contingent liability. Possible outcomes on obligations/rights, whose existence will only be confirmed by the occurrence or non-occurrence of one or more future events are also disclosed as contingent assets or contingent liabilities.
s) Taxes on Income:
Tax expense comprises of current and deferred tax. Current income tax is measured at the amount expected to be paid to the tax authorities in accordance with the respective laws of the state. Current tax includes taxes to be paid on the profit earned during the year and for the prior periods.
Deferred income taxes are provided based on the balance sheet approach considering the temporary differences between the tax bases of assets and liabilities and their carrying amounts for financial reporting purposes at the reporting date.
Deferred tax is measured based on the tax rates and the tax laws enacted or substantively enacted at the balance sheet date. Deferred tax assets are recognised only to the extent that there is reasonable certainty that sufficient future taxable income will be available against which such deferred tax assets can be realised.
The carrying amount of deferred tax assets are reviewed at each balance sheet date. The Company writes-down the carrying amount of a deferred tax asset to the extent that it is no longer probable that sufficient future taxable income will be available against which deferred tax asset can be realised. Any such write-down is reversed to the extent that it becomes reasonably certain that sufficient future taxable income will be available.
t) Prior period items:
In case prior period adjustments are material in nature the Company prepares the restated financial statement as required under Ind AS 8 - “Accounting Policies, Changes in Accounting Estimates and Errors”. Immaterial items pertaining to prior periods are shown under respective items in the Statement of Profit and Loss.
u) Cash and cash equivalents:
Cash and cash equivalents include cash on hand and at bank, deposits held at call with banks, other short-term highly liquid investments with original maturities of three months or less that are readily convertible to a known amount of cash which are subject to an insignificant risk of changes in value and are held for meeting short-term cash commitments.
For the Statement of Cash Flows, cash and cash equivalents consists of short term deposits, as defined above, net of outstanding bank overdraft as they are being considered as integral part of the Company’s cash management.
v) Treasury shares:
Own fully paid equity instruments held by the company, pursuant to order of Hon’ble High Court of Andhra Pradesh dated 30.12.1996 in the Scheme of amalgamation of Nav Chrome Limited with the company, which are vested in a Trustee for the benefit of the Company and which are to be sold and net sale proceeds are to be paid to the company are treated as treasury shares and reduced from other equity. Further these shares are not considered for dividend and voting rights.
w) Financial instruments:
A financial instrument is any contract that gives rise to a financial asset of one entity and a financial liability or equity instrument of another entity.
Financial Assets:
i. Initial recognition and measurement:
All financial assets are recognised initially at fair value plus, in the case of financial assets not recorded at fair value through profit or loss, transaction costs that are attributable to the acquisition of the financial asset. Transaction costs of financial assets carried at fair value through profit or loss are expensed in statement of profit or loss. Purchases or sales of financial assets that require delivery of assets within a time

CO
MPA
NY
OV
ERV
IEW STA
TUTO
RY R
EPOR
TS FINA
NC
IAL STA
TEMEN
TS (Stand
alon
e) NO
TICE
Notesto the financial statements for the year ended 31st March, 2017
Notes
Nava Bharat Ventures Limited 105
frame established by regulation or convention in the market place (regular way trades) are recognised on the trade date, i.e., the date that the Company commits to purchase or sell the asset.
ii. Subsequent measurement:
For subsequent measurement, financial assets are classified into following categories:
a. Debt instruments at amortised cost
b. Debt instruments at fair value through profit and loss
c. Equity instruments at fair value through profit and loss
a. Debt Instruments at amortised cost:
A ‘debt instrument’ is measured at the amortised cost if both the following conditions are met:
i. The asset is held within a business model whose objective is to hold assets for collecting contractual cash flows, and
ii. Contractual terms of the asset give rise on specified dates to cash flows that are solely payments of principal and interest (SPPI) on the principal amount outstanding.
After initial measurement, such financial assets are subsequently measured at amortised cost using the effective interest rate (EIR) method. Amortised cost is calculated by taking into account any discount or premium on acquisition and fees or costs that are an integral part of the EIR. The EIR amortisation is included in finance income in the profit or loss. The losses arising from impairment are recognised in the profit or loss.
b. Debt instruments at fair value through profit and loss (FVTPL):
As per the Ind AS 101 and Ind AS 109, the Company is permitted to designate the previously recognised financial asset at initial recognition irrevocably at fair value through profit or loss on the basis of facts
and circumstances that exists on the date of transition to Ind AS. Debt instruments included within the FVTPL category are measured at fair value with all changes recognized in the Statement of Profit and Loss.
c. Equity Instruments at fair value through profit and loss (FVTPL):
Equity instruments/Mutual funds in the scope of Ind AS 109 are measured at fair value. The classification is made on initial recognition and is irrevocable. Subsequent changes in the fair values at each reporting date are recognised in the Statement of Profit and Loss.
iii. Derecognition:
A financial asset or where applicable, a part of a financial asset is primarily derecognised when:
a. The rights to receive cash flows from the asset have expired, or
b. The Company has transferred its rights to receive cash flows from the asset or has assumed an obligation to pay the received cash flows in full without material delay to a third party under a ‘pass-through’ arrangement; and either (a) the Company has transferred substantially all the risks and rewards of the asset, or (b) the Company has neither transferred nor retained substantially all the risks and rewards of the asset, but has transferred control of the asset.
When the Company has transferred its rights to receive cash flows from an asset or has entered into a pass-through arrangement, it evaluates if and to what extent it has retained the risks and rewards of ownership. When it has neither transferred nor retained substantially all of the risks and rewards of the asset, nor transferred control of the asset, the Company continues to recognise the transferred asset to the extent of the Company’s continuing involvement.
iv. Impairment of financial assets:
In accordance with Ind AS 109, the Company applies expected credit loss (ECL) model for measurement and recognition of impairment

Notesto the financial statements for the year ended 31st March, 2017
106 45th Annual Report 2016-17
loss on the debt instruments, that are measured at amortised cost e.g., loans, debt securities, deposits, trade receivables and bank balance.
Expected credit loss is the difference between all contractual cash flows that are due to the Company in accordance with the contract and all the cash flows that the entity expects to receive.
The management uses a provision matrix to determine the impairment loss on the portfolio of trade and other receivables. Provision matrix is based on its historically observed expected credit loss rates over the expected life of the trade receivables and is adjusted for forward looking estimates.
Expected credit loss allowance or reversal recognised during the period is recognised as income or expense, as the case may be, in the statement of profit and loss. In case of balance sheet, it is shown as reduction from the specific financial asset.
Financial liabilities:
i. Initial recognition and measurement:
At initial recognition, all financial liabilities are recognised at fair value and in the case of loans, borrowings and payables, net of directly attributable transaction costs.
ii. Subsequent measurement:
a. Financial liabilities at fair value through profit or loss:
Financial liabilities at fair value through profit or loss include financial liabilities held for trading and financial liabilities designated upon initial recognition as at fair value through profit or loss. Gain or losses on liabilities held for trading are recognised in the profit or loss.
The Company doesn’t designate any financial liability at fair value through profit or loss.
b. Financial liabilities at amortised cost:
Amortised cost, in case of financial liabilities with maturity more than one year, is calculated by discounting the future cash flows with effective interest rate.
The effective interest rate amortisation is included as finance costs in the Statement of Profit and Loss.
Financial liability with maturity of less than one year is shown at transaction value.
iii. Derecognition:
A financial liability is derecognised when the obligation under the liability is discharged or cancelled or expires. The difference between the carrying amount of a financial liability that has been extinguished or transferred to another party and the consideration paid, including any non-cash assets transferred or liabilities assumed, is recognised in profit or loss as other income or finance costs.
x) Financial Guarantee Contracts:
A financial guarantee contract is a contract that requires the issuer to make specified payments to reimburse the holder for a loss it incurs because a specified debtor fails to make payment when due in accordance with original or modified terms of a debt instrument.
The Company measures any financial guarantee on initial recognition at their fair value.
Subsequently these contracts are measured at the higher of:
a. the amount of the loss allowance determined as per impairment requirements of Ind AS 109, and
b. the amount initially recognised, less where appropriate, cumulative amount of income recognised in accordance with the principles of Ind AS 18.
y) Fair Value Measurement:
The Company measures financial instruments at fair value at each balance sheet date.
Fair value is the price that would be received to sell an asset or paid to transfer a liability in an orderly transaction between market participants at the measurement date. The fair value measurement is based on the presumption that the transaction to sell the asset or transfer the liability takes place either in the principal market for such asset or liability, or in the absence of a principal market, in the most advantageous market which is accessible to the Company.
The fair value of an asset or a liability is measured using the assumptions that market participants would

CO
MPA
NY
OV
ERV
IEW STA
TUTO
RY R
EPOR
TS FINA
NC
IAL STA
TEMEN
TS (Stand
alon
e) NO
TICE
Notesto the financial statements for the year ended 31st March, 2017
Notes
Nava Bharat Ventures Limited 107
use when pricing the asset or liability, assuming that market participants act in their economic best interest.
The fair value of an asset or a liability is measured using the assumptions that market participants would use when pricing the asset or liability, assuming that market participants act in their economic best interest.
A fair value measurement of a non-financial asset takes into account a market participant’s ability to generate economic benefits by using the asset in its highest and best use or by selling it to another market participant that would use the asset in its highest and best use.
The Company uses valuation techniques that are appropriate in the circumstances and for which sufficient data are available to measure fair value, maximising the use of relevant observable inputs and minimising the use of unobservable inputs.
All assets and liabilities for which fair value is measured or disclosed in the financial statements are categorized within the fair value hierarchy, described as follows, based on the lowest level input that is significant to the fair value measurement as a whole:
a. Level 1 – Quoted (unadjusted market prices) in active markets for identical assets or liabilities.
b. Level 2 – Valuation techniques for which the lowest level input that is significant to the fair value measurements is directly or indirectly observable.
c. Level 3 – Valuation techniques for which the lowest level input that is significant to the fair value measurement is unobservable.
z) Derivatives Financial Instruments:
The Company uses derivative financial instruments such as forward exchange contracts to hedge its risk associated with foreign currency fluctuations. Such derivative financial instruments are initially recognised at contract/agreed rate on the date on which a derivative contract is entered into and are subsequently re-measured at fair value. Derivatives are carried as financial assets when the fair value is positive and as financial liabilities when the fair value is negative.
Any gains or losses arising from changes in the fair value of derivatives are taken directly to profit or loss.
za) Hedging Activities and Derivatives:
Derivatives not designated as hedging instruments:
The company uses foreign currency denominated borrowings and foreign exchange forward contracts to manage some of its transaction exposures. The foreign exchange forward contracts are not designated as cash flow hedges and are entered into for periods consistent with foreign currency exposure of the underlying transactions generally from one to six months.
A hedging relationship qualifies for hedge accounting if, and only if all the following conditions are met.
a) At the inception of the hedge there is formal designation and documentation of the hedging relationship and the entity’s risk management objective and strategy for undertaking the hedge. That documentation shall include the identification of hedging instrument, the hedged item or transaction, the nature of the risk being hedged and how the entity will assess the hedging instrument’s effectiveness in offsetting the exposure to changes in the hedged item’s fair value or cash flows attributable to the hedged risk.
b) The hedge is expected to be highly effective in achieving offsetting changes in fair values or cash flows attributable to the hedged risk, consistently with the originally documented risk management strategy for that particular hedging relationship.
c) For cash flow hedges, a forecast transaction that is the subject of the hedge must be highly probable and must present an exposure to various cash flows that could ultimately affect profit or loss.
d) The effectiveness of the hedge can be reliably measured i.e.; the fair values or the cash flows of the hedged item that are attributable to the hedged risk and the fair value of the hedging instrument can be reliably measured.
e) The hedge is assessed on an ongoing basis and determined actually to have been highly effective throughout the financial reporting periods for which the hedge was designated.
As at 31 March 2017, the company hedging instruments did not qualify for hedge accounting in accordance with the company’s policy. Hence the interest rate swap contracts are not designated in hedge relationships and are measured at fair value through profit or loss.

Notesto the financial statements for the year ended 31st March, 2017
108 45th Annual Report 2016-17
4 PR
OPE
RTY
, PlA
NT
AN
D E
QU
IPM
ENT:
FOR
TH
E Y
EAR
EN
DED
MA
RC
H 3
1, 2
017
` in
lakh
s
Sl.
No.
PART
ICU
LARS
GRO
SS B
LOC
KD
EPRE
CIA
TIO
NN
ET B
LOC
K
As
at
31.0
3.20
16A
dditi
ons
Del
etio
nsA
s at
31
.03.
2017
Up
to
31.
03.2
016
for
the
ye
ar
on
Del
etio
ns
Up
to
3
1.03
.201
7A
s at
31
.03.
2017
As
at
31.0
3.20
16
01La
nd *
2,8
49.7
7 -
-
2
,849
.77
-
-
-
-
2,8
49.7
7 2
,849
.77
02Bu
ildin
gs-
Fact
ory
** 1
3,36
0.61
9
.64
-
13,
370.
25
4,1
29.2
2 5
10.3
7 -
4
,639
.59
8,7
30.6
6 9
,231
.39
- O
ther
s 6
,421
.33
135
.17
11.
97
6,5
44.5
3 1
,093
.39
192
.12
6.2
1 1
,279
.30
5,2
65.2
3 5
,327
.94
03Pl
ant
and
Equi
pmen
t
108,
894.
09
2,1
12.6
7 2
56.8
3 1
10,7
49.9
3 4
2,73
6.63
2,
823.
50
200
.38
45,
359.
75
65,
390.
18
66,
157.
46
04Fu
rnitu
re a
nd
fixtu
res
516
.71
1.3
5 -
518
.06
456
.16
19.
17
-
475
.33
42.
73
60.
55
05Ve
hicl
es 4
67.7
3 3
7.52
7
9.76
4
25.4
9 3
92.0
3 2
2.06
7
5.78
3
38.3
1 8
7.18
7
5.70
06O
ffice
Eq
uipm
ent
750
.22
11.
38
0.7
7 7
60.8
3 6
86.7
8 2
1.31
0
.77
707
.32
53.
51
63.
44
07A
ir C
ondi
tione
rs
and
cool
ers
245
.96
4.8
5 0
.83
249
.98
225
.71
5.5
8 0
.79
230
.50
19.
48 2
0.25
08Ra
ilway
Si
ding
s 5
41.8
6 -
-
5
41.8
6 2
20.8
5 3
7.71
-
2
58.5
6 2
83.3
0 3
21.0
1
09O
ther
Ass
ets
392
.08
8.7
5 0
.72
400
.11
267
.79
23.
44
0.5
7 2
90.6
6 1
09.4
5 1
24.2
9
10Po
wer
Lin
es *
** 4
23.1
9 -
-
4
23.1
9 1
47.4
0 8
.26
-
155
.66
267
.53
275
.79
Gra
nd
To
tal
134,
863.
55
2,3
21.3
3 3
50.8
8 1
36,8
34.0
0 5
0,35
5.96
3,
663.
52
284
.50
53,
734.
98
83,
099.
02
84,
507.
59
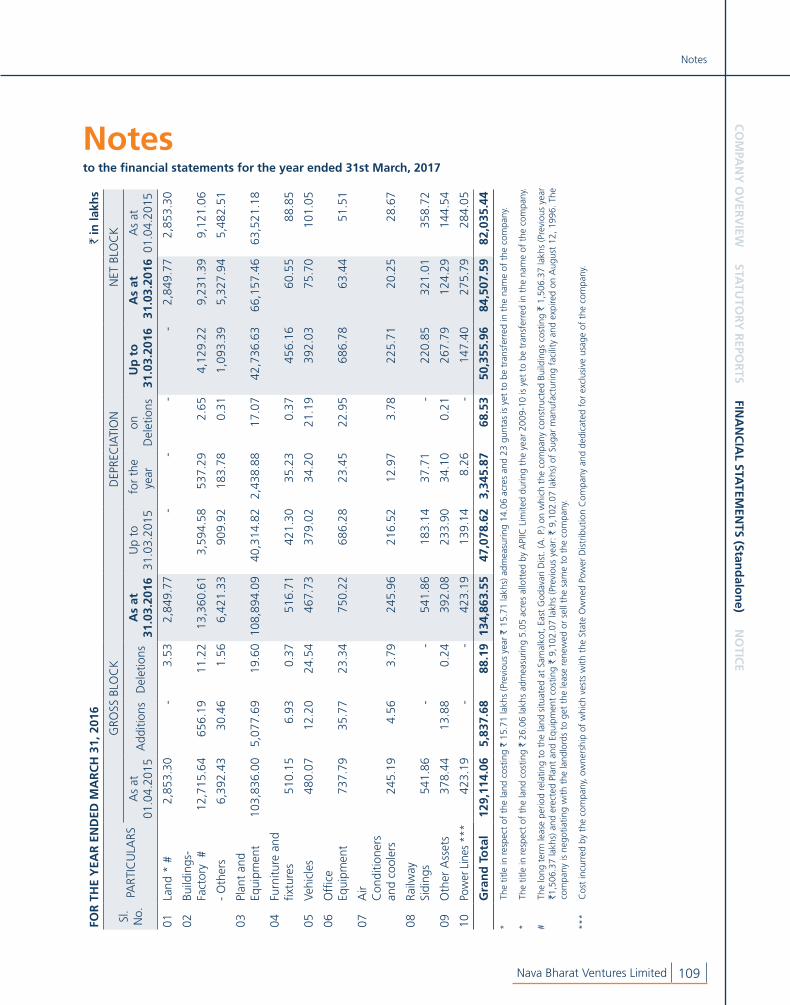
CO
MPA
NY
OV
ERV
IEW STA
TUTO
RY R
EPOR
TS FINA
NC
IAL STA
TEMEN
TS (Stand
alon
e) NO
TICE
Notesto the financial statements for the year ended 31st March, 2017
Notes
Nava Bharat Ventures Limited 109
FOR
TH
E Y
EAR
EN
DED
MA
RC
H 3
1, 2
016
` in
lakh
s
Sl.
No.
PART
ICU
LARS
GRO
SS B
LOC
KD
EPRE
CIA
TIO
NN
ET B
LOC
K
As
at
01.0
4.20
15A
dditi
ons
Del
etio
nsA
s at
31
.03.
2016
Up
to
31.0
3.20
15 f
or t
he
year
on
Del
etio
ns
Up
to
3
1.03
.201
6A
s at
3
1.03
.201
6A
s at
01
.04.
2015
01La
nd *
# 2
,853
.30
-
3.5
3 2
,849
.77
-
-
-
-
2,8
49.7
7 2
,853
.30
02Bu
ildin
gs-
Fact
ory
# 1
2,71
5.64
6
56.1
9 1
1.22
1
3,36
0.61
3
,594
.58
537
.29
2.6
5 4
,129
.22
9,2
31.3
9 9
,121
.06
- O
ther
s 6
,392
.43
30.
46 1
.56
6,4
21.3
3 9
09.9
2 1
83.7
8 0
.31
1,0
93.3
9 5
,327
.94
5,4
82.5
1
03Pl
ant
and
Equi
pmen
t
103,
836.
00
5,0
77.6
9 1
9.60
10
8,89
4.09
40,
314.
82
2,43
8.88
1
7.07
4
2,73
6.63
6
6,15
7.46
63,
521.
18
04Fu
rnitu
re a
nd
fixtu
res
510
.15
6.9
3 0
.37
516
.71
421
.30
35.
23
0.3
7 4
56.1
6 6
0.55
8
8.85
05Ve
hicl
es 4
80.0
7 1
2.20
2
4.54
4
67.7
3 3
79.0
2 3
4.20
2
1.19
3
92.0
3 7
5.70
1
01.0
5
06O
ffice
Eq
uipm
ent
737
.79
35.
77
23.
34 7
50.2
2 6
86.2
8 2
3.45
2
2.95
6
86.7
8 6
3.44
51.
51
07A
ir C
ondi
tione
rs
and
cool
ers
245
.19
4.5
6 3
.79
245
.96
216
.52
12.
97
3.7
8 2
25.7
1 2
0.25
2
8.67
08Ra
ilway
Si
ding
s 5
41.8
6 -
-
5
41.8
6 1
83.1
4 3
7.71
-
2
20.8
5 3
21.0
1 3
58.7
2
09O
ther
Ass
ets
378
.44
13.
88
0.2
4 3
92.0
8 2
33.9
0 3
4.10
0
.21
267
.79
124
.29
144
.54
10Po
wer
Lin
es *
** 4
23.1
9 -
-
4
23.1
9 1
39.1
4 8
.26
-
147
.40
275
.79
284
.05
Gra
nd
To
tal
129,
114.
06
5,8
37.6
8 8
8.19
134
,863
.55
47,
078.
62
3,34
5.87
6
8.53
50,
355.
96 8
4,50
7.59
82,
035.
44
* Th
e tit
le in
res
pect
of
the
land
cos
ting
` 15
.71
lakh
s (P
revi
ous
year
` 1
5.71
lakh
s) a
dmea
surin
g 14
.06
acre
s an
d 23
gun
tas
is y
et t
o be
tra
nsfe
rred
in t
he n
ame
of t
he c
ompa
ny.
* Th
e tit
le in
res
pect
of
the
land
cos
ting
` 26
.06
lakh
s ad
mea
surin
g 5.
05 a
cres
allo
tted
by
API
IC L
imite
d du
ring
the
year
200
9-10
is y
et t
o be
tra
nsfe
rred
in t
he n
ame
of t
he c
ompa
ny.
# Th
e lo
ng t
erm
leas
e pe
riod
rela
ting
to t
he la
nd s
ituat
ed a
t Sa
mal
kot,
Eas
t G
odav
ari D
ist.
(A. P
.) on
whi
ch t
he c
ompa
ny c
onst
ruct
ed B
uild
ings
cos
ting
` 1,
506.
37 la
khs
(Pre
viou
s ye
ar
`1,5
06.3
7 la
khs)
and
ere
cted
Pla
nt a
nd E
quip
men
t co
stin
g `
9,10
2.07
lakh
s (P
revi
ous
year
: ` 9
,102
.07
lakh
s) o
f Su
gar
man
ufac
turin
g fa
cilit
y an
d ex
pire
d on
Aug
ust
12, 1
996.
The
co
mpa
ny is
neg
otia
ting
with
the
land
lord
s to
get
the
leas
e re
new
ed o
r se
ll th
e sa
me
to t
he c
ompa
ny.
***
Cos
t in
curr
ed b
y th
e co
mpa
ny, o
wne
rshi
p of
whi
ch v
ests
with
the
Sta
te O
wne
d Po
wer
Dis
trib
utio
n C
ompa
ny a
nd d
edic
ated
for
exc
lusi
ve u
sage
of
the
com
pany
.

Notesto the financial statements for the year ended 31st March, 2017
110 45th Annual Report 2016-17
` in lakhs
S.No PARTICULARSAs at
March 31, 2017As at
March 31, 2016As at
April 01, 2015
5 INVESTMENT PROPERTY:
Land at Cost 101.91 101.91 101.91
Gross Block - Building
As at the beginning and at end of the year 173.93 173.93 173.93
Depreciation - Building
Up to beginning of the year 17.16 11.46 11.46
Charge for the year 5.70 5.70 -
up to the end of the year 22.86 17.16 11.46
Net Block - Building 151.07 156.77 162.47
Total 252.98 258.68 264.38
6 INTANGIBlE ASSETS:
FOR THE YEAR ENDED MARCH 31, 2017` in lakhs
S.No. PARTICULARS
Gross Block Amortisation Net Block
As at 31.03.2016
Additions DeletionsAs at
31.03.2017Up to
31.03.2016for the year
on Deletions
Up to 31.03.2017
As at 31.03.2017
As at 31.03.2016
01 Computer software 559.60 6.80 1.68 564.72 504.29 25.81 1.68 528.42 36.30 55.31
02 Water drawing rights 898.70 - - 898.70 489.07 12.58 - 501.65 397.05 409.63
Grand Total 1,458.30 6.80 1.68 1,463.42 993.36 38.39 1.68 1,030.07 433.35 464.94
FOR THE YEAR ENDED MARCH 31, 2016` in lakhs
S.No. PARTICULARS
Gross Block Amortisation Net Block
As at 01.04.2015
Additions DeletionsAs at
31.03.2016Up to
31.03.2015 for the
yearon
Deletions Up to
31.03.2016As at
31.03.2016As at
31.03.2015
01 Computer software 495.86 63.74 - 559.60 475.97 28.32 - 504.29 55.31 19.89
02 Water drawing rights 898.70 - - 898.70 476.49 12.58 - 489.07 409.63 422.21
Grand Total 1,394.56 63.74 - 1,458.30 952.46 40.90 - 993.36 464.94 442.10
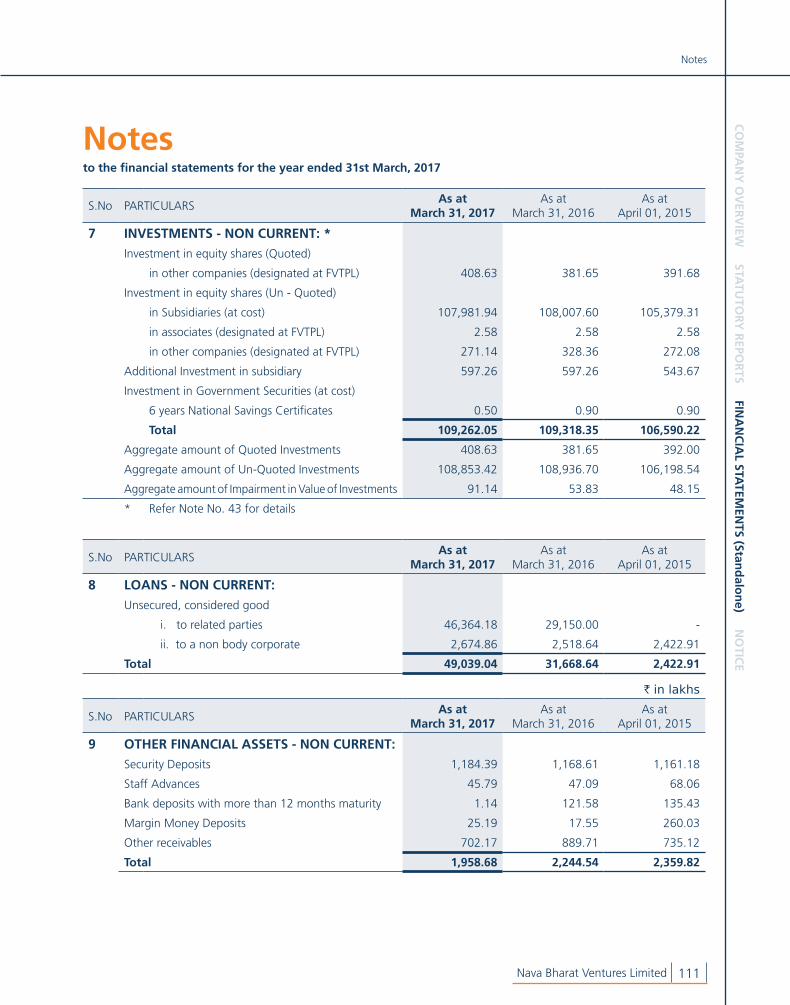
CO
MPA
NY
OV
ERV
IEW STA
TUTO
RY R
EPOR
TS FINA
NC
IAL STA
TEMEN
TS (Stand
alon
e) NO
TICE
Notesto the financial statements for the year ended 31st March, 2017
Notes
Nava Bharat Ventures Limited 111
S.No PARTICULARSAs at
March 31, 2017As at
March 31, 2016As at
April 01, 2015
7 INVESTMENTS - NON CURRENT: *
Investment in equity shares (Quoted)
in other companies (designated at FVTPL) 408.63 381.65 391.68
Investment in equity shares (Un - Quoted)
in Subsidiaries (at cost) 107,981.94 108,007.60 105,379.31
in associates (designated at FVTPL) 2.58 2.58 2.58
in other companies (designated at FVTPL) 271.14 328.36 272.08
Additional Investment in subsidiary 597.26 597.26 543.67
Investment in Government Securities (at cost)
6 years National Savings Certificates 0.50 0.90 0.90
Total 109,262.05 109,318.35 106,590.22
Aggregate amount of Quoted Investments 408.63 381.65 392.00
Aggregate amount of Un-Quoted Investments 108,853.42 108,936.70 106,198.54
Aggregate amount of Impairment in Value of Investments 91.14 53.83 48.15
* Refer Note No. 43 for details
S.No PARTICULARSAs at
March 31, 2017As at
March 31, 2016As at
April 01, 2015
8 lOANS - NON CURRENT:
Unsecured, considered good
i. to related parties 46,364.18 29,150.00 -
ii. to a non body corporate 2,674.86 2,518.64 2,422.91
Total 49,039.04 31,668.64 2,422.91
` in lakhs
S.No PARTICULARSAs at
March 31, 2017As at
March 31, 2016As at
April 01, 2015
9 OTHER FINANCIAl ASSETS - NON CURRENT:
Security Deposits 1,184.39 1,168.61 1,161.18
Staff Advances 45.79 47.09 68.06
Bank deposits with more than 12 months maturity 1.14 121.58 135.43
Margin Money Deposits 25.19 17.55 260.03
Other receivables 702.17 889.71 735.12
Total 1,958.68 2,244.54 2,359.82

Notesto the financial statements for the year ended 31st March, 2017
112 45th Annual Report 2016-17
` in lakhs
S.No PARTICULARSAs at
March 31, 2017As at
March 31, 2016As at
April 01, 2015
10 OTHER NON CURRENT ASSETS:Capital Advances 14.01 12.53 56.03
Advance for purchases and expenses - - 11.81
Payments made under protest 265.51 118.74 115.58
Prepaid lease rentals 10.52 147.13 150.73
Prepaid expenses - 1.91 12.89
MAT Credit Entitlement 21,436.21 21,436.21 19,406.21
Interest accrued but not due 1,313.41 1,054.27 795.13
Total 23,039.66 22,770.79 20,548.38
` in lakhs
S.No PARTICULARSAs at
March 31, 2017As at
March 31, 2016As at
April 01, 2015
11 INVENTORIES:At Cost:
Raw Materials 7,529.69 7,395.80 12,578.17
Raw Materials (In-transit) 982.94 200.12 1,588.26
Work in Progress 631.96 950.06 390.83
Finished Goods 11,650.57 8,601.03 2,318.72
Stock-in-trade 54.65 73.75 49.57
Stores and Spares 2,085.96 3,045.87 5,865.51
Stores and Spares (In-transit) 9.89 - -
Others 0.88 10.86 5.04
At Realisable Value:
Work in Progress - 308.34 22.95
Finished Goods 388.45 973.74 11,564.71
Total 23,334.99 21,559.57 34,383.76
` in lakhs
S.No PARTICULARSAs at
March 31, 2017As at
March 31, 2016As at
April 01, 2015
12 TRADE RECEIVABlES:Unsecured, considered good # 9,794.46 17,090.17 22,013.27
Expected Credit Loss on above - - -
Total 9,794.46 17,090.17 22,013.27
# Includes dues from related parties of 1,121.71 7,045.51 11,300.43

CO
MPA
NY
OV
ERV
IEW STA
TUTO
RY R
EPOR
TS FINA
NC
IAL STA
TEMEN
TS (Stand
alon
e) NO
TICE
Notesto the financial statements for the year ended 31st March, 2017
Notes
Nava Bharat Ventures Limited 113
` in lakhs
S.No PARTICULARSAs at
March 31, 2017As at
March 31, 2016As at
April 01, 2015
13 CASH AND CASH EQUIVAlENTS:
Balances with Banks
- on Current Accounts 2,120.32 180.74 2,243.29
- on Deposits Accounts - 3.08 51.66
- Bank deposits with original maturity period of less than 3 months - - 100.00
Cash on Hand 12.19 6.07 6.08
Total 2,132.51 189.89 2,401.03
` in lakhs
S.No PARTICULARSAs at
March 31, 2017As at
March 31, 2016As at
April 01, 2015
14 OTHER BANK BAlANCES - CURRENT:
Bank deposits with a maturity period of less than 12 months 110.24 74.46 63.16
Total 110.24 74.46 63.16
` in lakhs
S.No PARTICULARSAs at
March 31, 2017As at
March 31, 2016As at
April 01, 2015
15 lOANS - CURRENT:
Unsecured, considered good
i. to related parties - 21,688.33 3,749.70
ii. to others - - 1.40
Total - 21,688.33 3,751.10
` in lakhs
S.No PARTICULARSAs at
March 31, 2017As at
March 31, 2016As at
April 01, 2015
16 OTHER FINANCIAl ASSETS - CURRENT:
Restricted Bank Balances
i. Margin money deposits 1,360.05 1,496.08 651.30
ii. Unpaid dividend accounts 198.76 207.45 200.70
Staff Advances 30.81 65.81 76.23
Forward Contract Asset 1,945.35 - -
Other Receivables 4,292.04 6,232.02 3,643.74
Total 7,827.01 8,001.36 4,571.97

Notesto the financial statements for the year ended 31st March, 2017
114 45th Annual Report 2016-17
` in lakhs
S.No PARTICULARSAs at
March 31, 2017As at
March 31, 2016As at
April 01, 2015
17 OTHER CURRENT ASSETS:
Advance for Purchases and Expenses 4,730.72 3,327.19 6,178.26
Balance with Statutory Authorities 4,550.41 2,848.49 3,733.35
Prepaid Expenses 381.74 182.02 250.18
Accrued Conversion Charges 532.06 138.77 -
Interest Accrued 58.03 589.52 48.62
Prepaid lease rentals 4.01 5.66 4.26
Total 10,256.97 7,091.65 10,214.67
` in lakhs
S.No PARTICULARSAs at
March 31, 2017As at
March 31, 2016As at
April 01, 2015
18 EQUITY SHARE CAPITAl:
a. Authorised Share Capital
250,000,000 Equity Shares of ` 2/- each 5,000.00 5,000.00 5,000.00
b. Issued, Subscribed:
178,826,957 ( Previous year 89,539,216) Equity Shares of ` 2/- each 3,576.54 1,790.78 1,790.78
c. Paid up: (fully paid)
178,575,482 ( Previous year 89,289,741) Equity Shares of ` 2/- each 3,571.51 1,785.75 1,785.75
Add: Forfeited shares (amount originally paid up) 1.26 1.26 1.26
Total 3,572.77 1,787.01 1,787.01
d. Reconciliation of the shares outstanding at the beginning and at the end of respective year:
In no. of Shares
At the Beginning of the year 892.88 892.88 892.88
Bonus Issue during the year 892.88 - -
At the end of the year 1,785.76 892.88 892.88
In value of Shares - `
At the Beginning of the year 1,785.76 1,785.76 1,785.76
Bonus Issue during the year 1,785.76 - -
At the end of the year 3,571.52 1,785.76 1,785.76

CO
MPA
NY
OV
ERV
IEW STA
TUTO
RY R
EPOR
TS FINA
NC
IAL STA
TEMEN
TS (Stand
alon
e) NO
TICE
Notesto the financial statements for the year ended 31st March, 2017
Notes
Nava Bharat Ventures Limited 115
S.No PARTICULARSAs at
March 31, 2017As at
March 31, 2016As at
April 01, 2015
e. Rights attached to the Equity Shares
The company has only one class of equity shares having a face value of ` 2/- per share with one vote per each share. The company declares and pays dividends in Indian rupees. The dividend proposed by the Board of Directors is subject to the approval of the shareholders in the ensuing Annual General Meeting.
In the event of liquidation of the Company, the holders of equity shares will be entitled to receive remaining assets of the company, after distribution of all preferential amounts. The distribution will be in proportion to the number of equity shares held by the shareholders.
f. Details of Shareholders holding more than 5% shares in the company
Equity Shares of ` 2/- each fully paid:
M/s Wellington Management Company, LLP with its PACs - In Nos. 15,630,053 9,490,483 9,986,619
- In % 8.75 10.64 11.18
HC Mauritius Limited (formerly Highfields Capital Management LP A/c. HC Mauritius Limited - In Nos. - 8,482,989 8,482,989
- In % - 9.50 9.50
NAV Developers Limited - In Nos. 15,840,362 7,920,181 7,817,845
- In % 8.87 8.87 8.76
Smt D Bhaktapriya - In Nos. 9,802,900 4,901,450 2,020,545
- In % 5.49 5.49 2.26
g. During the year the company has allotted 89,287,741 of equity shares of ` 2/- each fully paid up by way of bonus shares.
h. The paid up share capital includes 9,947,020 (previous year 4,973,510) equity shares of ` 2/- each fully paid up, owned by the company, pursuant to order of Hon'ble High Court of Andhra Pradesh dated 30.12.1996 in the Scheme of amalgamation of Nav Chrome Limited with the company, which are vested in a Trustee for the benefit of the Company which are to be sold and net sale proceeds are to be paid to the company and such shares are not considered for dividend and treated as treasury shares and reduced from other equity.

Notesto the financial statements for the year ended 31st March, 2017
116 45th Annual Report 2016-17
` in lakhs
S.No PARTICULARSAs at
March 31, 2017As at
March 31, 2016As at
April 01, 2015
19 OTHER EQUITY:
Capital Reserve:
At the beginning and at the end of the year 60.20 60.20 60.20
Capital Redemption Reserve:
At the beginning and at the end of the year 826.39 826.39 826.39
Securities Premium Reserve:
At the beginning and at the end of the year 26,214.22 26,214.22 26,214.22
Treasury Shares (206.34) (206.34) (206.34)
General Reserve:
At the beginning of the year 89,352.40 87,852.40 87,852.40
Add: Addition for the year - 1,500.00 -
Less: Bonus issue of equity shares (1,785.75) - -
At the end of the year 87,566.65 89,352.40 87,852.40
Other Reserves:
Subsidies:
At the beginning and at the end of the year 33.60 33.60 33.60
Surplus in Statement of Profit and Loss
At the beginning of the year 147,039.41 141,857.56 136,691.46
Adjustment due to adoption of Ind AS - - 5,166.10
Profit for the year 8,297.51 11,755.78 -
Excess provision of Dividend written back -
At the end of the year 155,336.92 153,613.34 141,857.56
Appropriations:
General Reserve - (1,500.00) -
Dividend on Equity Capital (2,529.43) (4,215.71) -
Corporate Dividend Tax (514.93) (858.22) -
At the end of the year 152,292.56 147,039.41 141,857.56
Other Comprehensive Income
On Actuarial Gain / (loss) on post employment benefits
At the beginning of the year 34.50 - -
for the year 140.58 34.50 -
At the end of the year 175.08 34.50 -
Total 266,962.36 263,354.38 256,638.03

CO
MPA
NY
OV
ERV
IEW STA
TUTO
RY R
EPOR
TS FINA
NC
IAL STA
TEMEN
TS (Stand
alon
e) NO
TICE
Notesto the financial statements for the year ended 31st March, 2017
Notes
Nava Bharat Ventures Limited 117
` in lakhs
S.No PARTICULARSAs at
March 31, 2017As at
March 31, 2016As at
April 01, 2015
20 BORROWINGS - NON CURRENT:
Term loans - Secured *
from banks
State Bank of India - I ** 14,524.67 23,492.44 1,733.17
State Bank of India - II *** 490.50 904.13 1,084.98
Total 15,015.17 24,396.57 2,818.15
* The loans are secured by first charge by way of equitable mortgage by deposit of title deeds to cover all immovable properties of the company and hypothecation of all movable properties including movable plant and machinery, spares, tools and accessories, both present and future and a second charge by way of hypothecation of all movable properties both present and futures (except book debts) subject to prior charges created/to be created in favour of Company's Bankers on its stocks of raw materials, semi finished and finished goods, consumable stores for securing borrowings for working capital requirements. The mortgage/charge created above shall rank paripassu with the charges created/to be created in favour of other financial institutions/banks.
** Loan from State Bank of India is secured by pledge of 104,600,000 shares of USD 1/- each (being 51% of the shares) held by the company in its subsidiary, M/s Nava Bharat (Singapore) Pte Limited. The loan is repayable in 26 quarterly installments of ̀ 1,904.00 lakhs commencing from April 01, 2014. During the year company entered into a swap contract and converted the loan into FCNR Borrowing for a period of 6 months. After the expiry of the swap contract the loan will be re-converted into a rupee term loan.
*** The loan is repayable in monthly installments of ` 30.14 lakhs commencing from December 01, 2016.
` in lakhs
S.No PARTICULARSAs at
March 31, 2017As at
March 31, 2016As at
April 01, 2015
21 OTHER FINANCIAl lIABIlITIES - NON CURRENT
Security Deposits
Employee Retention deposits 4.32 9.40 15.73
Rental deposits 33.40 33.52 29.92
Total 37.72 42.92 45.65
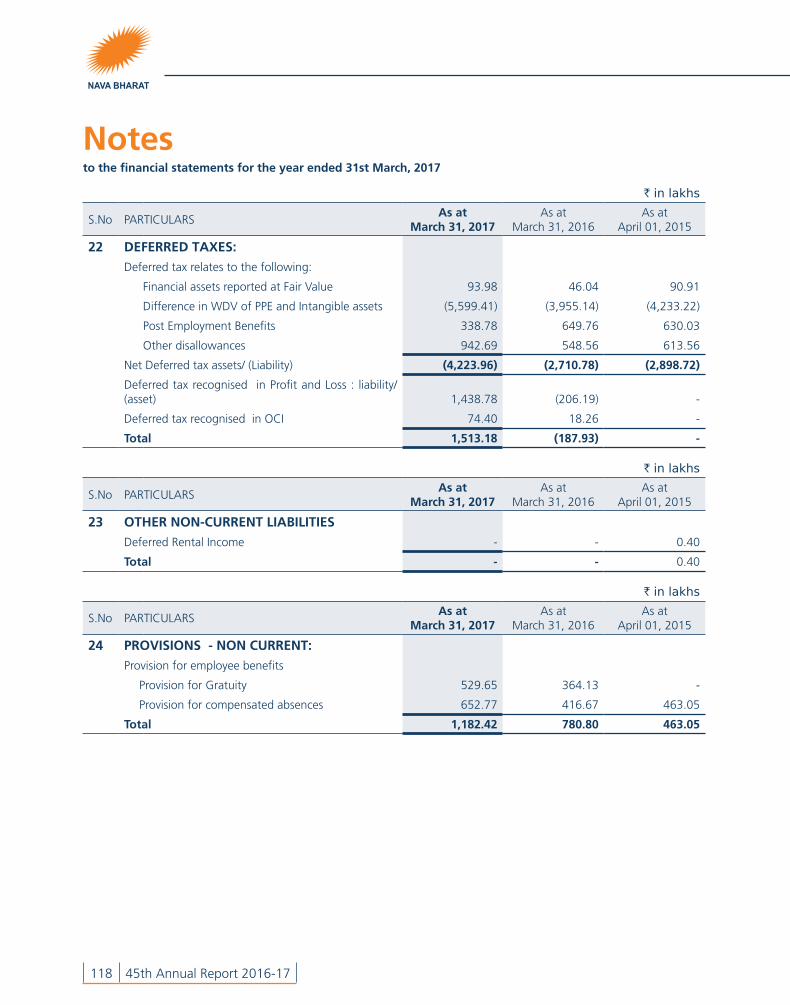
Notesto the financial statements for the year ended 31st March, 2017
118 45th Annual Report 2016-17
` in lakhs
S.No PARTICULARSAs at
March 31, 2017As at
March 31, 2016As at
April 01, 2015
22 DEFERRED TAXES:
Deferred tax relates to the following:
Financial assets reported at Fair Value 93.98 46.04 90.91
Difference in WDV of PPE and Intangible assets (5,599.41) (3,955.14) (4,233.22)
Post Employment Benefits 338.78 649.76 630.03
Other disallowances 942.69 548.56 613.56
Net Deferred tax assets/ (Liability) (4,223.96) (2,710.78) (2,898.72)
Deferred tax recognised in Profit and Loss : liability/(asset) 1,438.78 (206.19) -
Deferred tax recognised in OCI 74.40 18.26 -
Total 1,513.18 (187.93) -
` in lakhs
S.No PARTICULARSAs at
March 31, 2017As at
March 31, 2016As at
April 01, 2015
23 OTHER NON-CURRENT lIABIlITIES
Deferred Rental Income - - 0.40
Total - - 0.40
` in lakhs
S.No PARTICULARSAs at
March 31, 2017As at
March 31, 2016As at
April 01, 2015
24 PROVISIONS - NON CURRENT:
Provision for employee benefits
Provision for Gratuity 529.65 364.13 -
Provision for compensated absences 652.77 416.67 463.05
Total 1,182.42 780.80 463.05

CO
MPA
NY
OV
ERV
IEW STA
TUTO
RY R
EPOR
TS FINA
NC
IAL STA
TEMEN
TS (Stand
alon
e) NO
TICE
Notesto the financial statements for the year ended 31st March, 2017
Notes
Nava Bharat Ventures Limited 119
` in lakhs
S.No PARTICULARSAs at
March 31, 2017As at
March 31, 2016As at
April 01, 2015
25 BORROWINGS - CURRENT:
Working Capital Loans: *
from banks
Cash Credit ** 3,192.18 4,127.44 3,316.65
Buyers Credit *** 3,118.36 2,330.96 -
Unsecured
Inter Corporate Deposit - 5,022.74 3,000.00
Total 6,310.54 11,481.14 6,316.65
* Working capital loans from banks are secured by hypothecation of raw materials, work-in-progress, finished goods, stores and spares and book debts to the extent of ` 22,000 lakhs and a second charge on fixed assets of the company.
** Carries the interest at a rate of 9.25% p.a. and repayable on demand.
*** Carry interest at a rate of 1.75%, 1.83% and 1.70% and are repayable ` 1,040.94 lakhs, ` 1,412.90 lakhs and ` 664.53 lakhs along with the interest on June 03, 2017, July 07, 2017 and July 21, 2017 respectively.
` in lakhs
S.No PARTICULARSAs at
March 31, 2017As at
March 31, 2016As at
April 01, 2015
26 TRADE PAYABlES - CURRENT:
For Supplies and Services
(i) Related Parties - - -
(ii) Others 7,138.29 8,559.31 6,048.92
Total 7,138.29 8,559.31 6,048.92
Disclosure of Sundry Creditors under Trade Payables is based on the information available with the Company regarding the status of the suppliers as defined under the “Micro, Small and Medium Enterprises Development Act, 2006” and relied upon by the Auditors. The details of total outstanding dues to Micro and Small Enterprises as per Micro, Small and Medium Enterprise Development Act, 2006 are as follows:
Particulars 31.03.2017 31.03.2016 01.04.2015
The principal amount and the interest due thereon (to be shown separately) remaining unpaid to any supplier as at the end of each accounting year 546.43 653.42 908.62
The amount of interest paid by the buyer in terms of Section 16, of the Micro, Small and Medium Enterprise Development Act, 2006 along with the amounts of the payment made to the supplier beyond the appointed day each accounting year. - - -

Notesto the financial statements for the year ended 31st March, 2017
120 45th Annual Report 2016-17
The amount of interest due and payable for the period of delay in making payment (which have been paid but beyond the appointed day during the year) but without adding the interest specified under Micro, Small and Medium Enterprise Development Act, 2006. - - -
The amount of interest accrued and remaining unpaid at the end of each accounting year; and - - -
The amount of further interest remaining due and payable even in the succeeding years, until such date when the interest dues as above are actually paid to the small enterprise for the purpose of disallowance as a deductible expenditure under Section 23 of the Micro, Small and Medium Enterprise Development Act, 2006. - - -
` in lakhs
S.No PARTICULARSAs at
March 31, 2017As at
March 31, 2016As at
April 01, 2015
27 OTHER FINANCIAl lIABIlITIES - CURRENT:
Current maturities of long term borrowings
State Bank of India - I 7,616.00 7,616.00 7,616.00
State Bank of India - II 361.68 180.84 -
Salaries and Wages payable
(i) Directors 597.33 442.78 605.25
(ii) Others 904.30 873.48 900.77
Security Deposits
(i) Employee Retention deposits 14.25 17.89 11.55
(ii) Others 440.48 372.29 365.58
Bills discounted with banks - - 2,162.44
Forward Contract Liability 2,020.81 - -
Swap contract liability 1,266.73 - -
Other Payables 1,440.67 555.87 489.96
Total 14,662.25 10,059.15 12,151.55

CO
MPA
NY
OV
ERV
IEW STA
TUTO
RY R
EPOR
TS FINA
NC
IAL STA
TEMEN
TS (Stand
alon
e) NO
TICE
Notesto the financial statements for the year ended 31st March, 2017
Notes
Nava Bharat Ventures Limited 121
` in lakhs
S.No PARTICULARSAs at
March 31, 2017As at
March 31, 2016As at
April 01, 2015
28 OTHER CURRENT lIABIlITIES:
Advance from Customers 22.37 73.63 -
Unpaid Dividends 198.76 207.45 200.70
Deferred Rental Income - 0.40 2.43
Financial Guarantee Liability - 1,254.49 967.23
Statutory Liabilities
- Central Excise Duty 811.51 560.70 991.71
- Withholding Taxes 74.61 135.33 81.34
- Sales Tax 32.18 49.65 47.12
- Contribution to Provident Fund 65.20 74.96 70.95
- Other Statutory Dues 677.50 824.60 514.89
- Interest accrued but not due on borrowings 252.17 250.14 238.49
Total 2,134.30 3,431.35 3,114.86
` in lakhs
S.No PARTICULARSAs at
March 31, 2017As at
March 31, 2016As at
April 01, 2015
29 PROVISIONS - CURRENT:
Provision for employee benefits
Provision for Gratuity 449.26 614.78 984.21
Provision for compensated absences 247.57 481.91 341.45
Total 696.83 1,096.69 1,325.66

Notesto the financial statements for the year ended 31st March, 2017
122 45th Annual Report 2016-17
` in lakhs
S.No PARTICULARSAs at
March 31, 2017As at
March 31, 2016As at
April 01, 2015
30 CONTINGENT lIABIlITIES AND COMMITMENTS:
i) Contingent Liabilities
a) Claims against the Company not acknowledged as debts 12,580.36 3,565.67 2,863.22
b) Guarantees 68,982.29 80,688.39 62,415.92
c) Other money for which the Company is contingently liable:
i) Demand from Income Tax department disputed 1,622.52 1,216.64 926.63
ii) Showcause notices from Central Excise Dept. 1,127.98 1,244.87 1,313.80
iii) Others 198.81 198.81 198.81
d) As per the "Renewal Power Purchase Obligation (Compliance by Purchase of Renewal Energy/Renewable Energy Certificates) Regulations 2012"of APERC, the Company is under obligation for the year to comply with the said regulations. However as the company contested the applicability of regulations to the Company in the Hon'ble High Court of Andhra Pradesh., compliance cost is not provided to the extent of 683.75 1,040.13 849.69
ii) Commitments
Estimated amount of Contracts remaining to be executed on Capital account and not provided for 163.69 331.75 124.55
Total 85,359.40 88,286.26 68,692.62

CO
MPA
NY
OV
ERV
IEW STA
TUTO
RY R
EPOR
TS FINA
NC
IAL STA
TEMEN
TS (Stand
alon
e) NO
TICE
Notesto the financial statements for the year ended 31st March, 2017
Notes
Nava Bharat Ventures Limited 123
` in lakhs
S.No PARTICULARSFor the year ended
March 31, 2017For the year ended
March 31, 2016
31 REVENUE FROM OPERATIONS:
A. Sale of Products
Finished Goods
Ferro Alloys 42,267.63 38,591.55
Sugar 13,887.86 11,555.40
Electric Power 48,883.67 60,198.87
Less: Prompt payment rebate (194.57) (471.77)
Others 1,863.47 2,145.03
106,708.06 112,019.08
Less: Inter Divisional transfers 31,310.23 21,361.54
75,397.83 90,657.54
Traded Goods
Fertilizers 220.68 200.04
PVC Pipes 14.23 10.06
Others 130.71 108.70
B. Sale of Services
Ferro Alloys Conversion Charges 19,034.58 9,514.18
Operation and Management Services/Project Services 1,865.50 1,319.26
C. Other Operating Revenue
Export Incentives 854.80 824.03
Power off take compensation 415.65 -
Total 97,933.98 102,633.81

Notesto the financial statements for the year ended 31st March, 2017
124 45th Annual Report 2016-17
` in lakhs
S.No PARTICULARSFor the year ended
March 31, 2017For the year ended
March 31, 2016
32 OTHER INCOME:
Interest Income
on bank deposits 122.59 247.54
on investments 0.07 0.09
on other financial assets 187.46 150.82
others 3,010.41 1,718.46
Income from Investments by
Change in fair value (30.24) 51.93
Gain on sale of investments 22.22 37.80
Dividend income 14.53 29.03
Other Non-operating Income (net of expenses)
Rental income from investment property 79.85 76.70
Gain on Foreign Exchange Fluctuations (Net) 130.55 988.59
Deferred Rental Income 4.29 2.43
Government grants 114.77 127.21
Guarantee Commission 1,640.82 1,395.72
Interest income of Employee Loans 11.27 16.33
Income on employee retention deposits 1.44 1.82
Gain on Sale of Property, Plant and Equipment (Net) 35.98 2.62
Excess provisions/credit balances written back 76.34 266.01
Miscellaneous Income 1,036.60 1,127.57
Total 6,458.95 6,240.67
` in lakhs
S.No PARTICULARSFor the year ended
March 31, 2017For the year ended
March 31, 2016
33 COST OF MATERIAlS CONSUMED:
Inventory at the beginning of the year 7,395.80 12,578.17
Add: Purchase of materials 55,952.49 53,046.89
63,348.29 65,625.06
Less: Cost of material sold 213.67 -
Less: Inventory at the end of year 7,529.69 7,395.80
55,604.93 58,229.26
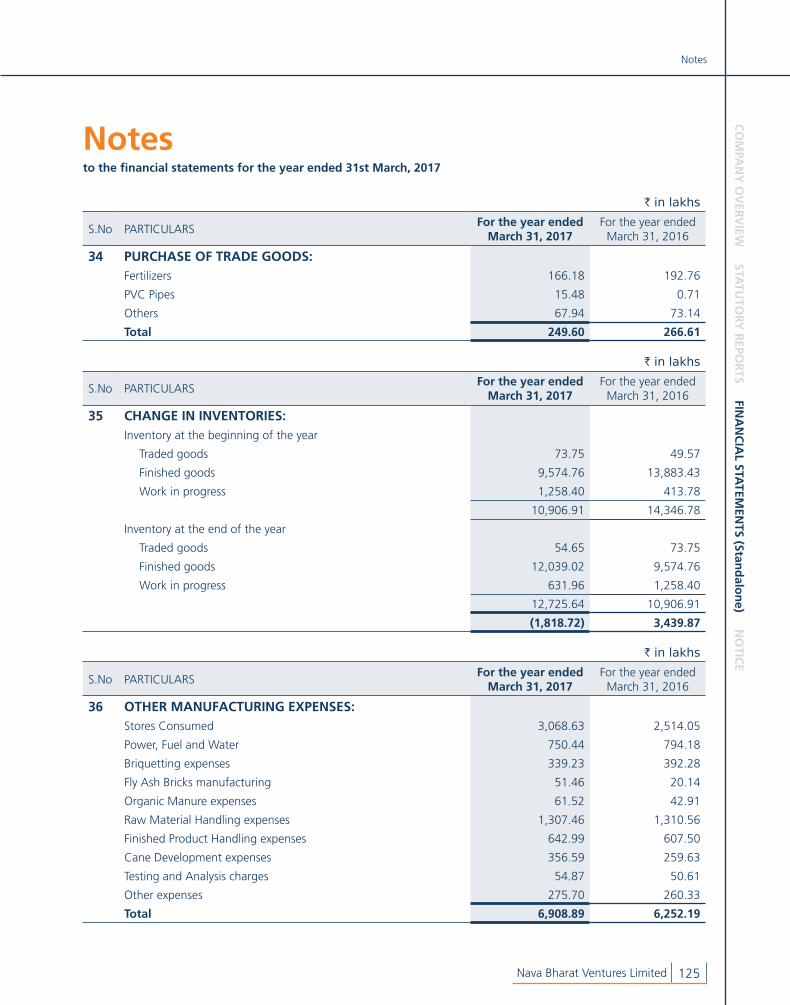
CO
MPA
NY
OV
ERV
IEW STA
TUTO
RY R
EPOR
TS FINA
NC
IAL STA
TEMEN
TS (Stand
alon
e) NO
TICE
Notesto the financial statements for the year ended 31st March, 2017
Notes
Nava Bharat Ventures Limited 125
` in lakhs
S.No PARTICULARSFor the year ended
March 31, 2017For the year ended
March 31, 2016
34 PURCHASE OF TRADE GOODS:Fertilizers 166.18 192.76
PVC Pipes 15.48 0.71
Others 67.94 73.14
Total 249.60 266.61
` in lakhs
S.No PARTICULARSFor the year ended
March 31, 2017For the year ended
March 31, 2016
35 CHANGE IN INVENTORIES:Inventory at the beginning of the year
Traded goods 73.75 49.57
Finished goods 9,574.76 13,883.43
Work in progress 1,258.40 413.78
10,906.91 14,346.78
Inventory at the end of the year
Traded goods 54.65 73.75
Finished goods 12,039.02 9,574.76
Work in progress 631.96 1,258.40
12,725.64 10,906.91
(1,818.72) 3,439.87
` in lakhs
S.No PARTICULARSFor the year ended
March 31, 2017For the year ended
March 31, 2016
36 OTHER MANUFACTURING EXPENSES:Stores Consumed 3,068.63 2,514.05
Power, Fuel and Water 750.44 794.18
Briquetting expenses 339.23 392.28
Fly Ash Bricks manufacturing 51.46 20.14
Organic Manure expenses 61.52 42.91
Raw Material Handling expenses 1,307.46 1,310.56
Finished Product Handling expenses 642.99 607.50
Cane Development expenses 356.59 259.63
Testing and Analysis charges 54.87 50.61
Other expenses 275.70 260.33
Total 6,908.89 6,252.19

Notesto the financial statements for the year ended 31st March, 2017
126 45th Annual Report 2016-17
` in lakhs
S.No PARTICULARSFor the year ended
March 31, 2017For the year ended
March 31, 2016
37 EMPlOYEE BENEFITS EXPENSE:
Salaries, Wages and Bonus 6,607.47 6,651.46
Contribution to Provident and Other Funds 376.31 390.24
Staff Welfare Expenses 452.05 449.83
Interest on employee retention deposits 2.88 2.73
Discount on employee trust loan 27.77 52.62
Discount on employee loans 3.29 3.63
Gratuity 758.96 341.65
Total 8,228.73 7,892.16
` in lakhs
S.No PARTICULARSFor the year ended
March 31, 2017For the year ended
March 31, 2016
38 FINANCE COSTS
Interest 3,021.23 2,698.89
Interest Cost - Security Deposits 3.64 3.59
Sugar Term Loan - Finance Cost 117.46 126.59
Bank charges and commission 524.36 343.30
Forward contracts and SWAP loss 1,342.19 -
5,008.88 3,172.37
` in lakhs
S.No PARTICULARSFor the year ended
March 31, 2017For the year ended
March 31, 2016
39 DEPRECIATION AND AMORTISATION EXPENSE:
Depreciation on Property ,Plant and Equipment 3,663.52 3,345.87
Amortisation of Intangible Assets 38.39 40.90
Depreciation on Investment Property 5.70 5.70
Total 3,707.61 3,392.47

CO
MPA
NY
OV
ERV
IEW STA
TUTO
RY R
EPOR
TS FINA
NC
IAL STA
TEMEN
TS (Stand
alon
e) NO
TICE
Notesto the financial statements for the year ended 31st March, 2017
Notes
Nava Bharat Ventures Limited 127
` in lakhs
S.No PARTICULARSFor the year ended
March 31, 2017For the year ended
March 31, 2016
40 OTHER EXPENSES:
Excise duty 3,641.66 2,758.08
Rent 45.15 68.05
Amortisation of deferred rental expenditure 4.06 5.01
Repairs and maintenance
Machinery 1,957.18 2,741.35
Buildings 461.47 572.81
Other Assets 62.74 69.77
Rates and Taxes 2,054.57 2,239.99
Freight and Transportation 1,231.39 1,622.47
Insurance 307.53 327.01
Advertisement and sales promotion 9.92 20.21
Communications 67.80 72.60
Travelling and Conveyance 193.83 202.61
Vehicle Maintenance 57.39 61.74
Legal and Professional Charges 594.09 572.51
Payments to Auditors
as auditors 32.20 32.06
for tax audit 11.55 11.45
for other matters 36.88 14.45
for expenses 0.25 0.25
Cost Auditors fee 7.51 7.13
CSR expenses 320.65 435.03
Assets discarded 98.12 7.95
General expenses 2,361.92 2,134.39
Investments written off 27.00 -
Prior period adjustments 403.65 33.04
Total 13,988.51 14,009.96

Notesto the financial statements for the year ended 31st March, 2017
128 45th Annual Report 2016-17
` in lakhs
S.No PARTICULARSFor the year ended
March 31, 2017For the year ended
March 31, 2016
41 OTHER COMPREHENSIVE INCOME:
Actuarial Gain/(Loss) on post employment benefit expenses 218.36 67.50
Return on plan assets excluding net interest (3.37) (14.74)
Deferred Taxes on above (74.41) (18.26)
Total 140.58 34.50
` in lakhs
S.No PARTICULARSFor the year ended
March 31, 2017For the year ended
March 31, 2016
42 EARNINGS PER EQUITY SHARE:
Profit or loss for the year 8,297.51 11,755.78
Weighted average number of equity shares of ` 2/- each (for Basic & Diluted) 178,575,482 178,575,482
Earnings per share of par value ` 2/- per share -(Basic & diluted) 4.65 6.58

CO
MPA
NY
OV
ERV
IEW STA
TUTO
RY R
EPOR
TS FINA
NC
IAL STA
TEMEN
TS (Stand
alon
e) NO
TICE
Notesto the financial statements for the year ended 31st March, 2017
Notes
Nava Bharat Ventures Limited 129
Part
icul
ars
Face
Val
ueC
ost
As
at
Mar
ch 3
1, 2
017
As
at
Mar
ch 3
1, 2
016
As
at
Apr
il 01
, 201
5
`in
lakh
sN
um
ber
` in
lakh
s N
umbe
r`
in la
khs
Num
ber
` in
lakh
s
43
DET
AIl
S FO
R IN
VES
TMEN
TSIn
vest
men
t in
Equ
ity S
hare
s
Subs
idia
ries
(at
cost
)
Brah
man
i In
frat
ech
Priv
ate
Lim
ited
10.
00
4,1
50.0
0 4
1,49
9,99
8 4
,150
.00
41,
499,
998
4,1
50.0
0 4
1,49
9,99
8 4
,150
.00
Nav
a Bh
arat
Re
alty
Lim
ited
2.0
0 -
-
-
1
,100
,000
2
2.00
1
,100
,000
2
2.00
Nav
a Bh
arat
Pr
ojec
ts L
imite
d 2
.00
9,0
80.4
0 4
54,0
20,0
00
9,0
80.4
0 4
54,0
20,0
00
9,0
80.4
0 4
54,0
20,0
00
9,0
80.4
0
Nav
a Bh
arat
En
ergy
Indi
a Li
mite
d 2
.00
5,2
00.0
0 2
60,0
00,0
00
5,2
00.0
0 2
60,0
00,0
00
5,2
00.0
0 2
60,0
00,0
00
5,2
00.0
0
Nav
a Bh
arat
Su
gar
and
Bio
Fuel
s Li
mite
d 2
.00
-
-
-
250
,000
5
.00
250
,000
5
.00
Nav
a Bh
arat
(S
inga
pore
) Pte
. Li
mite
d -
SGD
SGD
1 4
.36
16,
870
4.3
6 1
6,87
0 4
.36
16,
870
4.3
6
Nav
a Bh
arat
(S
inga
pore
) Pte
. Li
mite
d -
USD
USD
1 8
9,54
5.84
1
58,5
90,0
00
89,
545.
84
158
,590
,000
8
9,54
5.84
1
54,5
90,0
00
86,
917.
55
Nav
a En
ergy
Pte
Li
mite
d-U
SDU
SD 1
0.6
7 1
,000
0
.67
-
-
-
-
Nav
a A
gro
Pte
Lim
ited-
USD
USD
1 0
.67
1,0
00
0.6
7 -
-
-
-
107
,981
.94
914
,128
,868
1
07,9
81.9
4 9
15,4
76,8
68
108
,007
.60
911
,476
,868
1
05,3
79.3
1
Ass
ocia
tes
(Des
igna
ted
at
FVTP
L)
Kin
nera
Pow
er
Com
pany
Priv
ate
Lim
ited
10.
00
2.5
8 2
5,84
4 2
.58
25,
844
2.5
8 2
5,84
4 2
.58

Notesto the financial statements for the year ended 31st March, 2017
130 45th Annual Report 2016-17
Part
icul
ars
Face
Val
ueC
ost
As
at
Mar
ch 3
1, 2
017
As
at
Mar
ch 3
1, 2
016
As
at
Apr
il 01
, 201
5
`in
lakh
sN
um
ber
` in
lakh
s N
umbe
r`
in la
khs
Num
ber
` in
lakh
s
Oth
er
inve
stm
ents
(D
esig
nate
d at
FV
TPL)
Unq
uote
d eq
uity
in
stru
men
ts
A P
Gas
Pow
er
Cor
pora
tion
Lim
ited
10.
00
0.00
17
0.00
17
0.00
17
0.00
Srin
ivas
a C
ystin
e Li
mite
d 1
0.00
5
.00
75,
000
271
.14
75,
000
279
.98
75,
000
223
.70
Mal
axm
i H
ighw
ay P
rivat
e Li
mite
d 1
0.00
6
4.66
6
46,6
00
-
646
,600
4
8.38
6
46,6
00
48.
38
69.
66
721
,617
2
71.1
4 7
21,6
17
328
.36
721
,617
2
72.0
8
Quo
ted
Ava
nthi
Lea
ther
s Li
mite
d 1
0.00
6
.33
63,
300
0.6
3 6
3,30
0 0
.63
63,
300
0.6
3
NB
Foot
wea
r Li
mite
d 1
0.00
7
.68
76,
830
4.4
1 7
6,83
0 3
.07
76,
830
1.8
1
Ava
nthi
Fee
ds
Lim
ited
2.0
0/10
.00
0.1
5 7
,500
5
5.31
7
,500
2
9.84
1
,500
2
3.06
IDBI
Ban
k Li
mite
d 1
0.00
6
.50
8,0
00
6.0
1 8
,000
5
.55
8,0
00
5.6
8
And
hra
Bank
10.
00
2.2
8 2
2,80
0 1
3.21
2
2,80
0 1
1.91
2
2,80
0 1
8.01
Tata
Con
sulta
ncy
Serv
ices
Lim
ited
1.0
0 2
6.10
1
2,28
4 2
98.7
2 1
2,28
4 3
09.5
9 1
2,28
4 3
13.7
3
MO
IL L
imite
d 1
0.00
3
6.19
9
,651
3
0.28
9
,651
2
1.01
9
,651
2
6.69
Kot
hari
Suga
rs
and
Che
mic
als
Lim
ited
10.
00
10.
00
200
0
.03
200
0
.02
200
0
.01
The
Jeyp
ore
Suga
r C
ompa
ny
Lim
ited
10.
00
1.1
6 2
,857
0
.03
2,8
57
0.0
3 2
,857
2
.06
96.
39
203
,422
4
08.6
3 2
03,4
22
381
.65
197
,422
3
91.6
8
Gra
nd
To
tal
108
,150
.57
915
,079
,751
1
08,6
64.2
9 9
16,4
27,7
51
108
,720
.19
912
,421
,751
1
06,0
45.6
5

CO
MPA
NY
OV
ERV
IEW STA
TUTO
RY R
EPOR
TS FINA
NC
IAL STA
TEMEN
TS (Stand
alon
e) NO
TICE
Notesto the financial statements for the year ended 31st March, 2017
Notes
Nava Bharat Ventures Limited 131
` in lakhs
ParticularsFor the year ended
March 31, 2017For the year ended
March 31, 2016
44 MOVEMENTS IN PROVISIONS:
Gratuity: (Refer Note: 45 also)
At the beginning of the year 1,596.61 1,539.89
Charge for the year 233.59 233.03
Released during the year (274.33) (176.31)
At the end of the year 1,555.87 1,596.61
Compensated Absences:
At the beginning of the year 797.20 804.49
Charge for the year 210.96 182.33
Released during the year (201.90) (189.62)
At the end of the year 806.26 797.20
45 RETIREMENT BENEFIT OBlIGATIONS:
A. Contributions to Defined Contributions ` in lakhs
ParticularsFor the year ended
March 31, 2017For the year ended
March 31, 2016
Defined Contribution Plan (Expenses)
Contribution to Provident Fund and other funds 591.29 390.24
Contribution to Employee State Insurance 3.58 4.85
B. Post – employment Defined Benefit Plans (Gratuity) ` in lakhs
ParticularsFor the year ended
March 31, 2017For the year ended
March 31, 2016
1. Movement in Obligation
Present Value of Obligation at the beginning of year 1,596.61 1,539.89
Current Service Cost 116.57 117.62
Interest Cost 117.02 115.42
Benefits Paid (55.97) (25.96)
Benefits paid directly by the company - (82.85)
Actuarial (Gain)/Loss on Obligation (218.36) (67.50)
Present Value of Obligation at the end of year 1,555.87 1,596.61

Notesto the financial statements for the year ended 31st March, 2017
132 45th Annual Report 2016-17
` in lakhs
ParticularsFor the year ended
March 31, 2017For the year ended
March 31, 2016
2. Movement in Plan Assets
Fair Value of Plan assets at the beginning of the year 617.71 555.68
Adjustments to opening balance of plan assets (7.37) -
Return of Plan Assets (excl. int. income) (3.37) (14.74)
Interest Income 44.74 44.43
Contributions during the year 34.76 58.30
Benefits Paid during the year (55.98) (25.96)
Fair Value of Planned assets at the end of the year 630.49 617.71
` in lakhs
ParticularsFor the year ended
March 31, 2017For the year ended
March 31, 2016
3. Expenses recognised in Profit and Loss Statement:
Current Service Cost 116.57 117.62
Net Interest Cost 72.28 70.99
Expense for the year 188.85 188.61
` in lakhs
ParticularsFor the year ended
March 31, 2017For the year ended
March 31, 2016
4. Recognised in Other Comprehensive Income:
Actuarial (Gain) /loss for the year (218.36) (67.50)
Return on plan assets excluding net interest 3.37 14.74
Total Expenditure recognised (214.99) (52.76)
5. Actuarial Assumptions for estimating Company’s Defined Benefit Obligation:
a. Attrition Rate PS: 0 to 42: 13.33% PS: 0 to 42: 10%
b. Discount Rate 6.69% 7.46%
c. Expected Rate of Increase in Salary 6.00% 6.00%
d. Expected Rate of return on Plan Assets 6.69% 7.46%
e. Mortality Rate IALM (2006-08) Ult. IALM (2006-08) Ult.
f. Expected Average remaining working lives of employees (years) 8.73 6.80

CO
MPA
NY
OV
ERV
IEW STA
TUTO
RY R
EPOR
TS FINA
NC
IAL STA
TEMEN
TS (Stand
alon
e) NO
TICE
Notesto the financial statements for the year ended 31st March, 2017
Notes
Nava Bharat Ventures Limited 133
6. Sensitivity Analysis ` in lakhs
Sensitivity Change Effect on obligations
Discount Rate +1% 1,471.15
-1% 1,652.42
Salary Escalation Rate +1% 1,626.57
-1% 1,489.35
The above sensitivity analysis is based on a change in an assumption while holding all other assumptions constant. In practice, this is unlikely to occur, and changes in some of the assumptions may be correlated. When calculating the sensitivity of the defined benefit obligation to significant actuarial assumptions the same method (projected unit credit method) has been applied as when calculating the defined benefit obligation recognised within the Balance Sheet.
7. Expected Payout - GratuityFor the year ended
March 31, 2017For the year ended
March 31, 2016
Expected payments – 1st Year 449.26 400.64
Expected payments – 2nd Year 161.78 87.64
Expected payments – 3rd Year 140.19 62.13
Expected payments – 4th Year 122.25 66.61
Expected payments – 5th Year 107.39 60.27
Expected payments – 6th Year to 10th Year 346.92 113.42
8. Other Information:
i. The company has invested plan assets with Life Insurance Corporation of India. Expected Return on Assets is based on rate of return declared by fund managers.
ii. Present value of defined benefit obligation:
Present value of the defined benefit obligation is calculated by using Projected Unit Credit method (PUC Method). Under the PUC method a “projected accrued benefit” is calculated at the beginning of the year and again at the end of the year for each benefit that will accrue for all active members of the Plan. The “projected accrued benefit” is based on the Plan’s accrual formula and upon service as of the beginning or end of the year, but using a member’s final compensation, projected to the age at which the employee is assumed to leave active service. The Plan Liability is the actuarial present value of the “projected accrued benefits” as of the beginning of the year for active members.
iii. Expected average remaining service Vs. Average Remaining Future Service:
The average remaining service can be arithmetically arrived by deducting current age from normal retirement age whereas the expected average remaining service is arrived actuarially by applying multiple decrements to the average remaining future service namely mortality and withdrawals. Thus, the expected average remaining service is always less than the average remaining future service.
iv. Current and Non- Current Liability:
The total of current and non-current liability must be equal with the total of PVO (Present value obligation) at the end of the period plus short term compensated liability if any. It has been classified in terms of “Schedule III” of the Companies Act, 2013.
Accordingly, below is the Current and Non-Current classification of Gratuity and Compensated Absences:

Notesto the financial statements for the year ended 31st March, 2017
134 45th Annual Report 2016-17
` in lakhs
Particulars As at March 31, 2017 As at March 31, 2016
Gratuity: -
a. Current Portion 449.26 614.77
b. Non-current portion 529.64 364.13
Compensated Absences: -
a. Current Portion 247.57 481.91
b. Non-current portion 652.77 416.67
` in lakhs
ParticularsFor the year ended
March 31, 2017For the year ended
March 31, 2016
46 INCOME TAX EXPENSE AND DEFERRED TAXES
Income Tax Expense: -
a. Current Tax 2,778.22 2,700.00
b. Deferred Tax (arising on temporary differences) 1,438.78 (206.19)
Tax expense attributable to the current year 4,217.00 2,493.81
c. MAT Credit entitlement - (2,030.00)
Total Tax Expense for the year 4,217.00 463.81
Effective Tax Reconciliation: -
a. Net Profit/(Loss) before taxes 12,514.51 12,219.59
b. Tax rate applicable to the company as per normal provisions 34.608% 34.608%
c. Tax expense on net profit (c = a*b) 4,331.02 4,228.96
d. Increase/(decrease) in tax expenses on account of:
i. Non-taxable income/Exempt Income (17.48) (10.05)
ii. Accelerated Depreciation (616.49) (889.45)
iii. Expenses not allowed under income tax 627.09 241.58
iv. Expenses that are allowed under payment basis 86.52 126.83
v. Deduction u/s. 80-IA (1,635.68) (3,484.81)
vi. Other allowances 3.24 (213.06)
vii. Other adjustments - -
(1,552.80) (4,228.96)
e. Tax as per normal provision under Income tax (c + d) 2,778.22 -
f. Tax rate applicable to the company as per MAT provisions 21.34% 21.34%
g. MAT Tax expense on net profit 2,670.80 2,607.86

CO
MPA
NY
OV
ERV
IEW STA
TUTO
RY R
EPOR
TS FINA
NC
IAL STA
TEMEN
TS (Stand
alon
e) NO
TICE
Notesto the financial statements for the year ended 31st March, 2017
Notes
Nava Bharat Ventures Limited 135
` in lakhs
ParticularsFor the year ended
March 31, 2017For the year ended
March 31, 2016
h. Increase/(decrease) in MAT tax expenses on account of:
i. Exempted income U/s.10 except 10(38) 29.08 24.77
ii. Other adjustments - 67.38
iii. Items that will not be reclassified to profit and loss 45.88 -
iv. 1/5th of transition amount u/s 115JB (2C) 32.46 -
107.43 92.14
i. MAT tax provision under 115JB (g + h) 2,778.22 2,700.00
Deferred Taxes:
As on the reporting date:
a. On OCI Component
- Actuarial Gain/(Losses) on Defined Benefit Plans (74.40) (18.26)
b. Other than OCI component
- Difference in WDV of fixed assets (1,644.28) 278.09
- Fair Value of Financial Assets/liabilities 47.94 (44.87)
- Post Employment Benefits (236.58) 37.99
- Other disallowances 394.14 (65.01)
c. Total for the year (1,438.78) 206.19
Expense/(Income) Recognised for the year ended:
a. Deferred tax liability/(asset) / recognised in statement of profit and loss:
1,438.78 (206.19)
b. Deferred tax recognised in Other Comprehensive Income 74.40 18.26
c. Deferred tax recognised in Total Comprehensive Income 1,513.18 (187.93)
47 SEGMENT INFORMATION:
For management purposes, the company is organised into business units based on its products and services and has three reportable segments as follows:
a. Ferro Alloys (FAP) Segment which produces various Alloy Metals viz., Ferro Chrome, Silico Manganese and Ferro Silicon and also carrying conversion work on job work basis to others.
b. Power Segment which generates Thermal energy for captive use and also for outside sale.
c. Sugar Segment which produces Sugar and its integrated By-Products.
No operating segments have been aggregated to form the above reportable operative segments.
The Executive Management monitors the operating results of its business units separately for the purpose of making decisions about resource allocation and performance assessment. Segment performance is evaluated based on profit or loss and is measured consistently with profit or loss in the consolidated financial statements. The company manages its financing and income taxes separately, company as a whole and are not allocated to operating segments.
Transfer pricing between operating segments are on an arm’s length basis in a manner similar to transactions with third parties wherever available.

Notesto the financial statements for the year ended 31st March, 2017
136 45th Annual Report 2016-17
Year ended March 31, 2017 ` in lakhs
Particulars FAP Power Sugar Adjustments Total
Revenue
External Customers 63,067.32 49,426.59 16,750.31 - 129,244.22
Inter Segment - 31,000.98 309.24 - 31,310.22
Total revenue 63,067.32 18,425.61 16,441.07 - 97,934.00
Depreciation and Amortisation 625.59 2,584.14 414.80 83.08 3,707.61
Segment Result 577.54 14,000.81 3,016.32 (5,080.16) 12,514.51
Segment Assets 33,446.33 78,244.95 16,631.03 193,614.29 321,936.60
Segment Liabilities 8,798.80 4,662.97 4,667.57 33,272.13 51,401.47
Year ended March 31, 2016 ` in lakhs
Particulars FAP Power Sugar Others Total
Revenue
External Customers 49,455.95 60,374.52 14,164.88 - 123,995.35
Inter Segment - 21,113.21 248.33 - 21,361.54
Total revenue 49,455.95 39,261.31 13,916.55 - 102,633.81
Dep. and Amortisation 538.76 2,297.59 452.93 103.19 3,392.47
Segment Result (6,518.43) 21,652.43 202.78 (3,117.19) 12,219.59
Segment Assets 30,168.58 83,827.67 17,201.86 196,501.09 327,700.10
Segment Liabilities 5,326.65 5,853.90 8,211.28 43,166.88 62,558.71
Entity wide disclosures:
Revenue from external customerFor the year ended
March 31, 2017For the year ended
March 31, 2016
India 81,005.62 87,290.36
Outside India 16,928.38 15,343.45
Total 97,934.00 102,633.81
Non-Current operating assets As at March 31, 2017 As at March 31, 2016 As at April 01, 2015
India 86,123.79 87,040.47 84,559.65
Outside India - - -
86,123.79 87,040.47 84,559.65
For the purpose of non-current operating assets financial instruments, deferred tax assets, MAT Credit, post- employment benefit assets have been excluded.

CO
MPA
NY
OV
ERV
IEW STA
TUTO
RY R
EPOR
TS FINA
NC
IAL STA
TEMEN
TS (Stand
alon
e) NO
TICE
Notesto the financial statements for the year ended 31st March, 2017
Notes
Nava Bharat Ventures Limited 137
48 FAIR VAlUE OF FINANCIAl INSTRUMENTS:
As at March 31, 2017: ` in lakhs
ParticularsFair Value through
profit or lossAmortised Cost Total
Financial Assets:
Investments (other than subsidiaries) 682.36 - 682.36
Loans to related parties - 46,364.18 46,364.18
Loans to non-body corporate - 2,674.86 2,674.86
Security Deposits - 1,184.39 1,184.39
Employee Advance - 45.79 45.79
Total 682.36 50,269.22 50,951.58
Financial Liabilities:
Term Loans - 15,015.17 15,015.17
Employee Retention Deposits - 4.32 4.32
Rental Deposits - 33.40 33.40
Forward Contract liability 2,020.81 - 2,020.81
Swap Contract liability 1,266.73 - 1,266.73
Total 3,287.54 15,052.89 18,340.43
As at March 31, 2016: ` in lakhs
ParticularsFair Value through
profit or lossAmortised Cost Total
Financial Assets:
Investments (other than subsidiaries) 712.60 - 712.60
Loans to related parties - 29,150.00 29,150.00
Loans to non-body corporate - 2,518.64 2,518.64
Security Deposits - 1,168.62 1,168.62
Employee Advance - 47.09 47.09
Total 712.60 32,884.35 33,596.95
Financial Liabilities:
Term Loans - 24,396.57 24,396.57
Employee Retention Deposits - 9.40 9.40
Rental Deposits - 33.52 33.52
Total - 24,439.49 24,439.49

Notesto the financial statements for the year ended 31st March, 2017
138 45th Annual Report 2016-17
As at March 31, 2015: ` in lakhs
ParticularsFair Value through
profit or lossAmortised Cost Total
Financial Assets:
Investments (other than subsidiaries) 666.35 - 666.35
Loans to non-body corporate - 2,422.91 2,422.91
Security Deposits - 1,161.18 1,161.18
Employee Advance - 68.06 68.06
Total 666.35 3652.15 4,318.50
Financial Liabilities:
Term Loans - 2,818.15 2,818.15
Employee Retention Deposits - 15.73 15.73
Rental Deposits - 29.92 29.92
Total - 2,863.80 2,863.80
The management assessed that cash and cash equivalents trade receivables, trade payables and other current assets/liabilities approximate their carrying amount largely due to the short-term maturities of these instruments.
The fair value of the financials assets and liabilities is reported at the amount at which the instrument could be exchanged in a current transaction between willing parties other than in a forced or liquidation sale. The following methods and assumptions were used to estimate the fair values:
a. The fair values of the quoted shares are based on price quotations at the reporting dates. The fair value of unquoted equity shares are based on the Net Assets available for Equity Shareholders of the Companies.
b. Fair value of Interest free loan given to employees and security deposits have been calculated by discounting future cash flows using rates currently available for debt on similar terms credit risk and remaining maturities.
Description of significant observable inputs to valuation:
a. Loan given to employees’ trust:
Interest Rate factor has been considered at a rate of 12% p.a. by the company for discounting the loan to the date of transition.
b. Investments in Un-quoted equity shares:
The fair values have been ascertained based on data available from financial statements of the unlisted companies. The net asset available for equity shareholders have been considered.
c. Interest free employee staff advance:
Interest Rate factor has been considered at a rate of 12% p.a. by the company for discounting the cash flows by way of repayments by the employees.
e. Interest free Security Deposits (assets):
Interest Rate factor has been considered at a rate of 12% p.a. by the company for discounting the amount receivable at the time of maturity.
f. Interest free Security Deposits (liabilities):
Interest Rate factor has been considered at a rate of 12% p.a. by the company for discounting the amount receivable at the time of maturity.

CO
MPA
NY
OV
ERV
IEW STA
TUTO
RY R
EPOR
TS FINA
NC
IAL STA
TEMEN
TS (Stand
alon
e) NO
TICE
Notesto the financial statements for the year ended 31st March, 2017
Notes
Nava Bharat Ventures Limited 139
49 FAIR VAlUE HIERARCHY:
The following table provide the fair value measurement hierarchy of the company’s assets and liabilities.
Quantitative disclosures of fair value measurement hierarchy as at March 31, 2017: ` in lakhs
Particulars TotalFair Value measurement using
Quoted prices in active markets
Significant observable inputs
Financial Assets measured at FVTPL
Investments 682.36 408.63 273.73
Financial Asset measured at amortised Cost
Loans to related parties 46,364.18 - 46,364.18
Loans to non-body corporate 2,674.86 - 2,674.86
Security Deposits 1,184.39 - 1,184.39
Employee Staff Advance 45.79 - 45.79
Financial liability measured at FVTPL
Swap Contract liability 1,266.73 - 1,266.73
Financial liability measured at amortised cost
Term Loans 15,015.17 - 15,015.17
Employee Retention Deposits 4.32 - 4.32
Rental Deposits 33.40 - 33.40
Quantitative disclosures of fair value measurement hierarchy as at March 31, 2016: ` in lakhs
Particulars TotalFair Value measurement using
Quoted prices in active markets
Significant observable inputs
Financial Assets measured at FVTPL
Investments 712.60 381.66 330.94
Financial Asset measured at amortised Cost
Loans to related parties 29,150.00 - 29,150.00
Loans to non-body corporate 2,518.64 - 2,518.64
Security Deposits given 1,168.62 - 1,168.62
Employee Staff Advance 47.09 - 47.09
Financial liability measured at amortised cost
Term Loans 24,396.57 - 24,396.57
Employee Retention Deposits 9.40 - 9.40
Rental Deposits 33.52 - 33.52

Notesto the financial statements for the year ended 31st March, 2017
140 45th Annual Report 2016-17
Quantitative disclosures fair value measurement hierarchy as at April 01, 2015: ` in lakhs
Particulars TotalFair Value measurement using
Quoted prices in active markets
Significant observable inputs
Financial Assets measured at FVTPL
Investments 666.35 391.68 274.67
Financial Asset measured at amortised Cost
Loans to non-body corporate 2,422.91 - 2,422.91
Security Deposits given 1,161.18 - 1,161.18
Employee Staff Advance 68.06 - 68.06
Financial liability measured at amortised cost
Term Loans 2,818.15 - 2,818.15
Employee Retention Deposits 15.73 - 15.73
Rental Deposits 29.92 - 29.92
50 RElATED PARTY TRANSACTIONS: DURING THE YEAR UNDER REFERENCE THE COMPANY HAS ENTERED FOllOWING TRANSACTIONS WITH RElATED PARTIES:
Names of the Related parties and description of relationship:
i) Key Management Personnel
1. Mr. D. Ashok, Chairman
2. Mr. P. Trivikrama Prasad, Managing Director
3. Mr. G.R.K. Prasad, Executive Director
4. Mr. C.V. Druga Prasad, Director (Business Development)
ii) Relatives of Key Management Personnel
1. Smt. D. Ramaa - wife of Mr. D Ashok
2. Mr. D. Ashwin - son of Mr. D Ashok
3. Mr. D. Nikhil - son of Mr. D Ashok
4. Dr. D. Rajasekhar - brother of Mr. D Ashok
5. Smt. D. Bhaktapriya - mother of Mr. D Ashok
6. Smt. A. Nilima - sister of Mr. D Ashok
7. Smt. P. Rajashree - wife of Mr. P Trivikrama Prasad
8. Smt. P. Sruthi - daughter of Mr. P Trivikrama Prasad
9. Smt. G. S. P. Kumari - wife of Mr. G R K Prasad
10. Smt. C. Umamaheswari - wife of Mr. C V Durga Prasad

CO
MPA
NY
OV
ERV
IEW STA
TUTO
RY R
EPOR
TS FINA
NC
IAL STA
TEMEN
TS (Stand
alon
e) NO
TICE
Notesto the financial statements for the year ended 31st March, 2017
Notes
Nava Bharat Ventures Limited 141
iii) Enterprises controlling the reporting enterprise:
Subsidiaries 1. Nava Bharat Energy India Limited
2. Nava Bharat Projects Limited
3. Nava Bharat Realty Limited (upto 30.12.2016)
4. Nava Bharat Sugar and Bio Fuels Limited (upto 30.12.2016)
5. Brahmani Infratech Private Limited
6. Nava Bharat (Singapore) Pte. Limited
7. Maamba Collieries Limited
8. Kariba Infrastructure Development Limited (upto 17.02.2017)
9. NB Rufiji Private Limited
10. NB Tanagro Limited
11. Nava Energy Pte. Limited
12. Nava Bharat Lao Energy Pte. Limited (upto 30.10.2016)
13. Namphak Power Company Limited (upto 30.10.2016)
14. Nava Energy Zambia Limited
15. Nava Agro Pte. Limited
iv) Enterprises over which key management personnel/their relatives exercise significant influence:
1. Nav Developers Limited
2. S R T Investments Private Limited
3. A N Investments Private Limited
4. V9 Avenues Private Limited
5. A9 Homes Private Limited
6. AV Dwellings Private Limited
7. V9 Infra Ventures Private Limited
8. Malaxmi Highway Private Limited
9. Kinnera Power Company Private Limited
10. Dr. Devineni Subba Rao Trust
11. Gunnam Subbarao and Ramayamma Trust
12. Chapter One Books Pte. Limited
13. Kariba Sugar Limited
14. The Indian Ferro Alloys Producers Association

Notesto the financial statements for the year ended 31st March, 2017
142 45th Annual Report 2016-17
Particulars of transactions with related parties during the year: ` in lakhs
ParticularsFor the year ended
March 31, 2017For the year ended
March 31, 2016
Key Managerial Personnel:
Mr. D Ashok
Remuneration 464.20 386.42
Mr. P Trivikrama Prasad
Remuneration 463.88 386.38
Mr. G R K Prasad
Remuneration 275.85 288.07
Mr. C V Durga Prasad
Remuneration 217.10 228.15
Relatives of Key Managerial Personnel:
Dr. D. Rajasekhar
Rent paid 15.54 15.20
Mr. D Nikhil
Remuneration 6.68 -
Subsidiaries:
Nava Bharat (Singapore) Pte. Limited
Sale of ferro alloys 6,016.26 11,361.10
Loan given - 46,994.57
Loan received back 3,975.00 -
Interest income 2,469.44 1,264.51
Guarantee provided - 57,297.64
Guarantee Commission income 753.94 1,395.72
Finance provided (Equity Contributions in Cash) - 2,628.30
Reimbursements received/receivable 11.85 14.27
Maamba Collieries Limited
Project Support Services rendered 444.02 1,319.26
Reimbursements received 177.81 218.49
Staff Support Services rendered 148.12 -
Brahmani Infratech Private Limited
Interest expense - 269.26
Loan given/(repaid) - (3,000.00)

CO
MPA
NY
OV
ERV
IEW STA
TUTO
RY R
EPOR
TS FINA
NC
IAL STA
TEMEN
TS (Stand
alon
e) NO
TICE
Notesto the financial statements for the year ended 31st March, 2017
Notes
Nava Bharat Ventures Limited 143
Particulars of transactions with related parties during the year: ` in lakhs
ParticularsFor the year ended
March 31, 2017For the year ended
March 31, 2016
Nava Bharat Energy India Limited
Lease rent earned 2.11 1.84
Utility charges received 552.06 555.18
Sale of Fly Ash Bricks 6.89 1.28
Staff Support Services rendered 74.20 -
Staff Support Services availed 40.34 -
Nava Energy Pte. Limited
Technical Support Services rendered 1,421.48 -
Guarantee Commission income 886.87 -
Finance provided (Equity Contributions in Cash) 0.67 -
Reimbursements receivable 23.63 29.05
Nava Energy Zambia Limited
Reimbursements received/receivable 15.27 35.28
Amounts due (to)/from related parties as at the year-end: ` in lakhs
As at March 31, 2017 As at March 31, 2016 As at March 31, 2015
Key Management personnel:
Mr. D Ashok (286.16) (211.39) (292.62)
Mr. P Trivikrama Prasad (286.16) (211.39) (292.62)
Subsidiaries:
Nava Bharat (Singapore) Pte. Limited 49,605.09 2,851.30 15,503.08
Nava Bharat Energy India Limited (232.90) 30.24 616.73
Maamba Collieries Limited 483.26 2,883.36 1,618.49
Nava Energy Pte. Limited 1,120.04 29.05 -
Nava Energy Zambia Limited - 35.28 -
Brahmani Infratech Private Limited - - (3,000.00)
Key Managerial Personnel Compensation ` in lakhs
ParticularsFor the year ended
March 31, 2017For the year ended
March 31, 2016
Short-term employee benefits 1,338.36 1,188.75
Post-employment defined benefit 17.88 38.65
Compensated Absences 9.03 8.97
Termination benefits 55.80 52.65

Notesto the financial statements for the year ended 31st March, 2017
144 45th Annual Report 2016-17
51 FINANCIAl RISK MANAGEMENT OBJECTIVES AND POlICIES:
The company is exposed to financial risks arising from its operations and the use of financial instruments. The key financial risks include interest rate risk foreign currency risk market risk credit risk and liquidity risk. The company’s risk management policies focus on the unpredictability of financial markets and seek to where appropriate minimize potential and guidelines and there has been no change to the company’s exposure to these financial risks or the manner in which it manages and measures the risks or the manner in which it manages and measures the risks.
The following sections provide the details regarding the Company’s exposure to the financial risks associated with financial instruments held in the ordinary course of business and the objectives policies and processes for the management of these risks.
i. Market Risk:
Market risk is the risk that the fair value or future cash flows of a financial instrument will fluctuate because of changes in market prices. Market prices comprise three types of risk, currency rate risk, interest rate risk and other price risks such as equity risk. Financial instruments affected by market risk include loans and advances deposits investments in debt securities mutual funds and other equity funds.
a. Interest rate risk:
Interest rate risk is the risk that the fair value or future cash flows of the Company and the Company’s financial instruments will fluctuate because of changes in market interest rates. The Company’s exposure to interest rate risk arises primarily from the loans and advances given by the company investment in debt securities investment in debt mutual funds and cash and cash equivalents.
The company’s policy is to manage its interest rate risk by having a balanced portfolio of fixed and variable rate loans and borrowings
The exposure of the Company’s borrowings to interest rate changes at the end of the reporting period are as follows:
` in lakhs
Particulars As at March 31, 2017 As at March 31, 2016 As at March 31, 2015
Rupee Term Loan 22,992.85 32,193.41 10,434.15
Interest Rate Sensitivity
The following table demonstrates the sensitivity to a reasonably possible change in interest rates on that portion of loans and borrowings affected after the impact of hedge accounting. With all other variables held constant the Company’s profit before tax is affected through the impact on floating rate borrowings as follows:
Movement in basis points Impact on profit before tax (`)
March 31 2017
INR 50 144.97
-50 (144.97)
March 31 2016 -
INR 50 86.44
-50 (86.44)
April 1 2015
INR 50 70.96
-50 (70.96)
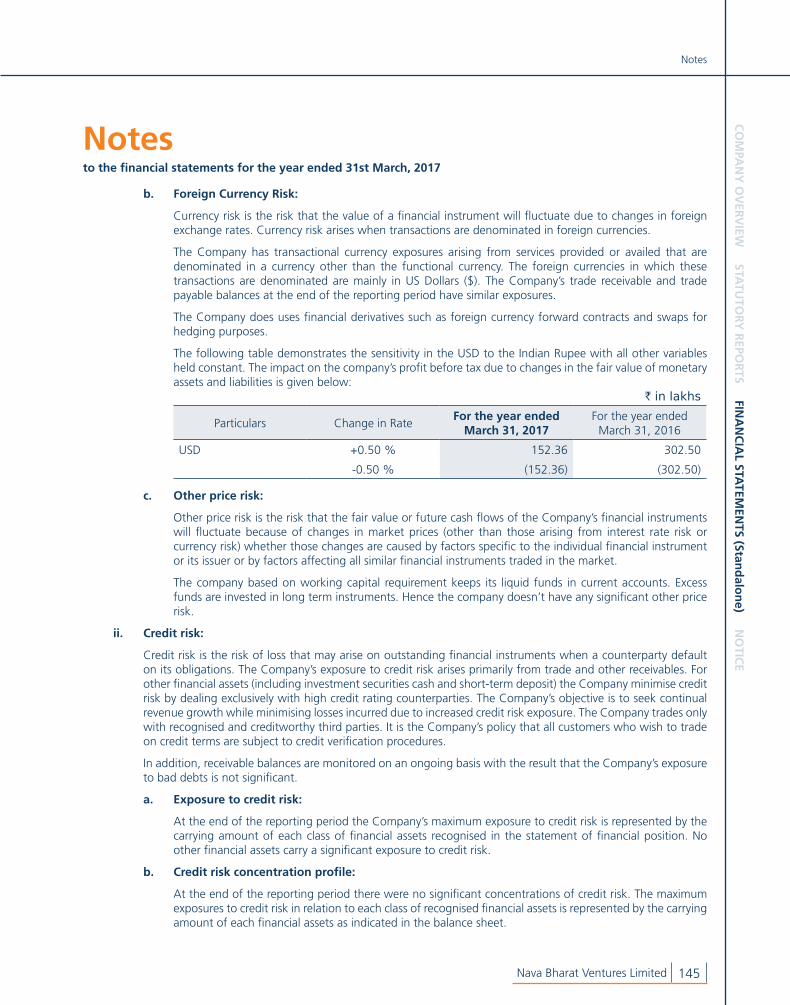
CO
MPA
NY
OV
ERV
IEW STA
TUTO
RY R
EPOR
TS FINA
NC
IAL STA
TEMEN
TS (Stand
alon
e) NO
TICE
Notesto the financial statements for the year ended 31st March, 2017
Notes
Nava Bharat Ventures Limited 145
b. Foreign Currency Risk:
Currency risk is the risk that the value of a financial instrument will fluctuate due to changes in foreign exchange rates. Currency risk arises when transactions are denominated in foreign currencies.
The Company has transactional currency exposures arising from services provided or availed that are denominated in a currency other than the functional currency. The foreign currencies in which these transactions are denominated are mainly in US Dollars ($). The Company’s trade receivable and trade payable balances at the end of the reporting period have similar exposures.
The Company does uses financial derivatives such as foreign currency forward contracts and swaps for hedging purposes.
The following table demonstrates the sensitivity in the USD to the Indian Rupee with all other variables held constant. The impact on the company’s profit before tax due to changes in the fair value of monetary assets and liabilities is given below:
` in lakhs
Particulars Change in RateFor the year ended
March 31, 2017For the year ended
March 31, 2016
USD +0.50 % 152.36 302.50
-0.50 % (152.36) (302.50)
c. Other price risk:
Other price risk is the risk that the fair value or future cash flows of the Company’s financial instruments will fluctuate because of changes in market prices (other than those arising from interest rate risk or currency risk) whether those changes are caused by factors specific to the individual financial instrument or its issuer or by factors affecting all similar financial instruments traded in the market.
The company based on working capital requirement keeps its liquid funds in current accounts. Excess funds are invested in long term instruments. Hence the company doesn’t have any significant other price risk.
ii. Credit risk:
Credit risk is the risk of loss that may arise on outstanding financial instruments when a counterparty default on its obligations. The Company’s exposure to credit risk arises primarily from trade and other receivables. For other financial assets (including investment securities cash and short-term deposit) the Company minimise credit risk by dealing exclusively with high credit rating counterparties. The Company’s objective is to seek continual revenue growth while minimising losses incurred due to increased credit risk exposure. The Company trades only with recognised and creditworthy third parties. It is the Company’s policy that all customers who wish to trade on credit terms are subject to credit verification procedures.
In addition, receivable balances are monitored on an ongoing basis with the result that the Company’s exposure to bad debts is not significant.
a. Exposure to credit risk:
At the end of the reporting period the Company’s maximum exposure to credit risk is represented by the carrying amount of each class of financial assets recognised in the statement of financial position. No other financial assets carry a significant exposure to credit risk.
b. Credit risk concentration profile:
At the end of the reporting period there were no significant concentrations of credit risk. The maximum exposures to credit risk in relation to each class of recognised financial assets is represented by the carrying amount of each financial assets as indicated in the balance sheet.

Notesto the financial statements for the year ended 31st March, 2017
146 45th Annual Report 2016-17
c. Financial assets that are neither past due nor impaired:
Trade and other receivables that are neither past due nor impaired are creditworthy debtors with good payment record with the Company. Cash and short-term deposits investment securities that are neither past due nor impaired are placed with or entered with reputable banks financial institutions or companies with high credit ratings and no history of default.
d. Financial assets that are either past due or impaired:
The company doesn’t have any trade receivables or other financial assets which are either past due or impaired.
iii. Liquidity risk:
The risk that an entity will encounter difficulty in meeting obligations associated with financial liabilities that are settled by delivering cash or another financial asset.
The company ensures that it has sufficient cash on demand to meet expected operational demands including the servicing of financial obligations; this excludes the potential impact of extreme circumstances that cannot reasonably be predicted.
The table below summarises the maturity profile of the Company’s financial liabilities based on contractual undiscounted payments:
` in lakhs
Particulars Total On Demand < 12 months 1 to 5 years
Year ended March 31 2017
Borrowings - Non-Current 15,015.17 - - 15,015.17
Borrowings – Current 6,310.54 - 6,310.54 -
Trade payables 7,138.29 7,138.29 - -
Other financial liabilities 13,433.25 1,501.63 11,893.89 37.72
Swap Contract liability 1,266.73 - 1,266.73 -
Year ended March 31 2016
Borrowings - Non-Current 24,396.57 - - 24,396.57
Borrowings – Current 11,481.14 - 11,481.14 -
Trade payables 8,559.31 8,559.31 - -
Other financial liabilities 10,352.20 1,316.26 8,993.02 42.91
As at April 01 2015
Borrowings - Non-Current 2,818.15 - - 2,818.15
Borrowings - Current 6,316.65 - 6,316.65 -
Trade payables 6,048.92 6,048.92 - -
Other financial liabilities 12,435.70 1,506.02 10,884.02 45.66
52 CAPITAl MANAGEMENT:
Capital includes equity attributable to the equity holders of the parent. The primary objective of the capital management is to ensure that it maintain an efficient capital structure and healthy capital ratios in order to support its business and maximise shareholder’s value.
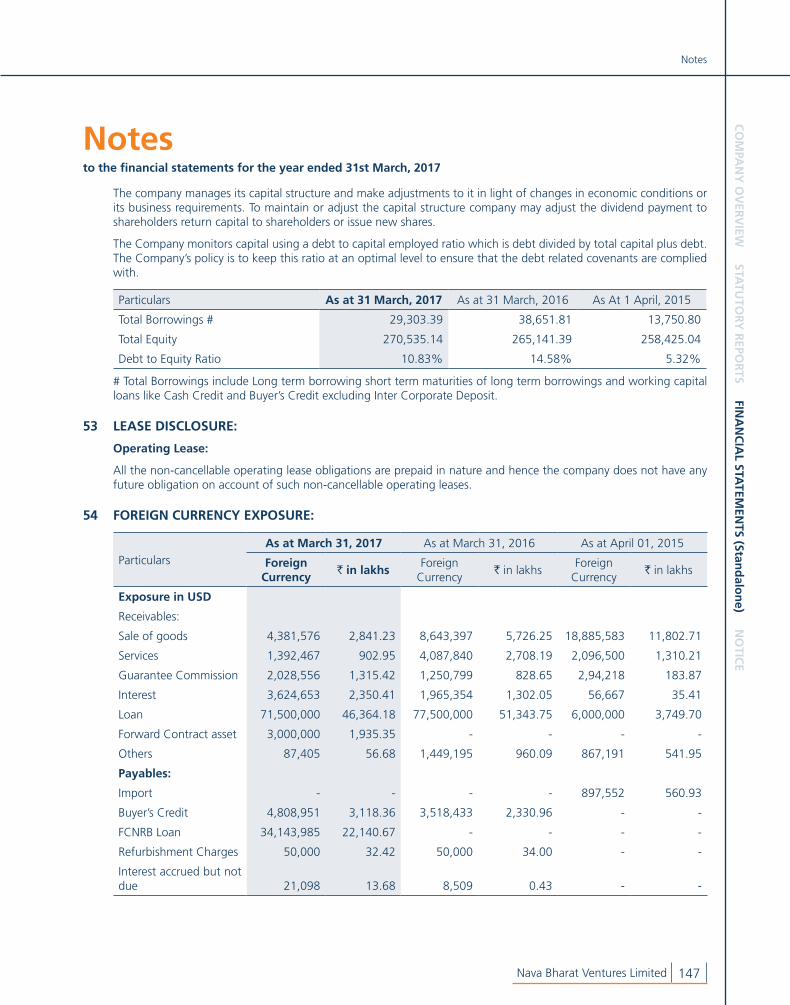
CO
MPA
NY
OV
ERV
IEW STA
TUTO
RY R
EPOR
TS FINA
NC
IAL STA
TEMEN
TS (Stand
alon
e) NO
TICE
Notesto the financial statements for the year ended 31st March, 2017
Notes
Nava Bharat Ventures Limited 147
The company manages its capital structure and make adjustments to it in light of changes in economic conditions or its business requirements. To maintain or adjust the capital structure company may adjust the dividend payment to shareholders return capital to shareholders or issue new shares.
The Company monitors capital using a debt to capital employed ratio which is debt divided by total capital plus debt. The Company’s policy is to keep this ratio at an optimal level to ensure that the debt related covenants are complied with.
Particulars As at 31 March, 2017 As at 31 March, 2016 As At 1 April, 2015
Total Borrowings # 29,303.39 38,651.81 13,750.80
Total Equity 270,535.14 265,141.39 258,425.04
Debt to Equity Ratio 10.83% 14.58% 5.32%
# Total Borrowings include Long term borrowing short term maturities of long term borrowings and working capital loans like Cash Credit and Buyer’s Credit excluding Inter Corporate Deposit.
53 lEASE DISClOSURE:
Operating Lease:
All the non-cancellable operating lease obligations are prepaid in nature and hence the company does not have any future obligation on account of such non-cancellable operating leases.
54 FOREIGN CURRENCY EXPOSURE:
ParticularsAs at March 31, 2017 As at March 31, 2016 As at April 01, 2015
Foreign Currency
` in lakhsForeign
Currency` in lakhs
Foreign Currency
` in lakhs
Exposure in USD
Receivables:
Sale of goods 4,381,576 2,841.23 8,643,397 5,726.25 18,885,583 11,802.71
Services 1,392,467 902.95 4,087,840 2,708.19 2,096,500 1,310.21
Guarantee Commission 2,028,556 1,315.42 1,250,799 828.65 2,94,218 183.87
Interest 3,624,653 2,350.41 1,965,354 1,302.05 56,667 35.41
Loan 71,500,000 46,364.18 77,500,000 51,343.75 6,000,000 3,749.70
Forward Contract asset 3,000,000 1,935.35 - - - -
Others 87,405 56.68 1,449,195 960.09 867,191 541.95
Payables:
Import - - - - 897,552 560.93
Buyer’s Credit 4,808,951 3,118.36 3,518,433 2,330.96 - -
FCNRB Loan 34,143,985 22,140.67 - - - -
Refurbishment Charges 50,000 32.42 50,000 34.00 - -
Interest accrued but not due 21,098 13.68 8,509 0.43 - -

Notesto the financial statements for the year ended 31st March, 2017
148 45th Annual Report 2016-17
55 Details of Specified bank notes as per Notification No. G.S.R. 308(E) of 2017: ` in lakhs
ParticularsSpecified
bank notesOther
denomination notesTotal
Closing cash in hand as on 08.11.2016 3.37 0.01 3.38
(+) Permitted receipts - 15.28 15.28
(-) Permitted Payments - 8.72 8.72
(-) Amount deposited in Banks 3.37 - 3.37
Closing cash in hand as on 30.12.2016 - 6.57 6.57
56 The dividends declared by the company are based on the profits available for distribution as reported in the financial statements of the company. The Board of Directors of the company have proposed a final dividend of Rs 1.00 per share in respect of the year ended March 31, 2017 subject to the approval of shareholders at the Annual General Meeting. If approved, the dividend would result in a cash outflow of ` 2,029.57 lakhs inclusive of dividend distribution tax of ` 343.29 lakhs.
57 FIRST TIME ADOPTION OF IND AS:
For all periods, up to and including the year ended March 31, 2016 the company has prepared its financial statements in accordance with generally accepted accounting principles and accounting standards notified under section 133 of the Companies Act 2013 read together with paragraph 7 of the Companies (Accounts) Rules 2014 (“Previous GAAP”).
These financial statements for the year ended March 31, 2017 are the company’s first annual Ind AS complied financial statements.
The company has prepared financial statements which comply with Ind AS applicable for period beginning on or after April 01, 2015 (transition date) as described in the accounting policies. This note explains the principal adjustment made by the company in restating its Previous GAAP Balance Sheet.
Exemptions Applied: The company has applied following exemptions as per Ind AS 101 First Time Adoption:
i. For transition to Ind AS the company has elected to carry the values of Property Plant and Equipment as well as all of its intangible assets recognised as of March 31, 2015 measured as per previous GAAP and used that carrying value as its deemed cost.
ii. On the date of transition the Company has elected to designate all the investments in financial instruments at Fair Value through profit or loss that were acquired before the date of transition.
The reconciliation of equity as at April 01, 2015 and March 31, 2016 and profit for the year ended March 31, 2016 is as follows:

CO
MPA
NY
OV
ERV
IEW STA
TUTO
RY R
EPOR
TS FINA
NC
IAL STA
TEMEN
TS (Stand
alon
e) NO
TICE
Notesto the financial statements for the year ended 31st March, 2017
Notes
Nava Bharat Ventures Limited 149
Reconciliation of equity as at April 01, 2015
` in lakhs
ParticularsNote No.
As per Previous GAAP
Impact Ind AS
As per Ind AS
ASSETSNon-current assets
(a) Property, Plant and Equipment 1 82,176.16 (140.72) 82,035.44 (b) Capital work-in-progress 675.56 - 675.56 (c) Investment Property 264.38 - 264.38 (d) Intangible assets 2 442.10 - 442.10 (e) Financial Assets
(i) Investments 3,4 105,516.98 1,073.24 106,590.22 (ii) Loans 5 2,879.34 (456.43) 2,422.91 (iii) Other financial assets 6 2,419.12 (59.30) 2,359.82
(f) Other non-current assets 20,603.99 (55.61) 20,548.38 214,977.63 361.18 215,338.81
Current assets(a) Inventories 34,383.76 - 34,383.76 (b) Financial Assets
(i) Trade receivables 22,013.27 - 22,013.27 (ii) Cash and cash equivalents 2,401.03 - 2,401.03 (iii) Bank balances other than (ii) above 63.16 - 63.16 (iv) Loans 3,751.10 - 3,751.10 (v) Others financial assets 4,571.97 - 4,571.97
(c) Current Tax Assets (Net) 870.88 - 870.88 (d) Other current assets 9,786.85 427.82 10,214.67
77,842.02 427.82 78,269.84Total Assets 292,819.65 789.00 293,608.65 EQUITY AND LIABILITIESEquity
(a) Equity Share capital 1,787.01 - 1,787.01 (b) Other Equity 7 251,678.27 4,959.76 256,638.03
253,465.28 4,959.76 258,425.04 LiabilitiesNon - current liabilities
(a) Financial liabilities(i) Borrowings 8 2,848.82 (30.67) 2,818.15 (ii) Other financial liabilities 9 54.40 (8.74) 45.65
(b) Deferred tax liabilities (net) 10 2,925.41 (26.69) 2,898.72 (c) Other Non-current liabilities - 0.40 0.40 (d) Provisions 11 463.04 0.01 463.05
6,291.67 (65.69) 6,225.97 Current liabilities
(a) Financial Liabilities(i) Borrowings 6,316.65 - 6,316.65 (ii) Trade payables 6,048.92 - 6,048.92 (iii) Other financial liabilities 11,422.81 967.24 12,390.05
(b) Other current liabilities 2,874.74 1.62 2,876.36 (c) Provisions 6,399.58 (5,073.93) 1,325.66
33,062.70 (4,105.07) 28,957.64Total Equity and Liabilities 292,819.65 789.00 293,608.65
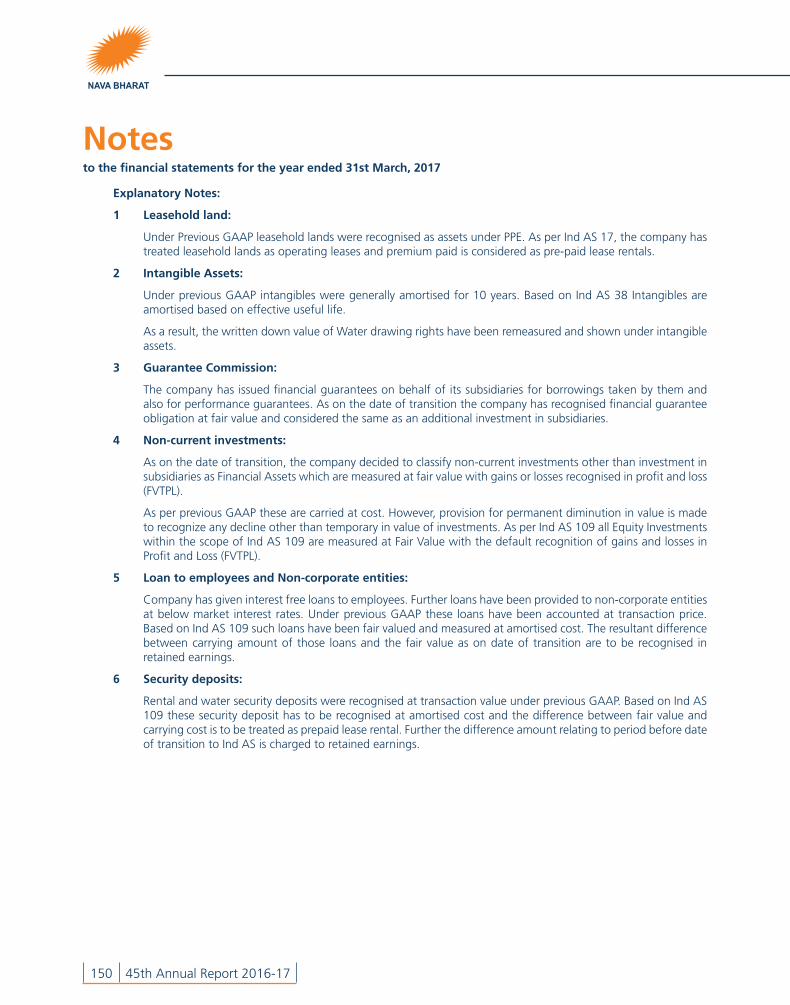
Notesto the financial statements for the year ended 31st March, 2017
150 45th Annual Report 2016-17
Explanatory Notes:
1 Leasehold land:
Under Previous GAAP leasehold lands were recognised as assets under PPE. As per Ind AS 17, the company has treated leasehold lands as operating leases and premium paid is considered as pre-paid lease rentals.
2 Intangible Assets:
Under previous GAAP intangibles were generally amortised for 10 years. Based on Ind AS 38 Intangibles are amortised based on effective useful life.
As a result, the written down value of Water drawing rights have been remeasured and shown under intangible assets.
3 Guarantee Commission:
The company has issued financial guarantees on behalf of its subsidiaries for borrowings taken by them and also for performance guarantees. As on the date of transition the company has recognised financial guarantee obligation at fair value and considered the same as an additional investment in subsidiaries.
4 Non-current investments:
As on the date of transition, the company decided to classify non-current investments other than investment in subsidiaries as Financial Assets which are measured at fair value with gains or losses recognised in profit and loss (FVTPL).
As per previous GAAP these are carried at cost. However, provision for permanent diminution in value is made to recognize any decline other than temporary in value of investments. As per Ind AS 109 all Equity Investments within the scope of Ind AS 109 are measured at Fair Value with the default recognition of gains and losses in Profit and Loss (FVTPL).
5 Loan to employees and Non-corporate entities:
Company has given interest free loans to employees. Further loans have been provided to non-corporate entities at below market interest rates. Under previous GAAP these loans have been accounted at transaction price. Based on Ind AS 109 such loans have been fair valued and measured at amortised cost. The resultant difference between carrying amount of those loans and the fair value as on date of transition are to be recognised in retained earnings.
6 Security deposits:
Rental and water security deposits were recognised at transaction value under previous GAAP. Based on Ind AS 109 these security deposit has to be recognised at amortised cost and the difference between fair value and carrying cost is to be treated as prepaid lease rental. Further the difference amount relating to period before date of transition to Ind AS is charged to retained earnings.
CO
MPA
NY
OV
ERV
IEW STA
TUTO
RY R
EPOR
TS FINA
NC
IAL STA
TEMEN
TS (Stand
alon
e) NO
TICE
Notesto the financial statements for the year ended 31st March, 2017
Notes
Nava Bharat Ventures Limited 151
7 Treasury Shares:
Own fully paid equity shares held by the company, pursuant to order of Hon’ble High Court of Andhra Pradesh dated 30.12.1996 in the Scheme of amalgamation of Nav Chrome Limited with the company, which are vested in a Trustee for the benefit of the Company and which are to be sold and net sale proceeds are to be paid to the company are and treated as treasury shares and reduced from other equity.
8 Borrowings:
Ind AS 109 requires transaction costs incurred towards origination of borrowings to be deducted from the carrying amount of borrowings on initial recognition. These costs are recognised in statement of profit or loss over the tenure of the borrowings as part of the interest expense by applying the effective interest method.
Under the previous GAAP these transactions costs were amortised on a straight-line basis over the period of loan.
9 Security Deposit and Employee Retention Deposits
Security deposits and Employee Retention Deposits were recognised at transaction value under previous GAAP. Based on Ind AS 109 these have been recognised at amortised cost. The resultant Ind AS adjustments have been given in retained earnings.
10 Deferred Tax
The company under previous GAAP calculated deferred tax based on income statement approach whereby tax effect of timing differences as a consequence of any mismatch between accounting income and taxable income were recognized. Based on Ind AS 12 the company has calculated deferred tax based on balance sheet approach which focuses on temporary differences between carrying amount of an asset or liability in the balance sheet and its tax base.
11 Proposed Dividends:
Under the previous GAAP dividends proposed by the board of directors after the balance sheet date but before the approval of the financial statements were considered as adjusting events. Accordingly, provision for proposed dividend was recognised as a liability. Under Ind AS such dividends are recognised when the same is approved by the shareholders in the general meeting.

Notesto the financial statements for the year ended 31st March, 2017
152 45th Annual Report 2016-17
Reconciliation of profit and loss for the year ended March 31, 2016
` in lakhs
ParticularsNote No.
As per Previous GAAP
Impact Ind AS
As per Ind AS
Revenue from Operations 1 100,246.30 2,387.51 102,633.81
Other Income 2,3 5,163.14 1,077.53 6,240.67
Total Income 105,409.44 3,465.04 108,874.48
Expenses
Cost of Materials Consumed 58,229.26 - 58,229.26
Purchases of Stock-in-Trade 266.61 - 266.61
Changes in inventories of finished goods, Stock-In-Trade and work in progress 3,439.87 - 3,439.87
Other manufacturing expenses 6,252.21 - 6,252.21
Employee Benefits Expense 7,780.42 111.74 7,892.16
Finance costs 3,283.76 (111.40) 3,172.36
Depreciation and amortisation expense 3,405.07 (12.60) 3,392.47
Other expenses 11,145.66 2,864.29 14,009.95
Total expenses 93,802.86 2,852.03 96,654.89
Profit before tax 11,606.58 613.01 12,219.59
Tax Expenses:
Income Tax - Current 2,700.00 - 2,700.00
Deferred Tax Liabilities /(Asset) (185.33) (20.86) (206.19)
MAT Credit entitlement (2,030.00) - (2,030.00)
484.67 (2.86) 463.81
Profit for the year 11,121.91 633.87 11,755.78
Other Comprehensive income 4
(i) Items that will not be reclassified subsequently to profit or loss - 52.76 52.76
(ii) Income tax relating to items that will not be reclassified to profit or loss reclassified to profit or loss - (18.26) (18.26)
- 34.50 34.50
Total Comprehensive Income for the year 11,121.91 668.37 11,790.28

CO
MPA
NY
OV
ERV
IEW STA
TUTO
RY R
EPOR
TS FINA
NC
IAL STA
TEMEN
TS (Stand
alon
e) NO
TICE
Notesto the financial statements for the year ended 31st March, 2017
Notes
Nava Bharat Ventures Limited 153
Explanatory Notes:
1 Revenue recognition:
Under previous GAAP sale of goods was presented as net of excise duty. However, under Ind AS sale of goods includes excise duty. Thus, sale of goods under Ind AS has increased with a corresponding increase in other expenses.
Further prompt payment rebate extended to energy customers which was reported as finance cost under previous GAAP is netted of from Sale of energy as per Ind AS.
2 Other Income - Fair Valuation Gain:
Interest and other income arising as a result differences on account of fair valuation of various financial assets and liabilities have been credited to Profit and Loss.
3 Guarantee Commission:
Guarantee Commission net of forex gain has been recognised based on Ind AS 109.
4 Defined Benefit:
Under Ind AS actuarial gains on remeasurement of defined benefit obligations are recognised in other comprehensive income. Under previous GAAP the company recognised such remeasurements in profit or loss. However, this has no impact on total comprehensive income
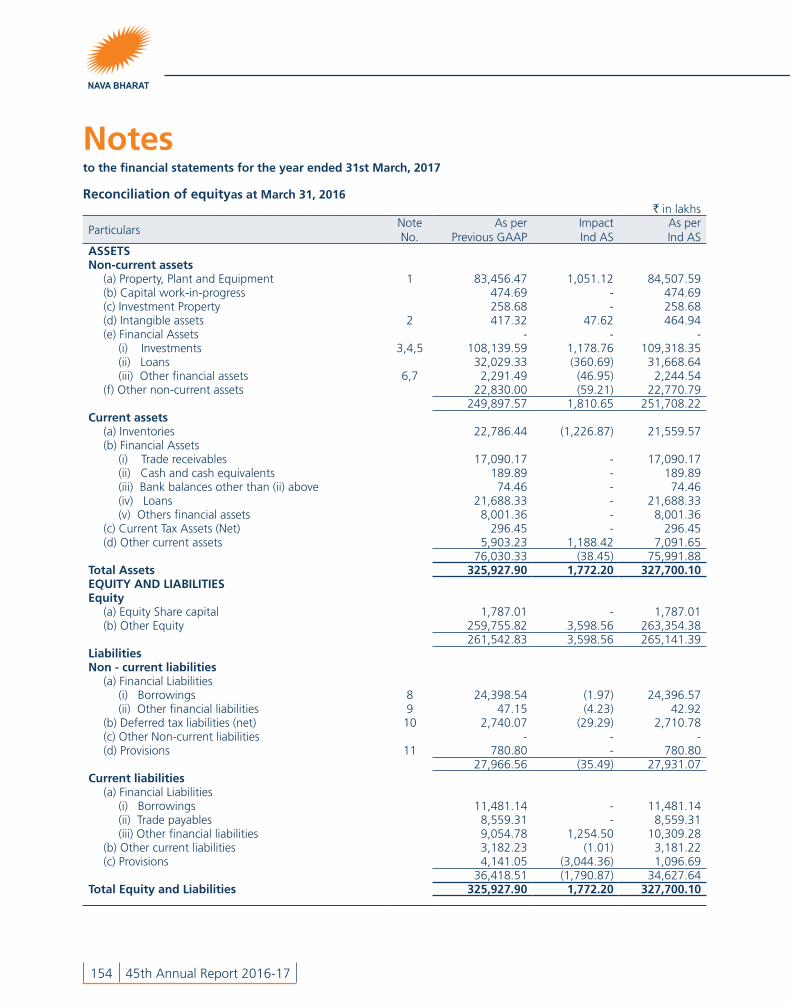
Notesto the financial statements for the year ended 31st March, 2017
154 45th Annual Report 2016-17
Reconciliation of equityas at March 31, 2016` in lakhs
ParticularsNote No.
As per Previous GAAP
Impact Ind AS
As per Ind AS
ASSETSNon-current assets
(a) Property, Plant and Equipment 1 83,456.47 1,051.12 84,507.59 (b) Capital work-in-progress 474.69 - 474.69 (c) Investment Property 258.68 - 258.68(d) Intangible assets 2 417.32 47.62 464.94 (e) Financial Assets - - -
(i) Investments 3,4,5 108,139.59 1,178.76 109,318.35(ii) Loans 32,029.33 (360.69) 31,668.64 (iii) Other financial assets 6,7 2,291.49 (46.95) 2,244.54
(f) Other non-current assets 22,830.00 (59.21) 22,770.79 249,897.57 1,810.65 251,708.22
Current assets(a) Inventories 22,786.44 (1,226.87) 21,559.57(b) Financial Assets
(i) Trade receivables 17,090.17 - 17,090.17 (ii) Cash and cash equivalents 189.89 - 189.89(iii) Bank balances other than (ii) above 74.46 - 74.46 (iv) Loans 21,688.33 - 21,688.33 (v) Others financial assets 8,001.36 - 8,001.36
(c) Current Tax Assets (Net) 296.45 - 296.45 (d) Other current assets 5,903.23 1,188.42 7,091.65
76,030.33 (38.45) 75,991.88 Total Assets 325,927.90 1,772.20 327,700.10 EQUITY AND LIABILITIESEquity
(a) Equity Share capital 1,787.01 - 1,787.01(b) Other Equity 259,755.82 3,598.56 263,354.38
261,542.83 3,598.56 265,141.39LiabilitiesNon - current liabilities
(a) Financial Liabilities(i) Borrowings 8 24,398.54 (1.97) 24,396.57 (ii) Other financial liabilities 9 47.15 (4.23) 42.92
(b) Deferred tax liabilities (net) 10 2,740.07 (29.29) 2,710.78 (c) Other Non-current liabilities - - - (d) Provisions 11 780.80 - 780.80
27,966.56 (35.49) 27,931.07 Current liabilities
(a) Financial Liabilities(i) Borrowings 11,481.14 - 11,481.14 (ii) Trade payables 8,559.31 - 8,559.31 (iii) Other financial liabilities 9,054.78 1,254.50 10,309.28
(b) Other current liabilities 3,182.23 (1.01) 3,181.22 (c) Provisions 4,141.05 (3,044.36) 1,096.69
36,418.51 (1,790.87) 34,627.64Total Equity and Liabilities 325,927.90 1,772.20 327,700.10
CO
MPA
NY
OV
ERV
IEW STA
TUTO
RY R
EPOR
TS FINA
NC
IAL STA
TEMEN
TS (Stand
alon
e) NO
TICE
Notesto the financial statements for the year ended 31st March, 2017
Notes
Nava Bharat Ventures Limited 155
Explanatory Notes:
1 Capital Spares:
Spares which meet the recognition criteria of Property Plant and Equipment has been reduced from Inventories and reclassified as Property Plant and Equipment (net of accumulated depreciation).
2 Intangible Assets:
Under previous GAAP intangibles were generally amortised for 10 years. Based on Ind AS 38 Intangibles are amortised based on effective useful life.
As a result, the written down value of Water drawing rights have been remeasured and shown under intangible assets.
3 Guarantee Commission:
The company has issued financial guarantees on behalf of its subsidiaries for borrowings taken by them and also for performance guarantees. As on the date of transition the company has recognised financial guarantee obligation at fair value and considered the same as an additional investment in subsidiaries.
4 Non-current investments:
The company has decided to classify non-current investments other than investment in subsidiaries as Financial Assets which are measured at fair value with gains or losses recognised in profit and loss (FVTPL).
As per previous GAAP these are carried at cost. However, provision for permanent diminution in value is made to recognize any decline other than temporary in value of investments. As per Ind AS 109 all Equity Investments within the scope of Ind AS 109 are measured at Fair Value with the default recognition of gains and losses in Profit and Loss (FVTPL).
5 Loan to employees and Non-corporate entities:
Company has given interest free loans to employees. Further loans have been provided to non-corporate entities at below market interest rates. Under previous GAAP these loans have been accounted at transaction price. Based on Ind AS 109 such loans have been fair valued and measured at amortised cost. The resultant difference between carrying amount of those loans and the fair value as on date of transition is recognised in retained earnings.
6 Security deposits:
Rental and water security deposits were recognised at transaction value under previous GAAP. Based on Ind AS 109 these security deposits have to be recognised at amortised cost and the difference between fair value and carrying cost is to be treated as prepaid lease rental. Further the difference amount relating to period before date of transition to Ind AS is recognised in retained earnings.
7 Treasury Shares:
Own fully paid equity shares held by the company, pursuant to order of Hon’ble High Court of Andhra Pradesh dated 30.12.1996 in the Scheme of amalgamation of Nav Chrome Limited with the company, which are vested in a Trustee for the benefit of the Company and which are to be sold and net sale proceeds are to be paid to the company are and treated as treasury shares and reduced from other equity.
8 Borrowings:
Ind AS 109 requires transaction costs incurred towards origination of borrowings to be deducted from the carrying amount of borrowings on initial recognition. These costs are recognised in statement of profit or loss over the tenure of the borrowings as part of the interest expense by applying the effective interest method.
Under the previous GAAP these transactions costs were amortised on a straight-line basis over the period of loan.
Notesto the financial statements for the year ended 31st March, 2017
156 45th Annual Report 2016-17
9 Security Deposits and Employee Retention Deposits:
Security deposits and Employee Retention Deposits were recognised at transaction value under previous GAAP. Based on Ind AS 109 these have been recognised at amortised cost. The resultant Ind AS adjustments have been given in retained earnings.
10 Deferred Tax:
The company under previous GAAP calculated deferred tax based on income statement approach whereby tax effect of timing differences as a consequence of any mismatch between accounting income and taxable income were recognized. Based on Ind AS 12 the company has calculated deferred tax based on balance sheet approach which focuses on temporary differences between carrying amount of an asset or liability in the balance sheet and its tax base.
11 Proposed Dividends:
Under the previous GAAP dividends proposed by the board of directors after the balance sheet date but before the approval of the financial statements were considered as adjusting events. Accordingly, provision for proposed dividend was recognised as a liability. Under Ind AS such dividends are recognised when the same is approved by the shareholders in the general meeting.
per our report of even date for and on behalf of the Boardfor Brahmayya & Co.,Chartered AccountantsFirm’s Registration Number: 000513S G.R.K. Prasad
Executive DirectorP. ChandramouliPartner T. Hari Babu P. Trivikrama PrasadMembership Number: 025211 Chief Financial Officer Managing Director
VSN RajuPlace: Hyderabad Company Secretary & D. AshokDate : May 27, 2017 Vice President Chairman

CO
MPA
NY
OV
ERV
IEW STA
TUTO
RY R
EPOR
TS FINA
NC
IAL STA
TEMEN
TS (Stand
alon
e) NO
TICE
Notesto the financial statements for the year ended 31st March, 2017
Notes
Nava Bharat Ventures Limited 157
Form
AO
C-I
: St
atem
ent
cont
aini
ng s
alie
nt f
eatu
res
of t
he fi
nanc
ial s
tate
men
ts o
f Su
bsid
iarie
s an
d A
ssoc
iate
Com
pani
es f
or t
he y
ear
endi
ng 3
1st
Mar
ch, 2
017
(Pur
suan
t to
firs
t pr
ovis
o to
Sub
-Sec
tion
(3) o
f Se
ctio
n 12
9 re
ad w
ith R
ule
5 of
Com
pani
es (A
ccou
nts)
Rul
es, 2
014)
Part
A: S
ubsi
diar
ies
` in
lakh
s
Nam
e of
the
su
bsid
iary
Repo
rtin
g C
urre
ncy
Exch
ange
ra
teon
the
last
da
te o
f th
ere
leva
ntfin
anci
al
year
Shar
eC
apita
l
Rese
rves
and
su
rplu
s
Tota
lA
sset
sTo
tal
Liab
ilitie
sIn
vest
men
ts
Turn
over
Profi
t/(L
oss)
bef
ore
Tax
atio
n
Prov
isio
n f
or
taxa
tion
Profi
t a
fter
taxa
tion
Prop
osed
Div
iden
d
% o
fSh
are
hold
ing
Nav
a Bh
arat
En
ergy
Indi
a Li
mite
dIN
R -
2
0,00
0.00
3
6,16
9.37
85,
509.
58
85,
509.
58
-
28,
603.
97 2
,529
.14
1.3
0 2
,527
.84
-
100
.00
Nav
a Bh
arat
Pr
ojec
ts L
imite
dIN
R -
9
,080
.40
15,
119.
81 2
4,30
0.42
24,
300.
42 1
5,80
1.50
7
62.5
6 1
95.4
310
1.38
94.
05
-
100
.00
Brah
man
i In
frat
ech
Priv
ate
Lim
ited
INR
-
6,3
12.5
0 2
,033
.32
11,
470.
25 1
1,47
0.25
6,9
98.6
0 5
14.8
9 3
78.0
2 1
56.8
4 2
21.1
8 -
6
5.74
Nav
a Bh
arat
(S
inga
pore
) Pte
. Li
mite
dU
S$64
.845
1,02
,844
.17
(5,0
49.5
6) 1
,66,
326.
51
1,66
,326
.51
1,31
,501
.86
10,
261.
26
(868
.82)
467
.98
(1,3
36.8
0) -
1
00.0
0
Maa
mba
C
ollie
ries
Lim
ited
US$
64.8
451,
25,4
99.2
9 (5
5,52
1.27
) 5
,26,
903.
44
5,26
,903
.44
-6,
942.
60 1
,715
.91
318.
851,
397.
06 -
6
4.69
Nav
a En
ergy
Pte
. Li
mite
dU
S$64
.845
0.6
5 (5
11.4
3) 5
,284
.93
5,28
4.93
0.5
8 1
,890
.74
(493
.23)
-
(493
.23)
-
100
.00
Nav
a A
gro
Pte.
Li
mite
dU
S$64
.845
0.6
5 (1
.61)
0.6
7 0
.67
0.6
7 -
(1
.61)
-
(1.6
1) -
1
00.0
0
Kar
iba
Suga
r Li
mite
dU
S$64
.845
0.6
7 44
0.43
7.33
7.33
-
-
(45.
63)
-
(45.
63)
-
100
.00
NB
Tana
gro
Lim
ited
US$
64.8
450.
65 -
0.
650.
65 -
-
-
-
-
-
1
00.0
0
NB
Rufij
i Lim
ited
US$
64.8
45 -
-
-
-
-
-
-
-
-
1
00.0
0
Nav
a En
ergy
Za
mbi
a Li
mite
dU
S$64
.845
0.5
2 48
.36
4,3
70.7
7 4
,370
.77
-
4,6
69.5
0 1
65.4
3 62
.16
103.
27 -
1
00.0
0

158 45th Annual Report 2016-17
Notes:
1. Names of subsidiaries which are yet to commence operations
Nava Energy Pte. Limited
NB Tanagro Limited
NB Rufiji Limited
2. Names of subsidiaries which have been liquidated or sold during the year
Nava Bharat Realty Limited
Nava Bharat Sugar and Bio Fuels Limited
Nava Bharat Lao Energy Pte. Limited
Namphak Power Company Limited
Part B: Associates
Name of AssociateKinnera Power Company Private Limited
1. Latest Audited Balance Sheet Date 31st March, 2016
2. Shares of the Associate held by the company on the year end:
Number of shares 25,844
Amount of Investment in Associate ` 2.58 lakhs
Extent of Holding 26%.
3. Description of how there is significant influence Not applicable
4. Reason why the associate is not consolidated There is no economic interest as it is intended to dispose off the stake in this Company in the near future.
5. Networth attributable to Shareholding as per latest audited Balance Sheet -
6. Loss for the year
(i) Considered in Consolidation Nil
(ii) Not considered in Consolidation -
1. Name of associate which is yet to commence operations : Nil
2. Names of associates or joint ventures which have been liquidated or sold during the year : Nil
per our report of even date for and on behalf of the Boardfor Brahmayya & Co.,Chartered AccountantsFirm’s Registration Number: 000513S G.R.K. Prasad
Executive DirectorP. ChandramouliPartner T. Hari Babu P. Trivikrama PrasadMembership Number: 025211 Chief Financial Officer Managing Director
VSN RajuPlace: Hyderabad Company Secretary & D. AshokDate : May 27, 2017 Vice President Chairman
CO
MPA
NY
OV
ERV
IEW STA
TUTO
RY R
EPOR
TS FINA
NC
IAL STA
TEMEN
TS NO
TICE
Independent Auditors’ Report
Nava Bharat Ventures Limited 159
Independent auditors’ report
To The Members of Nava Bharat Ventures LimitedHyderabad.
REPORT ON THE CONSOlIDATED FINANCIAl STATEMENTS
We have audited the accompanying consolidated Ind AS financial statements of NAVA BHARAT VENTURES LIMITED (hereinafter referred to as "the Holding Company") and its subsidiaries (the Holding Company and its subsidiaries together referred to as "the Group") comprising the Consolidated Balance Sheet as at 31st March, 2017, the Consolidated Statement of Profit and Loss (including other comprehensive income), the Consolidated Cash Flow Statement, the Consolidated Statement of Changes in Equity, for the year then ended, and a summary of the significant accounting policies and other explanatory information (hereinafter referred to as "the consolidated financial statements").
MANAGEMENT'S RESPONSIBIlITY FOR THE CONSOlIDATED FINANCIAl STATEMENTS
The Holding Company's Board of Directors is responsible for the preparation of these consolidated financial statements in terms of the requirements of the Companies Act, 2013 (hereinafter referred to as "the Act") that give a true and fair view of the consolidated financial position, consolidated financial performance (including other comprehensive income), consolidated cash flows and consolidated statement of changes in equity of the Group in accordance with the accounting principles generally accepted in India, including the Accounting Standards prescribed under Section 133 of the Act, read with Rule 7 of the Companies (Accounts) Rules, 2014 / Indian Accounting Standards specified under Section 133 of the Act. The respective Board of Directors of the companies included in the Group are responsible for maintenance of adequate accounting records in accordance with the provisions of the Act for safeguarding the assets of the Group and for preventing and detecting frauds and other irregularities; the selection and application of appropriate accounting policies; making judgments and estimates that are reasonable and prudent; and the design, implementation and maintenance of adequate internal financial controls, that were operating effectively for ensuring the accuracy and completeness of the accounting records, relevant to the preparation and
presentation of the financial statements that give a true and fair view and are free from material misstatement, whether due to fraud or error, which have been used for the purpose of preparation of the consolidated financial statements by the Directors of the Holding Company, as aforesaid.
AUDITOR'S RESPONSIBIlITY
Our responsibility is to express an opinion on these consolidated financial statements based on our audit. While conducting the audit, we have taken into account the provisions of the Act, the accounting and auditing standards and matters which are required to be included in the audit report under the provisions of the Act and the Rules made thereunder.
We conducted our audit in accordance with the Standards on Auditing specified under Section 143(10) of the Act. Those Standards require that we comply with ethical requirements and plan and perform the audit to obtain reasonable assurance about whether the consolidated financial statements are free from material misstatement.
An audit involves performing procedures to obtain audit evidence about the amounts and the disclosures in the consolidated financial statements. The procedures selected depend on the auditor's judgment, including the assessment of the risks of material misstatement of the consolidated financial statements, whether due to fraud or error. In making those risk assessments, the auditor considers internal financial control relevant to the Holding Company's preparation of the consolidated financial statements that give a true and fair view in order to design audit procedures that are appropriate in the circumstances. An audit also includes evaluating the appropriateness of the accounting policies used and the reasonableness of the accounting estimates made by the Holding Company's Board of Directors, as well as evaluating the overall presentation of the consolidated financial statements.
We believe that the audit evidence obtained by us and the audit evidence obtained by the other auditors in terms of their reports referred to in sub-paragraph (a) of the Other Matters paragraph below, is sufficient and appropriate to provide a basis for our audit opinion on the consolidated financial statements.

160 45th Annual Report 2016-17
OPINION
In our opinion and to the best of our information and according to the explanations given to us and based on the consideration of reports of other auditors on separate financial statements and on the other financial information of the subsidiaries the aforesaid consolidated financial statements give the information required by the Act in the manner so required and give a true and fair view in conformity with the accounting principles generally accepted in India, of the consolidated state of affairs (financial position) of the Group as at 31st March, 2017, and their consolidated profit (financial performance including other comprehensive income), their consolidated cash flows and consolidated statement of changes in equity for the year ended on that date.
EMPHASIS OF MATTER
We draw attention to the following matters in the Notes to the financial statements:
(a) Note 52 in the Consolidated Financial Statements on Development of Special Economic Zone and the arbitration award relating to the dispute with the Co-Developer.
(b) Note 51 in the Consolidated Financial Statements on attachment of the investments of one of the subsidiaries.
Our opinion is not modified in respect of these matters.
OTHER MATTERS
a) We did not audit the Consolidated Financial Statements of one of the subsidiaries viz., Nava Bharat (Singapore) Pte. Ltd. Singapore (the group), whose financial statements reflect total assets of USD 516,381,227 equivalent to ` 322,712.45 lakhs, total revenue of USD 69,939,096 equivalent to ̀ 43,708.45 lakhs and net cash flows amounting to USD 352,104 equivalent to ` 220.05 lakhs for the year ended on that date, as considered in the consolidated financial statements.
Financial statements of 5 Foreign Companies considered for Consolidation have been prepared in accordance with accounting principles generally accepted in their respective countries and which have been audited by other auditors under generally accepted auditing standards applicable in their respective countries. The Company’s management has converted the financial statements of such subsidiaries located outside India from accounting principles generally accepted in their respective countries to
accounting principles generally accepted in India. We have audited these conversion adjustments made by the Company’s management. Our opinion in so far as it relates to the balances and affairs of such subsidiaries located outside India is based on the report of other auditors and the conversion adjustments prepared by the management of the Company and audited by us.
The auditors of Nava Bharat (Singapore) Pte. ltd. Singapore (the Company) without qualifying their opinion on the financial Statements drew the attention to the following .
(a) Financial support from holding company for working capital and loans:
The Company is dependent on its holding company to give financial support for its ongoing Investments. In addition, the subsidiaries were in their preliminary stages of operations. Therefore, the validity of the going concern assumption on which the financial statements are prepared depends on the successful generation of income from these new businesses and continuous availability of the financial support from the holding company. The holding company undertakes to give continuous financial support to meet its obligation as and when required.
(b) Amount due from subsidiaries:
As mentioned above, the subsidiaries are in their initial stages of operations. The amounts due from subsidiaries are dependent on the outcome of their business and the directors are of the view that the business of these subsidiaries will be successful. In the event that these outcomes are not favourable, allowances for impairment for these receivables need to be done during subsequent years.
Our opinion above on the consolidated financial statements, and our report on Other Legal and Regulatory Requirements below, is not modified in respect of the above matters with respect to our reliance on the work done and the reports of the other auditors and the financial statements certified by the Management.
REPORT ON OTHER lEGAl AND REGUlATORY REQUIREMENTS
As required by Section 143(3) of the Act, we report, to the extent applicable, that:
a) We have sought and obtained all the information and explanations which to the best of our knowledge and belief were necessary for the purposes of our audit of the aforesaid consolidated financial statements.

CO
MPA
NY
OV
ERV
IEW STA
TUTO
RY R
EPOR
TS FINA
NC
IAL STA
TEMEN
TS NO
TICE
Independent Auditors’ Report
Nava Bharat Ventures Limited 161
b) In our opinion, proper books of account as required by law relating to preparation of the aforesaid consolidated financial statements have been kept so far as it appears from our examination of those books and the reports of the other auditors.
c) The Consolidated Balance Sheet, the Consolidated Statement of Profit and Loss, the Consolidated Cash Flow Statement, and Consolidated Statement of Changes in Equity dealt with by this Report are in agreement with the relevant books of account maintained for the purpose of preparation of the consolidated financial statements.
d) In our opinion, the aforesaid consolidated financial statements comply with the Accounting Standards specified under Section 133 of the Act, read with Rule 7 of the Companies (Accounts) Rules, 2014 /Indian Accounting Standards specified under Section 133 of the Act.
e) On the basis of the written representations received from the directors of the Holding Company as on 31st March, 2017 taken on record by the Board of Directors of the Holding Company and the reports of the statutory auditors of its subsidiary companies incorporated in India, none of the directors of the Group companies, incorporated in India is disqualified as on 31st March 2017 from being appointed as a director in terms of Section 164 (2) of the Act.
f) With respect to the adequacy of the internal financial controls over financial reporting of the Holding Company, its subsidiary companies incorporated in India and the operating effectiveness of such controls, refer to our separate Report in “Annexure A”.
g) With respect to the other matters to be included in the Auditor's Report in accordance with Rule 11 of the Companies (Audit and Auditor's) Rules, 2014, in our opinion and to the best of our information and according to the explanations given to us:
i) The consolidated financial statements disclose the impact of pending litigations on the consolidated financial position of the Group - Refer Note 33 to the consolidated financial statements.
ii) The Group did not have any material foreseeable losses on long-term contracts including derivative contracts during the year ended 31st March, 2017 .
iii) There has been no delay in transferring amounts to the Investor Education and Protection Fund by the Holding Company and its subsidiary companies incorporated in India during the year ended 31st March 2017.
for Brahmayya & Co.,Chartered Accountants
Firm’s Registration No.000513S
P. ChandramouliPlace : Hyderabad PartnerDate : May 27, 2017 Membership No.025211

162 45th Annual Report 2016-17
Report on the Internal Financial Controls under Clause (i) of Sub-section 3 of Section 143 of the Companies Act, 2013 (“the Act”)
In conjunction with our audit of consolidated financial statements of the company as of and for the year ended 31 March 2017, we have audited the internal financial controls over financial reporting of NAVA BHARAT VENTURES LIMITED, HYDERABAD (“the Holding Company”) and its subsidiary companies which are incorporated in India as of that date.
MANAGEMENT’S RESPONSIBIlITY FOR INTERNAl FINANCIAl CONTROlS
The respective Board of Directors of the Holding Company and its subsidiary companies, which are companies incorporated in India, are responsible for establishing and maintaining internal financial controls based on the internal control over financial reporting criteria established by the Company considering the essential components of internal control stated in the Guidance Note on Audit of Internal Financial Controls over Financial Reporting issued by the Institute of Chartered Accountants of India (‘ICAI’). These responsibilities include the design, implementation and maintenance of adequate internal financial controls that were operating effectively for ensuring the orderly and efficient conduct of its business, including adherence to company’s policies, the safeguarding of its assets, the prevention and detection of frauds and errors, the accuracy and completeness of the accounting records, and the timely preparation of reliable financial information, as required under the Companies Act, 2013.
AUDITORS’ RESPONSIBIlITY
Our responsibility is to express an opinion on the Company's internal financial controls over financial reporting based on our audit. We conducted our audit in accordance with the Guidance Note on Audit of Internal Financial Controls over Financial Reporting (the “Guidance Note”) and the Standards on Auditing, to the extent applicable to an audit of internal financial controls, both applicable to an audit of Internal Financial Controls and, both issued by the Institute of Chartered Accountants of India. Those Standards and the Guidance Note require that we comply with ethical requirements and plan and perform the audit to obtain reasonable assurance about whether adequate internal financial controls over financial reporting was established and maintained and if such controls operated effectively in all material respects.
Our audit involves performing procedures to obtain audit evidence about the adequacy of the internal financial controls system over financial reporting and their operating effectiveness. Our audit of internal financial controls over financial reporting included obtaining an understanding of internal financial controls over financial reporting, assessing the risk that a material weakness exists, and testing and evaluating the design and operating effectiveness of internal control based on the assessed risk. The procedures selected depend on the auditor’s judgment, including the assessment of the risks of material misstatement of the financial statements, whether due to fraud or error.
We believe that the audit evidence we have obtained is sufficient and appropriate to provide a basis for our audit opinion.
MEANING OF INTERNAl FINANCIAl CONTROlS OVER FINANCIAl REPORTING
A company's internal financial control over financial reporting is a process designed to provide reasonable assurance regarding the reliability of financial reporting and the preparation of financial statements for external purposes in accordance with generally accepted accounting principles. A company's internal financial control over financial reporting includes those policies and procedures that:
1. pertain to the maintenance of records that, in reasonable detail, accurately and fairly reflect the transactions and dispositions of the assets of the company;
2. provide reasonable assurance that transactions are recorded as necessary to permit preparation of financial statements in accordance with generally accepted accounting principles, and that receipts and expenditures of the company are being made only in accordance with authorisations of management and directors of the company; and
Annexure to the auditors’ report
CO
MPA
NY
OV
ERV
IEW STA
TUTO
RY R
EPOR
TS FINA
NC
IAL STA
TEMEN
TS NO
TICE
Independent Auditors’ Report
Nava Bharat Ventures Limited 163
3. provide reasonable assurance regarding prevention or timely detection of unauthorised acquisition, use, or disposition of the company's assets that could have a material effect on the financial statements.
INHERENT lIMITATIONS OF INTERNAl FINANCIAl CONTROlS OVER FINANCIAl REPORTING
Because of the inherent limitations of internal financial controls over financial reporting, including the possibility of collusion or improper management override of controls, material misstatements due to error or fraud may occur and not be detected. Also, projections of any evaluation of the internal financial controls over financial reporting to future periods are subject to the risk that the internal financial control over financial reporting may become inadequate because of changes in conditions, or that the degree of compliance with the policies or procedures may deteriorate.
OPINION
In our opinion, the Holding Company and its subsidiary companies, which are companies incorporated in India, have, in all material respects, an adequate internal financial controls system over financial reporting and such internal financial controls over financial reporting were operating effectively as at 31 March 2017, based on the internal control over financial reporting criteria established by the Company considering the essential components of internal control stated in the Guidance Note on Audit of Internal Financial Controls Over Financial Reporting issued by the Institute of Chartered Accountants of India.
for Brahmayya & Co.,Chartered Accountants
Firm’s Registration No.000513S
P. ChandramouliPlace : Hyderabad PartnerDate : May 27, 2017 Membership No.025211

164 45th Annual Report 2016-17
Consolidated Balance sheet AS AT MARCH 31, 2017
` in lakhs
ParticularsNote No.
As at 31.03.2017 As at 31.03.2016 As at 01.04.2015
ASSETSNon-current assets(a) Property, Plant and Equipment 4 178,129.93 178,487.75 173,181.64 (b) Capital work-in-progress 396,929.32 357,398.51 224,650.59 (c) Investment Property 6 252.98 258.68 264.38 (d) Goodwill 7 35,859.23 36,636.19 34,559.68 (e) Other intangible assets 5 533.87 493.93 452.53 (f) Financial Assets
(i) Investments 8 1,685.68 1,715.00 1,668.81 (ii) Loans 9 2,674.86 3,190.06 3,056.27 (iii) Other financial assets 10 6,288.99 2,291.70 2,378.74
(g) Deferred tax assets (net) 11 (1,260.31) 163.22 (2,889.38)(h) Other non-current assets 12 34,801.57 38,519.28 33,795.68 (i) Inventories 13 - - 16,221.22
655,895.12 619,154.32 487,340.17 Current assets(a) Inventories 14 39,978.22 40,676.74 46,957.04 (b) Financial Assets
(i) Investments 15 39,413.12 3,758.84 9,049.34 (ii) Trade receivables 16 35,232.62 20,843.68 13,531.85 (iii) Cash and cash equivalents 17 62,295.02 62,599.42 11,557.30 (iv) Bank balances other than (iii) above 18 2,360.23 3,634.65 2,362.73 (v) Loans 19 18.82 5,036.87 44.21 (vi) Others financial assets 20 5,180.14 3,916.42 2,980.75
(c) Current Tax Assets (Net) 1,403.68 638.50 1,024.13 (d) Other current assets 21 15,440.31 11,989.90 13,862.00
201,322.16 153,095.02 101,369.36 Total Assets 857,217.28 772,249.34 588,709.53 EQUITY AND LIABILITIESEquity (a) Equity Share capital 22 3,572.77 1,787.01 1,787.01 (b) Other Equity 23 324,013.02 320,459.13 293,262.94
327,585.79 322,246.14 295,049.96 Non Controlling Interests 27,568.31 27,496.17 25,627.86 LiabilitiesNon - Current Liabilities(a) Financial Liabilities
(i) Borrowings 24 357,463.67 323,531.52 31,102.41(ii) Other financial liabilities 25 21,856.43 17,295.55 16,566.63
(b) Other Non-current liabilities 26 - - 0.41 (c) Provisions 27 5,118.36 2,149.44 1,685.27
384,438.47 342,976.51 49,354.71 Current liabilities(a) Financial Liabilities
(i) Borrowings 28 11,233.02 14,745.23 11,432.27 (ii) Trade payables 29 11,265.84 15,016.05 79,716.74 (ii) Other financial liabilities 30 86,630.06 43,117.12 122,345.05
(b) Other current liabilities 31 7,244.42 5,092.61 3,537.90 (c) Provisions 32 700.36 1,102.00 1,330.09 (d) Current tax liabilities (net) 551.01 457.51 314.95
117,624.71 79,530.52 218,677.00 Contingent Liabilities and Commitments 33Total Equity and Liabilities 857,217.28 772,249.34 588,709.53 Notes to the financial statements 1-66
per our report of even date for and on behalf of the Boardfor Brahmayya & Co.,Chartered AccountantsFirm’s Registration Number: 000513S G.R.K. Prasad
Executive DirectorP. ChandramouliPartner T. Hari Babu P. Trivikrama PrasadMembership Number: 025211 Chief Financial Officer Managing Director
VSN RajuPlace: Hyderabad Company Secretary & D. AshokDate : May 27, 2017 Vice President Chairman

CO
MPA
NY
OV
ERV
IEW STA
TUTO
RY R
EPOR
TS FINA
NC
IAL STA
TEMEN
TS (Co
nso
lidated
) NO
TICE
Nava Bharat Ventures Limited 165
Consolidated statement of profit and lossFOR THE YEAR ENDED MARCH 31, 2017
` in lakhs
ParticularsNote No.
For the year ended31.03.2017
For the year ended31.03.2016
Revenue from Operations 34 138,092.98 161,249.73 Other Income 35 7,776.40 8,681.54 Total Income 145,869.38 169,931.27 Expenses
Cost of Materials Consumed 36 69,657.72 80,417.62 Purchases of Stock-in-Trade 37 404.17 723.53 Changes in inventories of finshed goods, Stock-In-Trade and work in progress 38 (3,251.92) 945.97 Other manufacturing expenses 39 14,864.02 11,267.72 Employee Benefits Expense 40 13,307.69 11,268.59Finance costs 41 8,651.18 8,767.57 Depreciation and amortisation expense 42 9,040.00 8,371.42Other expenses 43 24,995.27 20,186.60
Total expenses 137,668.13 141,949.02Profit before exceptional items and tax 8,201.25 27,982.25Exceptional items 48 7,859.63 - Profit before tax 16,060.88 27,982.25Tax Expenses:
Income Tax - Current 4,267.43 6,651.04 Deferred Tax Liability /(Asset) 11 1,673.70 (3,044.56)MAT Credit entitlement (587.21) (5,278.97)
5,353.92 (1,672.49)Profit for the year 10,706.96 29,654.74
Other Comprehensive income 44A. (i) Items that will not be reclassified subsequently to profit or loss 220.01 58.02 (ii) Income tax relating to items that will not be reclassified to profit or loss (74.35) (18.98)
145.66 39.04B. (i) Items that will reclassified to profit or loss (1,933.04) 3,056.02 (ii) Income tax relating to items that will be reclassified to profit or loss - - Other Comprehensive Income for the period (1,933.04) 3,056.02 Total Comprehensive Income for the period 8,919.58 32,749.80Profit for the period
Owners of the company 10,121.40 28,364.20Non controlling interests 585.56 1,290.54
10,706.96 29,654.74Other comprehensive income
Owners of the company (1,835.51) 3,905.92Non controlling interests 48.13 (810.86)
(1,787.38) 3,095.06Total comprehensive income for the period attributable to
Owners of the company 8,285.89 32,270.12Non controlling interests 633.69 479.68
8,919.58 32,749.80 Earnings per equity share from Continuing operations: 45Basic - ` 5.67 15.88 Diluted - ` 5.67 15.88 Notes to the financial statements 1-66
per our report of even date for and on behalf of the Boardfor Brahmayya & Co.,Chartered AccountantsFirm’s Registration Number: 000513S G.R.K. Prasad
Executive DirectorP. ChandramouliPartner T. Hari Babu P. Trivikrama PrasadMembership Number: 025211 Chief Financial Officer Managing Director
VSN RajuPlace: Hyderabad Company Secretary & D. AshokDate : May 27, 2017 Vice President Chairman
Balance sheet | statement of profit and loss

A. E
QU
ITY
SH
AR
E C
API
TAL
` in
lakh
s
For
the
perio
d/ye
ar e
nded
At
the
begi
nnin
gC
hang
e in
equ
ityA
t th
e en
d
Mar
ch 3
1, 2
017
1,7
87.0
1 1,
785.
76 3
,572
.77
Mar
ch 3
1, 2
016
1,7
87.0
1 -
1
,787
.01
Apr
il 01
, 201
5 1
,787
.01
-
1,7
87.0
1
B. O
THER
EQ
UIT
Y`
in lakh
s
Part
icul
ars
Cap
ital
Rese
rve
Cap
ital
Rede
mpt
ion
Rese
rve
Secu
ritie
s
Prem
ium
Rese
rve
Gen
eral
Re
serv
eTr
easu
ry
Shar
esO
ther
Re
serv
e
Surp
lus
In
St
atem
ent
of P
rofit
And
Lo
ss
Fore
ign
Cur
renc
y Tr
ansl
atio
n Re
serv
e
Act
uaria
l G
ain/
(Los
s)
-OC
I-To
tal
Bal
ance
as
at
Ap
ril 0
1, 2
015
60.
20
826
.39
26,
214.
22
87,
852.
41
(20
6.34
) 3
3.60
1
,69,
138.
84
9,3
43.6
2 -
2
,93,
262.
94
Profi
t fo
r th
e ye
ar -
-
-
-
-
-
28
,364
.20
-
-
28,3
64.2
0
Tran
sfer
to
gene
ral r
eser
ve -
-
-
1
,500
.00
-
-
(1,5
00.0
0) -
-
-
Div
iden
d on
Eq
uity
Cap
ital
-
-
-
-
-
-
(4,2
15.7
1) -
-
(4
,215
.71)
Cor
pora
te
Div
iden
d Ta
x -
-
-
-
-
-
(8
58.2
2) -
-
(8
58.2
2)
Oth
er
Com
preh
ensi
ve
inco
me
for
the
year
-
-
-
-
-
-
-
3,8
67.0
1 38
.91
3,90
5.92
Bal
ance
as
at
Mar
ch 3
1, 2
016
60.
20
826
.39
26,
214.
22
89,
352.
41
(20
6.34
) 3
3.60
1,
90,9
29.1
1 1
3,21
0.63
38
.91
3,2
0,45
9.13
Consolidated statement of changes in equityfor the year ended 31st March, 2017
166 45th Annual Report 2016-17

B. O
THER
EQ
UIT
Y`
in lakh
s
Part
icul
ars
Cap
ital
Rese
rve
Cap
ital
Rede
mpt
ion
Rese
rve
Secu
ritie
s
Prem
ium
Rese
rve
Gen
eral
Re
serv
eTr
easu
ry
Shar
esO
ther
Re
serv
e
Surp
lus
In
St
atem
ent
of P
rofit
And
Lo
ss
Fore
ign
Cur
renc
y Tr
ansl
atio
n Re
serv
e
Act
uaria
l G
ain/
(Los
s)
-OC
I-To
tal
Bal
ance
as
at
Mar
ch 3
1, 2
016
60.
20
826
.39
26,
214.
22
89,
352.
41
(20
6.34
) 3
3.60
1,
90,9
29.1
1 1
3,21
0.63
38
.91
3,2
0,45
9.13
Profi
t fo
r th
e pe
riod
-
-
-
-
-
-
10,
121.
40
-
-
10,
121.
40
Div
iden
d on
Eq
uity
Cap
ital
-
-
-
-
-
-
(2,5
29.4
3) -
-
(2
,529
.43)
Cor
pora
te
Div
iden
d Ta
x -
-
-
-
-
-
(5
14.9
3) -
-
(5
14.9
3)
Bonu
s is
sue
of
equi
ty s
hare
s -
-
-
(1
,785
.75)
-
-
-
-
-
(1,7
85.7
5)
Adj
ustm
ent
on a
ccou
nt
of r
emov
al o
f su
bsid
iary
-
-
-
-
-
-
98.
54
(0.0
9) (0
.34)
98.
11
Oth
er
Co
mp
reh
ensi
ve
inco
me
for
the
year
-
-
-
-
-
-
-
(1,
981.
07)
145
.56
(1,
835.
51)
Bal
ance
as
at
Mar
ch 3
1, 2
017
60.
20
826
.39
26,
214.
22
87,
566.
66
(20
6.34
) 3
3.60
1,
98,1
04.6
9
11,2
29.4
7 18
4.13
3,2
4,01
3.02
per
our
repo
rt o
f ev
en d
ate
for
and
on b
ehal
f of
the
Boa
rdfo
r B
rah
may
ya &
Co
.,C
hart
ered
Acc
ount
ants
Firm
’s Re
gist
ratio
n N
umbe
r: 0
0051
3SG
.R.K
. Pra
sad
Exec
utiv
e D
irect
orP.
Ch
and
ram
ou
liPa
rtne
rT.
Har
i Bab
uP.
Tri
vikr
ama
Pras
adM
embe
rshi
p N
umbe
r: 0
2521
1C
hief
Fin
anci
al O
ffice
rM
anag
ing
Dire
ctor
VSN
Raj
uPl
ace:
Hyd
erab
adC
ompa
ny S
ecre
tary
&D
. Ash
ok
Dat
e : M
ay 2
7, 2
017
Vic
e Pr
esid
ent
Cha
irman
Consolidated statement of changes in equityfor the year ended 31st March, 2017
CO
MPA
NY
OV
ERV
IEW STA
TUTO
RY IN
FOR
MA
TION
FINA
NC
IAL STA
TEMEN
TS - Co
nso
lidated
NO
TICE
Statement of changes in equity
Nava Bharat Ventures Limited 167
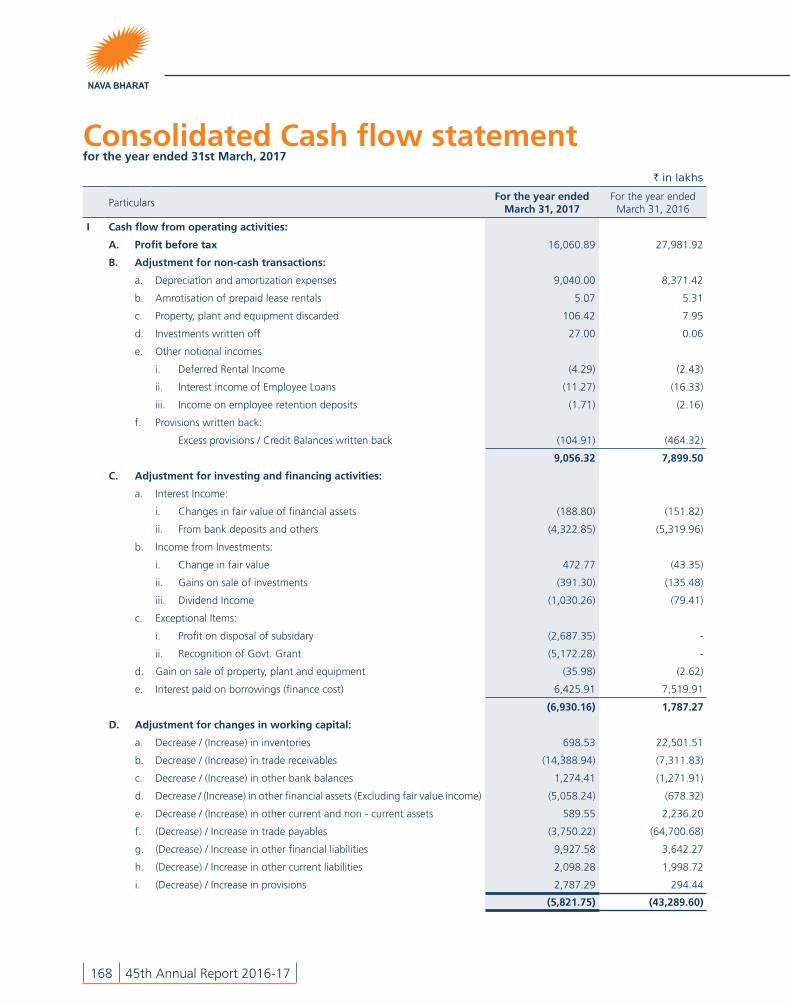
168 45th Annual Report 2016-17
Consolidated Cash flow statementfor the year ended 31st March, 2017
` in lakhs
ParticularsFor the year ended
March 31, 2017For the year ended
March 31, 2016
I Cash flow from operating activities:
A. Profit before tax 16,060.89 27,981.92
B. Adjustment for non-cash transactions:
a. Depreciation and amortization expenses 9,040.00 8,371.42
b. Amrotisation of prepaid lease rentals 5.07 5.31
c. Property, plant and equipment discarded 106.42 7.95
d. Investments written off 27.00 0.06
e. Other notional incomes
i. Deferred Rental Income (4.29) (2.43)
ii. Interest income of Employee Loans (11.27) (16.33)
iii. Income on employee retention deposits (1.71) (2.16)
f. Provisions written back:
Excess provisions / Credit Balances written back (104.91) (464.32)
9,056.32 7,899.50
C. Adjustment for investing and financing activities:
a. Interest Income:
i. Changes in fair value of financial assets (188.80) (151.82)
ii. From bank deposits and others (4,322.85) (5,319.96)
b. Income from Investments:
i. Change in fair value 472.77 (43.35)
ii. Gains on sale of investments (391.30) (135.48)
iii. Dividend Income (1,030.26) (79.41)
c. Exceptional Items:
i. Profit on disposal of subsidary (2,687.35) -
ii. Recognition of Govt. Grant (5,172.28) -
d. Gain on sale of property, plant and equipment (35.98) (2.62)
e. Interest paid on borrowings (finance cost) 6,425.91 7,519.91
(6,930.16) 1,787.27
D. Adjustment for changes in working capital:
a. Decrease / (Increase) in inventories 698.53 22,501.51
b. Decrease / (Increase) in trade receivables (14,388.94) (7,311.83)
c. Decrease / (Increase) in other bank balances 1,274.41 (1,271.91)
d. Decrease / (Increase) in other financial assets (Excluding fair value income) (5,058.24) (678.32)
e. Decrease / (Increase) in other current and non - current assets 589.55 2,236.20
f. (Decrease) / Increase in trade payables (3,750.22) (64,700.68)
g. (Decrease) / Increase in other financial liabilities 9,927.58 3,642.27
h. (Decrease) / Increase in other current liabilities 2,098.28 1,998.72
i. (Decrease) / Increase in provisions 2,787.29 294.44
(5,821.75) (43,289.60)

CO
MPA
NY
OV
ERV
IEW STA
TUTO
RY R
EPOR
TS FINA
NC
IAL STA
TEMEN
TS (Co
nso
lidated
) NO
TICE
Nava Bharat Ventures Limited 169
` in lakhs
ParticularsFor the year ended
March 31, 2017For the year ended
March 31, 2016
E. Cash generated from operations (A+B+C+D) 12,365.30 (5,620.92)
Less: Direct taxes paid (net of refunds) (4,773.27) (6,981.08)
Net cash flow from operating activities (I) 7,592.02 (12,602.00)
II. Cash flows from investing activities
a. Purchase of fixed assets, including CWIP (54,038.59) (145,239.48)
b. Proceeds from sale of fixed assets 4.86 14.34
c. Loans given 5,533.24 (5,126.45)
d. Investment in subsidiary (1.32) -
e. Purchase of financial instruments (Investments) (48,737.72) (9,871.88)
f. Proceeds from sale of financial instruments (investments) 13,996.82 15,592.59
g. Proceeds from sale of subsidary 6,801.92 -
h. Dividend Income received 1,030.26 79.41
i. Interest Income received 3,901.98 5,505.93
Net cash flow from / (used in) investing activities (II) (71,508.55) (139,045.53)
III. Cash flows from financing activities
a. Proceeds from long term borrowings 101,917.70 322,414.03
b. Repayment of long term borrowings (25,006.71) (112,252.28)
c. Proceeds from short term borrowings 1,658.39 5,164.50
d. Repayment of short term borrowings (5,170.60) (1,851.54)
e. Dividend paid for the year (2,538.12) (4,208.96)
f. Interest paid for the year (6,102.48) (7,658.55)
Net cash flow (used in) financing activities (III) 64,758.17 201,607.20
IV. Net (decrease) in cash and cash equivalents (I + II + III) 841.64 49,959.67
Cash and cash equivalents at the beginning of the year 62,599.42 11,557.30
Foreign Curreny Translation Reserve (1,146.04) 1,082.45
V. Cash and cash equivalents at the end of the year 62,295.02 62,599.42
VI. Components of cash and cash equivalents:
a. Cash on hand 24.42 24.44
b. Cheques, Drafts and Stamps on hand - -
c. With banks:
i. On Current Account 62,270.60 60,161.05
ii. On Deposits Accounts - 3.08
iii. On Deposit Account having original maturity less than tree months - 2,410.85
Total cash and cash equivalents (Note No.17) 62,295.02 62,599.42
per our report of even date for and on behalf of the Boardfor Brahmayya & Co.,Chartered AccountantsFirm’s Registration Number: 000513S G.R.K. Prasad
Executive DirectorP. ChandramouliPartner T. Hari Babu P. Trivikrama PrasadMembership Number: 025211 Chief Financial Officer Managing Director
VSN RajuPlace: Hyderabad Company Secretary & D. AshokDate : May 27, 2017 Vice President Chairman
Cash flow statement
Notesto the Consolidated financial statements for the year ended 31st March, 2017
170 45th Annual Report 2016-17
1 CORPORATE INFORMATION:
Nava Bharat Ventures Limited (“the Parent”) is a Company registered under the Companies Act, 1956 and was incorporated on November 07, 1972. The Company is listed on Bombay Stock Exchange (BSE) and National Stock Exchange (NSE). At present the Parent Company and its subsidiaries (“the Group”) are principally engaged in the business of manufacture of Ferro alloys, Sugar, Coal Mining and Generation of Power.
These Consolidated Financial Statements were approved by the Board of Directors and authorised for issue on May 27, 2017.
2 BASIS OF PREPARATION:
These are the first Consolidated Financial Statements prepared by the Group complying in all material respects with the notified Accounting Standards under the Companies (Indian Accounting Standards) Rules, 2015 as amended by the Companies (Indian Accounting Standards) (Amendment) Rules, 2016 and the relevant provisions of the Companies Act, 2013 and in accordance with the generally accepted accounting principles in India.
The Group has consistently applied the accounting policies used in the preparation of opening balance sheet as at April 01, 2015 throughout all periods presented in these financial statements, as if these policies had always been in effect and are covered by Ind AS 101 ‘’First-time adoption of Indian Accounting Standards’’. The transition was carried out from accounting principles generally accepted in India (‘’Previous GAAP’’) as defined in Ind AS 101. The reconciliation of effects of the transition as required by Ind AS 101 is disclosed in Note No 66 to these financial statements.
The financial statements have been prepared on a historical cost basis, except for financial instruments which have been measured at fair value at the end of each reporting period, as explained in the accounting policies mentioned below.
3 SIGNIFICANT ACCOUNTING POlICIES:
a) Basis of Consolidation
The consolidated financial statements comprise the financial statements of the parent company and its subsidiaries as at March 31, 2017.
i) Subsidiaries:
Subsidiaries are the entities over which the Group has control. The Group controls an entity when the Group is exposed or has rights to variable returns from its involvement with the entity and has the ability to affect those returns through its power to direct the relevant activities of the entity.
Consolidation of a subsidiary begins when the Group obtains control over the subsidiary and ceases when the Group loses control of the subsidiary.
Consolidation procedure:
a) Combine like items of assets, liabilities, equity, income, expenses and cash flows of the subsidiaries with those of the parent line by line.
b) Offset (eliminate) the carrying amount of the parent’s investment in each subsidiary and the parent’s portion of equity of each subsidiary. The excess of cost of investment over fair value of net identifiable assets of subsidiary is treated as Goodwill. If the fair value of the net identifiable assets of the subsidiary exceeds cost of investment then the excess is treated as Capital Reserve.
c) Eliminate in full intra group assets and liabilities, equity, income, expenses and cash flows relating to transactions between entities of the Group (profits or losses resulting from intra group transactions that are recognised in assets, such as inventory, property, plant and

CO
MPA
NY
OV
ERV
IEW STA
TUTO
RY R
EPOR
TS FINA
NC
IAL STA
TEMEN
TS (Co
nso
lidated
) NO
TICE
Notesto the Consolidated financial statements for the year ended 31st March, 2017
Notes
Nava Bharat Ventures Limited 171
equipment and intangible assets, are eliminated in full). Intra group losses may indicate an impairment that requires recognition in the consolidated financial statements. Ind AS 12 “Income Taxes” applies to temporary differences that arise from the elimination of profits and losses resulting from intra group transactions.
Profit and loss and each component of other comprehensive income (OCI) are attributed to equity holders of the parent of the Group and to the non-controlling interests, even if the results in the non-controlling interests having a deficit balance. When necessary, adjustments are made to the financial statements of subsidiaries to bring their accounting policies in line with the Group’s accounting policies. All intra-group assets and liabilities, equity, income, expenses and cash flows relating to transactions between of the Group are eliminated in full on consolidation.
Changes in ownership interest:
A change in the ownership interest of a subsidiary, without a loss of control, is accounted for as an equity transaction.
If the Group loses control over a subsidiary, it:
a. Derecognises the assets and liabilities of the subsidiary from the consolidated balance sheet;
b. Derecognises the carrying amount of any non-controlling interests;
c. Derecognises the cumulative translation differences recorded in equity;
d. Recognises the fair value of the consideration received;
e. Recognises the fair value of any investment retained;
f. Recognises any surplus or deficit in profit or loss;
g. Reclassifies the parent’s share of components previously recognised in OCI to profit or loss or retained earnings, as appropriate, as would be required if the Group had directly disposed of the related assets or liabilities.
b) Business Combinations:
In accordance with Ind AS 101 provisions relating to first time adoption, the Group has elected to apply Ind AS accounting for business combinations prospectively from 1 April 2015. As such, Previous GAAP balances relating to business combinations entered into before the date have been carried forward.
The group accounts for its business combinations under acquisition method of accounting. Acquisition related costs are recognised in profit and loss as incurred. The acquiree’s identifiable assets, liabilities and contingent liabilities that meet the condition for recognition are recognised at their fair values at the acquisition date.
Purchase consideration paid in excess of the fair value of net assets acquired is recognised as goodwill. Where the fair value of identifiable assets and liabilities exceed cost of acquisition, after reassessing the fair value of the net assets and contingent liabilities, the excess is recognised as capital reserve.
The interest of the non-controlling shareholders is initially measured either at fair value or at the non-controlling interests proportionate share of the acquiree’s identifiable net assets. The choice of measurement basis is made on an acquisition-by-acquisition basis. Subsequent to acquisition, the carrying amount of non-controlling interests is the amount of those interests at initial recognition plus the non-controlling interest’s share of subsequent changes in equity of subsidiaries.

Notesto the Consolidated financial statements for the year ended 31st March, 2017
172 45th Annual Report 2016-17
Business combinations arising from transfer of interest in entities that are under the common control are accounted at historical cost. The difference between consideration given and the aggregate historical carrying amounts of assets and liabilities of the acquired entity are recorded in shareholder’s equity.
c) The following subsidiary companies were considered in the Consolidated Financial Statements:
S. No
Name of the Company Place of Incorporation Percentage of Share Holding
DIRECT SUBSIDIARIES:
01. Nava Bharat Energy India Limited India 100.00
02. Nava Bharat Projects Limited India 100.00
03. Brahmani Infratech Private Limited India 65.74
04. Nava Bharat (Singapore) Pte. Limited Singapore 100.00
STEP DOWN SUBSIDIARIES:
01. Maamba Collieries Limited Zambia 64.69
02. Nava Energy Zambia Limited Zambia 100.00
03. Nava Energy Pte. Limited Singapore 100.00
04. Nava Agro Pte. Limited Singapore 100.00
Note: The following immaterial subsidiaries / associates are not considered for consolidation as there were no transactions in those companies.
01. Nava Bharat Realty Limited
02. Nava Bharat Sugar and Biofuels Limited
03. Kinnera Power Company Private Limited
04. Nava Bharat Tanagro Limited
05. Kariba Sugar Limited
d) Significant accounting estimates, assumptions and judgements:
The preparation of Group’s financial statements requires management to make accounting estimates, assumptions and judgements that affect the reported amounts of revenues, expenses, assets and liabilities, the accompanying disclosures of contingencies at the end of the reporting period. Uncertainty about these assumptions and estimates could result in outcomes that require a material adjustment to the carrying amounts of assets or liabilities affected in future periods.
Estimates and assumptions:
The key assumptions concerning the future and other key sources of estimation of uncertainty at the reporting date, that have a significant risk of causing a material adjustment to the carrying amounts of assets and liabilities within the next financial year, are described below. The Group based its assumptions and estimates on parameters available when the financial statements were prepared. Existing circumstances and assumptions about future developments, however, may change due to market change or circumstances arising that are beyond the control of the Group. Such changes are reflected in the assumptions when they occur.
i. Impairment of non-current assets:
Impairment exists when the carrying value of an asset or cash generating unit exceeds its recoverable amount, which is the higher of its fair value less cost of disposals and its value in use. The fair value less cost of disposals is calculated based on available data from binding sales transactions, conducted at arm’s
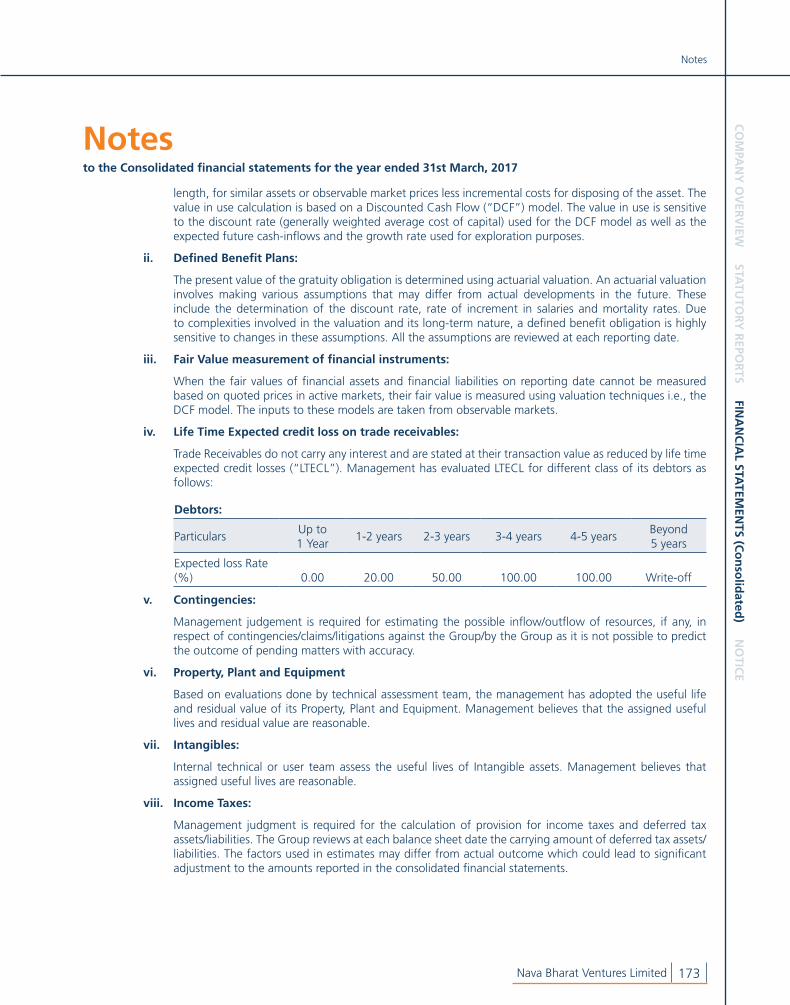
CO
MPA
NY
OV
ERV
IEW STA
TUTO
RY R
EPOR
TS FINA
NC
IAL STA
TEMEN
TS (Co
nso
lidated
) NO
TICE
Notesto the Consolidated financial statements for the year ended 31st March, 2017
Notes
Nava Bharat Ventures Limited 173
length, for similar assets or observable market prices less incremental costs for disposing of the asset. The value in use calculation is based on a Discounted Cash Flow (“DCF”) model. The value in use is sensitive to the discount rate (generally weighted average cost of capital) used for the DCF model as well as the expected future cash-inflows and the growth rate used for exploration purposes.
ii. Defined Benefit Plans:
The present value of the gratuity obligation is determined using actuarial valuation. An actuarial valuation involves making various assumptions that may differ from actual developments in the future. These include the determination of the discount rate, rate of increment in salaries and mortality rates. Due to complexities involved in the valuation and its long-term nature, a defined benefit obligation is highly sensitive to changes in these assumptions. All the assumptions are reviewed at each reporting date.
iii. Fair Value measurement of financial instruments:
When the fair values of financial assets and financial liabilities on reporting date cannot be measured based on quoted prices in active markets, their fair value is measured using valuation techniques i.e., the DCF model. The inputs to these models are taken from observable markets.
iv. Life Time Expected credit loss on trade receivables:
Trade Receivables do not carry any interest and are stated at their transaction value as reduced by life time expected credit losses (“LTECL”). Management has evaluated LTECL for different class of its debtors as follows:
Debtors:
ParticularsUp to 1 Year
1-2 years 2-3 years 3-4 years 4-5 yearsBeyond 5 years
Expected loss Rate (%) 0.00 20.00 50.00 100.00 100.00 Write-off
v. Contingencies:
Management judgement is required for estimating the possible inflow/outflow of resources, if any, in respect of contingencies/claims/litigations against the Group/by the Group as it is not possible to predict the outcome of pending matters with accuracy.
vi. Property, Plant and Equipment
Based on evaluations done by technical assessment team, the management has adopted the useful life and residual value of its Property, Plant and Equipment. Management believes that the assigned useful lives and residual value are reasonable.
vii. Intangibles:
Internal technical or user team assess the useful lives of Intangible assets. Management believes that assigned useful lives are reasonable.
viii. Income Taxes:
Management judgment is required for the calculation of provision for income taxes and deferred tax assets/liabilities. The Group reviews at each balance sheet date the carrying amount of deferred tax assets/liabilities. The factors used in estimates may differ from actual outcome which could lead to significant adjustment to the amounts reported in the consolidated financial statements.
Notesto the Consolidated financial statements for the year ended 31st March, 2017
174 45th Annual Report 2016-17
Judgements:
In the process of applying the Group’s accounting policies, management has made the following judgements, which have the most significant effect on the amounts recognised in the financial statements.
i. Operating lease commitments - Group as a lessee:
The Group has taken on lease certain commercial properties for its business operations and the lease rentals for the said properties are subject to escalations during the tenure of lease. However, as these escalations were in the nature of general inflation to compensate for the lessor’s expected inflationary cost increase, the Group is directly charging the lease payments to the statement of profit and loss instead of following straight line method of charging lease payments.
ii. Water Drawing Rights:
The Group has obtained the water drawing rights, for its power projects, from Government authorities initially for a period of 5 - 10 years as the case may be. The management of the Group believes that the water drawing rights will be extended further. Hence, the Group has considered the useful life of water pipelines as 40 years to amortise the erection cost of pipeline, in line with the life of thermal power plants.
iii. Provision for Dismantling and Environmental Rehabilitation obligations:
The Group has long-term remediation obligations comprising decommissioning, dismantling and restoration liabilities relating to its past operations which are based on the group's environmental management plans, in compliance with current environmental and regulatory requirements. Provisions for non-recurring remediation costs are made when there is a present obligation, it is probable that expenditure on remediation work will be required and the cost can be
estimated within a reasonable range of possible outcomes. The costs are based on currently available facts, technology expected to be available at the time of the clean-up, laws and regulations presently or virtually certain to be enacted and prior experience in remediation of contaminated sites.
The Group has recognised a provision for environmental restoration costs based on an independent environmental impact assessment report by an independent consultant. The value recognised is the present value of the estimated future restoration costs attributable to the current period.
e) Current Vs Non-current classifications:
The Group presents assets and liabilities in the balance sheet based on current / non-current classification.
An asset is treated as current when it satisfies the below mentioned criteria:
i. Expected to be realised or intended to be sold or consumed in normal operating cycle;
ii. Held primarily for the purpose of trading;
iii. Expected to be realised within twelve months after the reporting period, or
iv. Cash or cash equivalent unless restricted from being exchanged or used to settle a liability for at least twelve months after the reporting period.
All other assets are classified as non-current assets.
A liability is classified as current when it satisfies the below mentioned criteria:
i. Expected to settle the liability in normal operating cycle;
ii. Held primarily for the purpose of trading;
iii. Due to be settled within twelve months after the reporting period, or
iv. There is no unconditional right to defer the settlement of the liability for at least twelve months after the reporting period

CO
MPA
NY
OV
ERV
IEW STA
TUTO
RY R
EPOR
TS FINA
NC
IAL STA
TEMEN
TS (Co
nso
lidated
) NO
TICE
Notesto the Consolidated financial statements for the year ended 31st March, 2017
Notes
Nava Bharat Ventures Limited 175
All other liabilities are classified as non-current.
Deferred tax assets and liabilities are classified as non-current assets and liabilities.
The operating cycle is the time between the acquisition of assets for processing and their realisation in cash and cash equivalents.
f) Property, Plant and Equipment:
Property, plant and equipment are stated at cost net of CENVAT credit, less accumulated depreciation and accumulated impairment losses, if any. Cost comprises the purchase price and any attributable cost of bringing the asset to its working condition for its intended use. Borrowing costs relating to acquisition of property, plant and equipment which take substantial period of time to get ready for its intended use are also included to the extent they relate to the period till such assets are ready to put to use.
The Group adopted cost model as its accounting policy, in recognition of the property, plant and equipment and recognises transaction value as the cost.
Capital work in progress includes cost of property, plant and equipment under installation/under development as at the balance sheet date.
An item of Property, Plant and Equipment is derecognised upon disposal or when no future economic benefits are expected from its use. Any gain or loss arising on derecognition of the asset (calculated as the difference between the net disposal proceeds and the carrying amount of the asset) is recognised in the Statement of Profit and Loss when the asset is derecognized. Property, Plant and Equipment which are found to be not usable or retired from active use or when no further benefits are expected from their use are removed from property, plant and equipment and the carrying amount net of scrap value, if any is charged to Statement of Profit and Loss.
The improvements/modifications carried on the lease hold land/property are recognised as lease hold improvements and are written off over the primary lease period or the life of such improvement whichever is lower.
Estimated useful life of the assets are as follows:
Type of the Asset Method of Depreciation Useful life considered (years)
Building - Factory SLM 3 - 60
Building - Others SLM 3 - 60
Plant and Machinery SLM 3 - 40
Furniture and Fixtures WDV 8 - 10
Vehicles WDV 8 - 10
Office Equipment WDV 5 - 15
Air Conditioners and Coolers WDV 5
Railway Sidings SLM 15
Other Assets WDV 3 - 40
g) Investment Properties:
Property that is held for long-term rental yields or for capital appreciation or both, and that is not occupied by the Group, is classified as investment property. Investment property is measured initially at its cost, including related transaction costs and where applicable borrowing costs. Subsequent to initial recognition, investment properties are stated at cost less accumulated depreciation and accumulated impairment loss, if any.
Subsequent expenditure is capitalised to the asset’s carrying amount only when it is probable that future economic benefits associated with the expenditure will flow to the Group and the cost of the item can be measured

Notesto the Consolidated financial statements for the year ended 31st March, 2017
176 45th Annual Report 2016-17
reliably. All other repairs and maintenance costs are expensed when incurred. When part of an investment property is replaced, the carrying amount of the replaced part is derecognised.
Investment properties are depreciated using the straight-line method over their estimated useful lives. The useful life of buildings, classified as Investment properties, is considered as 60 years. The useful life has been determined based on technical evaluation performed by the management’s expert.
Investment properties are derecognised either when they have been disposed of or when they are permanently withdrawn from use and no future economic benefit is expected from their use. The difference between the net disposal proceeds and the carrying amount of the asset is recognised in profit or loss in the period of derecognition.
h) Intangible Assets:
Computer software:
Computer software are recognised at cost and are amortised over the useful life as estimated by the Management which is about 3 years for all of the intangible computer software assets.
Water Drawing Rights:
Cost incurred towards obtaining the initial water drawing rights, for its power projects, from Government and the cost incurred by the Group in erecting water pipelines to draw water from the resources which are recognised as Intangible assets are amortised over the estimated useful life of 40 years.
Intangible assets with indefinite useful lives are not amortised, but are tested for impairment annually, either individually or at the cash-generating unit level. The assessment of indefinite life is reviewed annually to determine whether the indefinite life continues to be supportable. If not, the change in useful life from indefinite to finite is made on a prospective basis.
An intangible asset is derecognized on disposal, or when no future economic benefits are expected from use of disposal. Gains or losses arising from derecognition of an intangible asset, measured as the difference between
the net disposal proceeds and the carrying amount of the asset, and are recognized in the Statement of Profit and Loss when the asset is derecognized.
i) Impairment of non-financial assets:
i. The carrying amounts of assets are reviewed at each balance sheet date if there is any indication of impairment based on internal/external factors. An impairment loss is recognized wherever the carrying amount of an asset exceeds its recoverable amount. The recoverable amount is the greater of the asset’s net selling price and value in use. In assessing value in use, the estimated future cash flows are discounted to their present value at the weighted average cost of capital. After impairment, depreciation is provided on the revised carrying amount of the asset over its remaining useful life.
ii. Reversal of impairment losses recognised in prior years is recorded when there is an indication that the impairment losses recognised for the asset are no longer existing or have decreased.
j) Leases:
The determination of whether an arrangement is (or contains) a lease is based on the substance of the arrangement at the inception of the lease. The arrangement is, or contains, a lease if fulfilment of the arrangement is dependent on the use of a specific asset or assets and the arrangement conveys the right to use the asset(s), even if that right is not explicitly specified in an arrangement.
Classification on inception of lease:
a. Operating lease:
Leases where the lessor effectively retains substantially all the risks and benefits of ownership of the leased item, are classified as operating leases.
b. Finance Lease:
A lease is classified as a financial lease where the lessor transfers substantially all the risks and rewards incidental to the ownership of the leased item.

CO
MPA
NY
OV
ERV
IEW STA
TUTO
RY R
EPOR
TS FINA
NC
IAL STA
TEMEN
TS (Co
nso
lidated
) NO
TICE
Notesto the Consolidated financial statements for the year ended 31st March, 2017
Notes
Nava Bharat Ventures Limited 177
Accounting of Operating leases:
a. In case the Group is a lessee:
Lease payment in case of operating leases are charged to profit and loss statement on straight line basis over the lease term. In case the escalation in operating lease payments are in line with the expected general inflation rate then the lease payments are charged to statement of profit and loss instead of straight line method.
b. In case the Group is a lessor:
Lease income is recognised in the Statement of Profit and Loss on a straight-line basis over the lease term. Assets subject to operating leases are included in fixed assets. Costs, including depreciation are recognised as an expense in the Statement of Profit and Loss.
k) Inventories:
Raw materials, stores and spares, work in progress, traded and finished goods are stated at the lower of cost and net realisable value. Costs are assigned to individual items of inventory and is determined based on weighted average method.
Cost of raw materials and traded goods comprises cost of purchases and includes all other costs incurred in bringing the inventories to their present location and condition. Cost of work-in-progress and finished goods comprises direct materials, direct labour and an appropriate proportion of variable and fixed overhead expenditure, the latter being allocated based on normal operating capacity.
Net realisable value is the estimated selling price in the ordinary course of business less the estimated costs of completion and the estimated costs necessary to make the sale.
Stores and spares which meet the definition of property, plant and equipment as per Ind AS 16 are recognised as property, plant and equipment. Others are recognised as inventory.
l) Coal reserve estimates:
An ore reserve estimate is an estimate of the amount of product that can be economically and legally extracted from the Group's properties. In order to calculate coal reserve, estimates and assumptions are required about a range of geological, technical and economic factors, including quantities, grades, production techniques, recovery rates, production costs, transport costs, commodity demand, commodity prices and exchange rates. Estimating the quantity and/or grade of ore reserve requires the size, shape and depth of orebodies to be determined by analysing geological data such as the logging and assaying of drill samples. This process may require complex and difficult geological judgments and calculations to interpret the data.
m) Stripping (waste removal) costs
As part of its mining operations, the Group incurs stripping (waste removal) costs both during the development phase and production phase of its operations. Stripping costs incurred in the development phase of a mine, before the production commences (development stripping), are capitalised as part of the cost of constructing the mine and subsequently amortised over its useful life using a units of production method. The capitalization of development stripping cost ceases when the mine/component is commissioned and ready for use as intended by management.
Stripping activities undertaken during the production phase of a surface mine (production stripping) are accounted for as set out below. After the commencement of production further development of the mine may require a phase of unusually high stripping that is similar in nature to development phase stripping. The costs of such stripping are accounted for in the same way as development stripping (as outlined above). Stripping cost incurred during the production phase are generally considered to create two benefits, being either the production of inventory or improved access to the ore to be mined in the future. Where the benefits are realised in the form of inventory produced in the period, the production stripping cost are accounted for as part of the cost of producing

Notesto the Consolidated financial statements for the year ended 31st March, 2017
178 45th Annual Report 2016-17
those inventories. Where the benefits are realised in the form of improved access to ore to be mined in the future, the costs are recognised as a non-current asset, referred to as a stripping activity asset, if the following criteria are met:
i Future economic benefits are probable
ii. The component of the ore body for which access will be improved can be accurately identified
iii. The costs associated with the improved access can be reliably measured
If all of the criteria are not met, the production stripping costs are charged to the statement of profit or loss as operating costs as they are incurred. In identifying components of the ore body, the group works closely with the mining operations personnel for each mining operation to analyse each of the mining plans. Generally, a component will be a subset of the total ore body, and a mine may have several components. The mine plans, and therefore the identification of components, can vary between mines for a number of reasons. These include, but are not limited to: the type of commodity, the geological characteristics of the ore body, the geographical location, and/or financial considerations. Given the nature of the Group’s operations, components are generally either major pushbacks or phases and they generally form part of a larger investment decision which requires board approval.
If the costs of the inventory produced and the stripping activity asset are not separately identifiable, a relevant production measure is used to allocate the production stripping costs between the inventory produced and the stripping activity asset. This production measure is calculated for the identified component of the ore body and is used as a benchmark to identify the extent the additional activity of creating a future benefit has taken place. The group uses the expected volume of waste extracted compared with the actual volume for a given volume of ore production for each component. The stripping activity asset is accounted for as an addition to, or an enhancement of, an existing asset, being the mine asset, and is presented as part of ‘Mine properties’ in the statement of financial position. This forms part of the total
investment in the relevant cash generating unit(s), which are reviewed for impairment if events or changes of circumstances indicate that the carrying value may not be recoverable. The stripping activity asset is subsequently depreciated using the units of production method over the life of the identified component of the ore body that became more accessible as a result of the stripping activity. Economically recoverable reserves, which comprise proven and probable reserves, are used to determine the expected useful life of the identified component of the ore body. The stripping activity asset is then carried at cost less depreciation and any impairment losses.
Stripping costs incurred in opening up new ore areas are capitalised as part of the cost of developing the pit and subsequently amortised over the mining of the ore (known as the reaction zone). This is reported under property, plant and equipment. Deferred stripping costs are amortised over the expected useful life of the identified component of the ore body that becomes more accessible as a result of the stripping activity. Specifically, the calculation of amortisation for deferred stripping costs is the ratio of ore mined within the reaction zone (the ore body that becomes more accessible as a result of the stripping activity) to the total ore estimated and identified within the reaction zone. Judgement is required to estimate the total ore within the reaction zone and the expected useful life of the identified component. The judgements made are supported by technical data.
n) Environmental expenditure:
The Group has long-term remediation obligations comprising decommissioning and restoration liabilities relating to its past operations which are based on the group's environmental management plans, in compliance with current environmental and regulatory requirements. Provisions for non-recurring remediation costs are made when there is a present obligation, it is probable that expenditure on remediation work will be required and the cost can be estimated within a reasonable range of possible outcomes.

CO
MPA
NY
OV
ERV
IEW STA
TUTO
RY R
EPOR
TS FINA
NC
IAL STA
TEMEN
TS (Co
nso
lidated
) NO
TICE
Notesto the Consolidated financial statements for the year ended 31st March, 2017
Notes
Nava Bharat Ventures Limited 179
The costs are based on currently available facts, technology expected to be available at the time of the clean-up, laws and regulations presently or virtually certain to be enacted and prior experience in remediation of contaminated sites.
o) Decommissioning and dismantling costs
The provision for decommissioning represents the cost that will arise from rectifying damage caused before production commences. Accordingly, a provision is recognised and a decommissioning asset is recognised and included within mine infrastructure.
Decommissioning and dismantling costs are provided at the present value of the expenditures expected to settle the obligation, using estimated cash flows based on current prices. The unwinding of the decommissioning obligation is included in the income statement. Estimated future costs of decommissioning obligations are reviewed regularly and adjusted as appropriate for new circumstances or changes in law or technology. Changes in estimates are capitalised or reversed against the relevant asset.
Estimates are discounted at a pre-tax rate that reflects current market assessments of the time value of money. Gains or losses from the expected disposal of assets are not taken into account when determining the provision.
p) Restoration Costs
The provision for restoration represents the cost of restoring site damage after the start of production. Changes in the provision are recorded in the income statement as a cost of production.
Restoration costs are estimated at the present value of the expenditures expected to settle the obligation, using estimated cash flows based on current prices and adjusted for risks specific to the liability. The estimates are discounted at a pre-tax rate that reflects current market assessments of the time value of money.
q) Revenue recognition:
Revenue is measured at the fair value of consideration received or receivable and is
recognized to the extent that it is probable that the economic benefits will flow to the Group. Specifically, the following basis is adopted for various sources of income:
i. Sale of goods:
Revenue is recognised when the significant risks and rewards of ownership of goods have passed to the buyer, which generally coincides with delivery. Amounts disclosed as revenue are inclusive of excise duty and net of returns, trade allowances, rebates, value added taxes. Revenue from export sales is recognised on the date of bill of lading, based on the terms of export.
ii. Sale of Thermal Power:
Revenue is recognised based on Joint Meter Reading (JMR) at the contracted rates periodically. Amounts disclosed as revenue are net of rebates.
iii. Income from services:
Revenue from conversion charges of ferro alloy and other service income is recognised based on proportionate completion method. Proportionate completion is measured by the management on the most appropriate basis for different class of services.
iv. Guarantee Commission:
Guarantee commission is recognised as an income over the life of financial guarantee contract on a time proportion basis.
v. Interest/dividend:
Interest income is recognised on a time proportion basis taking into account the amount outstanding and the rate applicable. Dividend income is recognised when the right to receive payment is established.
vi. Export Benefits:
Export benefits in the form of Duty Drawback are recognised on accrual and Focus Product Scheme (FPS) are recognised on realisation.

Notesto the Consolidated financial statements for the year ended 31st March, 2017
180 45th Annual Report 2016-17
vii. Other Sundry Incomes:
Insurance claims and conversion escalations are accounted for on realisation.
r) Foreign currency transactions:
i. Functional and Reporting Currency:
The Parent’s functional and reporting currency is Indian National Rupee.
ii. Initial Recognition:
Foreign currency transactions are recorded in the reporting currency, by applying to the foreign currency amounts the exchange rate between the reporting currency and the foreign currency at the date of the transaction.
iii. Conversion on reporting date:
Foreign currency monetary items are reported using the closing rate. Non-monetary items that are measured in terms of historical cost in a foreign currency are translated using the exchange rates at the dates of the initial transactions. Non-monetary items measured at fair value in a foreign currency are translated using the exchange rates at the date when the fair value is determined.
iv. Exchange Differences:
Exchange difference arising on the settlement of monetary items or on reporting monetary items of Group at rates different from those at which they were initially recorded during the year or reported in previous financial statements are recognised as income or as expenses in the year in which they arise.
The gain or loss arising on translation of non-monetary items measured at fair value is treated in line with the recognition of the gain or loss on the change in fair value of the item i.e., translation differences on items whose fair value gain or loss is recognised in OCI or profit or loss are also recognised in OCI or profit or loss, respectively.
v. Foreign Operations:
The results and financial position of foreign operations (none of which has the currency of a hyperinflationary economy) that have a functional currency different from the reporting currency are translated into the reporting currency as follows:
a. assets and liabilities are translated at the closing rate at the date of that balance sheet;
b. income and expenses are translated at average exchange rates (unless this is not a reasonable approximation of the cumulative effect of the rates prevailing on the transaction dates, in which case income and expenses are translated at the dates of the transactions), and
c. All resulting exchange differences are recognised in other comprehensive income as “Foreign Currency Translation Reserve”.
On consolidation, exchange differences arising from the translation of any net investment in foreign entities, and of borrowings and other financial instruments designated as hedges of such investments, are recognised in other comprehensive income. When a foreign operation is sold, the associated exchange differences are reclassified to profit or loss, as part of the gain or loss on sale.
Goodwill and fair value adjustments arising on the acquisition of a foreign operation are treated as assets and liabilities of the foreign operation and translated at the closing rate.
s) Government Grants and Subsidies:
Government grants are recognised where there is reasonable assurance that the grant will be received and all attached conditions will be complied with.

CO
MPA
NY
OV
ERV
IEW STA
TUTO
RY R
EPOR
TS FINA
NC
IAL STA
TEMEN
TS (Co
nso
lidated
) NO
TICE
Notesto the Consolidated financial statements for the year ended 31st March, 2017
Notes
Nava Bharat Ventures Limited 181
Government grants relating to income are deferred and recognised in the profit or loss over the period necessary to match them with the costs that they are intended to compensate and presented within other income.
Government grants relating to the purchase of property, plant and equipment are included in non-current liabilities as deferred income and are credited to profit or loss on a straight-line basis over the expected lives of the related assets and presented within other income.
Government grants relating to loans or similar assistance with an interest rate below the current applicable market rate are initially recognised and measured at fair value. The effect of this favourable interest is regarded as a government grant and is measured as the difference between the initial carrying value of the loan and the proceeds received. The loan is subsequently measured as per the accounting policy applicable to financial liabilities.
t) Retirement and other employee benefits:
i. Employer’s contribution to Provident Fund/Employee State Insurance which is in the nature of defined contribution scheme is expensed off when the contributions to the respective funds are due. There are no other obligations other than the contribution payable to the fund.
ii. Gratuity liability is in the nature of defined benefit obligation. Such liability is provided based on independent actuarial valuation on projected unit credit method made at the end of each financial year as per the requirements of Ind AS 19 “Employee Benefits”.
Actuarial gain/(loss) in the valuation are recognised as other comprehensive income for the period.
iii. Compensated absences which are in the nature of defined benefit obligation are provided for based on estimates of independent actuarial valuation on projected unit credit method made at the end of each financial year as per the requirements of Ind AS 19 “Employee Benefits”.
u) Borrowing Costs:
Borrowing costs directly attributable to the acquisition, construction or production of an asset that necessarily takes a substantial period of time to get ready for its intended use or sale are capitalised as part of the cost of the asset. All other borrowing costs are expensed in the period in which they occur. Borrowing costs consist of interest and other costs that an entity incurs in connection with the borrowing of funds. Borrowing cost also includes exchange differences to the extent regarded as an adjustment to the borrowing costs.
v) Segment Reporting:
Operating segments are reported in a manner consistent with the internal reporting provided to the Executive Management/Chief operating decision maker (“CODM”).
The board of directors of the Group has identified the Chairman as the CODM.
w) Dividend:
Annual dividend distribution to the shareholders is recognised as a liability in the period in which the dividend is approved by the shareholders. Any interim dividend paid is recognised on approval by Board of Directors. Dividend payable and corresponding tax on dividend distribution is recognised directly in equity.
x) Earnings Per Share:
Basic earnings per share are calculated by dividing the profit for the period attributable to equity shareholders by the weighted average number of equity shares outstanding during the period, net off treasury shares.
For the purpose of calculating diluted earnings per share, the profit for the period attributable to equity shareholders and the weighted average number of shares outstanding during the period, net off treasury shares are adjusted for the effects of all dilutive potential equity shares.
y) Provisions:
Provisions are recognised when there is a present legal or constructive obligation that can be estimated reliably, as a result of a past event, when it is probable that an outflow of

Notesto the Consolidated financial statements for the year ended 31st March, 2017
182 45th Annual Report 2016-17
resources embodying economic benefits will be required to settle the obligation and a reliable estimate can be made of the amount of the obligation. Provisions are not recognised for future operating losses.
Any reimbursement that the Group can be virtually certain to collect from a third party with respect to the obligation is recognised as a separate asset. However, this asset may not exceed the amount of the related provisions.
Provisions are reviewed at each reporting date and adjusted to reflect the current best estimate. If it is no longer probable that an outflow of economic resources will be required to settle the obligation, the provisions are reversed. Where the effect of the time of money is material, provisions are discounted using a current pre-tax rate that reflects, where appropriate, the risks specific to the liability. When discounting is used, the increase in the provisions due to the passage of time is recognised as a finance cost.
The Group records a provision for decommissioning costs of its manufacturing facilities. Decommissioning costs are provided at the present value of expected costs to settle the obligation using estimated cash flows and are recognised as part of the cost of the particular asset. The cash flows are discounted at a current pre-tax rate that reflects the risks specific to the decommissioning liability. The unwinding of the discount is expensed as incurred and recognised in the statement of profit and loss as a finance cost. The estimated future costs of decommissioning are reviewed annually and adjusted as appropriate. Changes in the estimated future costs or in the discount rate applied are added to or deducted from the cost of the asset.
z) Contingencies:
Where it is not probable that an inflow or an outflow of economic resources will be required, or the amount cannot be estimated reliably, the asset or the obligation is not recognised in the statement of balance sheet and is disclosed as a contingent asset or contingent liability. Possible outcomes on obligations/rights, whose existence will only be confirmed by the occurrence or non-occurrence of one or more future events are also disclosed as contingent assets or contingent liabilities.
aa) Taxes on Income:
Tax expense comprises of current and deferred tax. Current income tax is measured at the amount expected to be paid to the tax authorities in accordance with the respective laws of the state. Current tax includes taxes to be paid on the profit earned during the year and for the prior periods.
Deferred income taxes are provided based on the balance sheet approach considering the temporary differences between the tax bases of assets and liabilities and their carrying amounts for financial reporting purposes at the reporting date.
Deferred tax is measured based on the tax rates and the tax laws enacted or substantively enacted at the balance sheet date. Deferred tax assets are recognised only to the extent that there is reasonable certainty that sufficient future taxable income will be available against which such deferred tax assets can be realised. In situations where a component has unabsorbed depreciation or carry forward tax losses, all deferred tax assets are recognised only if it is probable that they can be utilised against future taxable profits.
The carrying amount of deferred tax assets are reviewed at each balance sheet date. The Group writes-down the carrying amount of a deferred tax asset to the extent that it is no longer probable that sufficient future taxable income will be available against which deferred tax asset can be realised. Any such write-down is reversed to the extent that it becomes reasonably certain that sufficient future taxable income will be available.
ab) Prior period items:
In case prior period adjustments are material in nature the Group prepares the restated financial statement as required under Ind AS 8 - “Accounting Policies, Changes in Accounting Estimates and Errors”. Immaterial items pertaining to prior periods are shown under respective items in the Statement of Profit and Loss.

CO
MPA
NY
OV
ERV
IEW STA
TUTO
RY R
EPOR
TS FINA
NC
IAL STA
TEMEN
TS (Co
nso
lidated
) NO
TICE
Notesto the Consolidated financial statements for the year ended 31st March, 2017
Notes
Nava Bharat Ventures Limited 183
ac) Cash and cash equivalents:
Cash and cash equivalents include cash on hand and at bank, deposits held at call with banks, other short-term highly liquid investment with original maturities of three months or less that are readily convertible to a known amount of cash which are subject to an insignificant risk of changes in value and are held for meeting short-term cash commitments.
For the Statement of Cash Flows, cash and cash equivalents consists of short term deposits, as defined above, net of outstanding bank overdraft as they are being considered as integral part of the Group’s cash management.
ad) Treasury shares:
Equity instruments of the Parent held by it pursuant to the order of Hon’ble High Court of Andhra Pradesh in a scheme of amalgamation are considered as treasury share, recognised at cost and deducted from equity. No gain or loss is recognised in profit or loss on the purchase, sale, issue or cancellation of the Group’s own equity instruments. Any difference between the carrying amount and the consideration, if reissued, is recognised in capital reserve. Further these shares are not considered for dividend and voting rights.
ae) Financial instruments:
A financial instrument is any contract that gives rise to a financial asset of one entity and a financial liability or equity instrument of another entity.
Financial Assets:
i. Initial recognition and measurement:
All financial assets are recognised initially at fair value plus, in the case of financial assets not recorded at fair value through profit or loss, transaction costs that are attributable to the acquisition of the financial asset. Transaction costs of financial assets carried at fair value through profit or loss are expensed in statement of profit or loss. Purchases or sales of financial assets that require delivery of assets within a time frame established by regulation or convention in the market place (regular way trades)
are recognised on the trade date, i.e., the date that the Group commits to purchase or sell the asset.
ii. Subsequent measurement:
For subsequent measurement, financial assets are classified into following categories:
a. Debt instruments at amortised cost
b. Debt instruments at fair value through profit and loss
c. Equity instruments at fair value through profit and loss
a. Debt Instruments at amortised cost:
A ‘debt instrument’ is measured at the amortised cost if both the following conditions are met:
i. The asset is held within a business model whose objective is to hold assets for collecting contractual cash flows, and
ii. Contractual terms of the asset give rise on specified dates to cash flows that are solely payments of principal and interest (SPPI) on the principal amount outstanding.
After initial measurement, such financial assets are subsequently measured at amortised cost using the effective interest rate (EIR) method. Amortised cost is calculated by taking into account any discount or premium on acquisition and fees or costs that are an integral part of the EIR. The EIR amortisation is included in finance income in the profit or loss. The losses arising from impairment are recognised in the profit or loss.
b. Debt instruments at fair value through profit and loss (FVTPL):
AS per the Ind AS 101 and Ind AS 109, the Group is permitted to

Notesto the Consolidated financial statements for the year ended 31st March, 2017
184 45th Annual Report 2016-17
designate the previously recognised financial asset at initial recognition irrevocably at fair value through profit or loss on the basis of facts and circumstances that exists on the date of transition to Ind AS. Debt instruments included within the FVTPL category are measured at fair value with all changes recognized in the Statement of Profit and Loss.
c. Equity Instruments at fair value through profit and loss (FVTPL):
Equity instruments/Mutual funds in the scope of Ind AS 109 are measured at fair value. The classification is made on initial recognition and is irrevocable. Subsequent changes in the fair values at each reporting date are recognised in the statement of profit or loss.
iii. Derecognition:
A financial asset or where applicable, a part of a financial asset is primarily derecognised when:
a. The rights to receive cash flows from the asset have expired, or
b. The Group has transferred its rights to receive cash flows from the asset or has assumed an obligation to pay the received cash flows in full without material delay to a third party under a ‘pass-through’ arrangement; and either (a) the Group has transferred substantially all the risks and rewards of the asset, or (b) the Group has neither transferred nor retained substantially all the risks and rewards of the asset, but has transferred control of the asset.
When the Group has transferred its rights to receive cash flows from an asset or has entered into a pass-through arrangement, it evaluates if and to what extent it has retained the risks and rewards of ownership. When it has neither transferred
nor retained substantially all of the risks and rewards of the asset, nor transferred control of the asset, the Group continues to recognise the transferred asset to the extent of the Group’s continuing involvement.
iv. Impairment of financial assets:
In accordance with Ind AS 109, the Group applies expected credit loss (ECL) model for measurement and recognition of impairment loss on the debt instruments, that are measured at amortised cost e.g., loans, debt securities, deposits, trade receivables and bank balance.
Expected credit loss is the difference between all contractual cash flows that are due to the Group in accordance with the contract and all the cash flows that the entity expects to receive.
The management uses a provision matrix to determine the impairment loss on the portfolio of trade and other receivables. Provision matrix is based on its historically observed expected credit loss rates over the expected life of the trade receivables and is adjusted for forward looking estimates.
Expected credit loss allowance or reversal recognised during the period is recognised as income or expense, as the case may be, in the statement of profit and loss. In case of balance sheet, it is shown as reduction from the specific financial asset.
Financial liabilities:
i. Initial recognition and measurement:
At initial recognition, all financial liabilities are recognised at fair value and in the case of loans, borrowings and payables, net of directly attributable transaction costs.
ii. Subsequent measurement:
a. Financial liabilities at fair value through profit or loss:
Financial liabilities at fair value through profit or loss include financial liabilities held for trading and financial liabilities designated upon initial recognition as at

CO
MPA
NY
OV
ERV
IEW STA
TUTO
RY R
EPOR
TS FINA
NC
IAL STA
TEMEN
TS (Co
nso
lidated
) NO
TICE
Notesto the Consolidated financial statements for the year ended 31st March, 2017
Notes
Nava Bharat Ventures Limited 185
fair value through profit or loss. Gain or losses on liabilities held for trading are recognised in the profit or loss.
The Group doesn’t designate any financial liability at fair value through profit or loss.
b. Financial liabilities at amortised cost:
Amortised cost, in case of financial liabilities with maturity more than one year, is calculated by discounting the future cash flows with effective interest rate. The effective interest rate amortisation is included as finance costs in the statement of profit and loss.
Financial liability with maturity of less than one year is shown at transaction value.
iii. Derecognition:
A financial liability is derecognised when the obligation under the liability is discharged or cancelled or expires. The difference between the carrying amount of a financial liability that has been extinguished or transferred to another party and the consideration paid, including any non-cash assets transferred or liabilities assumed, is recognised in profit or loss as other income or finance costs.
af) Financial Guarantee Contracts:
A financial guarantee contract is a contract that requires the issuer to make specified payments to reimburse the holder for a loss it incurs because a specified debtor fails to make payment when due in accordance with original or modified terms of a debt instrument.
The Group measures any financial guarantee on initial recognition at their fair value. Subsequently these contracts are measured at the higher of:
a. the amount of the loss allowance determined as per impairment requirements of Ind AS 109, and
b. the amount initially recognised, less where appropriate, cumulative amount of income recognised in accordance with the principles of Ind AS 18.
ag) Fair Value Measurement:
The Group measures financial instruments at fair value at each balance sheet date.
Fair value is the price that would be received to sell an asset or paid to transfer a liability in an orderly transaction between market participants at the measurement date. The fair value measurement is based on the presumption that the transaction to sell the asset or transfer the liability takes place either in the principal market for such asset or liability, or in the absence of a principal market, in the most advantageous market which is accessible to the Group.
The fair value of an asset or a liability is measured using the assumptions that market participants would use when pricing the asset or liability, assuming that market participants act in their economic best interest.
The fair value of an asset or a liability is measured using the assumptions that market participants would use when pricing the asset or liability, assuming that market participants act in their economic best interest.
A fair value measurement of a non-financial asset takes into account a market participant’s ability to generate economic benefits by using the asset in its highest and best use or by selling it to another market participant that would use the asset in its highest and best use.
The Group uses valuation techniques that are appropriate in the circumstances and for which sufficient data are available to measure fair value, maximising the use of relevant observable inputs and minimising the use of unobservable inputs.
All assets and liabilities for which fair value is measured or disclosed in the financial statements are categorized within the fair value hierarchy, described as follows, based on the lowest level input that is significant to the fair value measurement as a whole:
a. Level 1 – Quoted (unadjusted market prices) in active markets for identical assets or liabilities.

Notesto the Consolidated financial statements for the year ended 31st March, 2017
186 45th Annual Report 2016-17
b. Level 2 – Valuation techniques for which the lowest level input that is significant to the fair value measurements is directly or indirectly observable.
c. Level 3 – Valuation techniques for which the lowest level input that is significant to the fair value measurement is unobservable.
ah) Derivatives Financial Instruments:
The Group uses derivative financial instruments such as forward exchange contracts to hedge its risk associated with foreign currency fluctuations. Such derivative financial instruments are initially recognised at fair value on the date on which a derivative contract is entered into and are subsequently re-measured at fair value. Derivatives are carried as financial assets when the fair value is positive and as financial liabilities when the fair value is negative.
Any gains or losses arising from changes in the fair value of derivatives are taken directly to profit or loss.
ai) Hedging Activities and Derivatives:
Derivatives not designated as hedging instruments:
The Group uses foreign currency denominated borrowings and foreign exchange forward contracts to manage some of its transaction exposures. The foreign exchange forward contracts are not designated as cash flow hedges and are entered into for periods consistent with foreign currency exposure of the underlying transactions generally from one to 24 months.
A hedging relationship qualifies for hedge accounting if, and only if all the following conditions are met.
a) At the inception of the hedge there is formal designation and documentation of the hedging relationship and the entity’s risk management objective and strategy for undertaking the hedge. That documentation shall include the identification of hedging instrument, the hedged item or transaction, the nature of the risk being hedged and how the entity will assess the hedging instrument’s effectiveness in offsetting the exposure to changes in the hedged item’s fair value or cash flows attributable to the hedged risk.
b) The hedge is expected to be highly effective in achieving offsetting changes in fair values or cash flows attributable to the hedged risk, consistently with the originally documented risk management strategy for that particular hedging relationship.
c) For cash flow hedges, a forecast transaction that is the subject of the hedge must be highly probable and must present an exposure to various cash flows that could ultimately affect profit or loss.
d) The effectiveness of the hedge can be reliably measured i.e., the fair values or the cash flows of the hedged item that are attributable to the hedged risk and the fair value of the hedging instrument can be reliably measured.
e) The hedge is assessed on an ongoing basis and determined actually to have been highly effective throughout the financial reporting periods for which the hedge was designated.
As at 31 March 2017, the Group hedging instruments did not qualify for hedge accounting in accordance with the Group’s policy. Hence the interest rate swap contracts are not designated in hedge relationships and are measured at fair value through profit or loss.

CO
MPA
NY
OV
ERV
IEW STA
TUTO
RY R
EPOR
TS FINA
NC
IAL STA
TEMEN
TS (Co
nso
lidated
) NO
TICE
Notesto the Consolidated financial statements for the year ended 31st March, 2017
Notes
Nava Bharat Ventures Limited 187
4 PR
OPE
RTY
, PlA
NT
AN
D E
QU
IPM
ENT
FOR
TH
E Y
EAR
EN
DED
MA
RC
H 3
1, 2
017
` in
Lak
hs
Sl.
No.
PART
ICU
LARS
GRO
SS B
LOC
KD
EPRE
CIA
TIO
NN
ET B
LOC
K
As
at
01.0
4.20
16A
dditi
ons
Del
etio
nsTr
ansl
atio
n di
ffer
ence
sA
s at
31
.03.
2017
Up
to
31.0
3.20
16 f
or t
he
year
on
Del
etio
ns
Tran
slat
ion
diff
eren
ces
Up
to
31.
03.2
017
As
at
31.
03.2
017
As
at
01.0
4.20
16
01La
nd-
Free
Hol
d *
5,4
07.4
0 -
-
-
5
,407
.40
-
-
-
-
-
5,4
07.4
0 5
,407
.40
02Bu
ildin
gs-
Fact
ory
# 1
6,52
9.54
9
.64
-
-
16,
539.
18
4,4
30.3
2 6
33.9
5 -
-
5
,064
.27
11,
474.
91
12,
099.
22
- le
ase
hold
4,7
11.5
2 4
75.6
7 -
(1
15.3
2) 5
,071
.87
355
.07
194
.98
-
(13.
84)
536
.21
4,5
35.6
6 4
,356
.45
- O
ther
s 1
0,09
4.84
1
49.0
3 1
1.97
-
1
0,23
1.90
1
,512
.30
416
.02
6.2
1 -
1
,922
.11
8,3
09.7
9 8
,582
.54
03Pl
ant
and
Equi
pmen
t 1
93,2
00.7
1 6
,164
.04
313
.19
(704
.12)
198
,347
.44
55,
753.
52
6,9
97.6
8 2
14.9
3 (2
04.0
1) 6
2,33
2.26
1
36,0
15.1
8 1
37,4
47.1
9
04Fu
rnitu
re a
nd
fixtu
res
594
.03
3.9
6 3
.77
(1.1
8) 5
93.0
4 5
23.2
6 2
0.37
0
.67
(1.1
8) 5
41.7
8 5
1.26
7
0.77
05Ve
hicl
es 2
,540
.01
165
.08
139
.70
(37.
77)
2,5
27.6
2 1
,287
.47
297
.80
123
.66
(24.
19)
1,4
37.4
2 1
,090
.20
1,2
52.5
4
06O
ffice
Equ
ipm
ent
767
.10
21.
02
0.7
7 (0
.43)
786
.92
698
.75
25.
25
0.7
7 (0
.23)
723
.00
63.
92 6
8.35
07D
ata
Proc
essi
ng
equi
pmen
t 1
7.87
1
87.9
8 -
-
2
05.8
5 9
.22
18.
02
-
-
27.
24
178
.61
8.6
5
08A
ir C
ondi
tione
rs
and
cool
ers
256
.57
4.8
5 0
.84
-
260
.58
231
.88
6.8
0 0
.79
-
237
.89
22.
69 2
4.69
09C
ompu
ters
7.2
7 0
.85
-
-
8.1
2 5
.42
0.9
5 -
-
6
.37
1.7
5 1
.85
10Ra
ilway
Sid
ings
541
.86
-
-
-
541
.86
220
.85
37.
71
-
-
258
.56
283
.30
321
.01
11O
ther
Ass
ets
744
.78
27.
56
5.5
3 (0
.24)
766
.57
411
.74
69.
68
1.6
5 (0
.22)
479
.55
287
.02
333
.04
12Po
wer
Lin
es *
* 7
,796
.09
-
-
-
7,7
96.0
9 1
,054
.00
303
.26
-
-
1,3
57.2
6 6
,438
.83
6,7
42.0
9
13A
ir cr
aft
1,9
38.3
6 2
71.7
4 -
(4
9.90
) 2
,160
.20
522
.89
110
.80
-
(14.
68)
619
.01
1,5
41.1
9 1
,415
.47
14D
efer
red
strip
ping
co
sts
2,8
77.3
8 2
,509
.43
-
(142
.24)
5,2
44.5
7 2
,520
.89
361
.57
-
(66.
11)
2,8
16.3
5 2
,428
.22
356
.49
15Im
prov
emen
ts T
o Le
ased
Pre
mis
es 1
2.30
-
-
-
1
2.30
1
2.30
-
-
-
1
2.30
-
-
Gra
nd
To
tal
248
,037
.63
9,9
90.8
5 4
75.7
7 (
1,05
1.20
) 2
56,5
01.5
1 6
9,54
9.88
9
,494
.84
348
.68
(32
4.46
) 7
8,37
1.58
178
,129
.93
178
,487
.75

Notesto the Consolidated financial statements for the year ended 31st March, 2017
188 45th Annual Report 2016-17
` in
Lak
hs
Sl.
No.
PART
ICU
LARS
GRO
SS B
LOC
KD
EPRE
CIA
TIO
NN
ET B
LOC
K
As
at
01.0
4.20
15A
dditi
ons
Del
etio
nsTr
ansl
atio
n di
ffer
ence
sA
s at
31
.03.
2016
Up
to
31.0
3.20
15 f
or t
he
year
on
Del
etio
ns
Tran
slat
ion
diff
eren
ces
Up
to
31.
03.2
016
As
at
31.
03.2
016
As
at
01.0
4.20
15
01La
nd-
Free
Hol
d *
5,4
10.9
3 -
3
.53
-
5,4
07.4
10 -
-
-
-
-
5
,407
.40
5,4
10.9
3
02Bu
ildin
gs-
Fact
ory
# 1
5,64
0.82
8
99.9
4 1
1.22
-
1
6,52
9.54
3
,790
.31
642
.66
2.6
5 -
4
,430
.32
12,
099.
22
11,
850.
51
- le
ase
hold
3,6
69.5
3 8
13.8
7 -
2
28.1
2 4
,711
.52
260
.16
78.
55
-
16.
36
355
.07
4,3
56.4
5 3
,409
.37
- O
ther
s 9
,857
.40
239
.00
1.5
6 -
1
0,09
4.84
1
,121
.84
390
.77
0.3
1 -
1
,512
.30
8,5
82.5
4 8
,735
.56
03Pl
ant
and
Equi
pmen
t 1
82,1
82.7
0 9
,560
.78
19.
60
1,4
76.8
3 1
93,2
00.7
1 4
9,72
8.85
5
,743
.75
17.
07
297
.99
55,
753.
52
137
,447
.19
132
,453
.85
04Fu
rnitu
re a
nd
fixtu
res
583
.71
7.3
2 0
.37
3.3
7 5
94.0
3 4
82.8
9 3
7.56
0
.37
3.1
8 5
23.2
6 7
0.77
1
00.8
2
05Ve
hicl
es 1
,689
.85
803
.81
24.
54
70.
89
2,5
40.0
1 1
,073
.05
193
.11
21.
19
42.
50
1,2
87.4
7 1
,252
.54
616
.80
06O
ffice
Equ
ipm
ent
749
.46
40.
67
23.
35
0.3
2 7
67.1
0 6
94.8
6 2
6.54
2
2.96
0.3
1 6
98.7
5 6
8.35
5
4.60
07D
ata
Proc
essi
ng
equi
pmen
t 1
5.30
2
.57
-
-
17.
87 7
.13
2.0
9 -
-
9
.22
8.6
5 8
.17
08A
ir C
ondi
tione
rs
and
cool
ers
253
.84
6.5
2 3
.79
-
256
.57
221
.33
14.
33
3.7
8 -
2
31.8
8 2
4.69
3
2.51
09C
ompu
ters
5.7
3 1
.54
-
-
7.2
7 3
.32
2.1
0 -
-
5
.42
1.8
5 2
.41
10Ra
ilway
Sid
ings
541
.86
-
-
-
541
.86
183
.14
37.
71
-
-
220
.85
321
.01
358
.72
11O
ther
Ass
ets
720
.56
23.
93
0.2
4 0
.53
744
.78
326
.25
85.
37
0.2
0 0
.32
411
.74
333
.04
394
.31
12Po
wer
Lin
es *
* 7
,796
.09
-
-
-
7,7
96.0
9 7
87.0
9 2
66.9
1 -
-
1
,054
.00
6,7
42.0
9 7
,009
.00
13A
ir cr
aft
1,8
28.4
9 -
-
1
09.8
7 1
,938
.36
396
.25
101
.88
-
24.
76
522
.89
1,4
15.4
7 1
,432
.24
14D
efer
red
strip
ping
co
sts
2,7
14.2
9 -
-
1
63.0
9 2
,877
.38
1,4
02.4
5 7
06.3
4 -
4
12.1
0 2
,520
.89
356
.49
1,3
11.8
4
15Im
prov
emen
ts T
o Le
ased
Pre
mis
es 1
2.30
-
-
-
1
2.30
1
2.30
-
-
-
1
2.30
-
-
Gra
nd
To
tal
233
,672
.86
12,
399.
95
88.
20
2,0
53.0
2 2
48,0
37.6
3 6
0,49
1.22
8
,329
.67
68.
53
797
.52
69,
549.
88
178
,487
.75
173
,181
.64
* Th
e tit
le in
res
pect
of
the
land
cos
ting
` 15
.71
Lakh
s (P
revi
ous
year
` 1
5.71
Lak
hs )
adm
easu
ring
14.0
6 ac
res
and
23 g
unta
s is
yet
to
be t
rans
ferr
ed in
the
nam
e of
the
com
pany
.
* Th
e tit
le in
resp
ect
of t
he la
nd c
ostin
g `
26.0
6 La
khs
adm
easu
ring
5.05
acr
es a
llott
ed b
y A
PIIC
Lim
ited
durin
g th
e ye
ar 2
009-
10 is
yet
to
be t
rans
ferr
ed in
the
nam
e of
the
com
pany
.
# Th
e lo
ng t
erm
leas
e pe
riod
rela
ting
to t
he la
nd s
ituat
ed a
t Sa
mal
kot,
Eas
t G
odav
ari D
ist.
(A. P
.) on
whi
ch t
he c
ompa
ny c
onst
ruct
ed B
uild
ings
cos
ting
` 1,
506.
37 L
akhs
(Pre
viou
s ye
ar
` 1,
506.
37 L
akhs
) and
ere
cted
Pla
nt a
nd E
quip
men
t co
stin
g `
9,10
2.07
Lak
hs (P
revi
ous
year
: ` 9
,102
.07
Lakh
s) o
f Su
gar
man
ufac
turin
g fa
cilit
y an
d ex
pire
d on
Aug
ust
12, 1
996.
The
pa
rent
com
pany
is n
egot
iatin
g w
ith t
he la
ndlo
rds
to g
et t
he le
ase
rene
wed
or
sell
the
sam
e to
the
com
pany
.
**
Cos
t in
curr
ed b
y th
e C
ompa
ny, o
wne
rshi
p of
whi
ch v
ests
with
the
Sta
te O
wne
d Po
wer
Dis
trib
utio
n C
ompa
ny a
nd d
edic
ated
for
exc
lusi
ve u
sage
of
the
com
pany
.

CO
MPA
NY
OV
ERV
IEW STA
TUTO
RY R
EPOR
TS FINA
NC
IAL STA
TEMEN
TS (Co
nso
lidated
) NO
TICE
Notesto the Consolidated financial statements for the year ended 31st March, 2017
Notes
Nava Bharat Ventures Limited 189
5 IN
TAN
GIB
lE A
SSET
S
FOR
TH
E Y
EAR
EN
DED
MA
RC
H 3
1, 2
017
` in
lakh
s
Sl.
No.
PART
ICU
LARS
GRO
SS B
LOC
KD
EPRE
CIA
TIO
NN
ET B
LOC
K
As
at
01.0
4.20
16A
dditi
ons
Del
etio
nsTr
ansl
atio
n di
ffer
ence
As
at
31.0
3.20
17U
p to
31
.03.
2016
for
the
ye
aron
D
elet
ions
Tr
ansl
atio
n di
ffer
ence
Up
to
3
1.03
.201
7A
s at
3
1.03
.201
7A
s at
01
.04.
2016
01C
ompu
ter
Soft
war
e 6
42.8
1 1
08.5
2 1
.68
(0.9
7) 7
48.6
7 5
58.5
0 5
6.06
1
.68
(1.0
3) 6
11.8
5 1
36.8
3 8
4.31
02W
ater
Dra
win
g Ri
ghts
898
.70
-
-
-
898
.70
489
.07
12.
58
-
-
501
.65
397
.04
409
.63
Gra
nd
To
tal
1,5
41.5
1 1
08.5
2 1
.68
(0.
97)
1,6
47.3
7 1
,047
.57
68.
64
1.6
8 (
1.03
) 1
,113
.50
533
.87
493
.93
FOR
TH
E Y
EAR
EN
DED
MA
RC
H 3
1, 2
016
` in
lakh
s
Sl.
No.
PART
ICU
LARS
GRO
SS B
LOC
KD
EPRE
CIA
TIO
NN
ET B
LOC
K
As
at
01.0
4.20
15A
dditi
ons
Del
etio
nsTr
ansl
atio
n di
ffer
ence
As
at
31.0
3.20
16U
p to
31
.03.
2015
for
the
ye
aron
D
elet
ions
Tr
ansl
atio
n di
ffer
ence
Up
to
3
1.03
.201
6A
s at
3
1.03
.201
6A
s at
01
.04.
2015
01C
ompu
ter
Soft
war
e 5
48.6
0 9
1.60
-
2
.60
642
.81
518
.28
37.
02
-
3.1
7 5
58.5
0 8
4.31
3
0.32
02W
ater
Dra
win
g Ri
ghts
898
.70
-
-
-
898
.70
476
.49
12.
58
-
-
489
.07
409
.63
422
.21
Gra
nd
To
tal
1,4
47.3
0 9
1.60
-
2
.60
1,5
41.5
1 9
94.7
7 4
9.60
-
3
.17
1,0
47.5
7 4
93.9
3 4
52.5
3

Notesto the Consolidated financial statements for the year ended 31st March, 2017
190 45th Annual Report 2016-17
` in lakhs
S.No PARTICULARSAs at
31.03.2017As at
31.03.2016As at
01.04.2015
6 INVESTMENT PROPERTYLand at Cost 101.91 101.91 101.91
Gross Block - Building
As at the beginning and at the end of the period 173.93 173.93 173.93
Depreciation - Building
Up to beginning of the period 17.16 11.46 11.46
Charge for the period 5.70 5.70 -
up to the end of the period 22.86 17.16 11.46
Net Block - Building 151.07 156.77 162.47
Total 252.98 258.68 264.38
` in lakhs
S.No PARTICULARSAs at
31.03.2017As at
31.03.2016As at
01.04.2015
7 GOODWIllAs at the beginning of the period 36,636.19 34,559.68 34,559.68
Add: Foreign Currency Translation Reserve (776.96) 2,076.51 -
As at the end of the period 35,859.23 36,636.19 34,559.68
` in lakhs
S.No PARTICULARSAs at
31.03.2017As at
31.03.2016As at
01.04.2015
8 INVESTMENTS - NON CURRENT:*Investment in equity shares (Quoted)
in other companies (designated at FVTPL) 408.63 381.66 391.68
Investment in equity shares (Un - Quoted)
in Subsidaries (at cost) 1.32 - -
in associates (designated at FVTPL) 2.58 2.58 2.58
in other companies (designated at FVTPL) 271.15 328.36 272.15
Investments in preference shares
in other companies (designated at FVTPL) 1,001.50 1,001.50 1,001.50
Investment in Government Securities (at cost)
6 years National Savings Certificates 0.50 0.90 0.90
Total 1,685.68 1,715.00 1,668.81
Aggregate amount of Quoted Investments 408.63 381.66 391.68
Aggregate amount of Un-Quoted Investments 1,277.05 1,333.34 1,277.13
Aggregate amount of Impairment in Value of Investments 91.14 53.83 48.15
* Refer Note No 46 for details
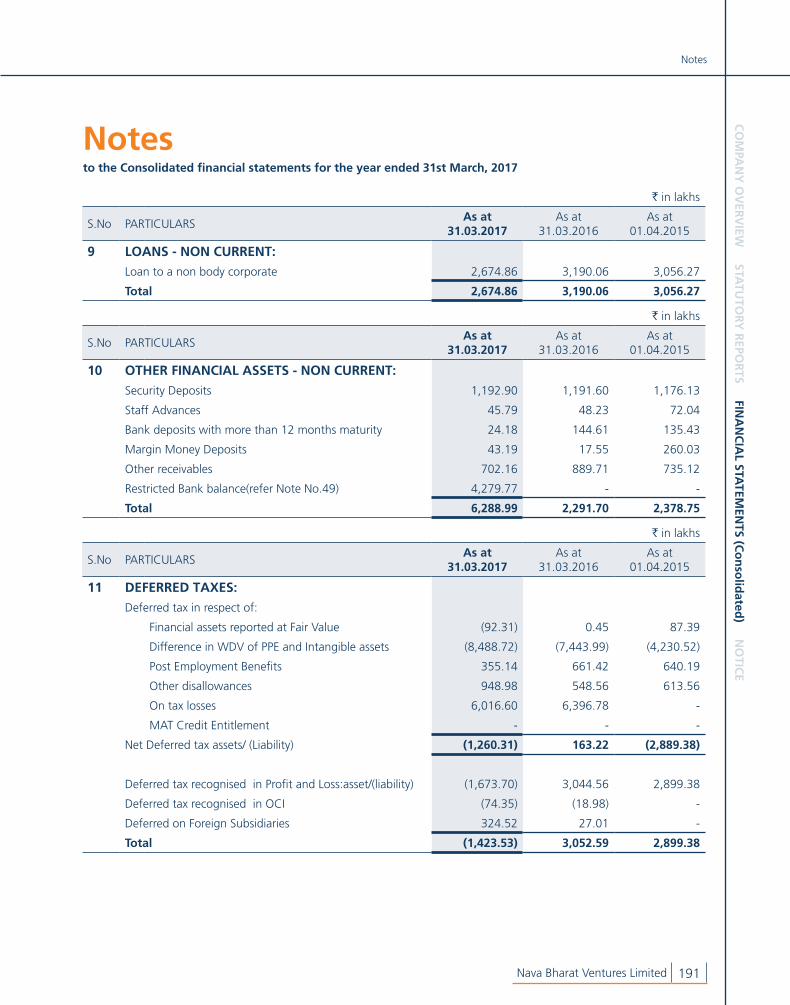
CO
MPA
NY
OV
ERV
IEW STA
TUTO
RY R
EPOR
TS FINA
NC
IAL STA
TEMEN
TS (Co
nso
lidated
) NO
TICE
Notesto the Consolidated financial statements for the year ended 31st March, 2017
Notes
Nava Bharat Ventures Limited 191
` in lakhs
S.No PARTICULARSAs at
31.03.2017As at
31.03.2016As at
01.04.2015
9 lOANS - NON CURRENT:
Loan to a non body corporate 2,674.86 3,190.06 3,056.27
Total 2,674.86 3,190.06 3,056.27
` in lakhs
S.No PARTICULARSAs at
31.03.2017As at
31.03.2016As at
01.04.2015
10 OTHER FINANCIAl ASSETS - NON CURRENT:
Security Deposits 1,192.90 1,191.60 1,176.13
Staff Advances 45.79 48.23 72.04
Bank deposits with more than 12 months maturity 24.18 144.61 135.43
Margin Money Deposits 43.19 17.55 260.03
Other receivables 702.16 889.71 735.12
Restricted Bank balance(refer Note No.49) 4,279.77 - -
Total 6,288.99 2,291.70 2,378.75
` in lakhs
S.No PARTICULARSAs at
31.03.2017As at
31.03.2016As at
01.04.2015
11 DEFERRED TAXES:
Deferred tax in respect of:
Financial assets reported at Fair Value (92.31) 0.45 87.39
Difference in WDV of PPE and Intangible assets (8,488.72) (7,443.99) (4,230.52)
Post Employment Benefits 355.14 661.42 640.19
Other disallowances 948.98 548.56 613.56
On tax losses 6,016.60 6,396.78 -
MAT Credit Entitlement - - -
Net Deferred tax assets/ (Liability) (1,260.31) 163.22 (2,889.38)
Deferred tax recognised in Profit and Loss:asset/(liability) (1,673.70) 3,044.56 2,899.38
Deferred tax recognised in OCI (74.35) (18.98) -
Deferred on Foreign Subsidiaries 324.52 27.01 -
Total (1,423.53) 3,052.59 2,899.38

Notesto the Consolidated financial statements for the year ended 31st March, 2017
192 45th Annual Report 2016-17
` in lakhs
S.No PARTICULARSAs at
31.03.2017As at
31.03.2016As at
01.04.2015
12 OTHER NON CURRENT ASSETS:
Capital Advances 4,140.90 8,712.22 9,505.29
Advance for purchases and Expenses - - 11.81
Prepaid Lease Rentals 11.56 149.16 150.97
Prepaid expenses - 1.91 12.89
Payments made under protest 265.51 118.74 115.58
Interest accrued but not due 1,313.40 1,054.26 795.12
MAT Credit entitlement 29,070.20 28,482.99 23,204.02
Total 34,801.57 38,519.28 33,795.68
` in lakhs
S.No PARTICULARSAs at
31.03.2017As at
31.03.2016As at
01.04.2015
13 INVENTORIES - NON CURRENT:
Finished Goods at cost - - 16,221.22
Total - - 16,221.22
` in lakhs
S.No PARTICULARSAs at
31.03.2017As at
31.03.2016As at
01.04.2015
14 INVENTORIES - CURRENT:
At Cost:
Raw Materials 8,728.08 10,761.68 18,853.22
Raw Materials (In-transit) 982.94 200.12 4,950.40
Work in Progress 631.96 950.06 390.83
Finished Goods 25,118.66 23,013.48 2,990.51
Stock-in-trade 63.97 73.75 49.78
Stores and Spares 4,053.39 4,384.71 8,129.56
Stores and Spares (In-transit) 9.89 - -
Others 0.88 10.86 5.08
At Realisable Value:
Work in Progress - 308.34 22.95
Finished Goods 388.45 973.74 11,564.71
Total 39,978.22 40,676.74 46,957.04

CO
MPA
NY
OV
ERV
IEW STA
TUTO
RY R
EPOR
TS FINA
NC
IAL STA
TEMEN
TS (Co
nso
lidated
) NO
TICE
Notesto the Consolidated financial statements for the year ended 31st March, 2017
Notes
Nava Bharat Ventures Limited 193
` in lakhs
S.No PARTICULARSAs at
31.03.2017As at
31.03.2016As at
01.04.2015
15 INVESTMENTS - CURRENT:
Investments in unquoted mutual funds* 15,184.81 3,758.84 4,119.48
Other Investments -
Debt Securities (FVTPL) 24,228.31 2,622.85
Commodity Linked Options (FVTPL) - 2,307.01
Total 39,413.12 3,758.84 9,049.34
Aggregate amount of Un-Quoted Investments 39,413.12 3,758.84 9,049.34
Aggregate amount of Impairment in Value of Investments 0.72 - -
* Refer Note No 47 for details
` in lakhs
S.No PARTICULARSAs at
31.03.2017As at
31.03.2016As at
01.04.2015
16 TRADE RECEIVABlES:
Unsecured, Considered Good 35,232.62 20,843.68 13,531.85
Less:Expected Credit Loss on above - - -
Total 35,232.62 20,843.68 13,531.85
` in lakhs
S.No PARTICULARSAs at
31.03.2017As at
31.03.2016As at
01.04.2015
17 CASH AND CASH EQUIVAlENTS:
Balances with Banks
- on Current Accounts 62,270.60 60,161.05 10,263.84
- on Deposits Accounts - 3.08 51.66
- Bank deposits with original maturity period less than 3 months - 2,410.85 1,224.91
Cash on hand 24.42 24.44 16.89
Total 62,295.02 62,599.42 11,557.30
` in lakhs
S.No PARTICULARSAs at
31.03.2017As at
31.03.2016As at
01.04.2015
18 OTHER BANK BAlANCES - CURRENT:
Bank deposits with a maturity period less than 12 months 2,360.23 3,634.65 2,362.73
Total 2,360.23 3,634.65 2,362.73

Notesto the Consolidated financial statements for the year ended 31st March, 2017
194 45th Annual Report 2016-17
` in lakhs
S.No PARTICULARSAs at
31.03.2017As at
31.03.2016As at
01.04.2015
19 lOANS - CURRENT:
Inter Corporate deposits - 4,995.15 32.56
Loan to Others 18.82 41.72 11.65
Total 18.82 5,036.87 44.21
` in lakhs
S.No PARTICULARSAs at
31.03.2017As at
31.03.2016As at
01.04.2015
20 OTHER FINANCIAl ASSETS - CURRENT:
Restricted Bank balances
Margin money deposits 2,097.93 1,904.58 2,059.80
Unpaid dividend accounts 198.76 207.45 200.70
Security Deposits 158.87 135.78 133.49
Staff Advances 30.81 66.77 79.91
Forward Contract Asset 1,945.35 - -
Other Receivables 748.42 1,601.84 506.85
Total 5,180.14 3,916.42 2,980.75
` in lakhs
S.No PARTICULARSAs at
31.03.2017As at
31.03.2016As at
01.04.2015
21 OTHER CURRENT ASSETS:
Advance for Purchases and Expenses 6,504.79 4,414.38 8,384.51
Balance with Statutory Authorities 6,353.24 3,999.54 4,289.15
Prepaid Expenses 1,153.71 391.06 758.40
Accrued Conversion Charges 532.06 138.77 -
Prepaid Lease Rentals 5.01 6.66 4.56
Advance for investments - 2,800.00 -
Interest Accrued 660.14 239.27 425.24
Others 231.36 0.22 0.14
Total 15,440.31 11,989.90 13,862.00
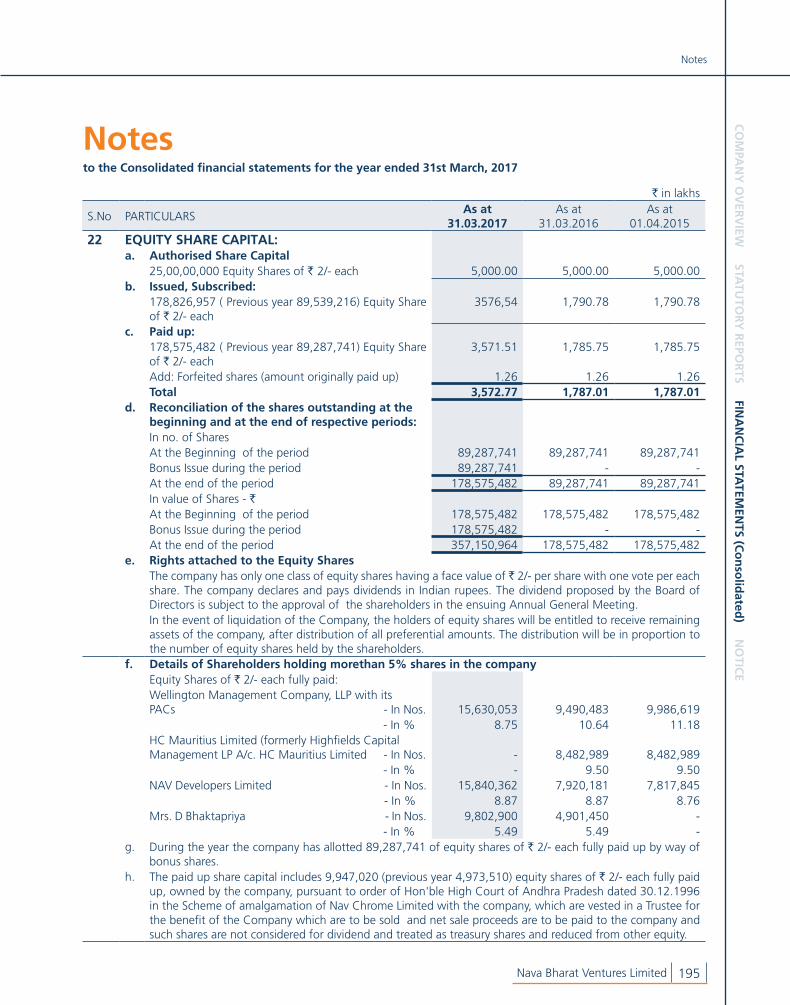
CO
MPA
NY
OV
ERV
IEW STA
TUTO
RY R
EPOR
TS FINA
NC
IAL STA
TEMEN
TS (Co
nso
lidated
) NO
TICE
Notesto the Consolidated financial statements for the year ended 31st March, 2017
Notes
Nava Bharat Ventures Limited 195
` in lakhs
S.No PARTICULARSAs at
31.03.2017As at
31.03.2016As at
01.04.201522 EQUITY SHARE CAPITAl:
a. Authorised Share Capital25,00,00,000 Equity Shares of ` 2/- each 5,000.00 5,000.00 5,000.00
b. Issued, Subscribed:178,826,957 ( Previous year 89,539,216) Equity Share of ` 2/- each
3576,54 1,790.78 1,790.78
c. Paid up:178,575,482 ( Previous year 89,287,741) Equity Share of ` 2/- each
3,571.51 1,785.75 1,785.75
Add: Forfeited shares (amount originally paid up) 1.26 1.26 1.26 Total 3,572.77 1,787.01 1,787.01
d. Reconciliation of the shares outstanding at the beginning and at the end of respective periods:In no. of SharesAt the Beginning of the period 89,287,741 89,287,741 89,287,741 Bonus Issue during the period 89,287,741 - - At the end of the period 178,575,482 89,287,741 89,287,741 In value of Shares - `At the Beginning of the period 178,575,482 178,575,482 178,575,482 Bonus Issue during the period 178,575,482 - - At the end of the period 357,150,964 178,575,482 178,575,482
e. Rights attached to the Equity SharesThe company has only one class of equity shares having a face value of ` 2/- per share with one vote per each share. The company declares and pays dividends in Indian rupees. The dividend proposed by the Board of Directors is subject to the approval of the shareholders in the ensuing Annual General Meeting.In the event of liquidation of the Company, the holders of equity shares will be entitled to receive remaining assets of the company, after distribution of all preferential amounts. The distribution will be in proportion to the number of equity shares held by the shareholders.
f. Details of Shareholders holding morethan 5% shares in the companyEquity Shares of ` 2/- each fully paid:Wellington Management Company, LLP with its PACs - In Nos. 15,630,053 9,490,483 9,986,619
- In % 8.75 10.64 11.18 HC Mauritius Limited (formerly Highfields Capital Management LP A/c. HC Mauritius Limited - In Nos. - 8,482,989 8,482,989
- In % - 9.50 9.50 NAV Developers Limited - In Nos. 15,840,362 7,920,181 7,817,845
- In % 8.87 8.87 8.76 Mrs. D Bhaktapriya - In Nos. 9,802,900 4,901,450 -
- In % 5.49 5.49 - g. During the year the company has allotted 89,287,741 of equity shares of ` 2/- each fully paid up by way of
bonus shares.h. The paid up share capital includes 9,947,020 (previous year 4,973,510) equity shares of ` 2/- each fully paid
up, owned by the company, pursuant to order of Hon'ble High Court of Andhra Pradesh dated 30.12.1996 in the Scheme of amalgamation of Nav Chrome Limited with the company, which are vested in a Trustee for the benefit of the Company which are to be sold and net sale proceeds are to be paid to the company and such shares are not considered for dividend and treated as treasury shares and reduced from other equity.

Notesto the Consolidated financial statements for the year ended 31st March, 2017
196 45th Annual Report 2016-17
` in lakhs
S.No PARTICULARSAs at
31.03.2017As at
31.03.2016As at
01.04.2015
23 OTHER EQUITY:Capital Reserve:
At the beginning and at the end of the year 60.20 60.20 60.20 Capital Redemption Reserve:
At the beginning and at the end of the year 826.39 826.39 826.39 Securities Premium Reserve:
At the beginning and at the end of the year 26,214.22 26,214.22 26,214.22 Treasury Shares: (206.34) (206.34) (206.34)General Reserve:
At the beginning of the year 89,352.41 87,852.41 87,852.41 Add: Addition for the year - 1,500.00 - Less: Bonus issue of equity shares (1,785.75) - - At the end of the year 87,566.66 89,352.41 87,852.41
Other Reserves:Subsidies:At the beginning and at the end of the year 33.60 33.60 33.60
Surplus in Statement of Profit and LossAt the beginning of the year 190,929.11 169,138.84 163,609.54 Adjustment due to adoption of Ind AS - - 5,529.30Surplus/deficit of subsidaries sold/written off during the year
98.20 - -
Profit for the year 10,121.40 28,364.20 - Profit before appropriations 201,148.71 197,503.04 169,138.84
Appropriations:General Reserve - (1,500.00) - Dividend on Equity Capital (2,529.43) (4,215.71) - Corporate Dividend Tax (514.93) (858.22) -
At the end of the year 198,104.35 190,929.11 169,138.84Other Comprehesive Income
On Foreign currency translation reserveAt the beginning of the year 13,210.63 9,343.62 9,343.62 Surplus/defecit of subsidaries sold/written off during the year (0.09) - -for the year (1,981.07) 3,867.01 - At the end of the year 11,229.47 13,210.63 9,343.62
On Acturial Gain/(loss) on post employment benefitsAt the beginning of the year 38.91 - - for the year 145.56 38.91 - At the end of the year 184.47 38.91 - Total 324,013.02 320,459.13 293,262.94

CO
MPA
NY
OV
ERV
IEW STA
TUTO
RY R
EPOR
TS FINA
NC
IAL STA
TEMEN
TS (Co
nso
lidated
) NO
TICE
Notesto the Consolidated financial statements for the year ended 31st March, 2017
Notes
Nava Bharat Ventures Limited 197
` in lakhs
S.No PARTICULARSAs at
31.03.2017As at
31.03.2016As at
01.04.2015
24 BORROWINGS - NON CURRENT:
Secured
Term loans*
from banks
State Bank of India - I (i) 14,524.67 23,492.44 1,733.17
State Bank of India - II (i) 490.50 904.13 1,084.99
NBEIL Consortium Loans (ii) 15,714.39 20,992.40 27,242.67
Development Bank of South Africa (iii) 55,212.07 53,164.76 -
Export Credit Agencies facility (iii) 201,183.07 182,890.86 -
Barclays Bank Zambia plc (iii) 11,023.73 9,048.72 -
Standard Chartered Bank - - 1,041.58
from others
Industrial Development Corporation of South Africa (iii) 27,486.15 27,265.42 -
Government of Zambia (iv) 1,513.83 5,772.79 -
Africa finance corporation (v) 30,315.26 - -
Total 357,463.67 323,531.52 31,102.41
* Refer Note No 50 for details
` in lakhs
S.No PARTICULARSAs at
31.03.2017As at
31.03.2016As at
01.04.2015
25 OTHER FINANCIAl lIABIlITIES - NON CURRENT
Security Deposits
Employee Retention deposits 6.85 11.05 20.36
Rental deposits 33.40 33.64 45.29
ZCCM Investments Holdings plc 17,170.65 16,788.34 15,779.38
Other payables 4,645.53 462.52 721.61
Total 21,856.43 17,295.55 16,566.63
` in lakhs
S.No PARTICULARSAs at
31.03.2017As at
31.03.2016As at
01.04.2015
26 OTHER NON-CURRENT lIABIlITIES
Prereceived Rental Income - - 0.41
Total - - 0.41

Notesto the Consolidated financial statements for the year ended 31st March, 2017
198 45th Annual Report 2016-17
` in lakhs
S.No PARTICULARSAs at
31.03.2017As at
31.03.2016As at
01.04.2015
27 PROVISIONS - NON CURRENT:
Provision for employee benefits
Provision for Gratuity 613.22 430.40 53.16
Provision for compensated absences 721.01 461.12 504.55
Provision for decommissioning liability 764.84 708.19 655.73
Provision for environment rehabilitation 3,019.29 549.73 471.83
Total 5,118.36 2,149.44 1,685.27
` in lakhs
S.No PARTICULARSAs at
31.03.2017As at
31.03.2016As at
01.04.2015
28 BORROWINGS - CURRENT:
Working Capital Loans:*
from banks
Cash Credit 8,114.66 7,391.53 4,317.60
Buyers Credit 3,118.36 2,330.96 4,114.67
Unsecured
Inter Corporate Deposit - 5,022.74 3,000.00
Total 11,233.02 14,745.23 11,432.27
* Refer Note No 50 for details
` in lakhs
S.No PARTICULARSAs at
31.03.2017As at
31.03.2016As at
01.04.2015
29 TRADE PAYABlES - CURRENT:
for Supplies and Services
(i) Related Parties - 20.52 -
(ii) Others 11,265.84 14,995.53 79,716.74
Total 11,265.84 15,016.05 79,716.74

CO
MPA
NY
OV
ERV
IEW STA
TUTO
RY R
EPOR
TS FINA
NC
IAL STA
TEMEN
TS (Co
nso
lidated
) NO
TICE
Notesto the Consolidated financial statements for the year ended 31st March, 2017
Notes
Nava Bharat Ventures Limited 199
` in lakhs
S.No PARTICULARSAs at
31.03.2017As at
31.03.2016As at
01.04.2015
30 OTHER FINANCIAl lIABIlITIES - CURRENT:
Current maturities of long term borrowings
State Bank of India - I 7,616.00 7,616.00 7,616.00
State Bank of India - II 361.68 180.84 -
NBEIL Consortium Loans 5,177.78 5,177.78 4,110.19
Barclays Bank Zambia PLC 1,296.82 480.85 -
State Bank of India - Loan - - 27,489.16
Deutsche Bank 18,498.78 - 3,474.06
Standard Chartered Bank-I - 1,103.00 12,502.02
Standard Chartered Bank-II - 3,121.11 -
Development Bank of South Africa 6,495.09 2,825.16 -
Bridge Finance ICBC (Macau and London) Plc . - - 49,996.00
Export Credit Agencies facility 23,666.95 9,718.78 -
Zambia Development agency - - 14.19
International Development Agency - - 999.92
Government of Ruplic of zambia - MOF 2 - USD - - 2,687.29
Government of Ruplic of zambia - MOF 1 - ZMW - - 70.06
Scheme of arrangement - MOF - ZMW - - 4,884.26
Government of Zambia 81.44 60.02 -
Industrial development Corporation of South Africa 3,233.44 1,448.88 -
Africa Finance Corporation 3,566.25 - -
Due to Related parties - 753.46 701.58
Salaries and Wages payable
Directors 598.38 442.78 605.25
Others 975.28 931.99 947.16
Security Deposits
Employee Retention deposits 113.49 207.95 142.73
Others 3,440.48 3,383.44 378.79
Bills discounted with banks - - 2,162.44
Interest accrued and due - 1,537.98 734.21
Forward Contract Liability 2,020.81 - -
Swap contract liability 1,266.73 - -
Other payables 8,220.68 4,127.10 2,829.75
Total 86,630.06 43,117.12 122,345.06

Notesto the Consolidated financial statements for the year ended 31st March, 2017
200 45th Annual Report 2016-17
` in lakhs
S.No PARTICULARSAs at
31.03.2017As at
31.03.2016As at
01.04.2015
31 OTHER CURRENT lIABIlITIES:
Advance from Customers 22.37 73.63 -
Unpaid Dividends 198.76 207.45 200.70
Prepaid Rental Income - 0.40 2.43
Interest accrued but not due 717.21 299.95 298.44
Statutory Liabilities
- Central Excise Duty 811.51 560.70 991.71
- Withholding Taxes 3,640.85 2,926.76 1,366.83
- Sales Tax 1,035.73 49.65 47.12
- Contribution to Provident Fund 65.20 74.96 70.95
- Other Statutory Dues 752.78 899.11 559.73
Total 7,244.42 5,092.61 3,537.90
` in lakhs
S.No PARTICULARSAs at
31.03.2017As at
31.03.2016As at
01.04.2015
32 PROVISIONS - CURRENT:
Provision for employee benefits - - -
Provision for Gratuity 451.31 617.88 986.45
Provision for compensated absences 249.05 484.12 343.63
Total 700.36 1,102.00 1,330.09
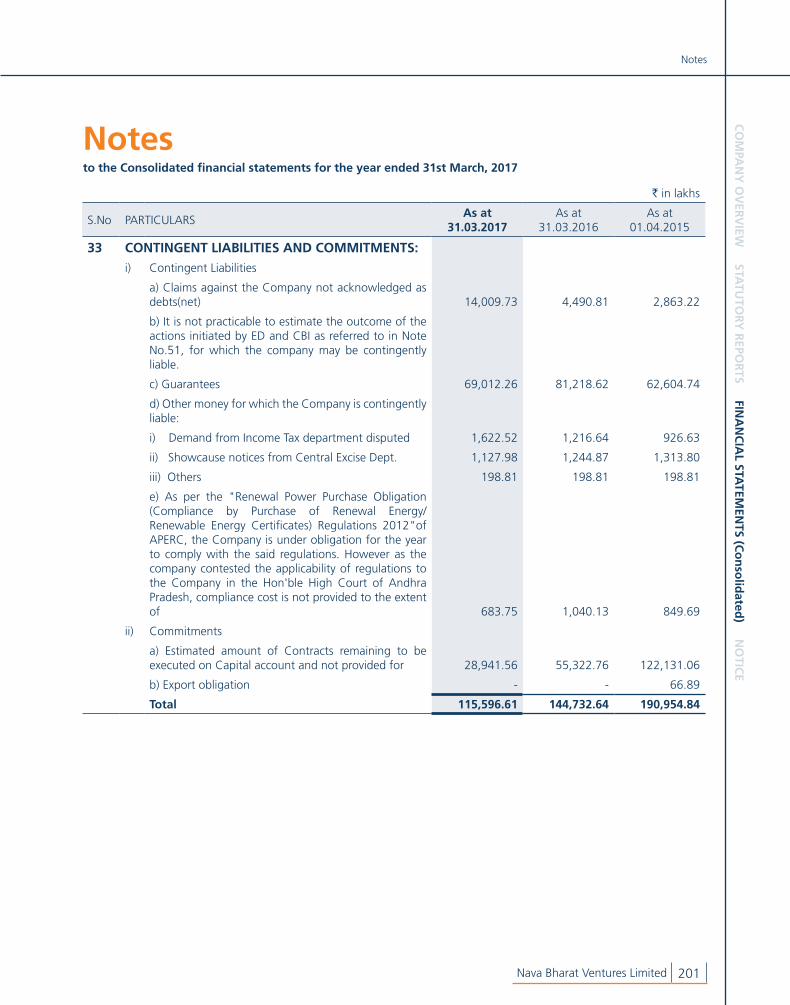
CO
MPA
NY
OV
ERV
IEW STA
TUTO
RY R
EPOR
TS FINA
NC
IAL STA
TEMEN
TS (Co
nso
lidated
) NO
TICE
Notesto the Consolidated financial statements for the year ended 31st March, 2017
Notes
Nava Bharat Ventures Limited 201
` in lakhs
S.No PARTICULARSAs at
31.03.2017As at
31.03.2016As at
01.04.2015
33 CONTINGENT lIABIlITIES AND COMMITMENTS:
i) Contingent Liabilities
a) Claims against the Company not acknowledged as debts(net) 14,009.73 4,490.81 2,863.22
b) It is not practicable to estimate the outcome of the actions initiated by ED and CBI as referred to in Note No.51, for which the company may be contingently liable.
c) Guarantees 69,012.26 81,218.62 62,604.74
d) Other money for which the Company is contingently liable:
i) Demand from Income Tax department disputed 1,622.52 1,216.64 926.63
ii) Showcause notices from Central Excise Dept. 1,127.98 1,244.87 1,313.80
iii) Others 198.81 198.81 198.81
e) As per the "Renewal Power Purchase Obligation (Compliance by Purchase of Renewal Energy/Renewable Energy Certificates) Regulations 2012"of APERC, the Company is under obligation for the year to comply with the said regulations. However as the company contested the applicability of regulations to the Company in the Hon'ble High Court of Andhra Pradesh, compliance cost is not provided to the extent of 683.75 1,040.13 849.69
ii) Commitments
a) Estimated amount of Contracts remaining to be executed on Capital account and not provided for 28,941.56 55,322.76 122,131.06
b) Export obligation - - 66.89
Total 115,596.61 144,732.64 190,954.84

Notesto the Consolidated financial statements for the year ended 31st March, 2017
202 45th Annual Report 2016-17
` in lakhs
S.No PARTICULARSFor the year ended
31.03.2017For the year ended
31.03.2016
34 REVENUE FROM OPERATIONS:
A. Sale of Products
Finished Goods
Ferro Alloys 42,339.37 38,960.40
Sugar 13,887.86 11,555.40
Electric Power 74,948.91 110,840.24
Less: Prompt payment rebate (425.38) (1,121.73)
Coal 7,665.52 9,244.77
Less: Mineral Taxes (844.17) (1,145.22)
Others 1,863.47 2,145.03
139,435.58 170,478.89
Less: Inter Divisional transfers 31,310.23 21,361.54
108,125.35 149,117.35
Traded Goods
Fertilizers 220.68 200.04
PVC Pipes 14.23 10.06
Others 296.81 264.81
B. Sale of Services
Ferro Alloys Conversion Charges 19,034.58 9,514.18
C. Other Operating Revenue
Export Incentives 854.80 824.03
Operating and maintainence services 1,953.12 1,319.26
Service fees 4,825.02 -
Power off take compensation 2,768.39 -
Total 138,092.98 161,249.73
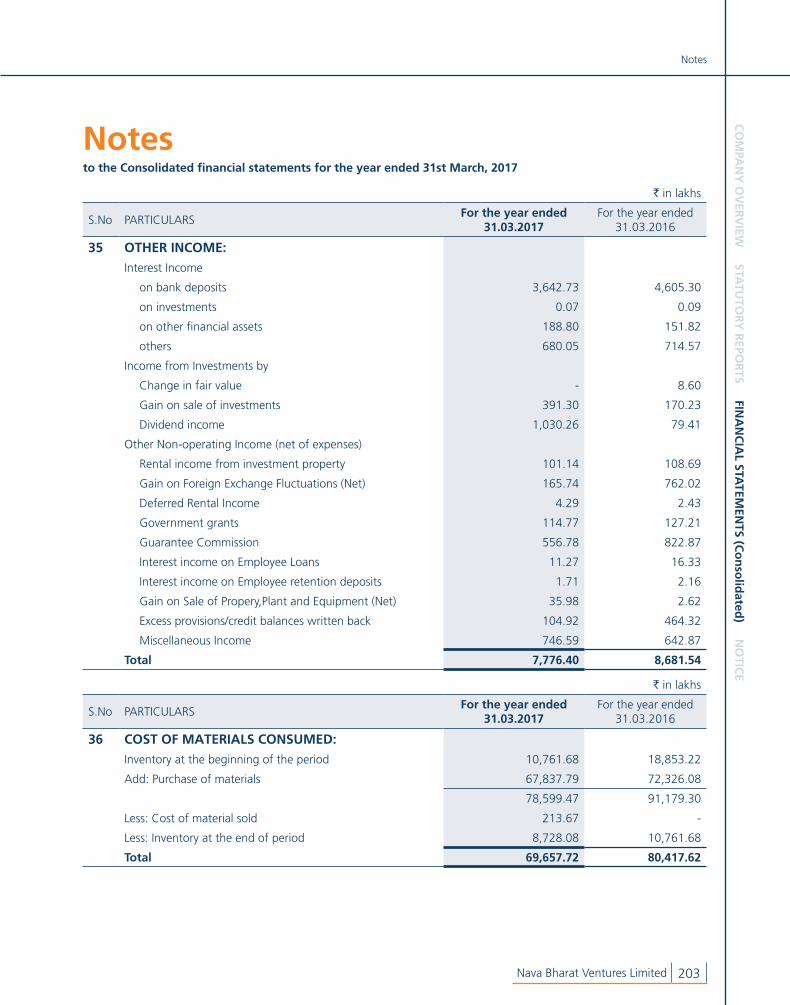
CO
MPA
NY
OV
ERV
IEW STA
TUTO
RY R
EPOR
TS FINA
NC
IAL STA
TEMEN
TS (Co
nso
lidated
) NO
TICE
Notesto the Consolidated financial statements for the year ended 31st March, 2017
Notes
Nava Bharat Ventures Limited 203
` in lakhs
S.No PARTICULARSFor the year ended
31.03.2017For the year ended
31.03.2016
35 OTHER INCOME:
Interest Income
on bank deposits 3,642.73 4,605.30
on investments 0.07 0.09
on other financial assets 188.80 151.82
others 680.05 714.57
Income from Investments by
Change in fair value - 8.60
Gain on sale of investments 391.30 170.23
Dividend income 1,030.26 79.41
Other Non-operating Income (net of expenses)
Rental income from investment property 101.14 108.69
Gain on Foreign Exchange Fluctuations (Net) 165.74 762.02
Deferred Rental Income 4.29 2.43
Government grants 114.77 127.21
Guarantee Commission 556.78 822.87
Interest income on Employee Loans 11.27 16.33
Interest income on Employee retention deposits 1.71 2.16
Gain on Sale of Propery,Plant and Equipment (Net) 35.98 2.62
Excess provisions/credit balances written back 104.92 464.32
Miscellaneous Income 746.59 642.87
Total 7,776.40 8,681.54
` in lakhs
S.No PARTICULARSFor the year ended
31.03.2017For the year ended
31.03.2016
36 COST OF MATERIAlS CONSUMED:
Inventory at the beginning of the period 10,761.68 18,853.22
Add: Purchase of materials 67,837.79 72,326.08
78,599.47 91,179.30
Less: Cost of material sold 213.67 -
Less: Inventory at the end of period 8,728.08 10,761.68
Total 69,657.72 80,417.62

Notesto the Consolidated financial statements for the year ended 31st March, 2017
204 45th Annual Report 2016-17
` in lakhs
S.No PARTICULARSFor the year ended
31.03.2017For the year ended
31.03.2016
37 PURCHASE OF TRADE GOODS:Fertilizers 166.18 192.76 PVC Pipes 15.48 0.71 Others 222.50 530.07 Total 404.16 723.54
` in lakhs
S.No PARTICULARSFor the year ended
31.03.2017For the year ended
31.03.2016
38 CHANGES IN INVENTORIES:Inventory at the beginning of the year
Traded goods 73.75 49.57 Finished goods 9,574.76 13,883.42 Work in progress 1,258.40 (2,080.11)
10,906.91 11,852.88 Inventory at the end of the year
Traded goods 1,487.85 73.75 Finished goods 12,039.02 9,574.76 Work in progress 631.96 1,258.40
14,158.83 10,906.91 (3,251.92) 945.97
` in lakhs
S.No PARTICULARSFor the year ended
31.03.2017For the year ended
31.03.2016
39 OTHER MANUFACTURING EXPENSES:Mining expenses 3,242.91 3,482.46 Stores Consumed 3,432.14 2,890.20 Power, Fuel and Water 1,469.40 1,547.46 Briquetting expenses 339.23 392.28 Fly Ash Bricks manufacturing 51.46 20.14 Organic Manure expenses 61.52 42.91 Raw Material Handling expenses 1,708.35 1,604.21 Finished Product Handling expenses 642.99 607.50 Cane Development expenses 356.59 259.63 Testing and Analysis charges 55.00 53.14 Consultancy services 3,070.82 - Operational and maintenance expenses 111.30 - Other expenses 322.31 367.79 Total 14,864.02 11,267.72

CO
MPA
NY
OV
ERV
IEW STA
TUTO
RY R
EPOR
TS FINA
NC
IAL STA
TEMEN
TS (Co
nso
lidated
) NO
TICE
Notesto the Consolidated financial statements for the year ended 31st March, 2017
Notes
Nava Bharat Ventures Limited 205
` in lakhs
S.No PARTICULARSFor the year ended
31.03.2017For the year ended
31.03.2016
40 EMPlOYEE BENEFITS EXPENSE:
Salaries, Wages and Bonus 11,067.53 9,578.23
Contribution to Provident and Other Funds 731.09 489.34
Staff Welfare Expenses 724.17 644.67
Interest on employee retention deposits 3.74 3.41
Discount on Employee trust loan 27.77 52.62
Discount on Employee loans 3.50 3.63
Gratuity 749.89 496.69
Total 13,307.69 11,268.59
` in lakhs
S.No PARTICULARSFor the year ended
31.03.2017For the year ended
31.03.2016
41 FINANCE COSTS
Interest 6,425.91 7,519.91
Interest Cost - Security Deposits 3.64 3.59
Sugar Term Loan - Finance Cost 117.46 126.59
Bank charges and commission 705.33 1,065.02
Interest on expenditure towards site restoration 56.65 52.46
Forward contracts and Swap loss 1,342.19 -
Total 8,651.18 8,767.57
` in lakhs
S.No PARTICULARSFor the year ended
31.03.2017For the year ended
31.03.2016
42 DEPRECIATION AND AMORTISATION EXPENSE:
Depreciation on Property, Plant and Equipment 9,494.84 8,329.67
Amortisation of Intangible Assets 68.64 49.60
Depreciation on Investment Property 5.70 5.70
9,569.18 8,384.97
Less: Amount capitalised 529.18 13.55
Total 9,040.00 8,371.42

Notesto the Consolidated financial statements for the year ended 31st March, 2017
206 45th Annual Report 2016-17
` in lakhs
S.No PARTICULARSFor the year ended
31.03.2017For the year ended
31.03.2016
43 OTHER EXPENSES:
Excise duty 3,641.66 2,758.08
Rent 145.98 151.40
Amortisation of Prepaid Lease Rentals 5.07 5.31
Repairs and maintenance
Machinery 3,368.86 4,236.60
Buildings 649.63 738.91
Other Assets 380.28 230.28
Rates and Taxes 2,186.20 2,417.01
Freight and Transportation 1,243.19 1,629.91
Insurance 772.91 644.04
Advertisement and sales promotion 106.86 48.20
Communications 219.18 163.13
Travelling and Conveyance 696.81 398.60
Vehicle Maintenance 273.50 163.33
Ash Handling Charges 98.53 253.01
Open access charges 1,398.68 1,250.73
Legal and Professional Charges 3,495.68 1,335.47
Payments to Auditors
as auditors 110.79 109.52
for tax audit 15.47 16.63
for other matters 34.10 16.43
for expenses 0.25 0.29
Cost Auditors' fee 8.08 7.82
CSR expenses 940.49 655.01
Assets discarded 106.42 7.95
General expenses 3,072.31 2,693.51
Loss on sale of materials - 196.19
Prior period adjustments 410.15 50.10
Investments written off 27.00 0.07
Provision for other financial assets 186.71 -
Bad debts written off 927.75 9.07
Fair value loss on Investments 472.77 -
Total 24,995.27 20,186.60

CO
MPA
NY
OV
ERV
IEW STA
TUTO
RY R
EPOR
TS FINA
NC
IAL STA
TEMEN
TS (Co
nso
lidated
) NO
TICE
Notesto the Consolidated financial statements for the year ended 31st March, 2017
Notes
Nava Bharat Ventures Limited 207
` in lakhs
S.No PARTICULARSFor the year ended
31.03.2017For the year ended
31.03.2016
44 OTHER COMPREHENSIVE INCOME:Actuarial Gain/(Loss) on Gratuity Expense for the year 220.01 58.02
Deferred Taxes on above (74.35) (18.98)
Foreign currency translation reserve (1,933.04) 3,056.02
Total (1,787.38) 3,095.06
` in lakhs
S.No PARTICULARSFor the year ended
31.03.2017For the year ended
31.03.2016
45 EARNINGS PER EQUITY SHARE:Profit for the period attributable to owners of the company 10,121.40 28,364.20
Weighted average number of equity shares of ` 2/- each (Basic) (Numbers in lakhs) 892.88 892.88
Add: Bonus Issue (Numbers in lakhs) 892.88 892.88
Weighted average number of equity shares of ` 2/- each (Diluted) (Numbers in lakhs) 1,785.76 1,785.76
Earnings per share of value of ` 2/- (Basic) 5.67 15.88
Earnings per share of value of ` 2/- (Diluted) 5.67 15.88
46: DETAIlS FOR NON CURRENT INVESTMENTS:` in lakhs
ParticularsFace Value
As at March 31, 2017
As at March 31, 2016
As at April 01, 2015
` Number Amount Number Amount Number Amount
Investment in Equity Shares
in other companies (Designated at FVTPL) (quoted)
Avanthi Leathers Limited 10.00 63,300 0.63 63,300 0.63 63,300 0.63
NB Footwear Limited 10.00 76,830 4.41 76,830 3.07 76,830 1.81
Avanthi Feeds Limited 2.00/ 10.00 7,500 55.31 7,500 29.84 1,500 23.06
IDBI Bank Limited 10.00 8,000 6.01 8,000 5.55 8,000 5.68
Andhra Bank 10.00 22,800 13.21 22,800 11.91 22,800 18.01
Tata Consultancy Services Limited 1.00 12,284 298.72 12,284 309.59 12,284 313.73
MOIL Limited 10.00 9,651 30.28 9,651 21.01 9,651 26.69
Kothari Sugars and Chemicals Limited 10.00 200 0.03 200 0.02 200 0.01
The Jeypore Sugar Company Limited 10.00 2,857 0.03 2,857 0.03 2,857 2.06

Notesto the Consolidated financial statements for the year ended 31st March, 2017
208 45th Annual Report 2016-17
` in lakhs
ParticularsFace Value
As at March 31, 2017
As at March 31, 2016
As at April 01, 2015
` Number Amount Number Amount Number Amount
408.63 381.65 391.68
in Subsidiaries (at cost) (un-quoted)
NB Tanagro Limited USD 1 1,000 0.65 - - - -
Kariba Sugar Limited USD 1 1,000 0.67 - - - -
1.32 - -
in Associates (Designated at FVTPL)(un-quoted)
Kinnera Power Company Private Limited 10.00 25,844 2.58 25,844 2.58 25,844 2.58
in other companies (Designated at FVTPL) (un-quoted)
Unquoted equity instruments
Indo Coal Ventures Limited USD 1 - - - - 99 0.06
A P Gas Power Corporation Limited 10.00 17 0.00 17 0.00 17 0.00
Srinivasa Cystine Limited 10.00 75,000 271.14 75,000 279.98 75,000 223.70
Malaxmi Highway Private Limited 10.00 646,600 - 646,600 48.38 646,600 48.38
271.14 328.36 272.14
Investment in Preference Shares
in other companies (Designated at FVTPL) (un-quoted)
Rio Realty Private Limited 100.00 1 135.50 1 135.50 1 135.50
Juventus Infrastructure and Projects Private Limited 100.00 1 130.00 1 130.00 1 130.00
A9 Realty Private Limited 100.00 7 736.00 7 736.00 7 736.00
1,001.50 1,001.50 1,001.50
Investment in Government Securities (at cost)
6 years National Savings Certificates 0.50 0.90 0.90
Grand Total 1,685.67 1,714.99 1,668.80

CO
MPA
NY
OV
ERV
IEW STA
TUTO
RY R
EPOR
TS FINA
NC
IAL STA
TEMEN
TS (Co
nso
lidated
) NO
TICE
Notesto the Consolidated financial statements for the year ended 31st March, 2017
Notes
Nava Bharat Ventures Limited 209
47: DETAIlS FOR CURRENT INVESTMENTS ` in lakhs
Particulars
As at March 31, 2017 As at March 31, 2016 As at April 01, 2015No. of
Shares/units
Fair Value
No. of Shares/units
Fair Value
No. of Shares/units
Fair Value
Investment in Mutual Funds (FVTPL)(Unqouted)Debt mutual funds:
Birla Sunlife Income Fund 159,425 116.84 159,425 105.31 954,823 602.50 Birla Sunlife Savings Fund 198,391 632.18 - - - - Birla Sunlife Short Term Opportunities Fund 439,221 119.18 439,221 108.91 439,221 100.47 HDFC Cash Management Fund 2,073,187 671.92 - - - - HDFC Short Term Fixed Maturity Plan 3,189,518 1,033.72 - - - - HDFC Short Term Opportunities Fund 5,848,911 1,052.10 - - - - ICICI Pru Corporate Bond Fund 1,219,448 309.35 - - - - ICICI Prudential Income Opportunities Fund 2,224,377 511.79 - - - - ICICI Prudential Income Regular Fund 228,833 119.63 228,833 106.19 1,369,997 601.31 ICICI Prudential Regular Savings Fund 685,251 119.02 685,251 108.20 685,251 100.50 ICICI Purudential Equity Arbitrage Fund 4,552,479 625.60 - - - - ICICI Purudential Money Market Fund 127,784 286.72 - - - - IDFC Arbitration (Dividend Payout) Fund 4,319,157 546.41 4,319,157 544.48 4,319,157 538.73 IDFC Corporate Bond Fund 4,378,759 489.17 - - - - IDFC Money Manager Fund - - 2,806,646 282.63 4,118,775 414.76 IDFC Super Saver Fund - - 1,327,514 475.89 1,327,514 453.64 IDFC Super Saver Income Fund 1,258,420 419.96 - - - - Kotak Equity Arbitrage Fund 6,508,601 699.49 - - - - Kotak Floater Short Term Fund - - 20,258 502.88 - - Kotak Income Opportunities Fund 10,604,454 1,902.87 - - - - Kotak Low Duration Fund 79,838 1,582.77 - - - - L&T Income Opportunities Fund 10,513,866 1,962.57 - - - - Reliance Corporate Bond Fund 8,633,274 1,136.64 - - - - Reliance Regular Savings Fund 973,929 220.66 528,639 109.17 528,639 100.46 TATA Dynamic Bond Fund - - 2,093,836 481.80 2,093,836 453.89 TATA Floater Fund 12,810 315.78 - - - - UTI Income Opp Fund 2,088,409 310.44 - - - -
Total 15,184.81 2,825.46 3,366.26 Liquid Mutual Funds:
SBI Premier Liquid Fund-Growth - - 18,119 430.53 26,016 571.23 SBI Premier Liquid Fund-Dividend - - - - 18,140 181.99 L & T Liquid Fund - - 24,243 502.85 - -
Total - - 933.38 753.22 Grand Total - 15,184.81 - 3,758.84 - 4,119.48

Notesto the Consolidated financial statements for the year ended 31st March, 2017
210 45th Annual Report 2016-17
48 Exceptional items consist of ` 2,687.35 Lakhs relating profit on disposal of subsidiary and ` 5,172.28 Lakhs from recognition of Loans granted by the Govt. to a Foreign Subsidiary.
i. The stake held by Nava Bharat Lao Energy in Nampak Power Company Limited (NCPL) which is engaged in the construction and operation of Hydro Power Project of (3*50 MW = 150MW) in Laos was disposed for a Consideration of ` 6,801.92 Lakhs which resulted a profit of ` 2,687.35 Lakhs.
ii. One of the Subsidiaries Viz., Mamba Collieries Limited Pursuant to an agreement with Govt. of Zambia consolidated all the loans taken in earlier years from different government Agencies /institutions which bears an interest at a rate of 1.5% per annum and repayable within 20 years with a moratorium period of 5 years. These loans were recognised at amortised cost and the resultant impact of ̀ 5,172.28 Lakhs has been taken to the statement of profit and loss by subsidiary. Considering the materiality and the nature of gain, it has been presented under exceptional item.
49 Maamba Collieries Limited (MCL), Zambia has ` 4,279.77 Lakhs (USD 6,600,000) (2016: nil) in restricted cash held in the bank as a result of the power purchase agreement, which requires ZESCO Limited to deposit an amount of ` 15,562.80 Lakhs (USD 24 million) in the escrow account. The balance is not available to finance the company’s day to day operations and therefore has been excluded from the cash and cash equivalents for the purpose of statement of cash flows. The balance is available for use after 20 years that is at the end of the contract.
50 TERM lOANS:
(i) The loans are secured by first charge by way of equitable mortgage by deposit of title deeds to cover all immovable properties of the parent company and hypothecation of all movable properties including movable plant and machinery, spares, tools and accessories, both present and future and a second charge by way of hypothecation of all movable properties both present and futures (except book debts) subject to prior charges/to be created in favour of parent company’s Bankers on its stocks of raw materials, semi-finished and finished goods, consumable stores for securing borrowings for
working capital requirements. The mortgage/charge created above shall rank pari passu with the charges created/to be created in favour of other financial institutions/banks.
a. Loan 1 from State Bank of India is secured by pledge of 104,600,000 share of USD 1/- each (being 51% of the shares) held by the parent company in its subsidiary, M/s Nava Bharat (Singapore) Pte. Limited. The loan is repayable in 26 quarterly instalments of ` 1,904.00 Lakhs commencing from April 01, 2014. During the year parent company entered into a swap contract and converted the loan into FCNR Borrowing for a period of 6 months. After the expiry of the swap contract the loan will be re-converted into a rupee term loan.
b. The Loan 2 from State Bank of India is repayable in monthly instalments of `30.14 Lakhs commencing from December 01, 2016.
(ii) The loans availed by Nava Bharat energy India Limited (NBEIL) from IDBI Bank Limited, Andhra Bank, Bank of India, Bank of Baroda, State Bank of Hyderabad, UCO Bank, State Bank of Mysore and Punjab & Sindh Bank are secured by a first charge created in favour of security trustee on the present and future fixed assets of the Company and an equitable mortgage on the lease rights of land of 170 acres obtained from Holding Company, by a registered mortgage of the Flat No.102 admeasuring 303 Sq. feet situated at Plot No.458-C, III Avenue Road, Indira Nagar, Chennai-600020 and also pledge of 26,00,00,000 equity shares held by the Promoter representing 26% of issued and paid up Share Capital of the Company with Trustee, ranking paripassu with all the lenders.
The lenders have an option to demand for conversion of their loans together with interest into equity in the event of default, for which the Company has agreed in terms of the common loan agreement entered into.
The term loans carry interest @11.00% p.a. (previous year: @11.50% p.a.) payable monthly. The Loans are repayable in 36 quarterly equal instalments and the first of such instalment commenced on 1st April 2013.

CO
MPA
NY
OV
ERV
IEW STA
TUTO
RY R
EPOR
TS FINA
NC
IAL STA
TEMEN
TS (Co
nso
lidated
) NO
TICE
Notesto the Consolidated financial statements for the year ended 31st March, 2017
Notes
Nava Bharat Ventures Limited 211
(iii) The term loans availed by Maamba Collieries Limited, Zambia (MCL) from Development Bank of South Africa and Industrial Development Corporation of South Africa carry interest rate at 6.50% and 6.60% above libor p.a. respectively and other loans from Barclays Bank Zambia Plc and ECA Facility carry interest rate at 5.00% above libor p.a. The loans are repayable in 20 half instalments and the first instalment has fallen due and payment is made in March 2017.
(iv) Maamba Collieries Limited, Zambia (MCL) signed an agreement in 2015 with the Government of Zambia to consolidate all the Government loans into one loan. The loans included were Zambia Development Agency, Government Republic Zambia, Scheme of Arrangement Loans. The loan has an annual interest rate of 1.5% and is repayable over a period of 20 years which includes a grace period of 5 years. The fair values of the Government loans have been stated as the present value of all future cash payments discounted using the prevailing market rate of interest for similar instruments.
(v) The term loan availed by Maamba Collieries Limited, Zambia (MCL) from Africa Finance Corporation of South Africa carry interest rate at 7.57% above libor p.a. The loan is repayable in 20 half instalments and the first instalment has fallen due and payment is made in March 2017.
Working Capital Loans:
Working capital loans from banks are secured by hypothecation of raw materials, work-in-progress, finished goods, stores and spares and book debts to the extent of ` 21,600 Lakhs and a second charge on fixed assets of the company.
The working Capital Loan from Andhra Bank to the extent of `100.00 Crores including non-Fund based facility of `50.00 crores is secured by a first charge created in favour of security trustee on the present and future fixed and Currents assets of the Company, an equitable mortgage on the lease rights of land of 170 acres obtained from Nava Bharat Ventures Limited, by a registered mortgage of the Flat No:102, admeasuring 303 Sq. Feet situated at Plot No: 458 - C, III Avenue Road, Indira
Nagar, Madras - 600020 and also pledge of 260,000,000 equity shares held by Nava Bharat Ventures Limited, representing 26% of issued and paid up share Capital of the Company with trustee, ranking paripassu with the security created or to be created in favour of the term lenders.
i. Carries the interest at a rate of 9.25% / 9.50% p.a. and repayable on demand.
ii. Carries interest at a rate of 1.75%, 1.83% and 1.70% and are repayable ` 1,040.94 Lakhs, ` 1,412.90 Lakhs and ` 664.53 Lakhs along with the interest on June 03, 2017, July 07, 2017 and July 21, 2017 respectively.
51. Investigation into the allotment of coal blocks to Brahmani Thermal Power Private Limited (BTPPL), formerly Navabharat Power Private Limited (NPPL):
During the year 2005-06, the Company through its subsidiary Nava Bharat Projects Limited (NBPL), along with Malaxmi Group was incorporated a joint venture (50:50) Company Navabharat Power Private Limited (NPPL), to set up a 1040 MW Thermal based Power Generating station in the state of Odisha. In NPPL, Mr. P Trivikrama Prasad was appointed as Non-Executive Chairman representing Nava Bharat Group and Mr. Y. Harish Chandra Prasad as Vice Chairman cum Managing Director representing Malaxmi Group.
During the process of Project implementation NPPL obtained various key clearances which included Coal Linkage from Mahanadi Coalfields Limited and also got allocated a captive coal block in Rampia and Dip side of Rampia, to be shared with 5 other Power Generators.
Due to a stalemate in the management of NPPL, the investments made by the Group in NPPL were disposed of to a third party in two tranches during the years 2010-11 and 2011-12 and the Group invested the proceeds in the Equity Share Capital of Nava Bharat Energy India Limited (NBEIL), a subsidiary of the Company.
During the year 2012-13, based on the Comptroller and Auditor General India’s Report, a complaint was lodged with the Central Vigilance Commission (CVC) by certain Public Representatives and thereupon, the CVC directed the Central Bureau of Investigation (CBI) to enquire and investigate into those allegations

Notesto the Consolidated financial statements for the year ended 31st March, 2017
212 45th Annual Report 2016-17
made by the complainants against the allocation of the coal blocks. The CBI conducted investigations against several allottees and registered FIRs including one on NPPL and its, the then, promoters-directors in the month of September 2012. Investigations by CBI and Enforcement Directorate (ED) were initiated against the then Directors of NPPL, alleging misrepresentations in obtaining coal block and receipt of the crime proceeds by the stake sale respectively. The CBI filed charge sheet before the Special Court in CC No: 2 of 2015 and was taken cognizance by the said court against the then VC and MD (NPPL/BTPPL), the then Chairman (NPPL/BTPPL) and the Company, (NPPL/BTPPL) vide order dated 28th July 2015 Passed by the special Court, New Delhi. Further the matter proceeded with arguments on the charge of the then Non-Executive Chairman of NPPL before the said court through his counsels as to why the Charge against him should not be considered against him. The matter is under trial before the Special Court. It is pertinent to state that if the Special Court considers favorably the arguments advanced by the then Non-Executive Chairman setting out his non-participation in the day to day Management and Coal block allocation proceedings, then he will be out of trial Proceedings. Similar pleadings were made in parallel before the Hon’ble Supreme Court and the matter is yet to be disposed.
The Enforcement Directorate, Hyderabad, vide its Provisional Attachment Order dated 22.07.2014 attached the Equity Shares to the extent of `138.59 crores being equivalent to the proceeds of stake sale net of Income Tax, out of the investment made by the Group in the share capital of NBEIL and the said Provisional Order was also confirmed by the Adjudicating Authority under Prevention of Money Laundering Act, 2002 (PMLA) vide Order dated 20.05.2015. The ED issued a letter dated 09.07.2015 to Nava Bharat Projects Limited requesting to transfer entire 73,99,99,994 equity shares of `2/- each face value of Nava Bharat Energy India Limited held by the Company Against the said confirmation order of the Adjudicating Authority and letter dated 09.07.2015 of ED, appeal was filed before the Appellate Tribunal under PMLA. The Appellate Tribunal granted stay against operation of the Letter dated 09.07.2015 issued by the ED vide Order dated 30.07.2015 and the said stay has from time to time been extended till 28.08.2017, on which date the main appeal stands posted for final hearing.
The Group’s management considers that the likelihood of the confiscation of the shares being successful is remote and hence, no contingent liability is recognised on account of the above attachment at this juncture.
52. Development of Special Economic Zone (SEZ) in one of the Subsidiaries Viz., Brahmani Infratech Private Limited (BIPL)
During the year 2006-2007 the Company was allotted 250 Acres of land by APIIC Limited to develop 150 Acres as Special Economic Zone (SEZ) area and 100 Acres as Non SEZ area. Sale deed in respect of 150 Acres was executed in favour of the Company and that in respect of balance 100 Acres of land, was to be executed as per the terms of allotment. However, APIIC Limited was entitled to cancel the allotment of entire land in case of non-fulfilment or breach of any terms and conditions or obligations set forth while allotting the land.
The Company had entered into a development Agreement with Mantri Technology Parks Private Limited. (MTPPL), Bangalore (appointed as Co-Developer) for the development of 238 Acres (including IT/ITES SEZ in 150 Acres) of the land allotted as above. The Co-Developer had, pursuant to this agreement, undertaken compliance of the conditions stipulated by the Go AP/APIIC Limited including construction, development and marketing of the developed space covering IT/ITES, commercial and residential accommodation. The Co-Developer, at the behest of the Company, paid security deposit pursuant to this agreement to the holding Company, Nava Bharat Ventures Limited, and appropriate interest compensation thereof was provided between both the Companies.
As per the terms of AOSPOA, the agreed date of completion of development of the project was 6th November 2012. However, the Company sought an extension of time up to November 2021 by an application dated 07th March 2011 to the concerned authorities for which there was no response from the concerned.
In the meantime, the Co-Developer Viz. Mantri Technology Parks Private Limited., Bangalore, by their letter dated 2nd May 2012 opted for termination of the Joint Development agreement with a request to return the Security Deposit.

CO
MPA
NY
OV
ERV
IEW STA
TUTO
RY R
EPOR
TS FINA
NC
IAL STA
TEMEN
TS (Co
nso
lidated
) NO
TICE
Notesto the Consolidated financial statements for the year ended 31st March, 2017
Notes
Nava Bharat Ventures Limited 213
The Company (BIPL) after protracted correspondence with the Co–Developer Mantri Technology Parks Private Limited., Bangalore, terminated the Contract with effect from 9th July 2012 under the Joint Development agreement dated 27th February 2008 read with the Supplementary Agreement dated 28th February 2008 on account of failure of Mantri Technology Parks Private Limited to complete the Project of IT/ITES/SEZ at Hyderabad as Co-Developer under the patronage of Mantri Developers Private Limited as Technical Associate in accordance with the terms of agreement and they were informed of the Companies intention to forfeit the Security Deposit of ` 30,00,00,000/- (Thirty Crores) paid by Co-Developer.
Against such termination, Mantri Technology Parks Private Limited., Bangalore, invoked the arbitration clause of the agreement requesting for conciliation process to settle the issue and due to lack of consensus among the Parties regarding the arbitrator to be appointed as per the arbitration clause of the agreement, made an application to the Hon’ble High Court of Andhra Pradesh to appoint an arbitrator under Section 11 (5) & (6) of the Arbitration and Conciliation Act 1996 read with Scheme for appointment of Arbitrators , 1996.
In the meantime, MTPPL, Bangalore, has also filed a Petition in the Hon’ble City Civil Court Praying to grant injunction restraining the Group from dispossessing MTPPL from the property either by way of surrender of the land to APIIC Ltd., or by way of its replacement for a fresh Developer and also to direct the Group to deposit the Security Deposit of ` 30,00,00,000/- (Thirty Crores) paid by them in pursuance of the Joint Development Agreement, in the Hon’ble Court. The matter was sub-judice in the Court. During the year under review, the petition was dismissed as withdrawn.
The Hon’ble High Court of Andhra Pradesh appointed Justice Syed Shah Mohammed Quadri as Sole Arbitrator on 21.06.2013 who commenced the Arbitral proceedings on 05.08.2013, passed the award on 31.01.2015, inter alia, to the following effect:
i. The Claimant, MTPPL is held entitled to `30,00,00,000/- towards interest free security deposit; `4,82,04,854/- being the amount paid to the respondent towards reimbursement of expenses and `4,36,90,047/- towards expenses for development of the allotted land. All these amounts shall carry interest @ 12% p.a. from 02-05-2012 till 31-01-2015 (date of the Award).
ii. The Respondent, BIPL is held entitled to receive from the Claimant `18,13,33,333/- (Rupees Eighteen Crores Thirteen Lakhs Thirty-Three Thousand Three Hundred and Thirty-Three Only) together with interest @ 12% p.a. from 02-05-2012 till 31-01-2015 (date of the Award). The remaining claims are rejected.
iii. The awarded amount will carry interest at the rate of 18% per annum from the date of the Award till the date of realization of the awarded amount.
MTPPL filed a petition under Sec.9 of the Arbitration and Conciliation Act, 1996, for interim measures of protection in the City Civil Court at Hyderabad (ARB. O.P.No. 571/2015). As the Arbitral Award contained certain prima facie deviations and inconsistencies and being aggrieved against them, the Group (BIPL) also filed a representation on 07.04.2015, Under Sec.34 of the Arbitration and Conciliation Act, 1996 to set aside the arbitral award in the City Civil Court at Hyderabad (ARB.O.P.No. 663/2015). Further on 29.04.2015 MTPPL also made an application in the City Civil Court at Hyderabad (ARB. O.P.No. 778 of 2015), Under Sec.34 of the Arbitration and Conciliation Act, 1996 to set aside the Counter-Claim awarded in favour of BIPL vide the impugned Award dated 31.01.2015. Subsequently the petitions filed by the parties vide (1395 and 1396 /2015), ARB. O.P.No. 571/2015 and ARB. O.P.No. 778 of 2015 were clubbed with ARB. O.P.No. 663/2015 and have been pending in City Civil Court at Hyderabad.

Notesto the Consolidated financial statements for the year ended 31st March, 2017
214 45th Annual Report 2016-17
` in lakhs
S.No PARTICULARSFor the year ended
31.03.2017For the year ended
31.03.2016
53 MOVEMENTS IN PROVISIONS:
Gratuity: (Refer Note: 54 also)
At the beginning of the year 1,666.00 1,595.29
Charge for the year 252.78 247.54
Released during the year (277.27) (176.83)
At the end of the year 1,641.51 1,666.00
Compensated Absences:
At the beginning of the year 843.48 848.18
Charge for the year 237.16 185.85
Released during the year (204.68) (190.55)
At the end of the year 875.96 843.48
` in lakhs
S.No PARTICULARSFor the year ended
31.03.2017For the year ended
31.03.2016
54 RETIREMENT BENEFIT OBlIGATIONS
A. Defined Contribution Plan (Expenses)
Contribution to Provident Fund and other funds 611.41 409.21
Contribution to Employee State Insurance 3.58 4.85
` in lakhs
PARTICULARSFor the year ended
31.03.2017For the year ended
31.03.2016
B. Post – employment Defined Benefit Plans (Gratuity)
1. Movement in Obligation
Present Value of Obligation at the beginning of year 1,666.00 1,595.29
Current Service Cost 125.36 126.92
Interest Cost 122.09 119.71
Benefits Paid (58.91) (26.47)
Benefits paid directly by the Group - (82.85)
Actuarial (Gain)/Loss on Obligation (213.02) (66.60)
Present Value of Obligation at the end of year 1,641.52 1,666.00

CO
MPA
NY
OV
ERV
IEW STA
TUTO
RY R
EPOR
TS FINA
NC
IAL STA
TEMEN
TS (Co
nso
lidated
) NO
TICE
Notesto the Consolidated financial statements for the year ended 31st March, 2017
Notes
Nava Bharat Ventures Limited 215
` in lakhs
PARTICULARSFor the year ended
31.03.2017For the year ended
31.03.2016
2. Movement in Plan Assets – Gratuity
Fair Value of Planned assets at the beginning of the year 617.71 555.68
Adjustments to opening balance of plan assets (7.37) -
Return of Plan Assets (excl. int. income) (3.37) (14.74)
Interest Income 44.74 44.43
Contributions during the year 34.76 58.30
Benefits Paid during the year (55.98) (25.96)
Fair Value of Planned assets at the end of the year 630.49 617.71
` in lakhs
PARTICULARSFor the year ended
31.03.2017For the year ended
31.03.2016
3. Expenses recognised in Profit and Loss Statement:
Current Service Cost 125.36 126.92
Net Interest Cost 77.35 75.27
Expense for the year 202.71 202.19
` in lakhs
PARTICULARSFor the year ended
31.03.2017For the year ended
31.03.2016
4. Recognised in Other Comprehensive Income:
Actuarial (Gain) /loss for the year (213.02) (66.60)
Return on plan assets excluding net interest 3.37 14.74
Total Expenditure recognised (209.65) (51.86)

Notesto the Consolidated financial statements for the year ended 31st March, 2017
216 45th Annual Report 2016-17
` in lakhs
PARTICULARSFor the year ended
31.03.2017For the year ended
31.03.2016
5. Actuarial Assumptions for estimating Group’s Defined Benefit Obligation:
a. Attrition Rate
Nava Bharat Ventures Limited (NBVL) PS: 0 to 42: 13.33% PS: 0 to 42: 10%
Nava Bharat Energy India Limited (NBEIL) PS: 0 to 42: 2.50% PS: 0 to 42: 2.50%
Nava Bharat Projects Limited (NBPL) PS: 0 to 42: 5.00% PS: 0 to 42: 5.00%
Brahmani Infratech Private Limited PS: 0 to 42: 1.00% PS: 0 to 42: 1.00%
b. Discount Rate 6.69% 7.46%
c. Expected Rate of Increase in Salary
NBVL/NBEIL/NBPL 6.00% 6.00%
Brahmani Infratech Private Limited 3.00% 3.00%
d. Expected Rate of return on Plan Assets 6.69% 7.46%
e. Mortality Rate IALM (2006-08) Ult. IALM (2006-08) Ult.
f. Expected Average remaining working lives of employees (years)
Nava Bharat Ventures Limited 8.73 6.80
Nava Bharat Energy India Limited 12.60 12.52
Nava Bharat Projects Limited 20.75 18.63
Brahmani Infratech Private Limited 14.49 9.28
` in lakhs
PARTICULARSFor the year ended
31.03.2017For the year ended
31.03.2016
6. Sensitivity Analysis
Sensitivity Change Effect on obligations
Discount Rate +1% 1,545.49
-1% 1,751.89
Salary Escalation Rate +1% 1,722.13
-1% 1,565.35
The above sensitivity analysis is based on a change in an assumption while holding all other assumptions constant. In practice, this is unlikely to occur, and changes in some of the assumptions may be correlated. When calculating the sensitivity of the defined benefit obligation to significant actuarial assumptions the same method (projected unit credit method) has been applied as when calculating the defined benefit obligation recognised within the Balance Sheet.

CO
MPA
NY
OV
ERV
IEW STA
TUTO
RY R
EPOR
TS FINA
NC
IAL STA
TEMEN
TS (Co
nso
lidated
) NO
TICE
Notesto the Consolidated financial statements for the year ended 31st March, 2017
Notes
Nava Bharat Ventures Limited 217
` in lakhs
PARTICULARSFor the year ended
31.03.2017For the year ended
31.03.2016
7. Expected Payout - GratuityExpected payments – 1st Year 451.31 403.74Expected payments – 2nd Year 167.80 93.12Expected payments – 3rd Year 141.94 72.69Expected payments – 4th Year 123.90 76.44Expected payments – 5th Year 109.64 72.21Expected payments – 6th year to 10th Year 441.76 154.81
8. Other Information:
i. The Group has invested plan assets with Life Insurance Corporation of India. Expected Return on Assets is based on rate of return declared by fund managers.
ii. Present value of defined benefit obligation:
Present value of the defined benefit obligation is calculated by using Projected Unit Credit method (PUC Method). Under the PUC method a “projected accrued benefit” is calculated at the beginning of the year and again at the end of the year for each benefit that will accrue for all active members of the Plan. The “projected accrued benefit” is based on the Plan’s accrual formula and upon service as of the beginning or end of the year, but using a member’s final compensation, projected to the age at which the employee is assumed to leave active service. The Plan Liability is the actuarial present value of the “projected accrued benefits” as of the beginning of the year for active members.
iii. Expected average remaining service Vs. Average Remaining Future Service:
The average remaining service can be arithmetically arrived by deducting current age from normal retirement age whereas the expected average remaining service is arrived actuarially by applying multiple decrements to the average remaining future service namely mortality and withdrawals. Thus, the expected average remaining service is always less than the average remaining future service.
iv. Current and Non-Current Liability:
The total of current and non-current liability must be equal with the total of PVO (Present value obligation) at the end of the period plus short term compensated liability if any. It has been classified in terms of Schedule III of the Companies Act, 2013.
Accordingly, below is the Current and Non-Current classification of Gratuity and Compensated Absences:
` in lakhs
ParticularsAs at
March 31, 2017As at
March 31, 2016
Gratuity: -
a. Current Portion 451.31 617.88
b. Non-current portion 613.22 430.40
Compensated Absences: -
a. Current Portion 249.05 484.12
b. Non-current portion 721.00 461.12

Notesto the Consolidated financial statements for the year ended 31st March, 2017
218 45th Annual Report 2016-17
55 INCOME TAX EXPENSE AND DEFERRED TAXES ` in lakhs
ParticularsFor the year ended
March 31, 2017For the year ended
March 31, 2016
Income Tax Expense: -
a. Current Tax 4,267.43 6,651.04
b. Deferred Tax (arising on temporary differences) 1,673.70 (3,044.56)
Tax expense attributable to the current year 5,941.13 3,606.48
C. MAT Credit entitlement (587.21) (5,278.97)
Total Tax Expense for the year 5,353.92 (1,672.49)
` in lakhs
ParticularsFor the year ended
March 31, 2017For the year ended
March 31, 2016
Effective Tax Reconciliation: -
a. Net Profit/(Loss) before taxes 16,060.89 27,981.92
b. Tax rate applicable to the Group as per normal provisions - -
c. Tax expense on net profit (c = a*b) 4,959.81 9,985.82
d. Increase/(decrease) in tax expenses on account of:
i. Non-taxable income/Exempt Income (660.71) (131.76)
ii. Accelerated Depreciation (1,497.86) (1.823.81)
iii. Expenses not allowed under income tax 1,861.09 387.96
iv. Expenses that are allowed under payment basis 101.52 139.30
v. Other allowances (2,447.70) (7,863.37)
vi. Income chargeable at special rates 118.14 396.48
vii. MAT Credit Entitlement of Indian Entities 587.21 5,278.97
vii. Other adjustments 1,245.92 321.45
(692.39) (3,294.78)
e. Tax as per normal provision under Income tax (c + d) 4,267.42 6,691.04
Deferred Taxes: -For the year ended
March 31, 2017For the year ended
March 31, 2016
As on the reporting date:
A. On OCI Component
-Actuarial Gain/(Losses) on Defined Benefit Plans (74.35) (18.98)
B. Other than OCI component
-Difference in WDV of fixed assets 1,369.25 3,240.48
-Fair Value of Financial Assets/liabilities 92.76 86.94
-Other disallowances (19.78) 62.76
-On tax losses 380.18 (6,396.78)
C. Total for the year 1,748.06 3,025.58
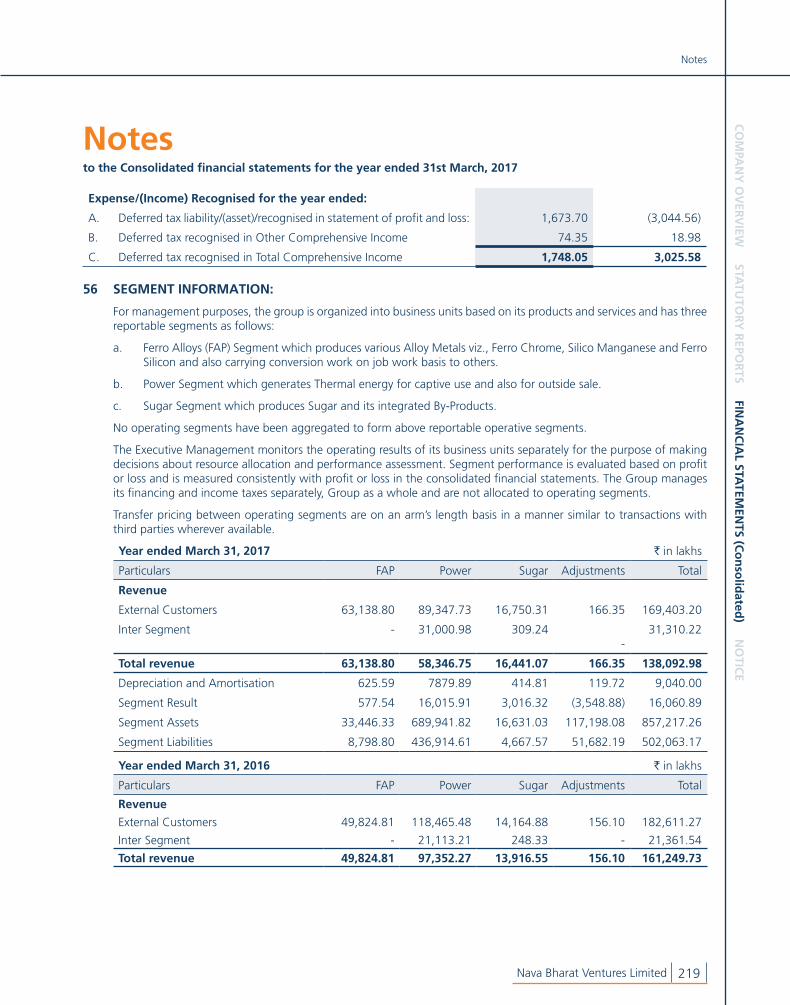
CO
MPA
NY
OV
ERV
IEW STA
TUTO
RY R
EPOR
TS FINA
NC
IAL STA
TEMEN
TS (Co
nso
lidated
) NO
TICE
Notesto the Consolidated financial statements for the year ended 31st March, 2017
Notes
Nava Bharat Ventures Limited 219
Expense/(Income) Recognised for the year ended:
A. Deferred tax liability/(asset)/recognised in statement of profit and loss: 1,673.70 (3,044.56)
B. Deferred tax recognised in Other Comprehensive Income 74.35 18.98
C. Deferred tax recognised in Total Comprehensive Income 1,748.05 3,025.58
56 SEGMENT INFORMATION:
For management purposes, the group is organized into business units based on its products and services and has three reportable segments as follows:
a. Ferro Alloys (FAP) Segment which produces various Alloy Metals viz., Ferro Chrome, Silico Manganese and Ferro Silicon and also carrying conversion work on job work basis to others.
b. Power Segment which generates Thermal energy for captive use and also for outside sale.
c. Sugar Segment which produces Sugar and its integrated By-Products.
No operating segments have been aggregated to form above reportable operative segments.
The Executive Management monitors the operating results of its business units separately for the purpose of making decisions about resource allocation and performance assessment. Segment performance is evaluated based on profit or loss and is measured consistently with profit or loss in the consolidated financial statements. The Group manages its financing and income taxes separately, Group as a whole and are not allocated to operating segments.
Transfer pricing between operating segments are on an arm’s length basis in a manner similar to transactions with third parties wherever available.
Year ended March 31, 2017 ` in lakhs
Particulars FAP Power Sugar Adjustments Total
Revenue
External Customers 63,138.80 89,347.73 16,750.31 166.35 169,403.20
Inter Segment - 31,000.98 309.24 -
31,310.22
Total revenue 63,138.80 58,346.75 16,441.07 166.35 138,092.98
Depreciation and Amortisation 625.59 7879.89 414.81 119.72 9,040.00
Segment Result 577.54 16,015.91 3,016.32 (3,548.88) 16,060.89
Segment Assets 33,446.33 689,941.82 16,631.03 117,198.08 857,217.26
Segment Liabilities 8,798.80 436,914.61 4,667.57 51,682.19 502,063.17
Year ended March 31, 2016 ` in lakhs
Particulars FAP Power Sugar Adjustments Total
Revenue
External Customers 49,824.81 118,465.48 14,164.88 156.10 182,611.27
Inter Segment - 21,113.21 248.33 - 21,361.54
Total revenue 49,824.81 97,352.27 13,916.55 156.10 161,249.73

Notesto the Consolidated financial statements for the year ended 31st March, 2017
220 45th Annual Report 2016-17
Depreciation and Amortisation 538.76 7,247.10 452.93 132.63 8,371.42
Segment Result (6,518.43) 33,606.90 202.78 690.67 27,981.92
Segment Assets 30,168.58 636,869.45 17,201.86 88,009.46 772,249.35
Segment Liabilities 5,326.65 368,098.53 8,211.28 40,870.57 422,507.03
Entity wide disclosures: ` in lakhs
Revenue from external customerFor the year ended
March 31, 2017For the year ended
March 31, 2016
India 109,358.89 137,437.88
Outside India 28,734.09 23,811.85
Total 138,092.98 161,249.73
Non-Current operating assetsAs at
March 31, 2017As at
March 31, 2016As at
March 31, 2015
India 152,269.96 154,351.38 151,698.86
Outside India 465,166.72 428,959.99 308,222.85
Total 617,436.68 583,311.37 459,921.71
For the purpose of non-current operating assets financial instruments, deferred tax assets, MAT Credit, post- employment benefit assets have been excluded.
57 FAIR VAlUE OF FINANCIAl INSTRUMENTS:
As at March 31, 2017: ` in lakhs
ParticularsFair Value through
profit or lossAmortised Cost Total
Financial Assets:Investments (other than subsidiaries) 1,683.86 - 1,683.86Loans to non-body corporate - 2,674.86 2,674.86Security Deposits - 1,192.90 1,192.90Employee Advance - 45.79 45.79Total 1,683.86 3,913.55 5,597.41Financial Liabilities:Term Loans - 374,634.33 374,634.33Employee Retention Deposits - 6.85 6.85Rental Deposits - 33.40 33.40Forward Contract liability 2,020.81 - 2,020.81Swap Contract liability 1,266.73 - 1,266.73Total 3,287.54 374,674.58 377,962.12

CO
MPA
NY
OV
ERV
IEW STA
TUTO
RY R
EPOR
TS FINA
NC
IAL STA
TEMEN
TS (Co
nso
lidated
) NO
TICE
Notesto the Consolidated financial statements for the year ended 31st March, 2017
Notes
Nava Bharat Ventures Limited 221
As at March 31, 2016:
ParticularsFair Value through
profit or lossAmortised Cost Total
Financial Assets:
Investments (other than subsidiaries) 1,714.10 - 1,714.10
Loans to non-body corporate - 3,190.06 3,190.06
Security Deposits - 1,191.60 1,191.60
Employee Advance - 48.23 48.23
Total 1,714.10 4,429.89 6,143.99
Financial Liabilities:
Term Loans - 340,319.86 340,319.86
Employee Retention Deposits - 11.05 11.05
Rental Deposits - 33.64 33.64
Forward Contract liability - - -
Swap Contract liability - - -
Total - 340,364.55 340,364.55
As at April 1, 2015:
ParticularsFair Value through
profit or lossAmortised Cost Total
Financial Assets:
Investments (other than subsidiaries) 1,667.92 - 1,667.92
Loans to non-body corporate - 3,056.27 3,056.27
Security Deposits - 1,176.13 1,176.13
Employee Advance - 72.04 72.04
Total 1,667.92 4,304.44 5,972.36
Financial Liabilities:
Term Loans - 46,881.79 46,881.79
Employee Retention Deposits - 20.36 20.36
Rental Deposits - 45.29 45.29
Total - 46,947.44 46,947.44
The management assessed that cash and cash equivalents, trade receivables, trade payables, and other current assets/liabilities approximate their carrying amount largely due to the short-term maturities of these instruments.
The fair value of the financials assets and liabilities is reported at the amount at which the instrument could be exchanged in a current transaction between willing parties, other than in a forced or liquidation sale. The following methods and assumptions were used to estimate the fair values:
a. The fair values of the quoted shares are based on price quotations at the reporting dates. The fair value of unquoted equity shares is based on the Net Assets available for Equity Shareholders of the Companies.
b. Fair value of Interest free loan given to employees and security deposits have been calculated by discounting future cash flows using rates currently available for debt on similar terms credit risk and remaining maturities.

Notesto the Consolidated financial statements for the year ended 31st March, 2017
222 45th Annual Report 2016-17
Description of significant observable inputs to valuation:
a. Loan given to employees’ trust:
Interest Rate factor has been considered at a rate of 12% p.a. by the Group for discounting the loan to the date of transition.
b. Investments in Un-quoted equity shares:
The fair values have been ascertained based of data available from financial statements of the unlisted companies. The net asset available for equity shareholders have been considered.
c. Interest free employee staff advance:
Interest Rate factor has been considered at a rate of 12% p.a. by the Group for discounting the cash flows by way of repayments by the employees.
e. Interest free Security Deposits (assets):
Interest Rate factor has been considered at a rate of 12% p.a. by the Group for discounting the amount receivable at the time of maturity.
f. Interest free Security Deposits (liabilities):
Interest Rate factor has been considered at a rate of 12% p.a. by the Group for discounting the amount receivable at the time of maturity.
58 FAIR VAlUE HIERARCHY:
The following table provide the fair value measurement hierarchy of the Group’s assets and liabilities.
Quantitative disclosures of fair value measurement hierarchy as at March 31, 2017:` in lakhs
Particulars TotalFair Value measurement using
Quoted prices in active markets
Significant observable inputs
Financial Assets measured at FVTPL
Investments 1,685.68 408.63 1,277.04
Financial Asset measured at Amortised Cost
Loans to non-body corporate 2,674.86 - 2,674.86
Security Deposits given 1,192.90 - 1,192.90
Employee Staff Advance 45.79 - 45.79
Financial Liabilities measured at Amortised Cost Term Loans 374,634.33 - 374,634.33Employee Retention Deposits 6.85 - 6.85Trade Deposits 33.40 - 33.40Financial Liabilities measured at FVTPL Forward Contract liability 2,020.81 2,020.81 - Swap Contract liability 1,266.73 1,266.73 -

CO
MPA
NY
OV
ERV
IEW STA
TUTO
RY R
EPOR
TS FINA
NC
IAL STA
TEMEN
TS (Co
nso
lidated
) NO
TICE
Notesto the Consolidated financial statements for the year ended 31st March, 2017
Notes
Nava Bharat Ventures Limited 223
Quantitative disclosures fair value measurement hierarchy as at March 31, 2016: ` in lakhs
Particulars TotalFair Value measurement using
Quoted prices in active markets
Significant observable inputs
Financial Assets measured at FVTPLInvestments 1,715.00 381.66 1,333.34Financial Asset measured at Amortised Cost Loans to non-body corporate 3,190.06 3,190.06Security Deposits given 1,191.60 1,191.60Employee Staff Advance 48.23 48.23Financial Liabilities measured at Amortised Cost Term Loans 340,319.86 340,319.86Employee Retention Deposits 11.05 11.05Trade Deposits 33.64 33.64Financial Liabilities measured at FVTPL Forward Contract liability - - Swap Contract liability - -
Quantitative disclosures fair value measurement hierarchy as at April 01, 2015:` in lakhs
Particulars TotalFair Value measurement using
Quoted prices in active markets
Significant observable inputs
Financial Assets measured at FVTPLInvestments 1668.81 391.68442 1277.12348Financial Asset measured at Amortised Cost Loans to non-body corporate 3056.27 - 3056.27Security Deposits given 1176.13 - 1176.13Employee Staff Advance 72.04 - 72.04Financial Liabilities measured at Amortised Cost Term Loans 46881.79 - 46881.79Employee Retention Deposits 20.36 - 20.36Trade Deposits 45.29 - 45.29Financial Liabilities measured at FVTPLForward Contract liability - - -Swap Contract liability - - -

Notesto the Consolidated financial statements for the year ended 31st March, 2017
224 45th Annual Report 2016-17
59 Related Party Transactions: During the year under reference the Group has entered following transactions with Related Parties:
Names of the Related parties and description of relationship:
i) Key Management Personnel 1. Mr. D. Ashok, Chairman
2. Mr. P. Trivikrama Prasad, Managing Director
3. Mr. G.R.K. Prasad, Executive Director
4. Mr. C.V. Durga Prasad, Director (Business Development)
ii) Relatives of Key Management Personnel
1. Mrs. D. Ramaa - wife of Mr. D Ashok
2. Mr. D. Ashwin - son of Mr. D Ashok
3. Mr. D. Nikhil - son of Mr. D Ashok
4. Dr. D. Rajasekhar - brother of Mr. D Ashok
5. Mrs. D. Bhaktapriya - mother of Mr. D Ashok
6. Mrs. A. Nilima - sister of Mr. D Ashok
7. Mrs. P. Rajashree - wife of Mr. P Trivikrama Prasad
8. Mrs. P. Sruthi - daughter of Mr. P Trivikrama Prasad
9. Mrs. G. S. P. Kumari - wife of Mr. G R K Prasad
10. Mrs. C. Umamaheswari - wife of Mr. C V Durga Prasad
iv) Enterprises over which key management personnel/their relatives exercise significant influence:
1. Nav Developers Limited
2. S R T Investments Private Limited
3. A N Investments Private Limited
4. V9 Avenues Private Limited
5. A9 Homes Private Limited
6. AV Dwellings Private Limited
7. V9 Infra Ventures Private Limited
8. Malaxmi Highway Private Limited
9. Kinnera Power Company Private Limited
10. Dr. Devineni Subba Rao Trust
11. Gunnam Subbarao and Ramayamma Trust
12. Chapter One Books Pte. Limited
13. Kariba Sugar Limited
14. The Indian Ferro Alloys Producers Association

CO
MPA
NY
OV
ERV
IEW STA
TUTO
RY R
EPOR
TS FINA
NC
IAL STA
TEMEN
TS (Co
nso
lidated
) NO
TICE
Notesto the Consolidated financial statements for the year ended 31st March, 2017
Notes
Nava Bharat Ventures Limited 225
Particulars of transactions during the year: ` in lakhs
ParticularsFor the year ended
March 31, 2017For the year ended
March 31, 2016
i) Transactions with Key Managerial Personnel:
Mr. D Ashok
Remuneration 464.20 386.42
Sitting Fees 3.38 3.28
Mr. P Trivikrama Prasad
Remuneration 463.88 386.38
Mr. G R K Prasad
Remuneration 275.85 288.07
Sitting Fees 2.23 2.15
Mr. C V Durga Prasad
Remuneration 217.10 228.15
ii) Transactions with relatives of Key Managerial Personnel:
Dr. D. Rajasekhar
Rent 15.54 15.20
Mrs. P. Sruthi
Rent 3.24 3.48
Mr. D. Ashwin
Remuneration 775.71 666.64
Sitting Fees 3.59 3.69
Mr. D. Nikhil
Remuneration 6.68 48.23
Amounts due to/(from) related parties: ` in lakhs
ParticularsAs at
March 31, 2017As at
March 31, 2016
Key Management personnel:
Mr. D Ashok (286.16) (211.39)
Mr. P Trivikrama Prasad (286.16) (211.39)
Mr. G R K Prasad - (0.34)
Mr. D Ashwin - (0.34)
Key Managerial Personnel Compensation ` in lakhs
ParticularsFor the year ended
March 31, 2017For the year ended
March 31, 2016
Short-term employee benefits 1,338.36 1,188.75
Post-employment defined benefit 17.88 38.65
Compensated Absences 9.03 8.97
Termination benefits 55.80 52.65
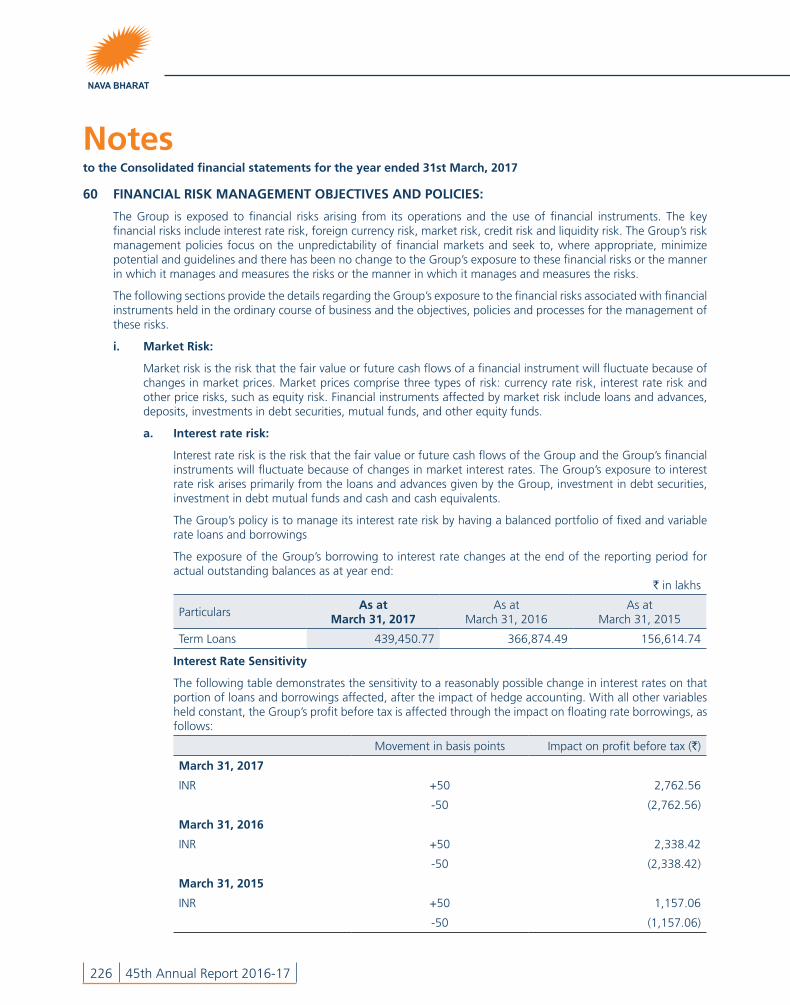
Notesto the Consolidated financial statements for the year ended 31st March, 2017
226 45th Annual Report 2016-17
60 FINANCIAl RISK MANAGEMENT OBJECTIVES AND POlICIES:
The Group is exposed to financial risks arising from its operations and the use of financial instruments. The key financial risks include interest rate risk, foreign currency risk, market risk, credit risk and liquidity risk. The Group’s risk management policies focus on the unpredictability of financial markets and seek to, where appropriate, minimize potential and guidelines and there has been no change to the Group’s exposure to these financial risks or the manner in which it manages and measures the risks or the manner in which it manages and measures the risks.
The following sections provide the details regarding the Group’s exposure to the financial risks associated with financial instruments held in the ordinary course of business and the objectives, policies and processes for the management of these risks.
i. Market Risk:
Market risk is the risk that the fair value or future cash flows of a financial instrument will fluctuate because of changes in market prices. Market prices comprise three types of risk: currency rate risk, interest rate risk and other price risks, such as equity risk. Financial instruments affected by market risk include loans and advances, deposits, investments in debt securities, mutual funds, and other equity funds.
a. Interest rate risk:
Interest rate risk is the risk that the fair value or future cash flows of the Group and the Group’s financial instruments will fluctuate because of changes in market interest rates. The Group’s exposure to interest rate risk arises primarily from the loans and advances given by the Group, investment in debt securities, investment in debt mutual funds and cash and cash equivalents.
The Group’s policy is to manage its interest rate risk by having a balanced portfolio of fixed and variable rate loans and borrowings
The exposure of the Group’s borrowing to interest rate changes at the end of the reporting period for actual outstanding balances as at year end:
` in lakhs
ParticularsAs at
March 31, 2017As at
March 31, 2016As at
March 31, 2015
Term Loans 439,450.77 366,874.49 156,614.74
Interest Rate Sensitivity
The following table demonstrates the sensitivity to a reasonably possible change in interest rates on that portion of loans and borrowings affected, after the impact of hedge accounting. With all other variables held constant, the Group’s profit before tax is affected through the impact on floating rate borrowings, as follows:
Movement in basis points Impact on profit before tax (`)
March 31, 2017
INR +50 2,762.56
-50 (2,762.56)
March 31, 2016
INR +50 2,338.42
-50 (2,338.42)
March 31, 2015
INR +50 1,157.06
-50 (1,157.06)

CO
MPA
NY
OV
ERV
IEW STA
TUTO
RY R
EPOR
TS FINA
NC
IAL STA
TEMEN
TS (Co
nso
lidated
) NO
TICE
Notesto the Consolidated financial statements for the year ended 31st March, 2017
Notes
Nava Bharat Ventures Limited 227
b. Foreign Currency Risk:
Currency risk is the risk that the value of a financial instrument will fluctuate due to changes in foreign exchange rates. Currency risk arises when transactions are denominated in foreign currencies.
The Group has transactional currency exposures arising from services provided or availed that are denominated in a currency other than the functional currency. The foreign currencies in which these transactions are denominated are mainly in US Dollars ($). The Group’s trade receivable and trade payable balances at the end of the reporting period have similar exposures.
The Group does uses financial derivatives such as foreign currency forward contracts and swaps for hedging purposes.
The following table demonstrates the sensitivity in the USD to the Indian Rupee with all other variables held constant. The impact on the Group’s profit before tax due to changes in the fair value of monetary assets and liabilities is given below:
` in lakhs
Particulars Change in RateFor the year ended
March 31, 2017For the year ended
March 31, 2016
USD +0.50 % (102.80) 18.62
-0.50 % 102.80 (18.62)
EURO +0.50 % (0.13) -
-0.50 % 0.13 -
c. Other price risk:
Other price risk is the risk that the fair value or future cash flows of the Group’s financial instruments will fluctuate because of changes in market prices (other than those arising from interest rate risk or currency risk), whether those changes are caused by factors specific to the individual financial instrument or its issuer or by factors affecting all similar financial instruments traded in the market.
The Group based on working capital requirement keeps its liquid funds in current accounts. Excess funds are invested in long term instruments. Hence the Group doesn’t have any significant other price risk.
ii. Credit risk:
Credit risk is the risk of loss that may arise on outstanding financial instruments when a counterparty default on its obligations. The Group’s exposure to credit risk arises primarily from trade and other receivables. For other financial assets (including investment securities, cash and short-term deposit), the Group minimise credit risk by dealing exclusively with high credit rating counterparties. The Group’s objective is to seek continual revenue growth while minimising losses incurred due to increased credit risk exposure. The Group trades only with recognised and creditworthy third parties. It is the Group’s policy that all customers who wish to trade on credit terms are subject to credit verification procedures.
In addition, receivable balances are monitored on an ongoing basis with the result that the Group’s exposure to bad debts is not significant.
a. Exposure to credit risk:
At the end of the reporting period, the Group’s maximum exposure to credit risk is represented by the carrying amount of each class of financial assets recognised in the statement of financial position. No other financial assets carry a significant exposure to credit risk.

Notesto the Consolidated financial statements for the year ended 31st March, 2017
228 45th Annual Report 2016-17
b. Credit risk concentration profile:
At the end of the reporting period, there were no significant concentrations of credit risk. The maximum exposures to credit risk in relation to each class of recognised financial assets is represented by the carrying amount of each financial assets as indicated in the balance sheet.
c. Financial assets that are neither past due nor impaired:
Trade and other receivables that are neither past due nor impaired are creditworthy debtors with good payment record with the Group. Cash and short-term deposits, investment securities that are neither past due nor impaired are placed with or entered with reputable banks, financial institutions or companies with high credit ratings and no history of default.
d. Financial assets that are either past due or impaired:
The Group doesn’t have any trade receivables or other financial assets which are either past due or impaired.
iii. Liquidity risk:
The risk that an entity will encounter difficulty in meeting obligations associated with financial liabilities that are settled by delivering cash or another financial asset.
The Group ensures that it has sufficient cash on demand to meet expected operational demands, including the servicing of financial obligations; this excludes the potential impact of extreme circumstances that cannot reasonably be predicted.
The table below summarises the maturity profile of the Group’s financial liabilities based on contractual undiscounted payments:
` in lakhs
Particulars Total On Demand < 12 months 1 to 5 years > 5 years
Year ended 31 March, 2017
Borrowings - Non-Current 374,634.33 - - 186,294.77 188,339.55
Borrowings - Current 11,233.02 - 11,233.02 - -
Trade payables 11,265.84 11,265.84 - - -
Other financial liabilities -non-current 4,685.78 - - 406.01 4,279.77
Other financial liabilities - current 83,342.52 1,573.65 81,768.86 - -
Forward Contract Liability 2,020.81 - 2,020.81 - -
Swap contract liability 1,266.73 - 1,266.73 - -
Total 488,499.02 12,839.49 96,289.42 186,700.78 192,619.32
Year ended 31 March, 2016
Borrowings - Non-Current 340,319.86 - - 183,169.97 157,149.89
Borrowings - Current 14,745.23 - 14,745.23 - -
Trade payables 15,016.05 15,016.05 - - -
Other financial liabilities -non-current 507.21 - - 507.21 -
Other financial liabilities - current 43,367.25 1,374.77 41,992.48 - -
Total 413,955.60 16,390.82 56,737.71 183,677.18 157,149.89

CO
MPA
NY
OV
ERV
IEW STA
TUTO
RY R
EPOR
TS FINA
NC
IAL STA
TEMEN
TS (Co
nso
lidated
) NO
TICE
Notesto the Consolidated financial statements for the year ended 31st March, 2017
Notes
Nava Bharat Ventures Limited 229
As at 1 April, 2015
Borrowings - Non-Current 46,881.79 - - 46,881.79 -
Borrowings - Current 11,432.27 - 11,432.27 - -
Trade payables 79,716.74 79,716.74 - - -
Other financial liabilities -non-current 787.25 - - 23.44 763.81
Other financial liabilities - current 122,583.54 - 122,583.54 - -
Total 261,401.59 79,716.74 134,015.81 46,905.23 763.81
61 CAPITAl MANAGEMENT:
Capital includes equity attributable to the equity holders of the parent. The primary objective of the capital management is to ensure that it maintain an efficient capital structure and healthy capital ratios in order to support its business and maximise shareholder’s value.
The Group manages its capital structure and make adjustments to it, in light of changes in economic conditions or its business requirements. To maintain or adjust the capital structure, Group may adjust the dividend payment to shareholders return capital to shareholders or issue new shares.
The Group monitors capital using a debt to capital employed ratio, which is debt divided by total capital plus debt. The Group’s policy is to keep this ratio at an optimal level to ensure that the debt related covenants are complied with.
` in lakhs
Particulars As at 31 March, 2017 As at 31 March, 2016 As at 1 April, 2015
Total Borrowings# 450,683.79 381,619.72 168,047.01
Total Equity 327,585.79 322,246.14 295,049.95
Debt to Equity Ratio 137.58% 118.66% 56.95%
# Total Borrowings include Long term borrowing, short term maturities of long term borrowings and working capital loans like Cash Credit and Buyer’s Credit
62 lEASE DISClOSURE:
Operating Lease:
All the non-cancellable operating lease obligations are prepaid in nature and hence the Group does not have any future obligation on account of such non-cancellable operating leases.
63 Details of Specified bank notes as per Notification No. G.S.R. 308(E) of 2017: ` in lakhs
Particulars Specified bank notes Other denomination notes Total
Closing cash in hand as on 08.11.2016 4.86 0.34 5.20
(+) Permitted receipts - 18.48 18.48
(-) Permitted Payments - 10.06 10.06
(-) Amount deposited in Banks 4.86 - 4.86
Closing cash in hand as on 30.12.2016 - 8.76 8.76

Notesto the Consolidated financial statements for the year ended 31st March, 2017
230 45th Annual Report 2016-17
64 The dividends declared by the company are based on the profits available for distribution as reported in the financial statements of the company. The Board of Directors of the company have proposed a final dividend of ` 1.00 per share in respect of the year ended March 31, 2017 subject to the approval of shareholders at the Annual General Meeting. If approved, the dividend would result in a cash outflow of ` 2,029.57 Lakhs inclusive of dividend distribution tax of ` 3,432.88 Lakhs.
65 FOREIGN CURRENCY EXPOSURE:
ParticularsAs at March 31, 2017 As at March 31, 2016 As at March 31, 2015
Foreign Currency
Amount (`)Foreign
CurrencyAmount (`)
Foreign Currency
Amount (`)
Exposure in USD
Receivables:
Trade Receivables 5,774,043 374,417,839 13,396,408 887,512,040 22,060,727 1,377,016,583
Guarantee Commission
2,028,556 131,541,716 1,250,799 82,865,458 294,218 18,387,154
Interest 3,624,653 235,040,623 1,965,354 130,204,714 56,667 3,541,404
Loan 71,500,000 4,636,417,500 77,500,000 5,134,375,000 6,000,000 374,970,000
Forward Contract 3,000,000 194,535,000
Others 103,875 6,735,771 1,486,545 98,483,608 919,290 57,450,853
Payables:
FCNR Loan 34,143,985 2,214,066,708 - - - -
Import
Buyer’s Credit 4,808,951 311,836,456 3,518,433 233,096,213 6,583,472 411,467,000
Trade Payables 73,917 4,793,188 73,917 4,894,731 3,494,469 218,386,853
Interest Payable 21,098 1,368,099 8,509 42,875 - -

CO
MPA
NY
OV
ERV
IEW STA
TUTO
RY R
EPOR
TS FINA
NC
IAL STA
TEMEN
TS (Co
nso
lidated
) NO
TICE
Notesto the Consolidated financial statements for the year ended 31st March, 2017
Notes
Nava Bharat Ventures Limited 231
66.
DIS
ClO
SUR
E O
F A
DD
ITIO
NA
l IN
FOR
MA
TIO
N
PER
TAIN
ING
TO
TH
E PA
REN
T C
OM
PAN
Y,
SUB
SID
IAR
IES
AN
D
ASS
OC
IATE
S A
S PE
R S
CH
EDU
lE II
I OF
THE
CO
MPA
NIE
S A
CT,
201
3
Part
icu
lars
Net
Ass
ets
i.e.,
min
us
tota
l A
s a
% o
f n
et
con
solid
ated
asse
ts
Tota
l ass
ets
liab
iliti
esSh
are
inPr
ofi
tSh
are
in o
ther
co
mp
reh
ensi
ve in
com
e (O
CI)
Shar
e in
to
tal c
om
pre
hen
sive
in
com
e
` in
lakh
sA
s a
% o
f co
nso
lidat
ed
pro
fit
` in
lakh
sA
s a
% o
f co
nso
lidat
ed
OC
I`
in la
khs
As
a %
of
con
solid
ated
to
tal
com
pre
hen
sive
` in
lakh
s
Pare
nt
Co
mp
any
1.
Nav
a Bh
arat
Ven
ture
s Li
mite
d51
.38%
270,
535.
1376
.97%
8297
.51
51.2
3%14
0.58
76.3
3%8,
438.
09’
Ind
ian
Su
bsi
dia
ries
1.
Nav
a Bh
arat
Ene
rgy
Indi
a Li
mite
d10
.67%
56,1
69.3
723
.45%
2527
.84
1.79
%4.
9022
.91%
2,53
2.74
2.
Nav
a Bh
arat
Pro
ject
s Li
mite
d4.
60%
24,2
00.2
10.
87%
94.0
5-0
.04%
(0.1
0)0.
85%
93.9
5
3.
Brah
man
i Inf
rate
ch
Priv
ate
Lim
ited
1.58
%8,
345.
822.
05%
221.
180.
10%
0.28
2.00
%22
1.46
Fore
ign
su
bsi
dia
ries
1.
Nav
a Bh
arat
(Sin
gapo
re)
Pte.
Lim
ited
18.5
7%97
,794
.61
-12.
99%
(1,3
99.8
7)0.
00%
-12.
66%
(1,3
99.8
7)
2.
Maa
mba
Col
lierie
s Li
mite
d13
.29%
69,9
78.0
313
.39%
1,44
3.79
49.5
7%13
6.04
14.2
9%1,
579.
83
3. N
ava
Ener
gy Z
ambi
a Li
mite
d0.
01%
48.8
80.
99%
106.
73-2
.65%
(7.2
8)0.
90%
99.4
5
4.
Nav
a En
ergy
Pte
. Lim
ited
-0.1
0%(5
10.7
9)-4
.73%
(509
.73)
0.00
%-4
.61%
(509
.73)
5.
Nav
a A
gro
Pte
Lim
ited
0.00
%(0
.96)
-0.0
2%(1
.66)
0.00
%-0
.02%
(1.6
6)
100.
00%
526,
560.
3010
0.00
%10
,779
.84
100.
00%
274.
4210
0.00
%11
,054
.26
Adj
ustm
ent
on a
ccou
nt o
f co
nsol
idat
ion
(171
,406
.20)
(72.
86)
(2,0
61.8
0)(2
,134
.66)
Sub
To
tal
355,
154.
1010
,706
.98
(1,7
87.3
8)8,
919.
60
Min
ority
Inte
rest
for
the
pe
riod
(27,
568.
31)
(585
.57)
(48.
13)
(633
.70)
Tota
l32
7,58
5.79
10,1
21.4
1(1
,835
.51)
8,28
5.90

Notesto the Consolidated financial statements for the year ended 31st March, 2017
232 45th Annual Report 2016-17
67 FIRST TIME ADOPTION OF IND AS:
For all periods, up to and including the year ended March 31, 2016 the Group has prepared its financial statements in accordance with generally accepted accounting principles and accounting standards notified under section 133 of the Companies Act 2013, read together with paragraph 7 of the Companies (Accounts) Rules, 2014 (“Previous GAAP”).
These financial statements for the year ended March 31, 2017 are the Group’s first annual Ind AS complied financial statements.
The Group has prepared financial statements which comply with Ind AS applicable for period beginning on or after April 01, 2015 (transition date) as described in the accounting policies. This note explains the principal adjustment made by the Group in restating its Previous GAAP Balance Sheet.
Exemptions Applied: The Group has applied following exemptions as per Ind AS 101 First Time Adoption:
i. For transition to Ind AS, the Group has elected to carry the values of Property, Plant and Equipment as well as all of its intangible assets recognised as of March 31, 2015 measured as per previous GAAP and used that carrying value as its deemed cost.
ii. On the date of transition, the Group has elected to designate all the investments in financial instruments at Fair Value through profit or loss, that were acquired before the date of transition.
The reconciliation of equity as at April 01, 2015 and March 31, 2016 and profit for the year ended March 31, 2016 is as follows:
ParticularsEquity as at 01.04.2015
Profit for the year ended 31.03.2016
Equity as at 31.03.2016
Equity/Net profit for shareholder as per previous GAAP 289,225.17 28,730.25 317,280.78
Interest income on Employee Welfare Trust at fair value (456.43) 95.74 (360.69)
Change in fair value of investments 536.93 136.21 673.14
Amortisation of Intangible assets - 47.62 47.62
Interest on loans at fair value (EIR) 407.49 (140.15) 267.34
Employee loans, retention deposits at fair value (36.87) 11.45 (25.43)
Security deposits at fair value (1.08) (2.17) (3.25)
Dividend to shareholders 5,073.93 - 3,044.36
Treasury shares (206.34) - (206.34)
Depreciation on Property, Plant and equipment - 16.15 16.15
Others 0.73 (52.14) (51.41)
Income taxes - Deferred tax on above 26.69 2.60 29.29
Restoration cost (27.70) (57.11) (84.82)
Adjustments on adoption of Ind AS for foreign subsidiaries (1,279.58) (424.58) (167.62)
Others 0.73 (52.14) (51.41)
Equity/Profit for the period attributable to shareholder as per Ind AS 293,262.94 28,363.85 320,459.12

CO
MPA
NY
OV
ERV
IEW STA
TUTO
RY R
EPOR
TS FINA
NC
IAL STA
TEMEN
TS (Co
nso
lidated
) NO
TICE
Notesto the Consolidated financial statements for the year ended 31st March, 2017
Notes
Nava Bharat Ventures Limited 233
Explanatory Notes: (Equity as at 01.04.2015)
1 leasehold land:
Under Previous GAAP leasehold lands were recognised as assets under PPE. As per Ind AS 17, the Group has treated leasehold lands as operating leases and premium paid is considered as pre-paid lease rentals.
2 Intangible Assets:
Under previous GAAP intangibles were generally amortised for 10 years. Based on Ind AS 38 Intangibles are amortised based on effective useful life.
As a result, the written down value of Water drawing rights have been remeasured and shown under intangible assets.
3 Non-current investments:
As on the date of transition, the Group opted to classify non-current investments other than investment in subsidiaries as Financial Assets which are measured at fair value with gains or losses recognised in profit and loss (FVTPL).
As per previous GAAP these are carried at cost. However, provision for permanent diminution in value is made to recognize any decline other than temporary in value of investments. As per Ind AS 109 all Equity Investments within the scope of Ind AS 109 are measured at Fair Value with the default recognition of gains and losses in Profit and Loss (FVTPL).
4 loan to employees and Non-corporate entities:
Group has given interest free loans to employees. Further loans have been provided to non-corporate entities at below market interest rates. Under previous GAAP these loans have been accounted at transaction price. Based on Ind AS 109 such loans have been fair valued and measured at amortised cost. The resultant difference between carrying amount of those loans and the fair value as on date of transition are to be recognised in retained earnings.
5 Security deposit:
Rental and water security deposits were recognised at transaction value under previous GAAP. Based on Ind AS 109, these security deposit has to be recognised at amortised cost and the difference between fair value and carrying cost is to be treated as prepaid lease rental. Further the difference amount relating to period before date of transition to Ind AS is charged to retained earnings.
6 Treasury Shares:
Own fully paid equity shares held by the Group, pursuant to order of Hon’ble High Court of Andhra Pradesh dated 30.12.1996 in the Scheme of amalgamation of Nav Chrome Limited with the Group, which are vested in a Trustee for the benefit of the Group and which are to be sold and net sale proceeds are to be paid to the Group are and treated as treasury shares and reduced from other equity.
7 Borrowings:
Ind AS 109 requires transaction costs incurred towards origination of borrowings to be deducted from the carrying amount of borrowings on initial recognition. These costs are recognised in statement of profit or loss over the tenure of the borrowings as part of the interest expense by applying the effective interest method.
Under the previous GAAP these transactions costs were amortised on a straight-line basis over the period of loan.
8 Security Deposit and Employee Retention Deposits:
Security deposits and Employee Retention Deposits were recognised at transaction value under previous GAAP. Based on Ind AS 109 these have been recognised at amortised cost. The resultant Ind AS adjustments have been given in retained earnings.
9 Deferred Tax:
The Group under previous GAAP calculated deferred tax based on income statement approach, whereby tax effect of timing differences as a consequence of any mismatch between accounting income and taxable income were recognized. Based on Ind AS 12, the Group has calculated deferred tax based on balance sheet approach, which focuses on temporary differences between carrying amount of an asset or liability in the balance sheet and its tax base.
10 Proposed Dividends:
Under the previous GAAP, dividends proposed by the board of directors after the balance sheet date but before the approval of the financial statements were considered as adjusting events. Accordingly, provision for proposed dividend was recognised as a liability. Under Ind AS, such dividends are recognised when the same is approved by the shareholders in the general meeting.

Notesto the Consolidated financial statements for the year ended 31st March, 2017
234 45th Annual Report 2016-17
Explanatory Notes: (Profit for the year ended 31.03.2016)
1 Revenue recognition:
Under previous GAAP sale of goods was presented as net of excise duty. However, under Ind AS sale of goods includes excise duty. Thus, sale of goods under Ind AS has increased with a corresponding increase in other expenses.
Further prompt payment rebate extended to energy customers which was reported as finance cost under previous GAAP is netted of from Sale of energy as per Ind AS.
2 Other Income - Fair Valuation Gain:
Interest and other income arising as a result differences on account of fair valuation of various financial assets and liabilities have been credited to Profit and Loss.
3 Defined Benefit:
Under Ind AS actuarial gains on remeasurement of defined benefit obligations are recognised in other comprehensive income. Under previous GAAP the Group recognised such remeasurements in profit or loss. However, this has no impact on total comprehensive income
Explanatory Notes: (Equity as at 31.03.2016)
1 Capital Spares:
Spares which meet the recognition criteria of Property, Plant and Equipment has been reduced from Inventories and reclassified as Property, Plant and Equipment (net of accumulated depreciation).
2 leasehold land:
Under Previous GAAP leasehold lands were recognised as assets under PPE. As per Ind AS 17, the Group has treated leasehold lands as operating leases and premium paid is considered as pre-paid lease rentals.
3 Intangible Assets:
Under previous GAAP intangibles were generally amortised for 10 years. Based on Ind AS 38 Intangibles are amortised based on effective useful life.
As a result, the written down value of Water drawing rights have been remeasured and shown under intangible assets.
4 Non-current investments:
As on the date of transition, the Group opted to classify non-current investments other than investment in subsidiaries as Financial Assets which are measured at fair value with gains or losses recognised in profit and loss (FVTPL).
As per previous GAAP these are carried at cost. However, provision for permanent diminution in value is made to recognize any decline other than temporary in value of investments. As per Ind AS 109 all Equity Investments within the scope of Ind AS 109 are measured at Fair Value with the default recognition of gains and losses in Profit and Loss (FVTPL).
5 loan to employees and Non-corporate entities:
Group has given interest free loans to employees. Further loans have been provided to non-corporate entities at below market interest rates. Under previous GAAP these loans have been accounted at transaction price. Based on Ind AS 109 such loans have been fair valued and measured at amortised cost. The resultant difference between carrying amount of those loans and the fair value as on date of transition are to be recognised in retained earnings.
6 Security deposit:
Rental and water security deposits were recognised at transaction value under previous GAAP. Based on Ind AS 109, these security deposit has to be recognised at amortised cost and the difference between fair value and carrying cost is to be treated as prepaid lease rental. Further the difference amount relating to period before date of transition to Ind AS is charged to retained earnings.
7 Treasury Shares:
Own fully paid equity shares held by the Group, pursuant to order of Hon’ble High Court of Andhra Pradesh dated 30.12.1996 in the Scheme of amalgamation of Nav Chrome Limited with the Group, which are vested in a Trustee for the benefit of the Group and which are to be sold and net sale proceeds are to be paid to the Group are and treated as treasury shares and reduced from other equity.

CO
MPA
NY
OV
ERV
IEW STA
TUTO
RY R
EPOR
TS FINA
NC
IAL STA
TEMEN
TS (Co
nso
lidated
) NO
TICE
Notesto the Consolidated financial statements for the year ended 31st March, 2017
Notes
Nava Bharat Ventures Limited 235
8 Borrowings:
Ind AS 109 requires transaction costs incurred towards origination of borrowings to be deducted from the carrying amount of borrowings on initial recognition. These costs are recognised in statement of profit or loss over the tenure of the borrowings as part of the interest expense by applying the effective interest method.
Under the previous GAAP these transactions costs were amortised on a straight-line basis over the period of loan.
9 Security Deposit and Employee Retention Deposits:
Security deposits and Employee Retention Deposits were recognised at transaction value under previous GAAP. Based on Ind AS 109 these have been recognised at amortised cost. The resultant Ind AS adjustments have been given in retained earnings.
10 Deferred Tax:
The Group under previous GAAP calculated deferred tax based on income statement approach, whereby tax effect of timing differences as a consequence of any mismatch between accounting income and taxable income were recognized. Based on Ind AS 12, the Group has calculated deferred tax based on balance sheet approach, which focuses on temporary differences between carrying amount of an asset or liability in the balance sheet and its tax base.
11 Proposed Dividends:
Under the previous GAAP, dividends proposed by the board of directors after the balance sheet date but before the approval of the financial statements were considered as adjusting events. Accordingly, provision for proposed dividend was recognised as a liability. Under Ind AS, such dividends are recognised when the same is approved by the shareholders in the general meeting.
per our report of even date for and on behalf of the Boardfor Brahmayya & Co.,Chartered AccountantsFirm’s Registration Number: 000513S G.R.K. Prasad
Executive DirectorP. ChandramouliPartner T. Hari Babu P. Trivikrama PrasadMembership Number: 025211 Chief Financial Officer Managing Director
VSN RajuPlace: Hyderabad Company Secretary & D. AshokDate : May 27, 2017 Vice President Chairman

236 45th Annual Report 2016-17
This
page
is in
tent
ionall
y lef
t blan
k
CO
MPA
NY
OV
ERV
IEW STA
TUTO
RY R
EPOR
TS FINA
NC
IAL STA
TEMEN
TS NO
TICE
NOTICE
Nava Bharat Ventures Limited 237
NAVA BHARAT VENTURES lIMITEDRegd. Office : 6-3-1109/1, ‘Nava Bharat Chambers’, Raj Bhavan Road, Hyderabad – 500 082, Telangana.
CIN : L27101TG1972PLC001549 Tel : +91 40 23403501/40345999Fax : +91 40 23403013 I E-mail : [email protected] I Website : www.nbventures.com
NOTICENOTICE is hereby given that the 45th annual general meeting of the members of Nava Bharat Ventures Limited (the Company) will be held on Wednesday, the 9th day of August, 2017 at 10:00 a.m. at Marigold Hotel, by and beside Green Park Hotel, 7-1-25, Greenlands, Begumpet, Hyderabad - 500016 to transact the following business:
Ordinary business:
Item no.1:
Adoption of financial statements:
To receive, consider, approve and adopt the audited financial statements of the Company (standalone and consolidated) for the year ended March 31, 2017 including balance sheet as at March 31, 2017, the statement of profit & loss for the year ended on that date and the reports of the Board of directors and auditors thereon including the audited consolidated financial statements of the Company and report of the Auditors thereon, for the financial year ended March 31, 2017.
Item no.2:
Declaration of dividend on the equity shares:
To declare dividend at the rate of 50% i.e. Re. 1/- per equity share of ̀ 2/- each for the financial year ended March 31, 2017.
Item no.3:
Re-appointment of director:
To appoint a director in place of Mr. GRK Prasad, who retires by rotation and, being eligible, offered himself for re-appointment.
Item no.4:
Appointment of auditors:
To appoint the auditors and to fix their remuneration by passing the following resolution as an ordinary resolution:
“RESOLVED THAT pursuant to the provisions of Section 139 and other applicable provisions, if any, of the Companies Act, 2013 (“Act”) and the Companies (Audit and Auditors) Rules, 2014, as amended from time to time, M/s. Walker Chandiok & Co. LLP, Chartered Accountants (Regn. No. 001076N/N500013), be and is hereby appointed as the auditors of Company in place of the retiring
auditors, M/s.Brahmayya & Co., Chartered Accountants (Firm Registration No.000513S0), to hold office from the conclusion of this annual general meeting (“AGM”) till the conclusion of the 50th AGM to be held in the year 2022 (subject to ratification of their appointment at every AGM if so required under the Act), at such remuneration, as may be mutually agreed between the Board of directors of the Company and the auditors.”
Special business:
Item no.5:
Ratification of appointment and remuneration of cost auditors for the financial year 2017-18:
To consider and, if thought fit, to pass with or without modification(s), the following resolution as an ordinary resolution:
“RESOLVED THAT pursuant to Section 148 of the Companies Act, 2013 read with the Companies (Audit and Auditors) Rules, 2014, the appointment of M/s.Narasimha Murthy & Co., cost accountants, 3-6-365, 104, Pavani Estate, Y.V.Rao Mansion, Himayat Nagar, Hyderabad – 500 029 made by the Board, as cost auditors to conduct the audit of the cost records maintained by the Company in respect of Company’s products in all the units or plants relating to Electricity; Steel (Ferro Alloys); Sugar & Industrial Alcohol for the financial year 2017-18 at an aggregate fee of `7 (seven) lakhs plus out of pocket expenses and applicable taxes be and is hereby approved and ratified.”
By order of the BoardFor NAVA BHARAT VENTURES LIMITED
Place : Hyderabad VSN RajuDate : May 27, 2017 Company Secretary & Vice PresidentRegistered Office: 6-3-1109/1‘Nava Bharat Chambers’ Raj Bhavan Road, HYDERABAD – 500 082CIN : L27101TG1972PLC001549 Ph.No.040-23403501; Fax No.040-23403013E-mail : [email protected]; Website : www.nbventures.com

238 45th Annual Report 2016-17
NOTES
1. The explanatory statement in respect of the special business in the Notice, pursuant to Section 102 of the Companies Act, 2013 is annexed hereto.
2. A member entitled to attend and vote at the meeting is entitled to appoint a proxy to attend and vote in the meeting and the proxy need not be a member of the Company.
3. The instrument appointing the proxy must be deposited at the registered office of the Company not less than 48 hours before the commencement of the meeting. A proxy form is enclosed.
4. Members/Proxies should bring the duly filled attendance slip attached herewith to attend the meeting.
5. The register of directors and key managerial personnel and their shareholding maintained under Section 170 and the register of contracts or arrangements in which directors are interested maintained under Section 189 of the Companies Act, 2013, will be available for inspection by the members at the annual general meeting.
6. The register of members and share transfer books will remain closed from August 4, 2017 to August 9, 2017 (both days inclusive) in connection with the annual general meeting and dividend.
7. The dividend for the year ended March 31, 2017 as recommended by the Board, i.e. Re.1/- (One Rupee only) per equity share of ` 2/- each, if declared at the meeting, will be paid to those members whose names appear in the Company’s register of members after effecting valid transfers received upto the close of business hours on August 3, 2017. In respect of shares held in electronic form, the dividend will be payable on the basis of beneficial ownership as per details provided as at the close of business hours on August 3, 2017 by National Securities Depository Limited and Central Depository Services (India) Limited for this purpose. The dividend on equity shares, if declared at the meeting, will be credited/dispatched within one month from the date of this meeting.
8. The unclaimed equity dividend for the year ended March 31, 2010 will be transferred on September 16, 2017 to the ‘Investor Education and Protection Fund’ on expiry of 7 years from the date of transfer to the unpaid dividend account pursuant to Sec.205A of the Companies Act, 1956 (Section 124 of the Companies Act, 2013). Members who have not encashed their dividend warrants for the said financial year or subsequent year(s) are requested to send the same
to the Company or its Registrars and Share Transfer Agents for issue of fresh demand drafts.
9. The unclaimed physical share certificates with the Registrars and Share Transfer Agents of the Company, subsequent to the issue of various reminders, were transferred to unclaimed suspense account and dematerialized to the credit of “Nava Bharat Ventures Limited – Unclaimed Suspense Account”. The details were placed on the Website of the Company. The concerned members are requested to approach the registrars, Karvy Computershare Private Limited with their claim for the transfer of their shares to their demat account. The dividend accruing on the said shares would be credited to the unpaid dividend account as the dividend is to be paid to the registered holders only. The dividend would also be remitted to the concerned shareholders on claiming their shares out of the unclaimed suspense account.
10. As per the provisions of Section 124(6) of the Act read with Rule 6 of ‘Investor Education and Protection Fund Authority (Accounting, Audit, Transfer and Refund) Amendment Rules, 2017’ (‘the Rules’), all shares, in respect of which dividend has not been paid or claimed for seven consecutive years or more (relevant shares), will be transferred by the Company to IEPF along with statement containing such details as directed by Ministry of Corporate Affairs from time to time.
11. Members are requested to furnish details of their bank accounts viz., name of bank, full address of the branch, account number with 9 digit MICR Code no. and folio number forwarding photo copy of PAN card and a cancelled cheque leaf for incorporation on the dividend warrant, to the Company’s Registrars and Share Transfer Agents, Karvy Computershare Private Limited, Karvy Selenium Tower B, Plot 31-32, Gachibowli, Financial District, Nanakramguda, Hyderabad – 500 032. In case of holding shares in electronic mode, members are requested to approach their depository participants for updation of bank account details with the aforesaid documents.
12. Members seeking any information or clarification on the accounts are requested to send in writing queries to the Company, at least one week before the date of the meeting. Replies will be provided in respect of such written queries at the meeting.
13. Members holding shares in identical order of names in more than one folio are requested to write to the Company’s Registrars and Share Transfer Agents enclosing their share certificates to enable consolidation of their shareholdings in one folio.

CO
MPA
NY
OV
ERV
IEW STA
TUTO
RY R
EPOR
TS FINA
NC
IAL STA
TEMEN
TS NO
TICE
NOTICE
Nava Bharat Ventures Limited 239
14. Pursuant to the directions/notifications of SEBI and Depositories, the demat account holders can operate their accounts if they had already provided Income Tax PAN either at the time of opening of the account or subsequently. In case they have not furnished the Income Tax PAN to the Depository Participants, such demat account holders are requested to contact their DPs with a photocopy of the PAN card (with original PAN card for verification), so that the frozen demat accounts would be available for operation and further consequences of non-compliance with the aforesaid directives would be obviated. Securities and Exchange Board of India, vide Circular ref.no.MRD/Dop/Cir-05/2009 dated May 20, 2009 made it mandatory to have PAN particulars for registration of physical share transfer requests. Based on the directions contained in the said circular, all share transfer requests are therefore to be accompanied with PAN details.
15. Registration of e-mail addresses for sending annual reports, communications, etc: Members are requested to register their e-mail addresses and changes therein from time to time with the Registrars and Share Transfer Agents (in case of physical shares) or with the concerned Depository Participant (in case of electronic holdings) so that the Company will use the same for sending notices, annual reports and other communications.
Copies of annual report 2016-17 are being sent under electronic mode only, to all the members whose e-mail addresses are registered with the Registrars and Share Transfer Agents of the Company i.e. Karvy Computershare Private Limited / Depository Participant(s) for communication purposes unless any member has requested for a hard copy of the same. For members who have not registered their e-mail addresses, physical copies of the annual report 2016-17 are being sent by a permitted mode.
16. Members may also please note that the notice of the 45th AGM and the annual report 2016-17 is available on the Company’s website: www.nbventures.com. The physical copies of the aforesaid documents are also be available at the Company’s regd. office for inspection during normal business hours on working days. Members who require communication in physical form in addition to e-communication, or have any other queries, may write to the Company at: [email protected]. All documents referred to in the accompanying notice and the statement pursuant to Section 102(1) of the Companies Act, 2013, will be available for inspection at the registered office of the Company during business hours on all working days up to the date of declaration of the result of the 45th AGM of the Company.
17. Additional information pursuant to Regulation 36 of SEBI (Listing Obligations and Disclosure Requirements) Regulations, 2015 in respect of the Director(s) seeking appointment/re-appointment at the annual general meeting is enclosed as Annexure - I and forms part of the notice. The Director has furnished the requisite consent/declaration for his appointment/ re-appointment.
18. Retirement of directors by rotation:
Mr. GRK Prasad, Executive Director of the Company, retires by rotation at the ensuing annual general meeting and, being eligible, offered himself for re-appointment.
The Board of directors commends the re-appointment of Mr. GRK Prasad as a Director, liable to retire by rotation
19. Voting through electronic means:
In terms of the provisions of Section 108 of the Companies Act, 2013 (the Act) read with Rule 20 of the Companies (Management and Administration) Rules, 2014 (hereinafter called “the Rules” for the purpose of this Section of the Notice) and Regulation 44 of SEBI (Listing Obligations and Disclosure Requirements) Regulations, 2015, the Company is providing facility to exercise voting rights on the items of business given in the notice through electronic voting system, to members holding shares as on August 3, 2017 (end of day) being the cut-off date fixed for determining voting rights of members, entitled to participate in the e-voting process, through the e-voting platform provided by Karvy Computershare Pvt. Ltd. (Karvy). The members may cast their votes using an electronic voting system from a place other than the venue of the meeting (remote e-voting).
A person whose name is recorded in the register of members or in the register of beneficial owners maintained by the Depositories (holding shares either in physical form or in dematerialised form) as on Thursday, August 3, 2017 the “Cut-off date” shall be entitled to avail the facility of remote e-voting as well as voting in the general meeting.
The instructions for remote e-voting are as under:
1.A. In case a shareholder receiving an email from Karvy [for members whose email IDs are registered with the Depository Participant(s)]:
(i) Launch internet browser by typing the URL: https://evoting.karvy.com.

240 45th Annual Report 2016-17
(ii) Enter the login credentials (i.e. User ID and Password mentioned above). Your Folio No./DP ID & Client ID will be your User ID. However, if you are already registered with Karvy for e-voting, you can use your existing User ID and password for casting your vote.
(iii) After entering these details appropriately, click on “LOGIN”.
(iv) You will now reach password change menu wherein you are required to mandatorily change your password. The new password shall comprise of minimum 8 characters with at least one upper case (A-Z), one lower case (a-z), one numeric value (0-9) and a special character (@,#,$, etc.). The system will prompt you to change your password and update your contact details like mobile number, email ID, etc. on first login. You may also enter a secret question and answer of your choice to retrieve your password in case you forget it. It is strongly recommended that you do not share your password with any other person and that you take utmost care to keep your password confidential.
(v) You need to login again with the new credentials.
(vi) On successful login, the system will prompt you to select the “EVENT” i.e., Nava Bharat Ventures Limited.
(vii) On the voting page, enter the number of shares (which represents the number of votes) as on the cut-off date under “FOR/AGAINST” or alternatively, you may partially enter any number in “FOR” and partially in “AGAINST” but the total number in “FOR/AGAINST” taken together should not exceed your total shareholding as on cut-off date i.e. August 3, 2017. You may also choose the option ABSTAIN. If the member does not indicate either “FOR” or “AGAINST” it will be treated as “ABSTAIN” and the shares held will not be counted under either head.
(viii) Shareholders holding multiple folios/demat accounts shall choose the voting process separately for each folios/demat accounts. Voting has to be done for each resolution of the notice of 45th AGM
separately. In case you do not desire to cast your vote on any specific resolution, it will be treated as abstained.
(ix) You may then cast your vote by selecting an appropriate option and click on “Submit”.
(x) A confirmation box will be displayed. Click “OK” to confirm else “CANCEL” to modify. Once you confirm, you will not be allowed to modify or change the votes cast. During the voting period, shareholders can login any number of times till they have voted on the Resolution(s).
(xi) Corporate/Institutional Members (i.e. other than Individuals, HUF, NRI, etc.) are also required to send scanned certified true copy (PDF Format) of the Board Resolution/Authority Letter, etc. together with attested specimen signature(s) of the duly authorized representative(s), to the Scrutinizer at e-mail ID: [email protected] with a copy marked to [email protected]. The scanned image of the above mentioned documents should be in the naming format “NBVENTURES_ EVENT NO.”
B. In case of members receiving physical copy of the AGM Notice by courier [for members whose email IDs are not registered with the Depository Participant(s)]:
(i) User ID and initial password as provided above.
(ii) Please follow all steps from Sr.No. (i) to (xi) as mentioned in (A) above, to cast your vote.
2. In case a person has become the member of the company after the dispatch of AGM Notice but on or before the cut-off date i.e. August 3, 2017, may write to the Karvy on the email Id [email protected] or to Mr.Mohd Mohsin Uddin, Senior Manager, Contact No. 040-67162222, Ext No: 1562 at Karvy Computershare Private Limited (Unit: Nava Bharat Ventures Limited), Karvy Selenium Tower B, Plot 31-32, Gachibowli, Financial District, Nanakramguda, Hyderabad – 500 032, requesting for the User ID and Password. After receipt of the above credentials, please follow all the steps from Sr. No. (i) to (xi) as mentioned in (A) above, to cast the vote.

CO
MPA
NY
OV
ERV
IEW STA
TUTO
RY R
EPOR
TS FINA
NC
IAL STA
TEMEN
TS NO
TICE
NOTICE
Nava Bharat Ventures Limited 241
3. The remote e-voting period commences on Saturday, August 5, 2017 at 10:00 A.M. and ends on Tuesday, August 8, 2017 at 5:00 P.M. During this period, the members of the Company holding shares in physical form or in dematerialized form, as on the cut-off date, being Thursday, August 3, 2017, may cast their vote by electronic means in the manner and process set out hereinabove. The e-voting module shall be disabled for voting thereafter. Once the vote on a resolution is cast by the member, the member shall not be allowed to change it subsequently. Further, the members who have cast their vote electronically shall not vote at the AGM.
4. In case of any query pertaining to e-voting, please visit Help & FAQ’s section of https://evoting.karvy.com (Karvy’s website) or any grievances or queries of the members of the Company connected with the electronic voting can be addressed to the Company’s Registrars & Share Transfer Agents, Karvy Computershare Private Limited (Unit: Nava Bharat Ventures Limited), Karvy Selenium Tower B, Plot 31-32, Gachibowli Financial District, Nanakramguda, Hyderabad - 500 032 to Contact Person: Mr. Mohd Mohsin Uddin, Senior Manager, Telephone Nos. 040-67162222 –Ext No: 1562.
5. The voting rights of the members shall be in proportion to their shares of the paid up equity share capital of the Company, subject to the provisions of the Companies Act, 2013 and rules made thereunder, as amended, as on the cut-off date, being Thursday, August 3, 2017.
6. The Board of directors has appointed Mrs. D. Renuka, Practicing Company Secretary, as a Scrutinizer to scrutinize the e-voting process in a fair and transparent manner.
7. The members who are entitled to vote but have not exercised their right to vote through remote e-voting may vote at the AGM through ballot paper explained in AGM Notice, for all businesses specified in the accompanying Notice.
8. The Scrutinizer shall, immediately after the conclusion of voting at the AGM, will first count the votes cast at the meeting through ballot paper thereafter unblock the votes cast through remote e-voting in the presence of at least two witnesses not in the employment of the Company and will make, not later than 48 hours from the conclusion of the AGM, a consolidated scrutiniser's report of the total
votes cast in favour or against, if any, to the Chairman or a person authorised by him in writing who will countersign the same. The Chairman or a person authorised by him in writing will declare the result of voting forthwith.
9. The results on resolutions shall be declared not later than 48 hours from the conclusion of the AGM of the Company and the resolutions will be deemed to be passed on the AGM date subject to receipt of the requisite number of votes in favour of the resolutions.
10. The results declared along with the Scrutinizer’s report(s) will be available on the website of the Company (www.nbventures.com) and on service provider’s website (https://evoting.karvy.com) and communication of the same to the BSE Limited and the National Stock Exchange of India Limited within 48 hours from the conclusion of the AGM.
Explanatory Statement pursuant to Sec.102(1) of the Companies Act 2013, read with Rule 15(3) of the Companies (Meetings of Board and its Powers) Rules, 2014.
Item no.5:
Ratification of appointment and remuneration of cost auditors for the financial year 2017-18:
The Board, on the recommendations of the Audit committee, approved the appointment and remuneration of the cost auditors, M/s. Narasimha Murthy & Co., Cost Accountants, 3-6-365, 104, Pavani Estate, Y. V. Rao Mansion, Himayat Nagar, Hyderabad - 500 029, to conduct the audit of the cost records of the Company across various segments, for the financial year ending March 31, 2018 as per the following details:
S. No.
ProductFee for
2017-18 (`)
1 Electricity (Eight Units) 4,00,000
2 Ferro Alloys (Steel) (Two Units) 1,20,000
3 Sugar 1,20,000
4 Industrial Alcohol 60,000
TOTAL 7,00,000
In accordance with the provisions of Section 148 of the Act read with the Companies (Audit and Auditors) Rules, 2014, the remuneration payable to the cost auditors as recommended by the Audit committee and approved by the Board of directors, needs to be ratified by the members of the Company. Accordingly, consent of the members is sought for ratification of the remuneration payable to the cost auditors for the financial year ending March 31, 2018.

242 45th Annual Report 2016-17
None of the directors / key managerial personnel of the Company / their relatives is, in any way, concerned or interested, financially or otherwise, in the resolution set out at Item no. 5 of the notice.
The Board commends the ordinary resolution set out at Item no.5 of the notice for approval by the members.
By order of the BoardFor NAVA BHARAT VENTURES LIMITED
VSN RajuPlace: Hyderabad Company Secretary Date : May 27, 2017 & Vice President
Registered Office:6-3-1109/1‘Nava Bharat Chambers’ Raj Bhavan Road, HYDERABAD – 500 082CIN : L27101TG1972PLC001549 Ph.No.040-23403501; Fax No.040-23403013 E-mail : [email protected]; Website : www.nbventures.com
Annexure - IDetails of directors seeking appointment / re-appointment at the annual general meeting (Pursuant to Regulation 36(3) of the SEBI (Listing Obligations and Disclosure Requirements) Regulations, 2015.
As required under this regulation, the particulars of director, Mr.GRK Prasad, director, who is proposed to be re-appointed, is given below:
a Name Mr. GRK Prasadb Brief Resumei) Age 59 Yearsii) Qualification B.Sc., FCA, FCSiii) Experience in specific functional area 36 yearsiv) Date of appointment on the Board of the Company (Nava Bharat
Ventures Ltd.)28.06.2003
c Nature of expertise in specific functional areas Experience in all facets of finance, Corporate Affairs and Overseas Operations. Expertise in project financing and financial management.
d Relationship between directors inter se [(As per Section 2(77) of the Companies Act, 2013 and Rule 4 of Companies (Specification of Definition Rules, 2014)]
Nil
e Name(s) of other Companies in which directorships / trusteeships held (as per Section 165 of the Companies Act,2013)
1. Maamba Collieries Limited, Zambia2. Kawambwa Sugar Limited, Zambia
(formerly Kariba Sugar Limited) 3. Nava Agro Pte.Limited, Singapore4. NB Tanagro Limited, Tanzania5. Nava Bharat Energy India Limited6. Nava Bharat Projects Limited7. Brahmani Infratech Private Limited
f Name(s) of companies in which committee membership(s)/chairmanship(s) held
Member – Nomination and Remuneration Committee & Audit Committee of Brahmani Infratech Private Limited
g No. of shares of ` 2/- each held bythe Director 65,172his relatives 2,20,000Total 2,85,172

CO
MPA
NY
OV
ERV
IEW STA
TUTO
RY R
EPOR
TS FINA
NC
IAL STA
TEMEN
TS NO
TICE
NOTICE
Nava Bharat Ventures Limited 243
NAVA BHARAT VENTURES LIMITEDCIN: L27101TG1972PLC001549
Regd.Office:6-3-1109/1, ‘Nava Bharat Chambers’, Raj Bhavan Road, Hyderabad – 500 082, Telangana, IndiaTel : + 91 40 23403501/40345999; Fax : + 91 40 23403013; E-mail: [email protected]; Website: www.nbventures.com
Form No. MGT-11
Proxy form[Pursuant to Section 105(6) of the Companies Act, 2013 and Rule 19(3) of the Companies (Management and Administration) Rules, 2014]
Name of the Member(s) : ........................................................................................................................................................................................................
Registered address : ............................................................................................................................................................ ....................................................
E-mail id : ......................................................................................................................................................................... ........................................................
Folio No./Client ID No. : ..................................................................................... DP ID No. : ........................................ ...........................................................
I/We, being the member(s) of NAVA BHARAT VENTURES LIMITED having ___________Shares of the Company, hereby appoint
1. Name :................................................................................... E-mail id : .......................................................................................................
Address :.................................................................................................................................................................................................................
Signature :................................................................................... or failing him / her
2. Name :................................................................................... E-mail id : .......................................................................................................
Address :.................................................................................................................................................................................................................
Signature :................................................................................... or failing him / her
3. Name :................................................................................... E-mail id : .......................................................................................................
Address :.................................................................................................................................................................................................................
Signature :.................................................................................................................................................................................................................
as my/our proxy to attend and vote (on a poll) for me/us and on my/ our behalf at the 45th annual general meeting of the Company, to be held on Wednesday, August 9, 2017 at 10:00 a.m. at Marigold Hotel, by and beside Green Park Hotel, 7-1-25, Greenlands, Begumpet, Hyderabad – 500 016 and at any adjournment thereof in respect of such resolutions as are indicated below:
Resolution No. [Ordinary business]:
1. Adoption of financial statements.
2. Declaration of dividend on the equity shares.
3. Re-appointment of director.
4. Appointment of auditors.
Resolution No. [Special business]:
5. Ratification of appointment and remuneration of cost auditors for the financial year 2017-18.
Signed this ....................................................................................... day of ........................................................................................, 2017
Signature of Shareholder(s) : …….…....................................……... Signature of Proxyholder(s) :….............................................…………
Note:1. This form of proxy in order to be effective should be duly completed and deposited at the registered office of the Company, not less than 48 hours before
the commencement of the meeting. 2. A person can act as proxy on behalf of members not exceeding fifty (50) and holding in the aggregate not more than 10% of the total share capital of
the Company. In case a proxy is proposed to be appointed by a member holding more than 10% of the total share capital of the Company carrying voting rights, then such proxy shall not act as a proxy for any other person or shareholder.
3. During the period beginning 24 hours before the time fixed for the commencement of the meeting and ending with the conclusion of the meeting, a member would be entitled to inspect the proxies lodged at any time during the business hours of the Company, provided that not less than three days of notice in writing is given to the Company.
4. In line with Secretarial Standards on general meetings, no gifts, gift coupons, or cash in lieu of gifts shall be distributed to members at or in connection with the meeting.
Please affix Re.
1/- Revenue Stamp and
Sign accross.

244 45th Annual Report 2016-17
This
page
is in
tent
ionall
y lef
t blan
k

NAVA BHARAT VENTURES LIMITED
(CIN: L27101TG1972PLC001549)
Regd. Office: 6-3-1109/1, ‘Nava Bharat Chambers’, Raj Bhavan Road, Hyderabad – 500 082, Telangana
Tel : +91 40 23403501/40345999 ; Fax : +91 40 23403013
E-mail : [email protected] ; Website : www.nbventures.com
ATTENDANCE SLIP
Registered folio no. / DP & Client ID no. :
Sr.no. :
Name of the Sole / First named member
:
Registered address:
Name(s) of the joint member(s), if any :
No. of shares held :
I/we certify that I/we am/are member(s)/proxy for the member(s) of the Company.
I/We hereby record my/our presence at the 45 annual general meeting of the Company on Wednesday,
August 9, 2017 at 10:00 a.m. at Marigold Hotel, by and beside Green Park Hotel, 7-1-25, Greenlands,
Begumpet, Hyderabad - 500 016.
th
_______________________________________________
Signature of First holder/Proxy/Authorised representative
______________________
Signature of Joint holder(s)
Place:
Date:
Notes:
1. Please sign this attendance slip and hand it over at the meeting venue.
2. Only shareholders of the Company and/or their Proxy will be allowed to attend the meeting
3. In line with Secretarial Standards on general meetings, no gifts, gift coupons, or cash in lieu of gifts shall be
distributed to members at or in connection with the meeting.
__________________________________________________________________________________________
E-VOTING
Users who wish to opt for e-voting may use the following login credentials:
EVEN
(E-VOTING EVENT NO.)
USER ID PASSWORD / PIN
Note:
Please follow steps for remote e-voting procedure as given in the Notice of AGM by logging on to
-https://evoting.karvy.com and the same is available on the Company’s website www.nbventures.com

CO
MPA
NY
OV
ERV
IEW STA
TUTO
RY R
EPOR
TS FINA
NC
IAL STA
TEMEN
TS NO
TICE
NOTICE
Nava Bharat Ventures Limited 245
Form No. MGT-12
Polling paper
[Pursuant to Section 109(5) of the Companies Act, 2013 and Rule 21(1)(c) of the Companies (Management and Administration) Rules, 2014]
CIN : L27101TG1972PLC001549
Name of the Company : NAVA BHARAT VENTURES LIMITED
Registered Office : 6-3-1109/1, ‘Nava Bharat Chambers’, Raj Bhavan Road, Hyderabad – 500082, Telangana, India
Ballot paper
S. No Particulars
1. Name of the first named shareholder ................................................................................................................
(in block letters) ................................................................................................................................................
2. Postal address: …..............................................................................................................................................
.........................................................................................................................................................................
3 Registered Folio No./*Client ID No. ...................................................................................................................
(*Applicable to investors holding shares in dematerialized form)
4 Class of Share(s) ................................................................................................................................................
I hereby exercise my vote in respect of ordinary/special resolution enumerated below by recording my assent or dissent to the said resolution in the following manner:
Sl. No ItemNo. of shares held
by meI assent to the
resolutionI dissent from the
resolution
Ordinary business
1 Adoption of financial statements
2 Declaration of dividend on the equity shares
3 Re-appointment of director
4 Appointment of auditors
Special business
5 Ratification of appointment and remuneration of cost auditors for the financial year 2017-18
Place:
Date:
(Signature of the Shareholder)

246 45th Annual Report 2016-17
Route Map to reach the AGM Venue
Marigold Hotel by and beside Green Park Hotel 7-1-25, Greenlands, Begumpet, Hyderabad - 500016

CO
MPA
NY
OV
ERV
IEW STA
TUTO
RY R
EPOR
TS FINA
NC
IAL STA
TEMEN
TS NO
TICE
NOTICE
Nava Bharat Ventures Limited 247
NOTES

248 45th Annual Report 2016-17
NOTES

Women Empowerment Center, Paloncha
