nava bharat ventures limited€¦ · nava bharat group at a glance ... engineering, project...
TRANSCRIPT
NAVA BHARAT VENTURES LIMITED
Investor Presentation
1
Contents
Nava Bharat Group at a glance
Financials
Power business – the key growth driver
International foray
2
Nava Bharat Group
-Value proposition
3
We will provide innovative and cost-effective solutions for value addition and sustainable local
growth
We will achieve this through efficient utilisation of natural resources, leveraging our strengths
in design, engineering, project execution and operation and maintenance
4
Mission Statement
Nava Bharat Group
5
Large industrial conglomerate with interests across power, coal mining, ferro alloys and
sugar
Headquartered at Hyderabad in India
Presence across India, Africa and South East Asia
Around USD 1 billion investments proposed in natural resources and power generation
Accredited with ISO 9001, ISO 14001 , ISO 18001 and ISO 50001
US$ 193 Mn (Rs 11.54 Bn) top line for FY 2014
US$ 32 Mn (Rs 1.93 Bn) bottom line for FY 2014
US$ 334 Mn (Rs 20.53 Bn) market capitalization (as on
07/08/14)
At a glance
6 *For FY 13 numbers conversion rate is Rs/USD= 59.91 & for 07/08/2014 Rs/USD= 61.336
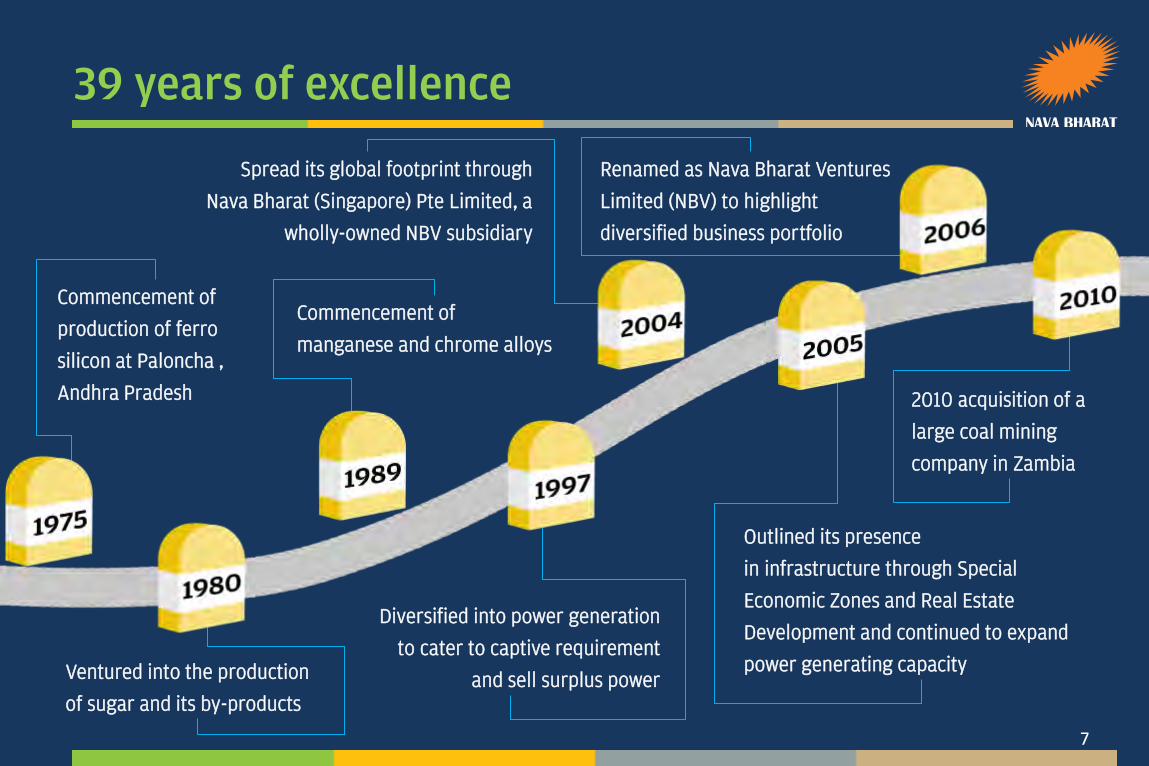
39 years of excellence
7
Commencement of
production of ferro
silicon at Paloncha ,
Andhra Pradesh
Ventured into the production
of sugar and its by-products
Diversified into power generation
to cater to captive requirement
and sell surplus power
Spread its global footprint through
Nava Bharat (Singapore) Pte Limited, a
wholly-owned NBV subsidiary
Outlined its presence
in infrastructure through Special
Economic Zones and Real Estate
Development and continued to expand
power generating capacity
Renamed as Nava Bharat Ventures
Limited (NBV) to highlight
diversified business portfolio
2010 acquisition of a
large coal mining
company in Zambia
Commencement of
manganese and chrome alloys
Diversified revenue streams
Strong Design, Engineering, Project
Execution and O& M skills for process
and power plants
Energy efficient plants
Distributed power assets to exploit
the usage of low grade coal and
washery rejects
Group strengths
8
Environmentally responsible
corporate citizen and strong believer
of Corporate Social Responsibility
Good track record with lenders and
investors
Strategic planning to be well ahead of
competition

From single product, single location to multi-product, multi-location
9
*Zambia and Tanzania
**Laos
Presently there are no initiatives under infrastructure or mineral ores
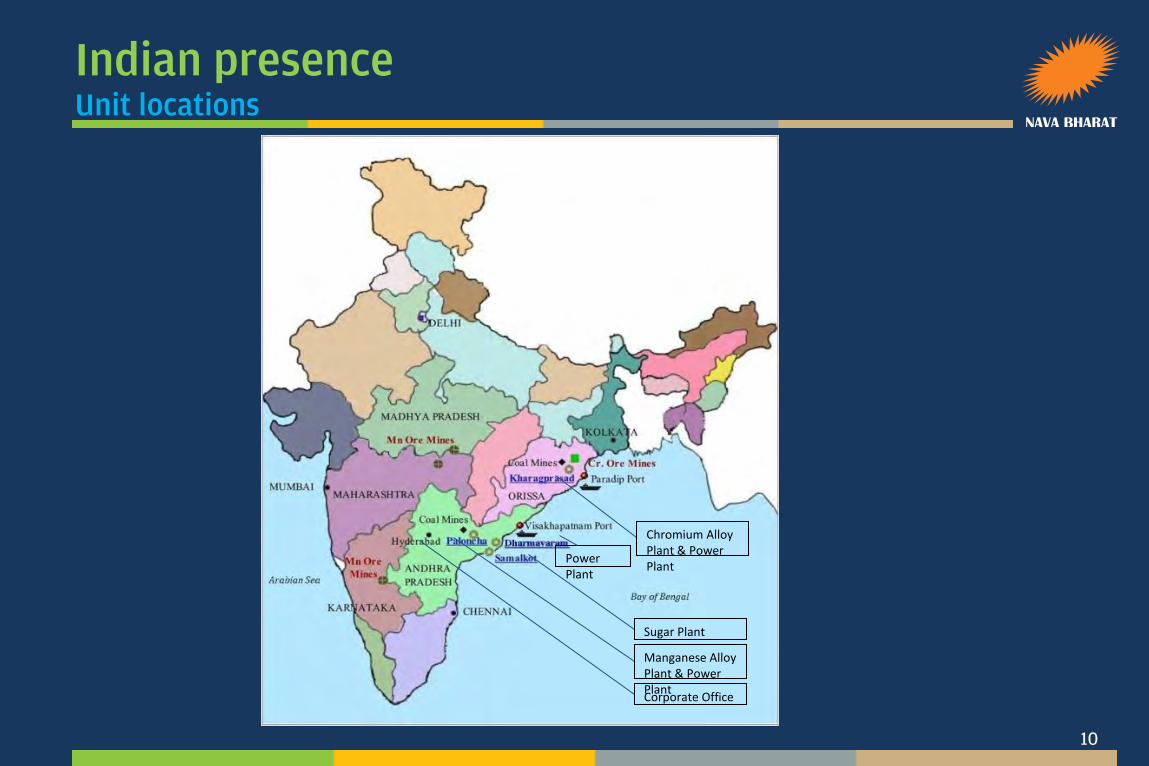
Indian presence Unit locations
10
Corporate Office
Manganese Alloy Plant & Power Plant
Sugar Plant
Chromium Alloy Plant & Power Plant
Power Plant

International footprints Unit locations
11
Singapore (existing)
Zambia (existing)
Tanzania (upcoming)
Laos (upcoming)
Singapore (existing)
Zambia (existing)
Tanzania (upcoming)
Laos (upcoming)
Financials
12
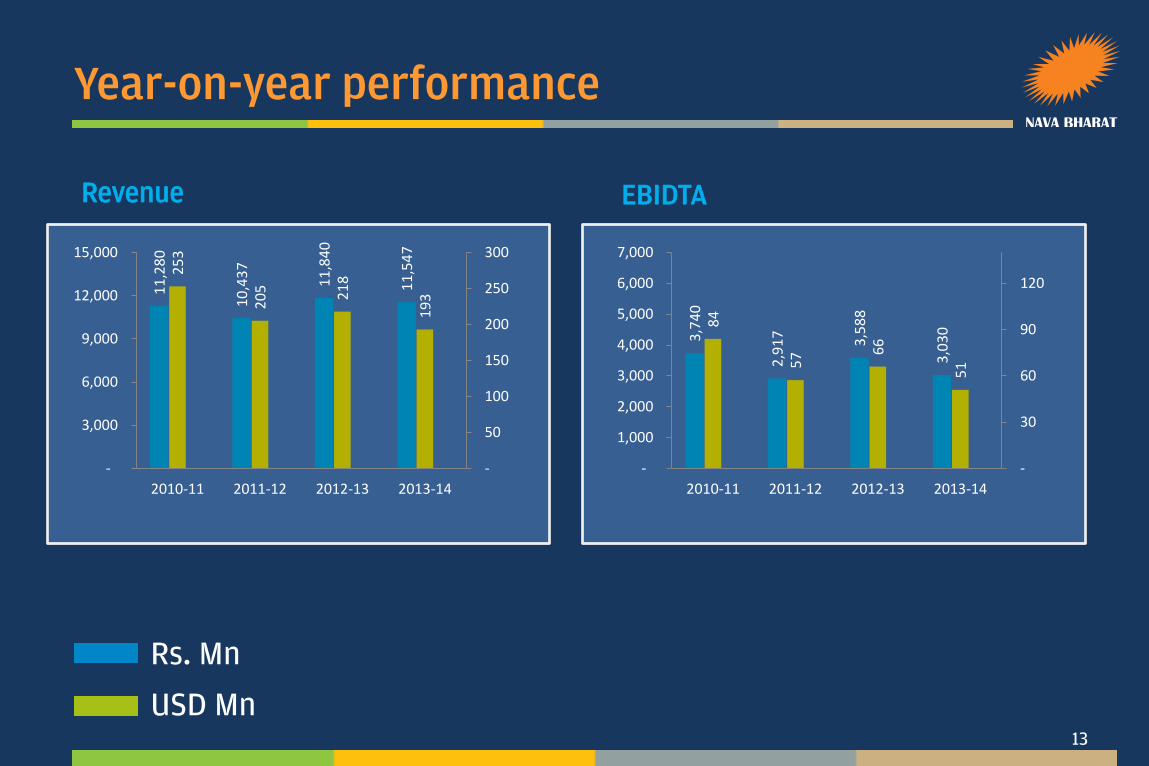
Year-on-year performance
13
Revenue
11
,28
0
10
,43
7
11
,84
0
11
,54
7
25
3
20
5
21
8
19
3
-
50
100
150
200
250
300
-
3,000
6,000
9,000
12,000
15,000
2010-11 2011-12 2012-13 2013-14
EBIDTA
3,7
40
2,9
17
3,5
88
3,0
30
84
57
66
51
-
30
60
90
120
-
1,000
2,000
3,000
4,000
5,000
6,000
7,000
2010-11 2011-12 2012-13 2013-14
Rs. Mn
USD Mn
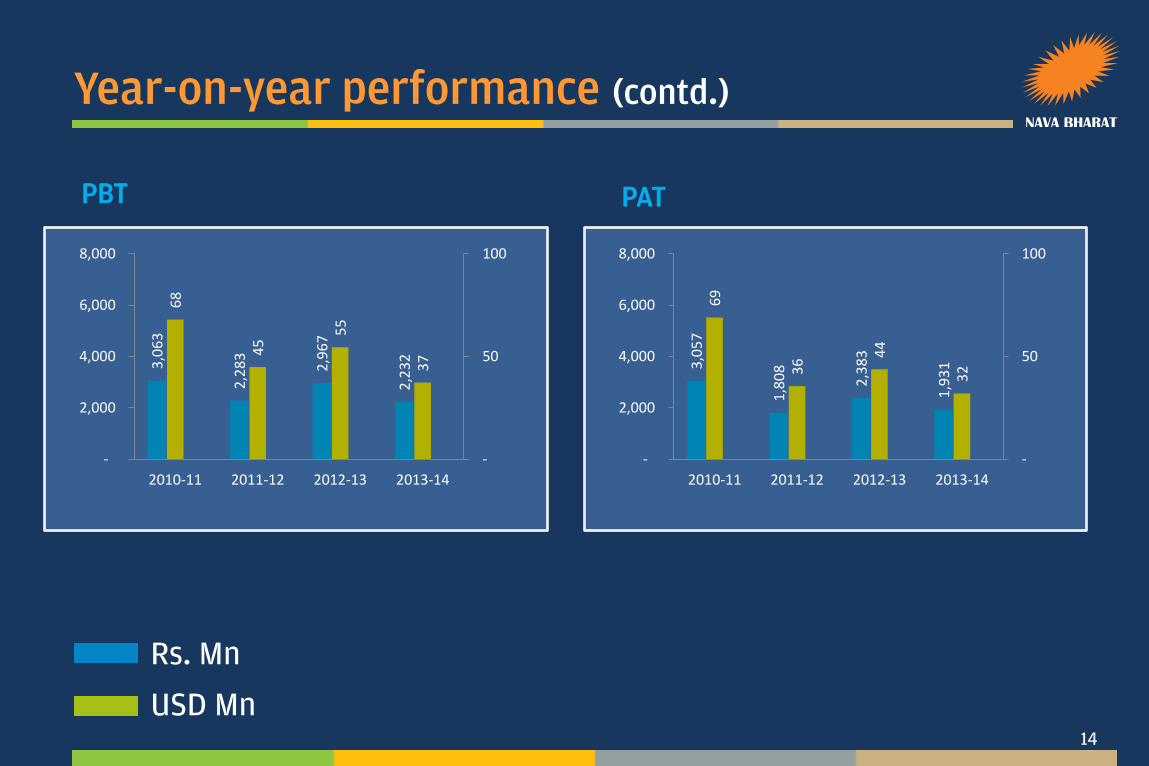
Year-on-year performance (contd.)
14
PBT
3,0
63
2,2
83
2,9
67
2,2
32
68
45
55
37
-
50
100
-
2,000
4,000
6,000
8,000
2010-11 2011-12 2012-13 2013-14
PAT
3,0
57
1,8
08
2,3
83
1,9
31
69
36
44
32
-
50
100
-
2,000
4,000
6,000
8,000
2010-11 2011-12 2012-13 2013-14
Rs. Mn
USD Mn

Year-on-year performance (contd.)
15
5,4
31
3,5
15
2,2
91
2,8
65
2,5
47
12
1
78
45
53
43
-
50
100
150
-
2,000
4,000
6,000
8,000
2009-10 2010-11 2011-12 2012-13 2013-14
Net cash accruals
Rs. Mn
USD Mn
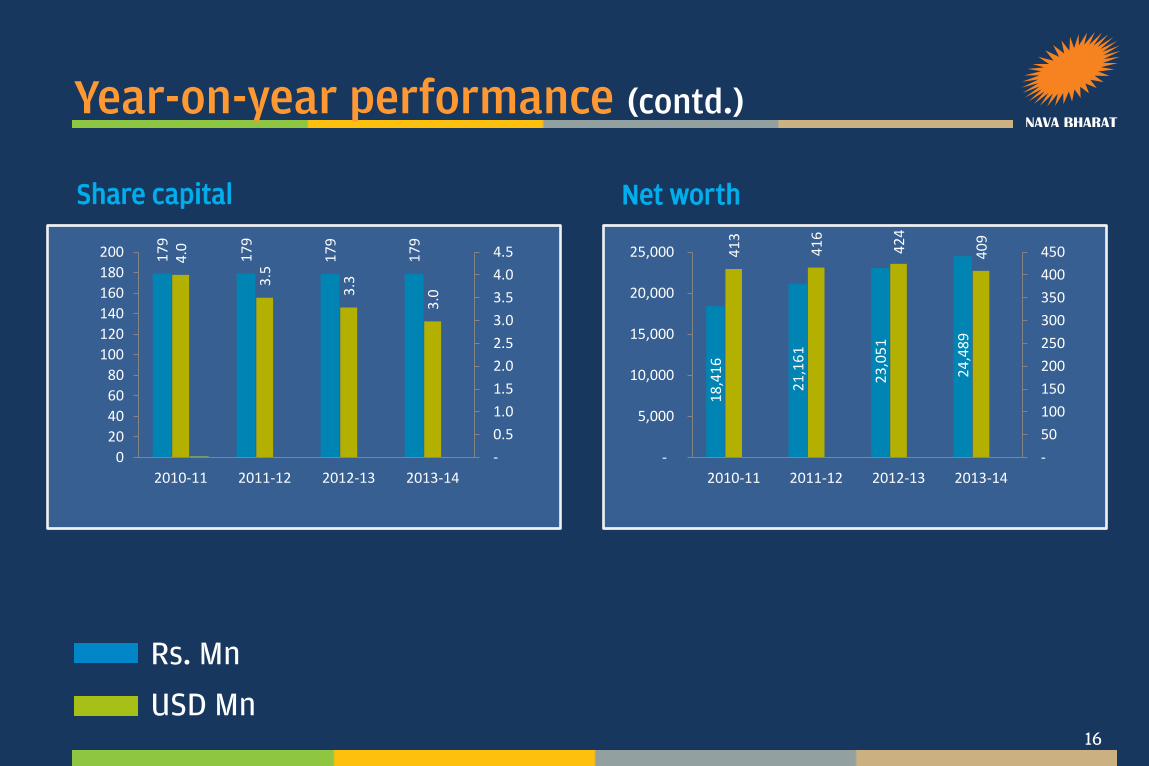
Year-on-year performance (contd.)
16
Share capital Net worth
18
,41
6
21
,16
1
23
,05
1
24
,48
9
41
3
41
6
42
4
40
9
-
50
100
150
200
250
300
350
400
450
-
5,000
10,000
15,000
20,000
25,000
2010-11 2011-12 2012-13 2013-14
17
9
17
9
17
9
17
9
4.0
3.5
3.3
3.0
-
0.5
1.0
1.5
2.0
2.5
3.0
3.5
4.0
4.5
0
20
40
60
80
100
120
140
160
180
200
2010-11 2011-12 2012-13 2013-14
Rs. Mn
USD Mn

Year-on-year performance (contd.)
17
1,7
64
96
2
67
8 1
,30
5
40
19
12
22
-
50
-
1,000
2,000
3,000
4,000
5,000
2010-11 2011-12 2012-13 2013-14
Total debt
Rs. Mn
USD Mn
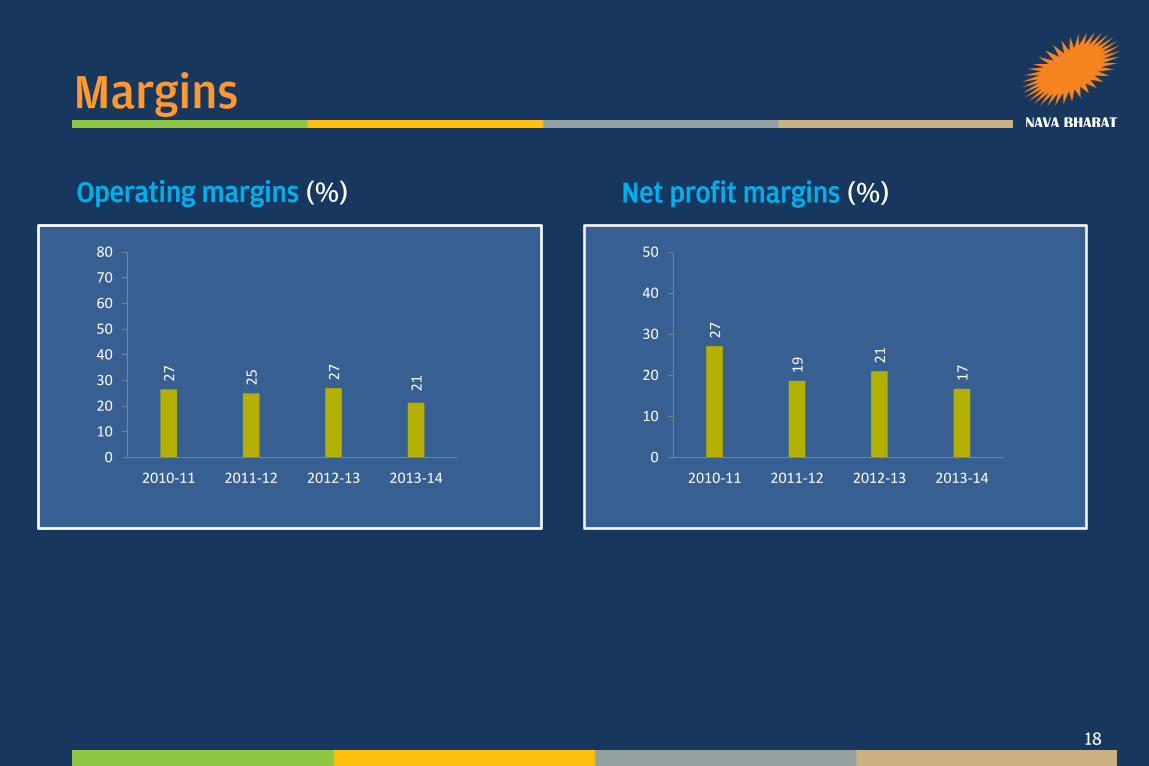
Margins
18
Operating margins (%) 2
7
25
27
21
0
10
20
30
40
50
60
70
80
2010-11 2011-12 2012-13 2013-14
Net profit margins (%)
27
19
21
17
0
10
20
30
40
50
2010-11 2011-12 2012-13 2013-14
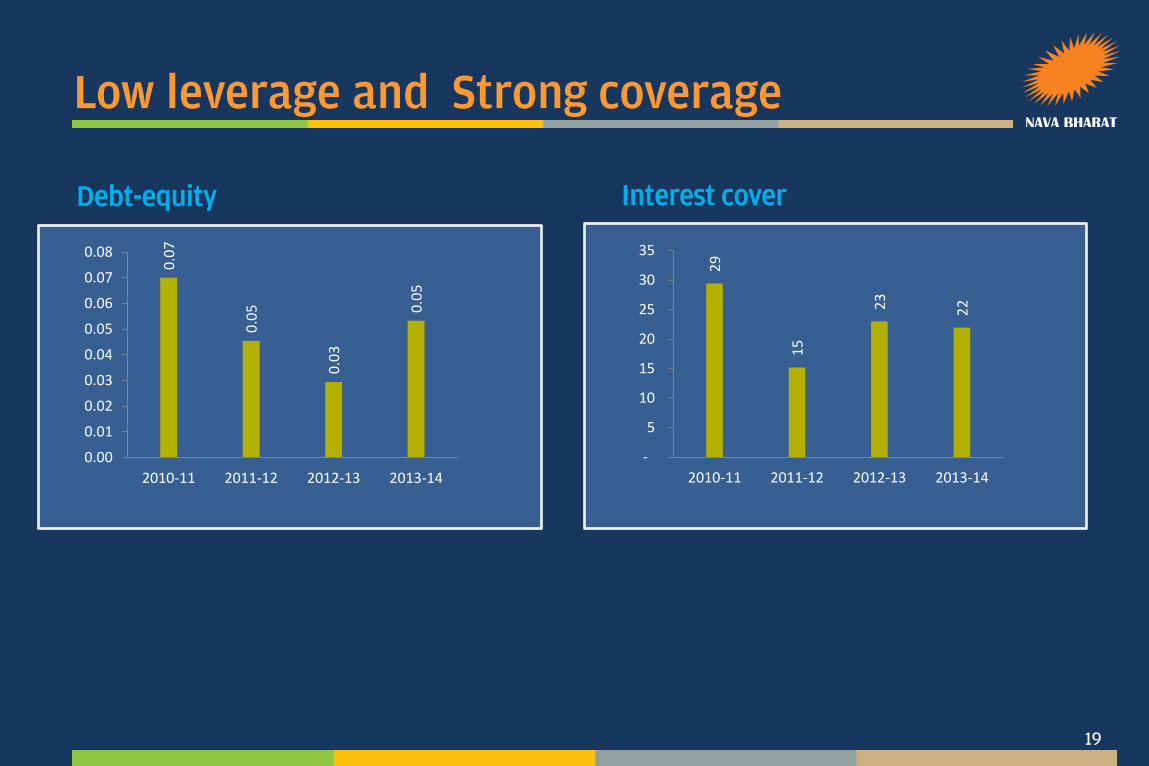
Low leverage and Strong coverage
19
Debt-equity 0
.07
0.0
5
0.0
3
0.0
5
0.00
0.01
0.02
0.03
0.04
0.05
0.06
0.07
0.08
2010-11 2011-12 2012-13 2013-14
Interest cover
29
15
23
22
-
5
10
15
20
25
30
35
2010-11 2011-12 2012-13 2013-14
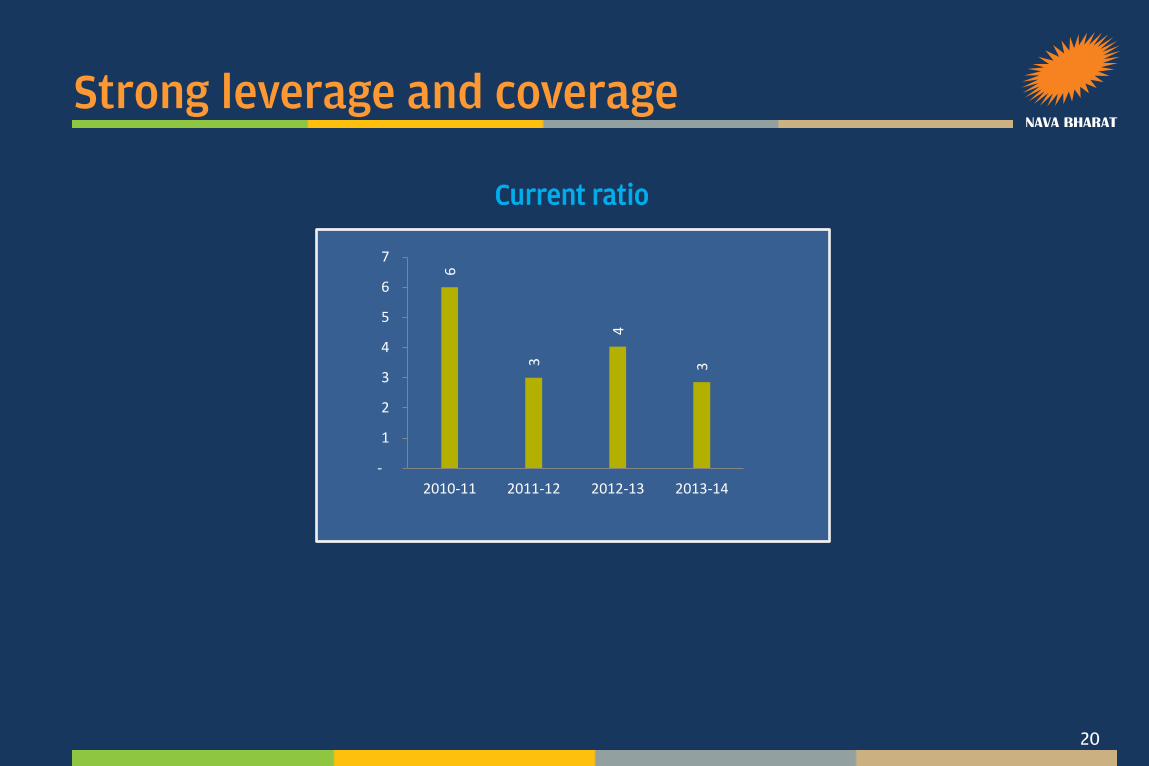
Strong leverage and coverage
20
6
3
4
3
-
1
2
3
4
5
6
7
2010-11 2011-12 2012-13 2013-14
Current ratio
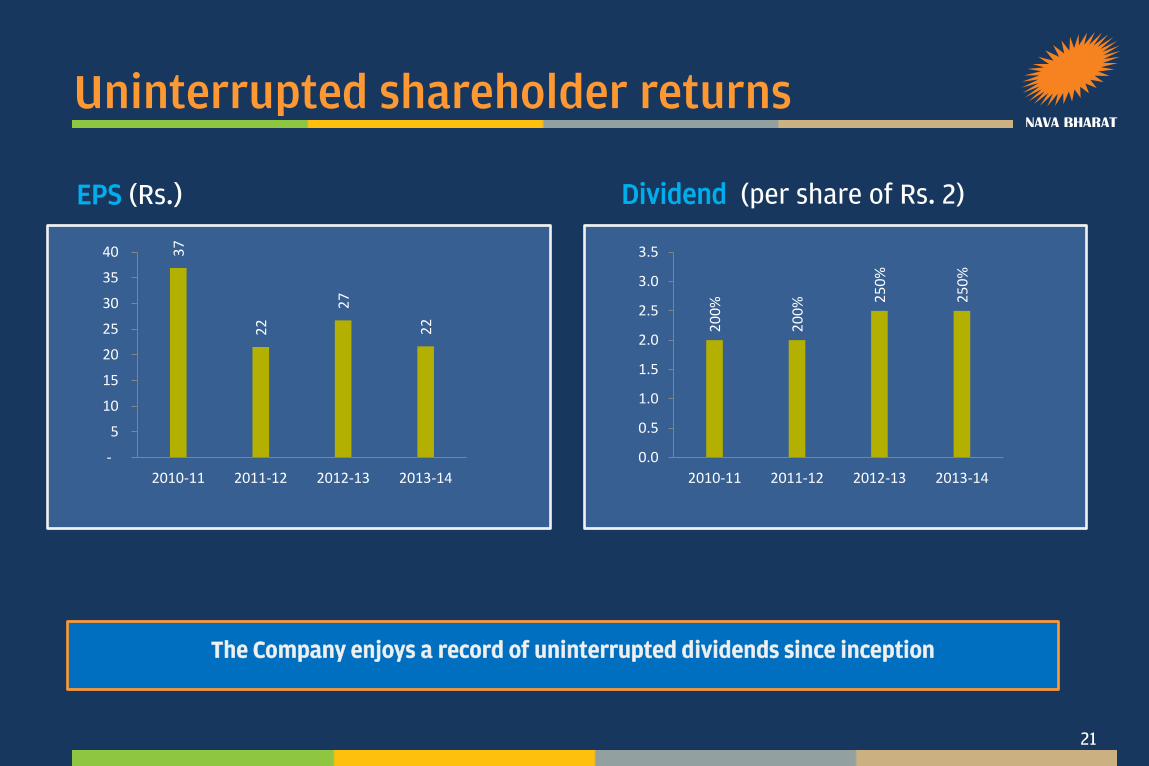
Uninterrupted shareholder returns
21
EPS (Rs.) 3
7
22
27
22
-
5
10
15
20
25
30
35
40
2010-11 2011-12 2012-13 2013-14
Dividend (per share of Rs. 2)
20
0%
20
0%
25
0%
25
0%
0.0
0.5
1.0
1.5
2.0
2.5
3.0
3.5
2010-11 2011-12 2012-13 2013-14
The Company enjoys a record of uninterrupted dividends since inception
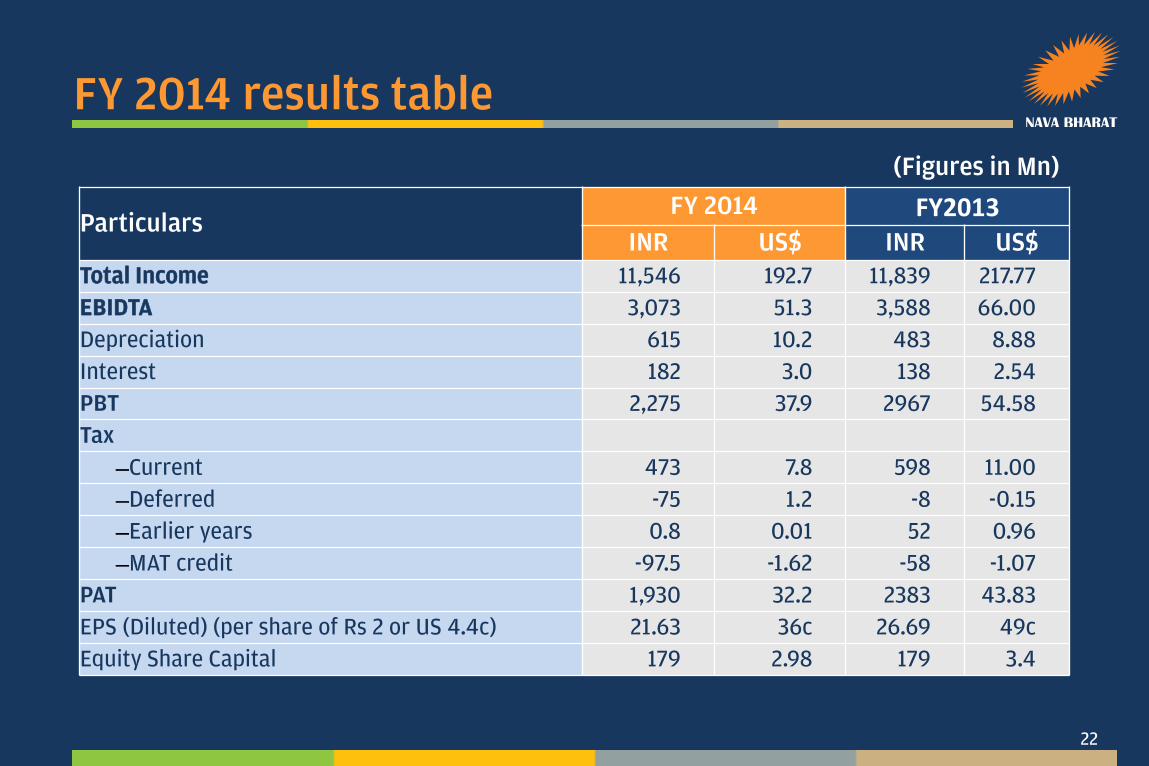
FY 2014 results table
(Figures in Mn)
22
Particulars FY 2014 FY2013
INR US$ INR US$ Total Income 11,546 192.7 11,839 217.77
EBIDTA 3,073 51.3 3,588 66.00
Depreciation 615 10.2 483 8.88
Interest 182 3.0 138 2.54
PBT 2,275 37.9 2967 54.58
Tax –Current 473 7.8 598 11.00
–Deferred -75 1.2 -8 -0.15
–Earlier years 0.8 0.01 52 0.96
–MAT credit -97.5 -1.62 -58 -1.07
PAT 1,930 32.2 2383 43.83
EPS (Diluted) (per share of Rs 2 or US 4.4c) 21.63 36c 26.69 49c
Equity Share Capital 179 2.98 179 3.4
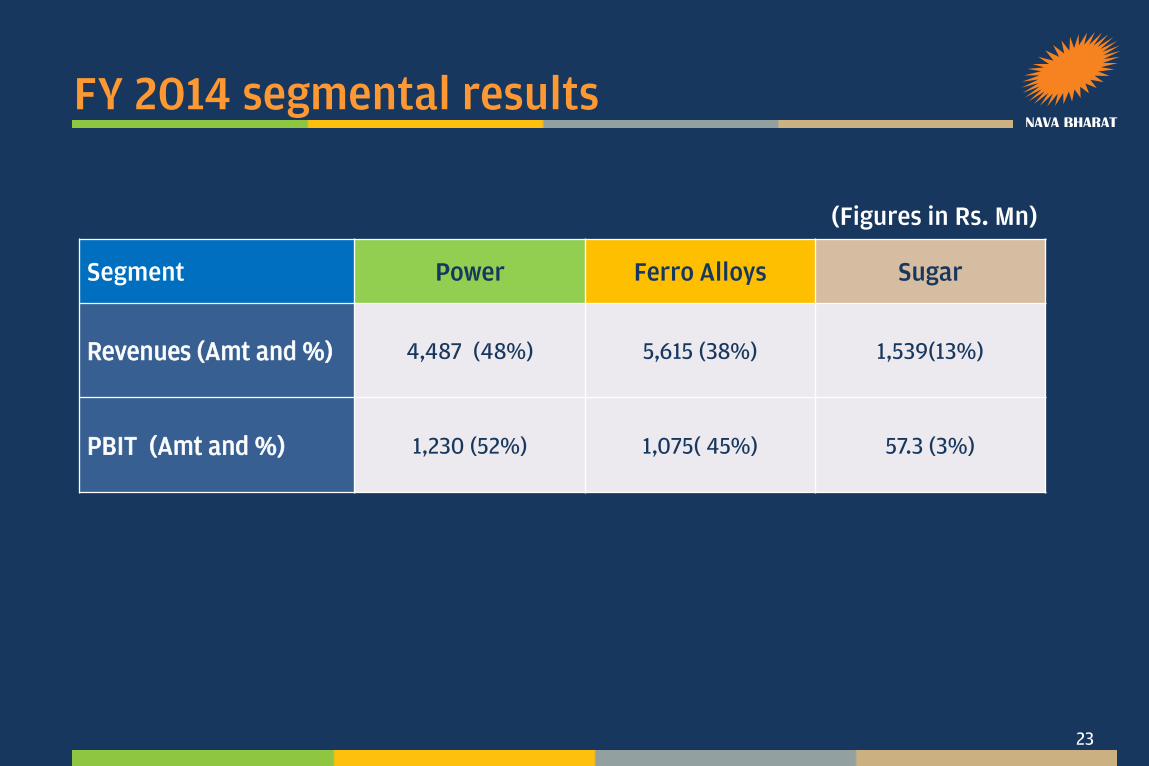
FY 2014 segmental results
(Figures in Rs. Mn)
Segment Power Ferro Alloys Sugar
Revenues (Amt and %) 4,487 (48%) 5,615 (38%) 1,539(13%)
PBIT (Amt and %) 1,230 (52%) 1,075( 45%) 57.3 (3%)
23
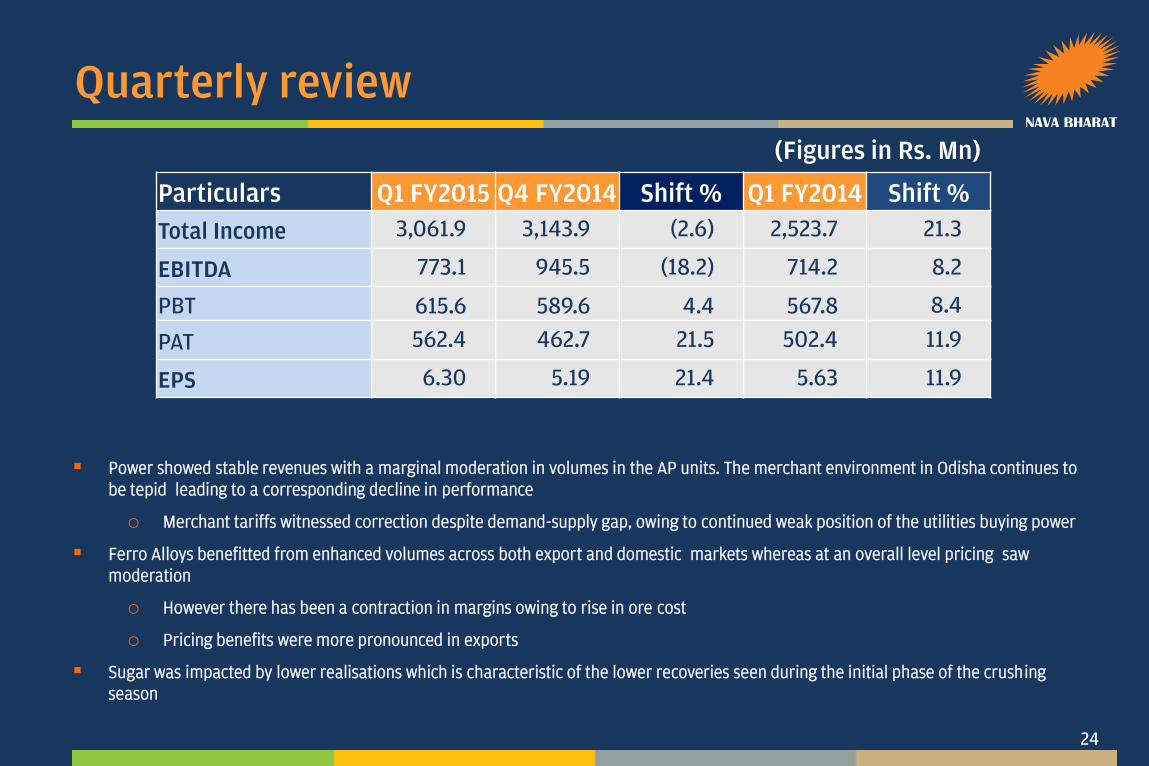
Quarterly review
24
Particulars Q1 FY2015 Q4 FY2014 Shift % Q1 FY2014 Shift %
Total Income 3,061.9 3,143.9 (2.6) 2,523.7 21.3
EBITDA 773.1 945.5 (18.2) 714.2 8.2
PBT 615.6 589.6 4.4 567.8 8.4
PAT 562.4 462.7 21.5 502.4 11.9
EPS 6.30 5.19 21.4 5.63 11.9
Power showed stable revenues with a marginal moderation in volumes in the AP units. The merchant environment in Odisha continues to be tepid leading to a corresponding decline in performance
o Merchant tariffs witnessed correction despite demand-supply gap, owing to continued weak position of the utilities buying power
Ferro Alloys benefitted from enhanced volumes across both export and domestic markets whereas at an overall level pricing saw moderation
o However there has been a contraction in margins owing to rise in ore cost
o Pricing benefits were more pronounced in exports
Sugar was impacted by lower realisations which is characteristic of the lower recoveries seen during the initial phase of the crushing season
(Figures in Rs. Mn)
Power business, a key growth driver
25
26
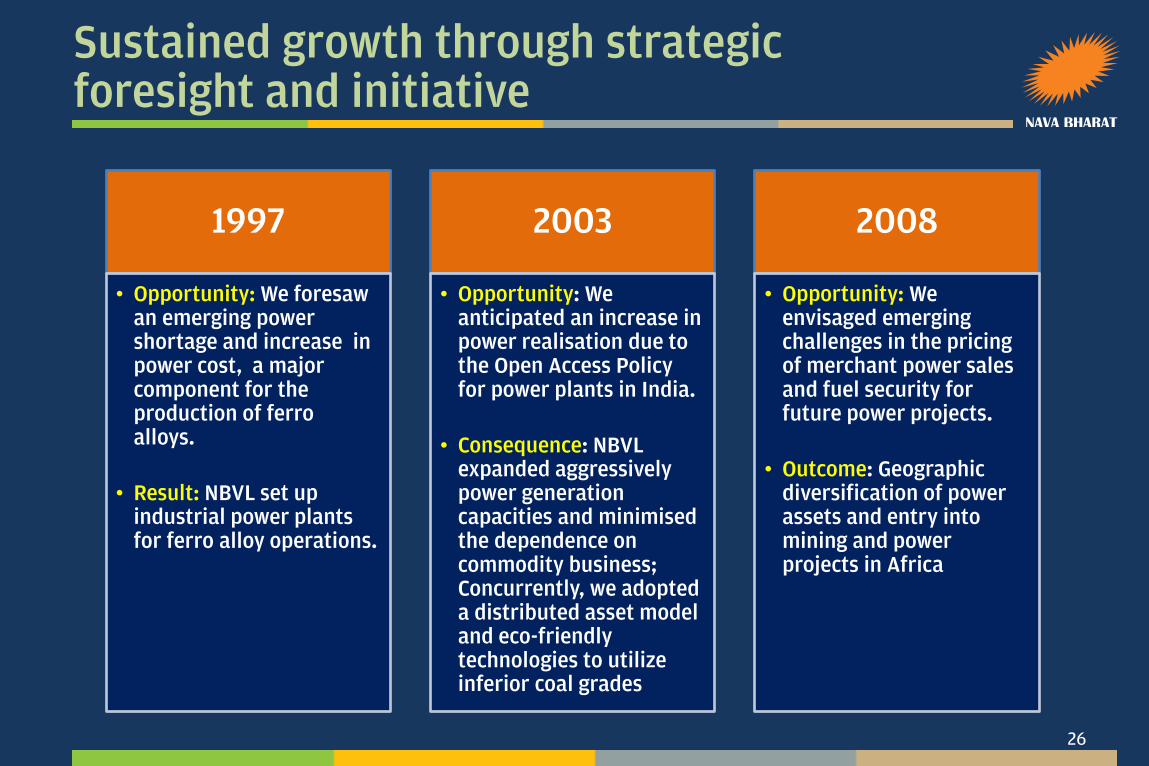
Sustained growth through strategic foresight and initiative
1997
• Opportunity: We foresaw an emerging power shortage and increase in power cost, a major component for the production of ferro alloys.
• Result: NBVL set up industrial power plants for ferro alloy operations.
2003
• Opportunity: We anticipated an increase in power realisation due to the Open Access Policy for power plants in India.
• Consequence: NBVL expanded aggressively power generation capacities and minimised the dependence on commodity business; Concurrently, we adopted a distributed asset model and eco-friendly technologies to utilize inferior coal grades
2008
• Opportunity: We envisaged emerging challenges in the pricing of merchant power sales and fuel security for future power projects.
• Outcome: Geographic diversification of power assets and entry into mining and power projects in Africa
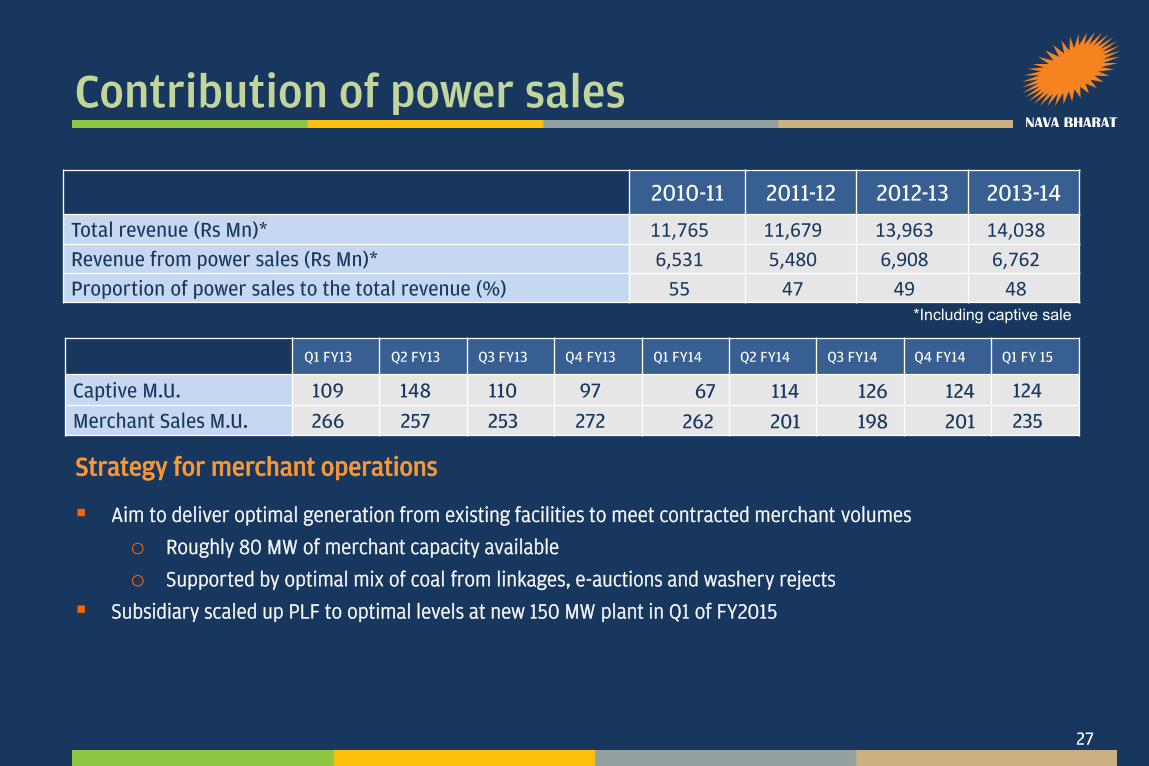
Contribution of power sales
2010-11 2011-12 2012-13 2013-14
Total revenue (Rs Mn)* 11,765 11,679 13,963 14,038
Revenue from power sales (Rs Mn)* 6,531 5,480 6,908 6,762
Proportion of power sales to the total revenue (%) 55 47 49 48
27
*Including captive sale
Strategy for merchant operations Aim to deliver optimal generation from existing facilities to meet contracted merchant volumes
o Roughly 80 MW of merchant capacity available
o Supported by optimal mix of coal from linkages, e-auctions and washery rejects
Subsidiary scaled up PLF to optimal levels at new 150 MW plant in Q1 of FY2015
Q1 FY13 Q2 FY13 Q3 FY13 Q4 FY13 Q1 FY14 Q2 FY14 Q3 FY14 Q4 FY14 Q1 FY 15
Captive M.U. 109 148 110 97 67 114 126 124 124
Merchant Sales M.U. 266 257 253 272 262 201 198 201 235
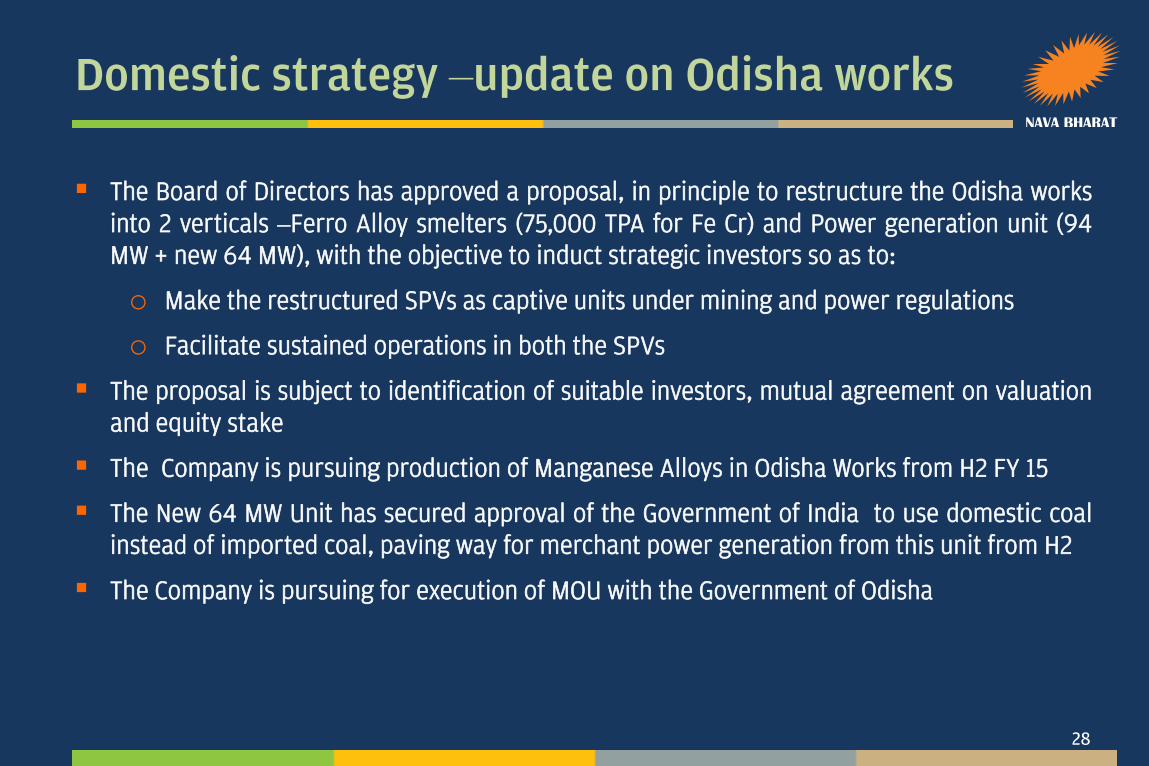
Domestic strategy –update on Odisha works
28
The Board of Directors has approved a proposal, in principle to restructure the Odisha works into 2 verticals –Ferro Alloy smelters (75,000 TPA for Fe Cr) and Power generation unit (94 MW + new 64 MW), with the objective to induct strategic investors so as to:
o Make the restructured SPVs as captive units under mining and power regulations
o Facilitate sustained operations in both the SPVs
The proposal is subject to identification of suitable investors, mutual agreement on valuation and equity stake
The Company is pursuing production of Manganese Alloys in Odisha Works from H2 FY 15
The New 64 MW Unit has secured approval of the Government of India to use domestic coal instead of imported coal, paving way for merchant power generation from this unit from H2
The Company is pursuing for execution of MOU with the Government of Odisha
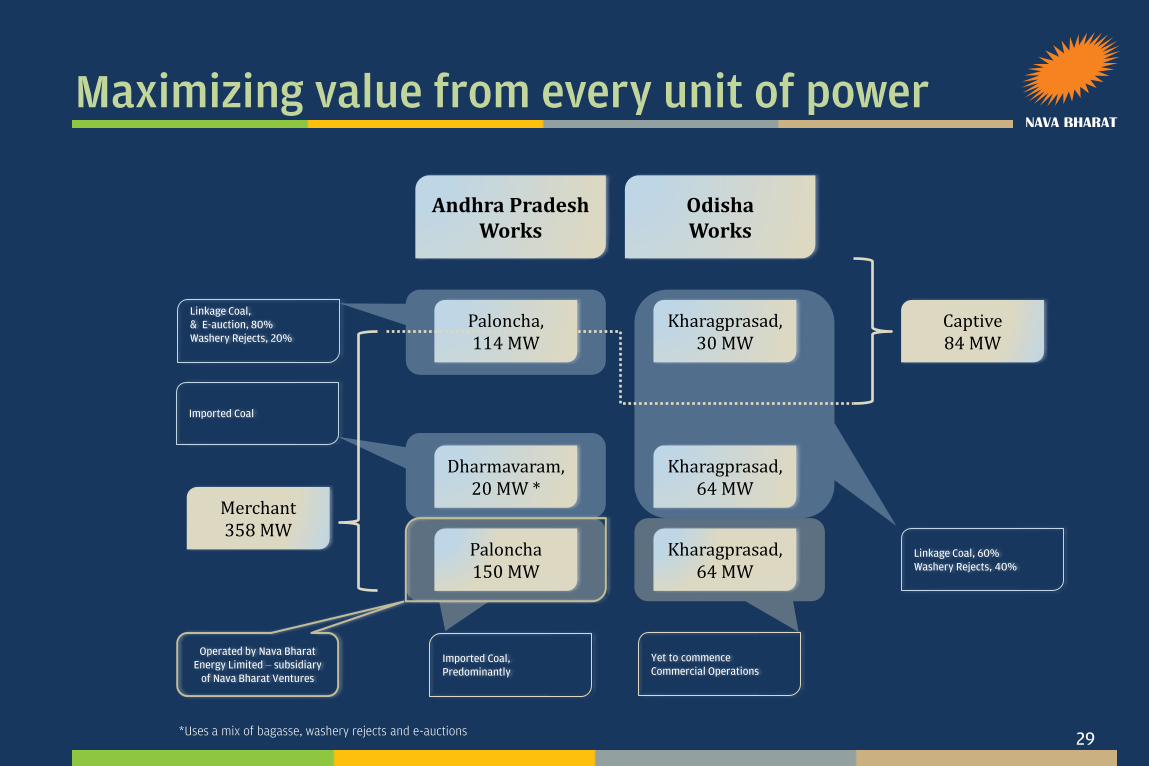
Maximizing value from every unit of power
29
Andhra Pradesh Works
Odisha Works
Paloncha, 114 MW
Dharmavaram, 20 MW *
Paloncha 150 MW
Kharagprasad, 30 MW
Kharagprasad, 64 MW
Kharagprasad, 64 MW
Captive 84 MW
Merchant 358 MW
Linkage Coal, 60% Washery Rejects, 40%
Yet to commence Commercial Operations
*Uses a mix of bagasse, washery rejects and e-auctions
Linkage Coal, & E-auction, 80% Washery Rejects, 20%
Imported Coal
Imported Coal, Predominantly
Operated by Nava Bharat Energy Limited – subsidiary
of Nava Bharat Ventures
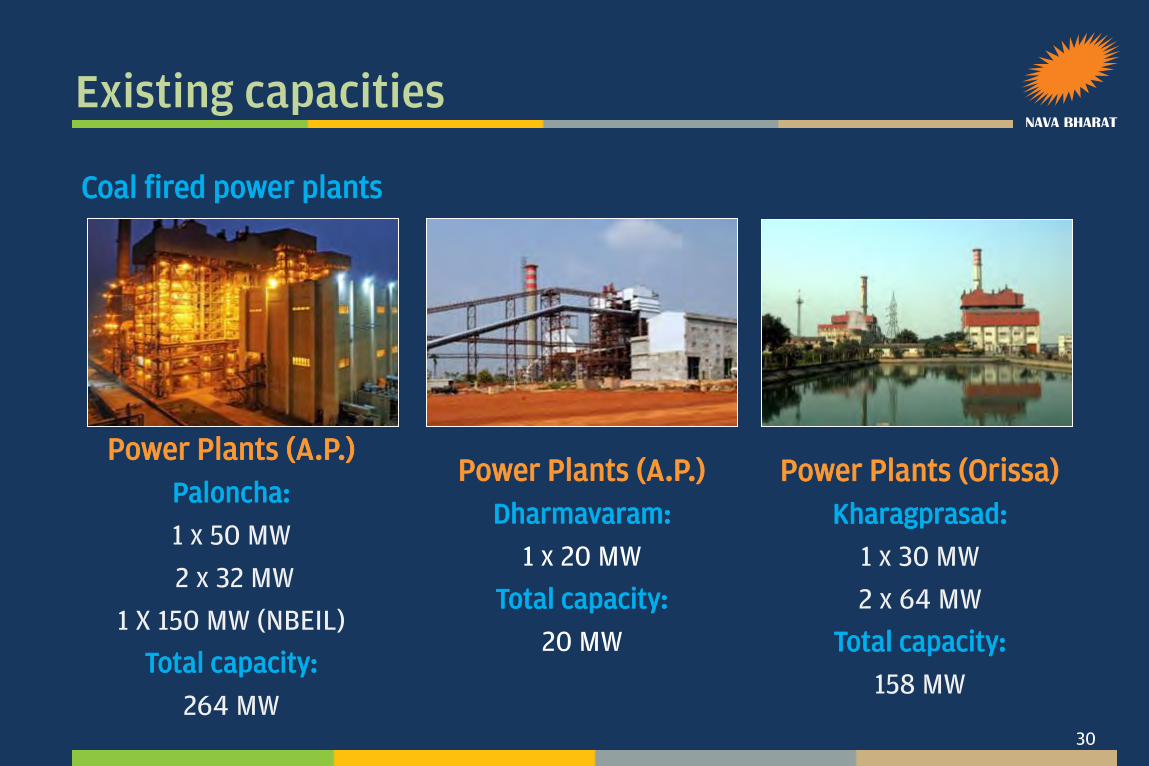
Existing capacities
Power Plants (A.P.)
Paloncha:
1 x 50 MW
2 x 32 MW
1 X 150 MW (NBEIL)
Total capacity:
264 MW
Coal fired power plants
Power Plants (Orissa)
Kharagprasad:
1 x 30 MW
2 x 64 MW
Total capacity:
158 MW
Power Plants (A.P.)
Dharmavaram:
1 x 20 MW
Total capacity:
20 MW
30

The Ferro Alloys operation
31
125,000 TPA Silico Manganese, Ferro Manganese facility at Paloncha –Andhra Pradesh
o Facility equipped with three smelters of 16.5 MVA and one smelter of 27.6 MVA
75,000 TPA Ferro Chrome unit at Kharagprasad –Orissa
o Plant has two smelters of 22.5 MVA each
Self-sufficiency in power with 208 MW coal-based, captive capacity
Ore suppliers from Madhya Pradesh, Maharashtra and Karnataka and Odisha for Mn and Cr ores. Additional sources for ore identified and contracted in Australia , Africa and Gulf regions
Proximity to Visakhapatnam (for Paloncha) and Paradip (for Kharagprasad) ports - strong exports to Japan, Korea, Europe and possibly USA
The Odisha unit will alternate between conversion of Ferro Chrome for Tata Steel or production of manganese alloys to ensure recovery of fixed costs and value addition for captive consumption
The integrated Sugar operations
32
Integrated sugar facility at Samalkot, Andhra Pradesh
o 4,000 TCD crushing mill capable of producing 40,000 tonnes sugar a year
o 20 MW co-generation plant
o 20 Klpd. distillery that makes approx. 2.50 million bulk litres of rectified spirit (which is used to manufacture ethanol/extra neutral alcohol)
Superior technology that produces quality refined sugar conforming to 26-28 ICUMSA whiteness standard
Retail Sugar is marketed under the ‘Deccan’ brand
The facility is located in fertile cane growing region of Eastern A.P.
o Average cane recovery of 10%
Nava Bharat’s corporate cane development program involves farmers to improve cane yields and recoveries
International foray
33
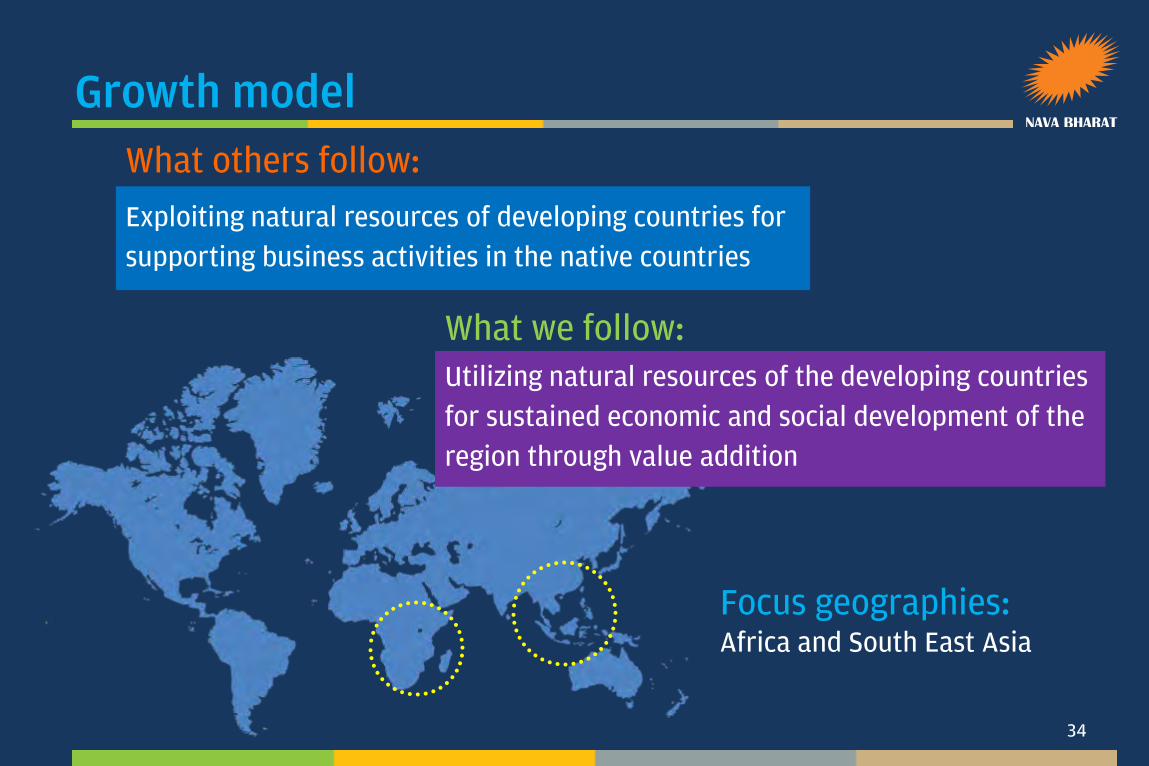
Growth model
What others follow:
Exploiting natural resources of developing countries for
supporting business activities in the native countries
What we follow: Utilizing natural resources of the developing countries
for sustained economic and social development of the
region through value addition
Focus geographies: Africa and South East Asia
34
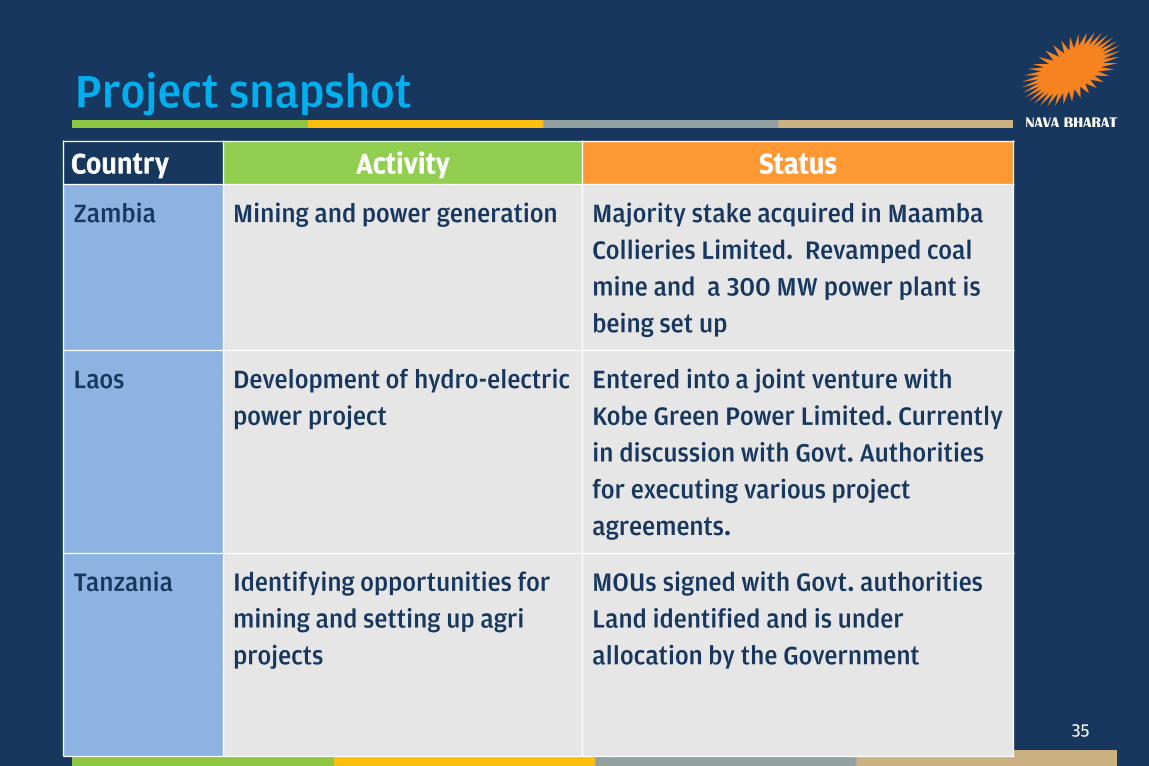
Project snapshot
35
Country Activity Status
Zambia Mining and power generation Majority stake acquired in Maamba
Collieries Limited. Revamped coal
mine and a 300 MW power plant is
being set up
Laos Development of hydro-electric
power project
Entered into a joint venture with
Kobe Green Power Limited. Currently
in discussion with Govt. Authorities
for executing various project
agreements.
Tanzania Identifying opportunities for
mining and setting up agri
projects
MOUs signed with Govt. authorities
Land identified and is under
allocation by the Government
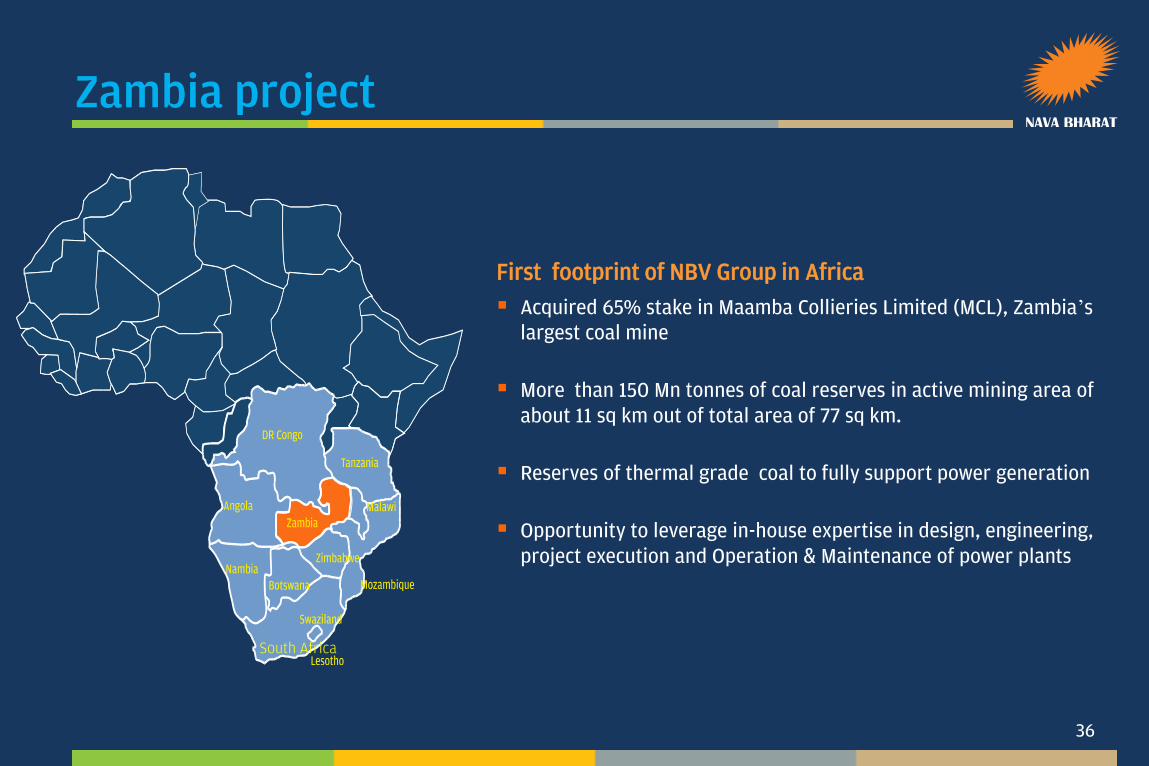
Zambia project
First footprint of NBV Group in Africa
Acquired 65% stake in Maamba Collieries Limited (MCL), Zambia’s largest coal mine
More than 150 Mn tonnes of coal reserves in active mining area of about 11 sq km out of total area of 77 sq km.
Reserves of thermal grade coal to fully support power generation
Opportunity to leverage in-house expertise in design, engineering, project execution and Operation & Maintenance of power plants
36
South Africa
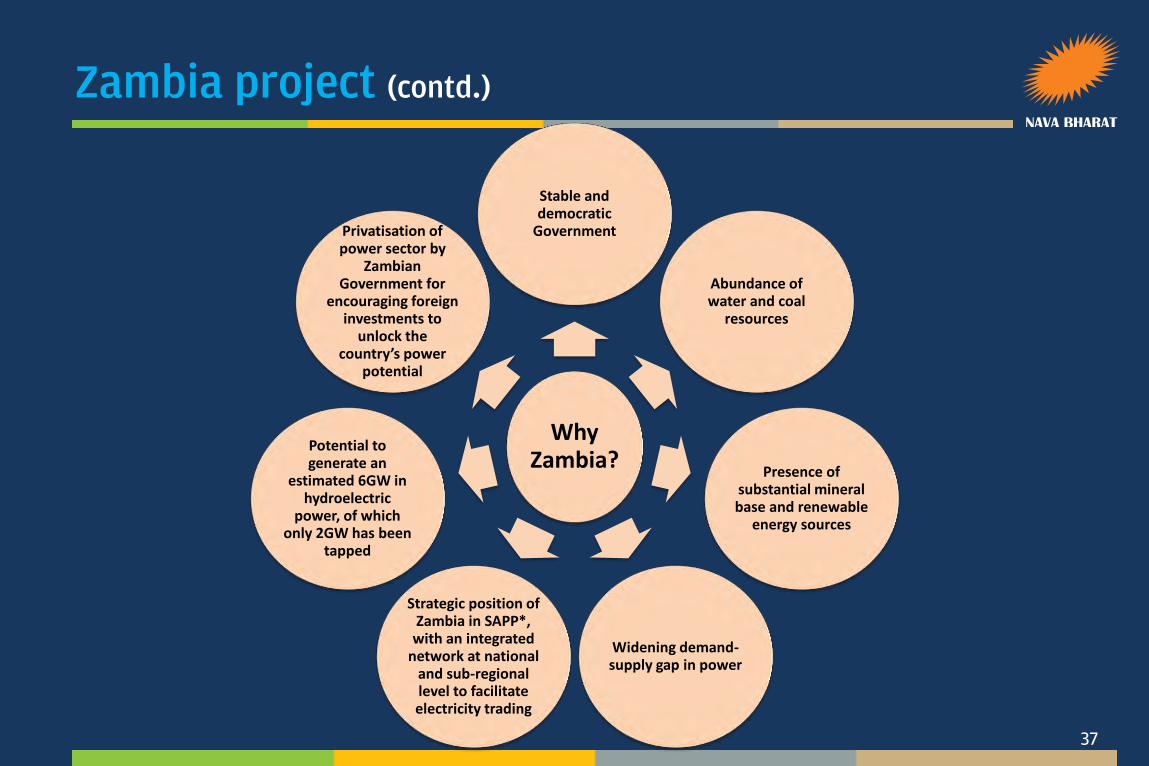
Zambia project (contd.)
37
Why Zambia?
Stable and democratic
Government
Abundance of water and coal
resources
Presence of substantial mineral base and renewable
energy sources
Widening demand-supply gap in power
Strategic position of Zambia in SAPP*,
with an integrated network at national
and sub-regional level to facilitate electricity trading
Potential to generate an
estimated 6GW in hydroelectric
power, of which only 2GW has been
tapped
Privatisation of power sector by
Zambian Government for
encouraging foreign investments to
unlock the country’s power
potential
Overseas Projects - Zambia
38
Objectives
Revival of coal mining activity at Maamba coal mine with scientific, efficient and environment friendly operations.
o Investment of about US$ 100 million including mine development expenditure
Establishment of mine-mouth, coal fired, eco friendly power plant, using thermal grade coal and rejects as fuel.
o Investment of about US$ 700 million for 300 MW including 330 kV DC Transmission system ( 48 Kms) and Intake Water System ( 28 Kms)
Socio economic development through CSR initiatives
Overseas Projects - Coal Mining, Zambia
39
Coal Mining operations at Maamba
A modular state-of-the-art Coal Handling and Processing Plant (CHPP) commissioned in May 2012
Detailed mining plan in the active mining area prepared
Current sale volume of high grade coal ranges from 20000 to 30000 MT per month which is likely to spurt with addition of new customers from FY 2016 onwards
Coal mining and haulage are being outsourced to cater to extraction of high grade coal and thermal grade coal
Overseas Projects - Coal Mining, Zambia
40
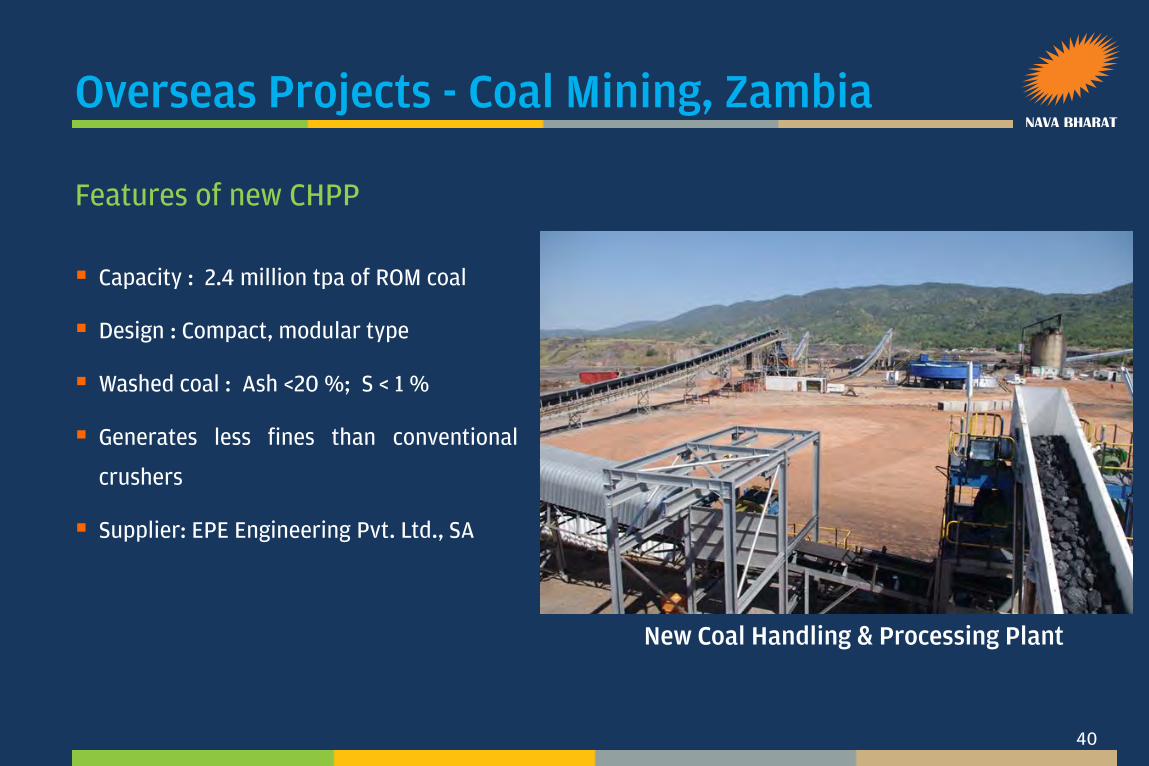
New Coal Handling & Processing Plant
Features of new CHPP
Capacity : 2.4 million tpa of ROM coal
Design : Compact, modular type
Washed coal : Ash <20 %; S < 1 %
Generates less fines than conventional
crushers
Supplier: EPE Engineering Pvt. Ltd., SA
Overseas Projects - Coal Mining, Zambia
41
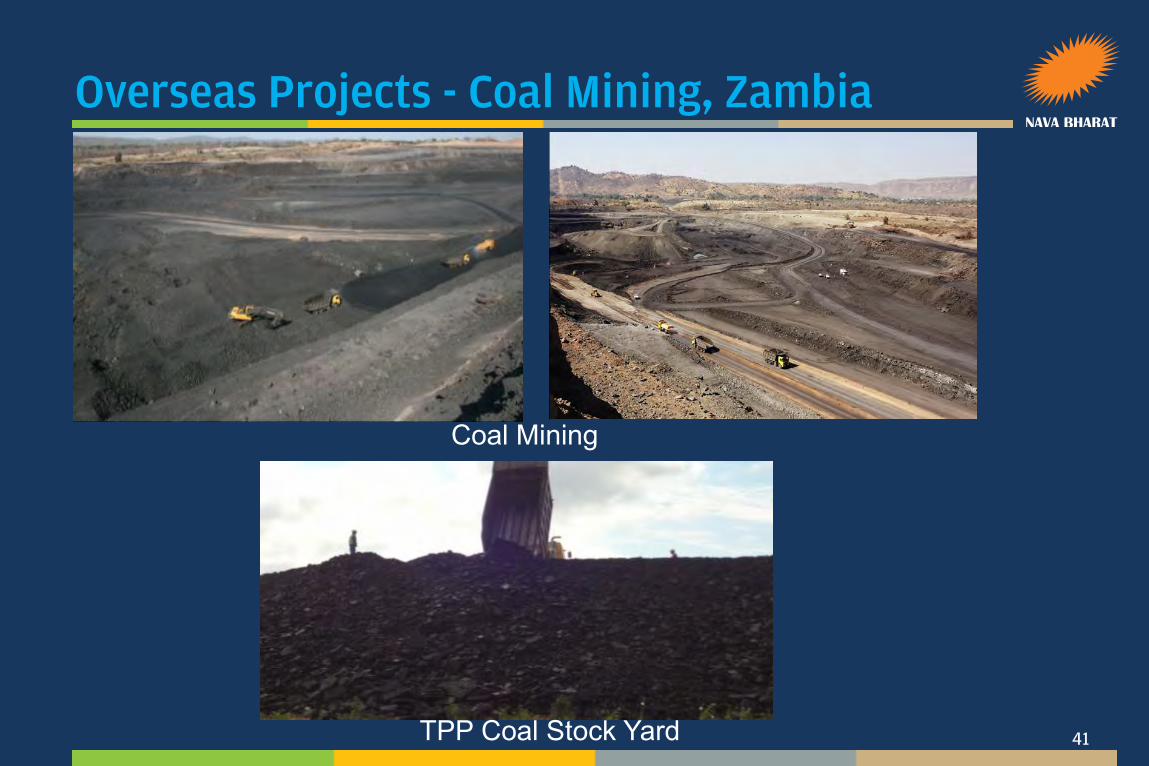
Coal Mining
TPP Coal Stock Yard
Overseas Projects - Power Project, Zambia
42
Key factors in support of Coal Fired Power project by Maamba Collieries Ltd.
Energy Security to Zambia : Meets base load requirements of the Grid.
Latent Demand : Opportunity to export power to
Southern African Power Pool (SAPP) countries
Overseas Projects - Power Project, Zambia
43
Status of Power Project at Maamba
Following key activities have been completed till date:
o Development & Connection Agreement with ZESCO for 330 kV DC Transmission line
o Power Purchase Agreement with ZESCO for 300 MW
o Implementation Agreement for 300 MW Power Plant
o Transmission Agreement with ZESCO for 300 MW
o Environmental clearance has been received
Financial closure on non-recourse basis is expected to be completed in 2014. Total loan component is US$ 560 Million and sanctions have been received/underway
About 65% of project work, onshore and offshore has been completed with Sponsors’ Equity, Bridge Finance and extended Suppliers Credit by SEPCO, the EPC Contractor
Commissioning is scheduled in Q3 of FY 2016 , delayed on account of delay in Financial Closure

Current Status – Power Project
44
Overview of TG Building, Boiler and Chimney Erection of ESP
Deareator Cooling Water Pump House
Current Status – Power Project
45
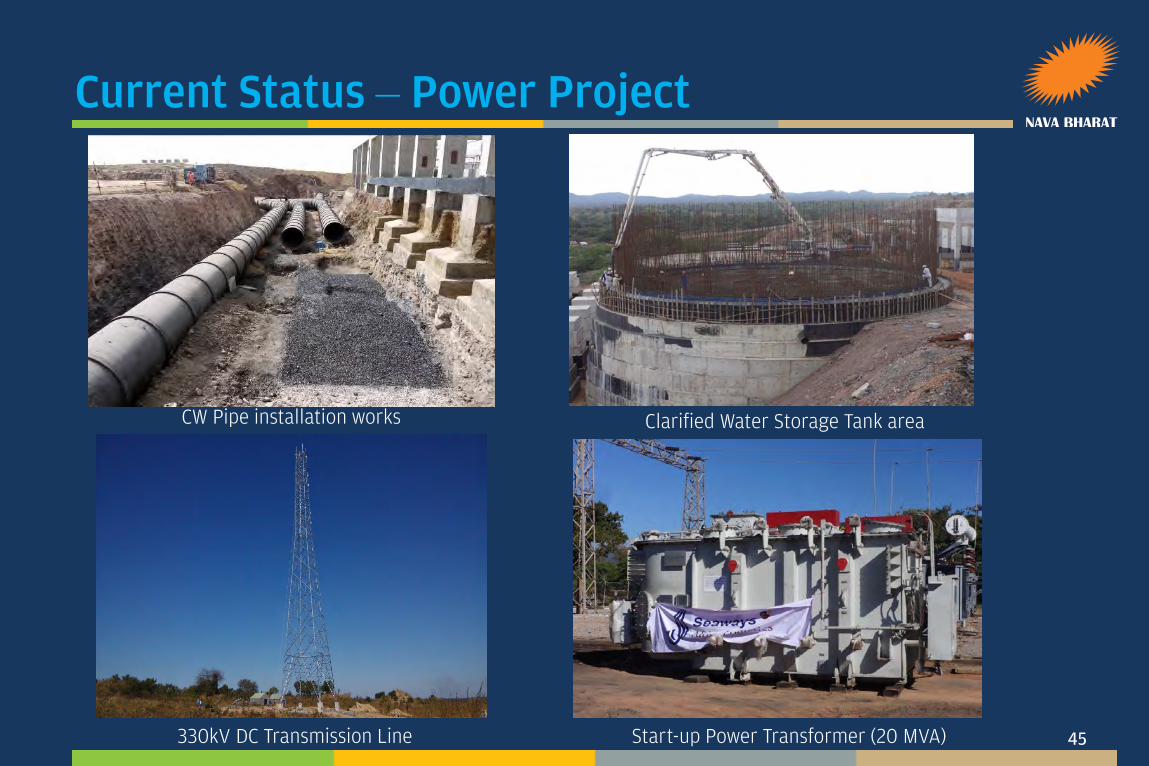
CW Pipe installation works Clarified Water Storage Tank area
330kV DC Transmission Line Start-up Power Transformer (20 MVA)
Laos Hydro power project under Development
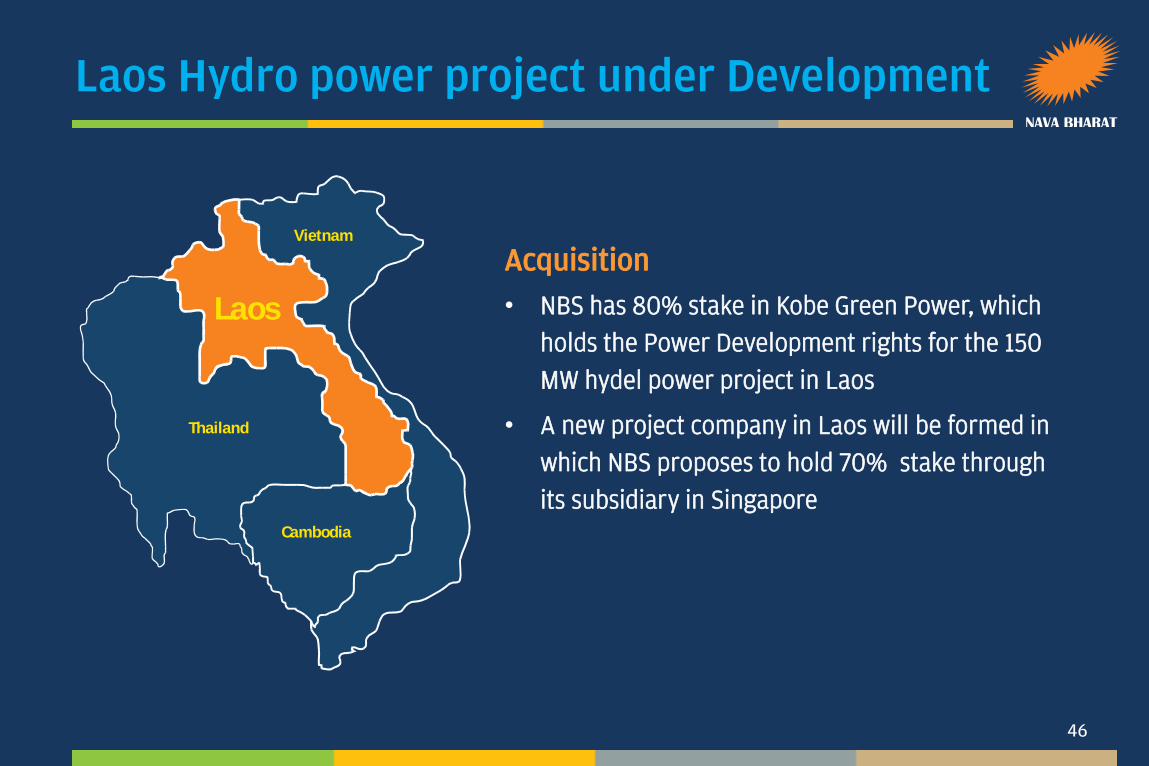
Acquisition
• NBS has 80% stake in Kobe Green Power, which
holds the Power Development rights for the 150
MW hydel power project in Laos
• A new project company in Laos will be formed in
which NBS proposes to hold 70% stake through
its subsidiary in Singapore
46
Laos
Thailand
Cambodia
Vietnam
Laos project
Key features
Power demand outstripping supply in neighbouring countries (Thailand, Vietnam and Cambodia)
Potential of hydro-electric power generation: 23,000 MW
Power Purchase Agreement for 13,500 MW signed between the Government of Laos and Thailand, Vietnam & Cambodia
Attractive tax incentives and long concession period of 25 years , post construction
47
Laos project
Current status
Share Holders’ Agreement has been signed denoting 70% stake to a subsidiary of NBS while the balance 30% stake to KGP & EDL(Power Utility) in the Hudel Project Company to be formed in Laos
Tariff has been agreed with the Power Utility and MOU has been signed.
Government approved the Concession Agreement to be entered in to by the Project Company on BOOT basis
PPA with the Power Utility , EDL and selection of EPC contractors are being pursued
Construction period: 4 years after executing all the above agreements
Expected investment is around US$ 235 million
48
Commercial Agro Projects in Tanzania
Current status
Projects under tie ups with Government Agencies
Identification of land area of approximately 10,000 Ha has been done in consultation with the Government agency. 4000 Ha of land is being allocated by the Government in the first phase.
Oil palm project is to be developed , subject to feasibility test through a Pilot project
Investments will be committed from FY 2016 subject to the outcome of the Pilot Project
49
REGISTERED OFFICE
Nava Bharat Ventures Limited
Nava Bharat Chambers, Raj Bhavan Road, HYDERABAD - 500 082, India.
Phone : +91 40 23403501 / 23403540, Fax :+91 40 23403013
E-mail : [email protected], website : www.nbventures.com
INTERNATIONAL OFFICE
Nava Bharat (Singapore) Pte Limited
120 Lower Delta Road, #05-14, Cendex Centre, SINGAPORE 169208
Phone: + 65 6278 8996, Fax: + 65 6278 7116
50
CORPORATE OFFICE
Nava Bharat Ventures Limited
Silicon House, Road No.14, Banjara Hills, HYDERABAD - 500 034, India.
Phone : +91 40 23607930 /31/32 , Fax :+91 40 23607923
E-mail : [email protected], website : www.nbventures.com
Thank you