naval postgraduate · pdf filenaval postgraduate school monterey, ca 93943-5000 8. ......
TRANSCRIPT
NAVAL POSTGRADUATE
SCHOOL
MONTEREY, CALIFORNIA
MBA PROFESSIONAL REPORT
Process Improvement and Information Technology Illustrated through the Naval Aviation Production Process
Improvement (NAPPI) and the Flight Hour (FHP)/ Flight Hour Other (FO) Programs
By: William M. Emmel December 2004
Advisors: Lawrence R. Jones
Glenn R. Cook
Approved for public release; distribution is unlimited.

THIS PAGE INTENTIONALLY LEFT BLANK

i
REPORT DOCUMENTATION PAGE Form Approved OMB No. 0704-0188 Public reporting burden for this collection of information is estimated to average 1 hour per response, including the time for reviewing instruction, searching existing data sources, gathering and maintaining the data needed, and completing and reviewing the collection of information. Send comments regarding this burden estimate or any other aspect of this collection of information, including suggestions for reducing this burden, to Washington headquarters Services, Directorate for Information Operations and Reports, 1215 Jefferson Davis Highway, Suite 1204, Arlington, VA 22202-4302, and to the Office of Management and Budget, Paperwork Reduction Project (0704-0188) Washington DC 20503. 1. AGENCY USE ONLY (Leave blank)
2. REPORT DATE December 2004
3. REPORT TYPE AND DATES COVERED MBA Professional Report
4. TITLE AND SUBTITLE: Process Improvement and Information Technology Illustrated through the Naval Aviation Production Process Improvement (NAPPI) and the Flight Hour (FHP)/ Flight Hour Other (FO) Programs 6. AUTHOR(S) William M. Emmel
5. FUNDING NUMBERS
7. PERFORMING ORGANIZATION NAME(S) AND ADDRESS(ES) Naval Postgraduate School Monterey, CA 93943-5000
8. PERFORMING ORGANIZATION REPORT NUMBER
9. SPONSORING / MONITORING AGENCY NAME(S) AND ADDRESS(ES) N/A
10. SPONSORING / MONITORING AGENCY REPORT NUMBER
11. SUPPLEMENTARY NOTES: The views expressed in this report are those of the author(s) and do not reflect the official policy or position of the Department of Defense or the U.S. Government. 12a. DISTRIBUTION / AVAILABILITY STATEMENT Approved for public release; distribution unlimited
12b. DISTRIBUTION CODE
13. ABSTRACT (maximum 200 words) Proper execution of appropriated funds is critical if the Navy hopes to maximize the optimization of their limited resources. The Navy’s Flight Hour (FHP) and Flight hour Other (FO) programs are no exception. These programs are being managed by good people, utilizing inefficient and out dated practices that do not adequately take advantage of the many Process Change and Information Technology resources currently available in today’s Navy. This project report will highlight the need for change in the FHP/FO budget management process, discuss successful process change efforts within the Navy, demonstrate the functionality of change in the FHP/FO management process through information technology, and provide a roadmap to a solution that is in alignment with the Navy’s goals outlined in Naval Power 21…A Naval Vision. Process Change using Information Technology is a mandate in DoD. Information Technology can be the enabler to PC that allows more effective and efficient use of the Navy’s most powerful resource - its people.
15. NUMBER OF PAGES
103
14. SUBJECT TERMS Process Improvement, Engineering, Reengineering. Enterprise Resource Planning, Flight Hour Program, Flight Hour Other. Naval Aviation Production Improvement
16. PRICE CODE
17. SECURITY CLASSIFICATION OF REPORT
Unclassified
18. SECURITY CLASSIFICATION OF THIS PAGE
Unclassified
19. SECURITY CLASSIFICATION OF ABSTRACT
Unclassified
20. LIMITATION OF ABSTRACT
UL NSN 7540-01-280-5500 Standard Form 298 (Rev. 2-89) Prescribed by ANSI Std. 239-18

ii
THIS PAGE INTENTIONALLY LEFT BLANK

iii
Approved for public release; distribution unlimited
PROCESS IMPROVEMENT AND INFORMATION TECHNOLOGY ILLUSTRATED THROUGH THE NAVAL AVIATION PRODUCTION
PROCESS IMPROVEMENT (NAPPI) AND THE FLIGHT HOUR (FHP)/ FLIGHT HOUR OTHER (FO) PROGRAMS
William M. Emmel, Lieutenant Commander, United States Navy
Submitted in partial fulfillment of the requirements for the degree of
MASTER OF BUSINESS ADMINISTRATION
from the
NAVAL POSTGRADUATE SCHOOL December 2004
Authors: _____________________________________ William M. Emmel
Approved by: _____________________________________
Lawrence R. Jones, MBA Project Advisor _____________________________________ Glenn R. Cook, Second Reader _____________________________________ Douglas A. Brook, Dean
Graduate School of Business and Public Policy

iv
THIS PAGE INTENTIONALLY LEFT BLANK

v
PROCESS IMPROVEMENT AND INFORMATION TECHNOLOGY ILLUSTRATED THROUGH THE NAVAL AVIATION
PRODUCTION PROCESS IMPROVEMENT (NAPPI) AND THE FLIGHT HOUR (FHP)/ FLIGHT HOUR OTHER (FO)
PROGRAMS
ABSTRACT
Proper execution of appropriated funds is critical if the Navy hopes to maximize
the optimization of their limited resources. The Navy’s Flight Hour (FHP) and Flight
hour Other (FO) programs are no exception. These programs are being managed by good
people, utilizing inefficient and out dated practices that do not adequately take advantage
of the many Process Change and Information Technology resources currently available in
today’s Navy. This project report will highlight the need for change in the FHP/FO
budget management process, discuss successful process change efforts within the Navy,
demonstrate the functionality of change in the FHP/FO management process through
information technology, and provide a roadmap to a solution that is in alignment with the
Navy’s goals outlined in Naval Power 21…A Naval Vision. Process Change using
Information Technology is a mandate in DoD. Information Technology can be the
enabler to PC that allows more effective and efficient use of the Navy’s most powerful
resource - its people.

vi
THIS PAGE INTENTIONALLY LEFT BLANK
vii
TABLE OF CONTENTS
I. INTRODUCTION........................................................................................................1
II. DOD BUDGETING: RESOURCE ALLOCATION PROCESS (RAP).................3 A. PHASE I: PLANNING, PROGRAMMING AND BUDGETING AND
EXECUTION SYSTEM (PPBES)..................................................................3 1. Planning ................................................................................................8 2. Programming......................................................................................10 3. Budgeting ............................................................................................10
B. PHASE II: ENACTMENT............................................................................13 C. PHASE III: APPORTIONMENT ................................................................13 D. PHASE IV: EXECUTION ............................................................................14
III. FLYING HOUR PROGRAM (FHP) CASH MANAGEMENT AT COMMANDER NAVAL AIR FORCES PACIFIC (CNAP).................................17 A. INTRODUCTION..........................................................................................18 B. FINANCIAL BUDGET PROCESS .............................................................18 C. BUDGET ALLOCATION ............................................................................18
1. Primary Mission Readiness (PMR)..................................................19
IV. FLIGHT HOUR OTHER PROGRAM ...................................................................21 A. 1A1A MISSION AND OTHER FLIGHT OPERATIONS ........................21 B. 1A2A FLEET AIR TRAINING....................................................................22 C. 1C1C COMBAT COMMUNICATIONS.....................................................22
V. PROCESS CHANGE.................................................................................................25 A. INTRODUCTION..........................................................................................25 B. PROCESS IMPROVEMENT.......................................................................25 C. PROCESS ENGINEERING .........................................................................26 D. PROCESS REENGINEERING....................................................................26 E. NAVAL AVIATOR PRODUCTION PROCESS IMPROVEMENT
(NAPPI) CASE STUDY. A VIEW AS A USER.........................................26 1. Introduction........................................................................................26 2. Leading Organizational Change.......................................................27 3. Gaining Control of the Process (Harnessing Time to Train).........28 4. Corporate (Command) Culture and Performance .........................28 5. Measuring Effectiveness....................................................................30 6. Effectiveness vs. Efficiency................................................................30 7. Seeing is Believing; Believing is Seeing ............................................31
F. CNAP COMPTROLLER PROCESS ENGINEERING EXERCISE. A CONSULTANT VIEW..................................................................................31 1. Introduction........................................................................................31 2. Project Preliminary Findings............................................................32 3. Existing Process..................................................................................33 4. “As-Is” KVA Discussion....................................................................33 5. “To-Be” KVA Discussion ..................................................................35

viii
6. Our Solution “To-Be”/ Prototype Discussion..................................35 7. Project Final Considerations ............................................................37
G. KEY CONTRIBUTORS IN PROCESS IMPROVEMENT/ ENGINEERING/ REENGINEERING EFFORTS.....................................38 1. Committed Leadership......................................................................38 2. Clear Vision and a Plan of Action ....................................................38 3. Organizational-Wide Understanding...............................................39 4. A Sense of Urgency ............................................................................39 5. Understanding Obstacles to Change and Persistence in
Overcoming Them .............................................................................40 6. Performance Measurement and Willingness to Experiment .........40 7. Recognition of Successes and Extraordinary Efforts .....................40 8. Continuous Improvement .................................................................40
VI. ENTERPRISE RESOURCE PLANNING SYSTEM (ERP) .................................43 A. BACKGROUND ............................................................................................43
1. Materials Requirement Planning (MRP)/ Closed Loop MRP.......43 2. Materials Requirement Planning II (MRPII) .................................44 3. ERP/Internet-Based ERP..................................................................45
B. KEYS TO SUCCESS.....................................................................................47 1. Recognize Out of the Gate, it is About the People not the
Software ..............................................................................................47 2. Analyze and Formalize Your Own Business Best Practices
from the Enterprise Level, Down to the Customer Service Representative ....................................................................................47
3. Leadership Endorsement (or Enforcement) of “Best Practices” ..47 4. CRM Must Be a Consideration ........................................................48 5. Publish a Roadmap with Measurable Goals ...................................48
VII. ERP WITHIN THE DEPARTMENT OF THE NAVY .........................................49 A. ORIGIN OF NAVY ERP ..............................................................................49 B. CURRENT/LEGACY ERP SYSTEMS.......................................................50
1. CABRILLO (Navy Working Capital Fund Management “NWCF” Pilot Project)......................................................................50
2. NEMAIS (Navy Enterprise Maintenance Automated Information System) ..........................................................................52
3. SIGMA (Program Management)......................................................53 4. SMART (Supply Maintenance Aviation Re-engineering Team)...54
C. NAVY ERP CONVERGENCE ....................................................................55
VIII. CONCLUSION ..........................................................................................................57 A. CNAP COMPTROLLER STRATEGIC OBJECTIVES...........................57 B. ERP AS AN ALTERNATIVE SOLUTION AT CNAP..............................58 C. POTENTIAL BENEFITS OF ERP FOR CNAP ........................................58 D. RECOMMENDATIONS...............................................................................59
APPENDIX A. CNAP COMPTROLLER DEPARTMENT “AS-IS” PROCESS MAPS.......................................................................................................61

ix
APPENDIX B. CNAP COMPTROLLER DEPT. FUND STATUS REPORT (FSR) “AS-IS” PROCESS MAP...............................................................................67
APPENDIX C. CNAP COMPTROLLER DEPT. FUND STATUS REPORT (FSR) “TO-BE” PROCESS MAP ............................................................................69
APPENDIX D. DATABASE PROTOTYPE IMAGE VIEWS.................................71
LIST OF REFERENCES......................................................................................................83
INITIAL DISTRIBUTION LIST .........................................................................................87

x
THIS PAGE INTENTIONALLY LEFT BLANK
xi
LIST OF FIGURES
Figure 1 Revised Navy PPBES Process (From: Jones, 2003, P. 126) .............................4 Figure 2 Phases and Outputs of PPBS (From: Keating, 1998, P. 19) ..............................8 Figure 3 PPBS Planning Process (From: Keating, 1998, P. 15) ....................................10 Figure 4 Resource Allocation Process (From: UNK, 2003, P. 64) ................................13 Figure 5 Resource Allocation Process – Overlap (From: UNK, 2003, P. 69) ...............14 Figure 6 DoD FHP Financial Organizational and Resource Allocation Flow (From:
Keating, 1998, P. 28) .......................................................................................17 Figure 7 “As-Is” Knowledge Value Added Data (From: Team 3, 2003)......................34 Figure 8 To-Be Knowledge Value Added Data (From: Team 3, 2003).........................35 Figure 9 ERP Evolutionary Timeline (From: Jakovijevic, 2000, P. 8) ..........................43 Figure 10 Typical Commercial ERP Integration Diagram (From: Dougherty, 2001,
P. 5) ..................................................................................................................46 Figure 11 Legacy/Convergence Transition Funding Plan (From: Stone, 2004, P. 11)....56 Figure 12 Legacy/Convergence Transition Timeline (From: Stone, 2004, P. 6).............56

xii
THIS PAGE INTENTIONALLY LEFT BLANK

xiii
ACKNOWLEDGEMENTS
This project report was written with the assistance of Commander Naval Air Pacific
Deputy Comptroller and his staff (particularly Sal Rosas), and my Project Team during IS
4220. I would like to thank my project report proof readers (Nita Maniego and Nancy
Sharrock) and say a special thanks to Professor Larry Jones and Mr. Glenn Cook for their
quick turnaround, steadfast support, dedication, and mentorship throughout this project
process. Lastly, I would like to thank my wife Janet and my son Jacob. Without their
sacrifice and understanding, the successful conclusion of my MBA journey would not
have bee possible.

xiv
THIS PAGE INTENTIONALLY LEFT BLANK

1
I. INTRODUCTION
The purpose of this project report is to educate, and provide a basic overview the
current budgetary financial reporting practices within Commander Naval Air Pacific as it
pertains to the Flight Hour Program (FHP) and Flight hour Other (FO) program and
explore how to improve the budget/costs estimation and execution process. Proper
execution of appropriated funds is critical if the Navy hopes to maximize the
optimization of their limited resources. Today Commander Naval Air Forces faces many
challenges in leading our Naval Air Force in the war on terror. Facing the same
budgetary uncertainty issues year after year should not be one of them. Budget/cost
estimations are in need of an overhaul. It must be overhauled to stop the vicious cycle of
under funding and “buy back” (due to withholds, reprogramming, and/or bow-waving) of
what should have been the previous years over obligations.
The project report introduces the DoD budget process, the Flight Hour program
(FHP), Flight Hour Other (FO) program, and there budget and execution processes. It
introduces Process Engineering and viable information technology solutions (web
enabled Database and Enterprise Resource Planning (ERP) systems) as tools that could
be used in an effort to overhaul budget requirement, allocation, and managing process. I
led a team on an exercise in process improvement in a class (IS-4220) in which the focus
was process improvement with information technology. The excerpts from our findings
and recommendations are compelling regarding the need for change within the CNAP
comptroller’s office. Lastly, the project report will close with the suggestion of the need
for a template or roadmap as to the feasibility weather process improvement through
information technology is a viable solution in the management of the budget process.

2
THIS PAGE INTENTIONALLY LEFT BLANK

3
II. DoD BUDGETING: RESOURCE ALLOCATION PROCESS (RAP)
Resource allocation is the process in which financial resources are made available
to all federal agencies. Knowledge of this process provides a foundation from which
Navy Flight Hour Program Managers can begin to understand the many challenges faced
in “resourcing” the program, as well as to help identify some of the inherent problems in
the RAP. Resources for all activities in the Department of Defense whether weapons,
personnel, or infrastructure and maintenance, are provided through the RAP. There are
four phases of the RAP:
Phases I: Planning, Programming, and Budgeting and Execution System (PPBES)
Phase II: Enactment
Phase III: Apportionment
Phase IV: Execution
A. PHASE I: PLANNING, PROGRAMMING AND BUDGETING AND EXECUTION SYSTEM (PPBES)
The PPBES is the process that ultimately produces the DoD portion of the
President’s Budget. The process originally introduced to DoD in 1962 by Secretary of
Defense Robert McNamara and last modified by Donald Rumsfeld in 2003 provides a
formal and systematic framework designed to assist the Secretary of Defense in making
policy and strategy decisions, and the development of forces and capabilities to
accomplish required missions. The objective of PPBES is to translate national security
interests into military missions and construct budgetary requirements to be presented to
Congress for funding consideration. This action attempts to outfit military operational
commanders with the “best” mix of equipment, forces and support, within the confines of
limited resources available. A model depicting PPBES is shown below:

Figure 1 Revised Navy PPBES Process (From: Jones, 2003, P. 126)
PPBS was renamed in 2003 as the PPBES process with the added E for execution.
The major changes were intended to provide military departments and services greater
flexibility to:
1. Respond effectively to changing threats, and
2. The ability to move resources more rapidly, and
3. To put new weapons systems in the field more quickly.
In 2003 under SECDEF Donald Rumsfeld, significant changes were made to the PPBS
system. It was renamed the Planning, Programming, Budgeting, and Execution System
(PPBES). While basic structure of the PPBS remained unaltered, it was changed in three
important ways. First, the reform merged separate programming and budget review into a
single review cycle. Second, it incorporated a biennial budget process. Third, it changed
4

5
the cycle for OSD provision of the top level planning information to the military
departments and services. (Jones, 2003)
It is important to note the general acceptance of the changes to the PPBS. The
PPBES cycle timing changes were sensible given that new administrations rarely have
the people in place or the insights necessary to put programs in place and prepare budget
initiatives in the early days of an administration. Thus, designating the First year for
review of national security strategy and the work on the Quadrennial Defense Review
(QDR) sets the scene for a complete budget build in the second year. Designating the off
years as years of minimal change, but allowing mechanisms for changes that do need to
be made separately in program change proposals and budget change proposals, also
seems sensible and should cut down the turmoil involved in a complete POM-Budget
rebuild each year. (Jones, 2003)
The last changes to the PPBES in 2003 led to reform that ordered DoD to move
from an annual program objective memorandum and Budget Estimate Submission (BES)
cycle to a biennial (2-year) cycle, beginning with an abbreviated review and amendment
cycle for FY2005. Under the revised process, DoD will formulate 2-year budgets and use
the off year to focus on fiscal execution and program performance. The 2-year
programming and budgeting cycle is designed to guide DoD strategy development,
identification of needs for military capabilities, program planning, resource estimation
and allocation, acquisition, and other decision processes. This change was intended to
more closely align the DoD internal PPBES cycle with external requirements embedded
in statute and administration policy, including the QDR as amended. (Jones, 2003, 132)
Under the new system, the QDR is intended to continue to serve as the major
DoD statement of defense strategy and policy. This distinction is noteworthy as it
reflects the revolution in business affairs initiative undertaken in DoD in the late 1990s
and continued into the new millennium. And, from the OSD perspective, the QDR also
constitutes the single link throughout DoD to integrate and influence all internal decision
processes, for example, preparation of the FYDP and DPG. Section 922 of Public Law
107-314, the “Bob Stump National Defense Authorization Act for Fiscal Year 2003,”
amended section 118 of Title 10 of the United States Code to align the QDR submission

6
date with that of the President's budget in the second year of an administration, as noted
earlier. As a result of the 2003 process modification, the off-year defense planning
guidance (DPG) will be issued at the discretion of the Secretary of Defense. The off-year
DPG will no longer introduce major changes to the defense program, except as
specifically directed by the DoD Secretary or Deputy Secretary of Defense. As noted
previously in this chapter, DoD announced that no DPG would be issued in 2003 for
FY2005. (Jones, 2003, P. 133)
In addition, rather than preparing the POM during the off year, according to the
reform, DoD will use program change proposals to accommodate real world changes, and
as part of the continuing need to align the defense program with the defense strategy.
DoD will use budget change proposals (BCPs) instead of a budget estimate submission
(BES) during the off year. BCPs will accommodate fact-of-life changes including cost
increases, schedule delays, management reform savings, and workload changes as well as
changes resulting from Congressional action. The FY2005 execution reviews will
provide opportunity to make assessments of current and previous resource allocations and
evaluate the extent to which DoD had achieved its planned performance goals.
Performance metrics, including the OMB program assessment rating tool (PART) used in
the Bush administration in the 2000s may provide the analytical underpinning to ascertain
whether an appropriate allocation of resources exists in current budgets. To the extent
performance goals of an existing program are not being met, recommendations may be
made to replace that program with alternative solutions or to make appropriate funding
adjustments to correct resource imbalances. This reform demonstrates how DoD will
comply with the requirements of the Government Performance and Results Act of 1993
as enforced by OMB. PART ratings and transmission of the QDR to Congress are
intended to satisfy GPRA requirements for DoD.
It is important to point out that in the past and presently, input to program and
budget decisions in DoD is provided by the Deputy Secretary of Defense and staff, the
position in DoD that bears a large part of the responsibility for actually attempting to
manage the DoD. In addition, the Under Secretary Comptroller, the Under Secretary for
Acquisition, Transportation, and Logistics, and Assistant Secretaries for other OSD

7
functional areas including program analysis and evaluation, policy, force management
and personnel, legislative affairs, health, reserve affairs, and others, all provide views and
analyses to guide program and budget decision-making.
The PPBS assesses U.S. security threats, develops a strategic plan to address
threats and develops requirements to support that strategy. Requirements are then
translated into specific DoD programs developed to execute that strategy and ultimately
create budgets to deliver program funding. The PPBS consists of three phases to achieve
its objective. They are: 1) The Planning Phase, 2) The Programming Phase, and 3) The
Budgeting Phase. Planning addresses the capabilities required to carry out the U.S.
national military security strategy and the resources available for defense. Programming
translates the results of DoD planning into a logical six-year defense program within
available resources. Budgeting converts the program into the congressional appropriation
structure, focusing on building justifiable budgets while ensuring compliance with high
level guidance from the President and Office of Management and Budget (OMB).
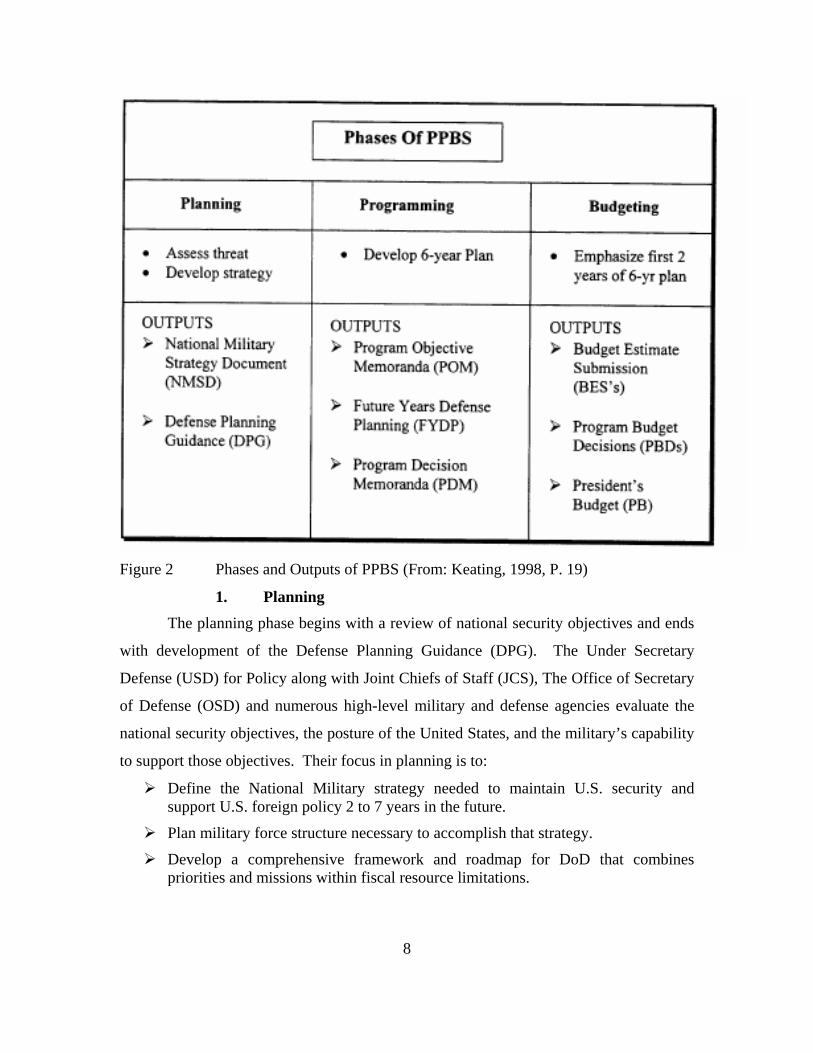
Figure 2 Phases and Outputs of PPBS (From: Keating, 1998, P. 19)
1. Planning The planning phase begins with a review of national security objectives and ends
with development of the Defense Planning Guidance (DPG). The Under Secretary
Defense (USD) for Policy along with Joint Chiefs of Staff (JCS), The Office of Secretary
of Defense (OSD) and numerous high-level military and defense agencies evaluate the
national security objectives, the posture of the United States, and the military’s capability
to support those objectives. Their focus in planning is to:
Define the National Military strategy needed to maintain U.S. security and support U.S. foreign policy 2 to 7 years in the future.
Plan military force structure necessary to accomplish that strategy.
Develop a comprehensive framework and roadmap for DoD that combines priorities and missions within fiscal resource limitations.
8

9
Provide decision options to the Secretary of Defense (SECDEF) to help him assess the role of national defense in the formulation of national security policy and related decisions.
The output of the planning phase includes two documents, the National Military
Strategy Document (NMSD) and the DPG. The NMSD builds on the President’s security
objectives, identifies strategy, provides advice to the President, and is the input basis for
the DPG. It is important to note that the NMSD is not fiscally constrained.
After a series of reviews is completed, a draft DPG is published and the unified
force commanders are given the opportunity to provide inputs and recommendations.
This provides each of the services with a flavor of the strategic priorities and their roles in
future years. The DPG is the first output document in the planning process that is fiscally
constrained and guides the services in developing their programs for a six-year period. As
explained by McCaffery and Jones, “The Guidance indicates annularly the assets, forces,
and other resources needed to satisfy U.S. security objectives.” The DPG provides the
basis for subsequent service - branch and OSD programming and budgeting” (Jones,
2003, P. 108) when finalized, the DPG is signed by the SECDEF, which indicates the
planning process is completed and the programming phase begins. Figure 3 shows an
overview of the Planning process.(Keating, 1998, P. 15)

Figure 3 PPBS Planning Process (From: Keating, 1998, P. 15)
2. Programming PPBS brings together long-term strategic planning with the programming process.
The programming process is the procedure for distributing available resources equitably
across many competing DoD programs (Keating, 1998, P. 15). Programming translates
planning efforts into a 6-year fiscal program for forces, manpower, and material.
Programming begins with the issuance of the draft DPG in the beginning of the budget
cycle, and ends with the submission of each service’s Program Objectives Memorandum
(POM) to OSD, in mid-summer. The POM is each communities and ultimately, services
plan laying out the resources needed to their tasking (programs and missions) over the
next six years. Every two years during the even years, the POM is updated to reflect: 1)
new missions, 2) new objectives, 3) alternative solutions, 4) allocation of the resources,
5) ongoing DoD activities and 6) the forecasted costs of each program. For the Navy, the
POM is the SECNAV’s recommendation to the SECDEF on the best use of the assets and
resources allocated to the Navy. (Keating, 1998, P. 15)
3. Budgeting The final phase of the PPBS process is the budgeting phase. The purpose of the
budgeting phase is to allocate dollars to the DoD programs approved in the PPBS
10

11
framework. PPBS budget formulation as pointed out by Jones and Bixler has five
elements: 1) issuing budget preparation guidance, 2) estimating specific program costs, 3)
holding hearings to justify budget submissions, 4) ensuring submissions adhere to “both
policy and financial guidelines”, and finally, 5) the series of negotiations that take place
to achieve the requested amount of program dollars projected to be available for the next
two fiscal years and four out years (Keating, 1998, P. 16) Formulation begins when
OMB issues Circular A-11 to all federal agencies. The A-11 provides general guidelines,
instructions and schedules for budget submission (Keating, 1998, P. 16). When DoD
receives the A-11, each service formulates its own policy guidance document, which
provides more detailed budgeting guidance. For the Navy, this is known as the Navy
Comptroller (NAVCOMPT) Notice 7111 and is issued by the Navy’s Office of Budget
(FMB). This notice provides Navy resource sponsors detailed budget formulation
guidance, forecasted inflation rates, deadlines for submission, and dollar limits for each
budget year (called “control numbers”). This signals the beginning of the budget process,
commonly known as the “budget call”. Upon receipt of this policy guidance, each
service constructs detailed budget estimate submissions (BESs) based on the Program
Decision Memoranda (PDM) and forwards their budget request in September to OSD.
These BESs are reviewed by each of the respective service’s financial managers (FM)
and are forwarded to the USD Comptroller for review and modification. Final decisions
on the respective services BESs are made via Program Budget Decisions (PBDs). Once
changes are made and approved, the BESs are then submitted as “the DoD budget” to the
Office of Management and Budget (OMB) for incorporation into the President’s Budget
(PB) for submission to Congress in February.
During the budget review process, cost estimates in the POM are updated with the
latest pricing information, funding shortfalls are addressed and budget exhibits are
prepared to justify dollar requirements. As the budget exhibits are submitted through the
chain of command, a formal review process is initiated. The review process includes
budget reviews held at FMB, followed by a review at OSD, and finally a joint
OSD/Office of Management and Budget (OMB) review. This joint review is done to
ensure the DoD budget supports the national security strategy. During the review

12
process, budget analysts hold hearings to review and carefully scrutinize each budget line
item submitted. The analysts can take three courses of action: 1) approve exhibits as
presented, 2) disapprove portions of exhibits by issuing a “mark” or 3) approve additional
funds where shortfalls are detected. In the current budget environment, “marks” are by
far the most common budget review actions taken within DoD. If an item is marked, the
sponsor of the budget is given 48-72 hours to question the marks by submitting a
“reclama”. No’s Reclamas are detailed appeals to the marks made by the budget analyst
and explain the impact of any invalid assumptions made by the analysts. If no’s reclamas
are approved, the marks are removed. If not, the marks “stand” and the budgeted line
item is reduced. Naturally, this process is somewhat subjective and it is important to note
that budget analysts represent part of the checks and balance mechanism within the
budget process. Their role and job is to apply DoD and congressional resource policy
guidance to the various budget requests submitted. Since the budgeting environment is
constrained by the availability of limited resources, budget analysts are tasked to ensure
budget authority is provided to the most needed and defensible programs (Keating, 1998,
P. 17).

B. PHASE II: ENACTMENT
Figure 4 Resource Allocation Process (From: UNK, 2003, P. 64)
Enactment is the process in which Congress reviews the President's Budget,
conducts hearings and passes legislation. The process begins when the President submits
the annual budget to Congress in February and is concluded when the President signs the
Annual Authorization and Appropriation bills normally prior to October Authorization
legislation validates each of the Federal agencies programs and operations and specifies
the maximum funding amount to be made available. The appropriations process creates
the budget authority, which permits each federal agency to incur obligations throughout
the year (UNK, 2003, P. 68).
C. PHASE III: APPORTIONMENT After the President signs the authorization and appropriation legislation into law,
funds are made available for DoD and other federal agencies. Apportionment occurs
when OMB provides the funds to the agencies. Funds are distributed throughout DoD
13

from the USD Comptroller to each service's comptroller and ultimately to the end user
(Keating, 1998, P. 20)
D. PHASE IV: EXECUTION Execution consists of first gaining permission to spend, appropriations through
the allotment process. DoD will show congress how it intends to spend the money during
the allotment process. Subsequently, execution occurs when appropriated funds are
obligated and spent (outlayed) by the authorized agencies. An obligation is a legal
commitment to provide funds to pay for services, weapons systems, or the awarding of
contracts. Expending funds occurs when the “check” is written and cashed. Outlay
(transfer) occur when government checks are cashed and the US. Treasury makes a
payment. (UNK, 2003, P. 68)
Figure 5 Resource Allocation Process – Overlap (From: UNK, 2003, P. 69)
14

15
Execution is a critical part of the new PPBES. The new process provides OSD a
greater opportunity to examine and critique the budget execution decisions of its military
services. A recent twist to the budget execution review was a change initiated by the
Bush administration in February of 2003 directing the DoD Comptroller to implement a
“performance-based budgeting” that focuses on costs of achieving outcomes rather than
the details of program administration and production (Jones, 2003, P. 106)
This concludes the discussion of DoD’s budgeting process. The process is
complicated and not easily understood. Also, it is further complicated by the political
nature of congressional oversight and interest in management of DoD’s spending. It is
critical that program managers and acquisition specialists understand and are up to date
on the latest changes.

16
THIS PAGE INTENTIONALLY LEFT BLANK

III. FLYING HOUR PROGRAM (FHP) CASH MANAGEMENT AT COMMANDER NAVAL AIR FORCES PACIFIC (CNAP)
Figure 6 DoD FHP Financial Organizational and Resource Allocation Flow (From: Keating, 1998, P. 28)
17

18
A. INTRODUCTION The FHP represents more than 3.2 billion of the Navy’s FY2000 O&M, N
appropriation. Stringent budgets and limited resources have left program managers with
difficult decisions in budget execution, attempting to satisfy operational requirements
with scarce dollars. There are two main chain of commands exist regarding the FHP
program. The operational chain (depicted below) gives direction for the daily mission
tasking for all Navy and Marine Corps aircraft. The chain illustrates the flow of authority
from the President to the squadron commander. Organizations within the operational
chain provide input for consideration in budget formulation, but have a minimal role in
formal budget development.
B. FINANCIAL BUDGET PROCESS The financial chain (depicted below) illustrates the flow of the FHP budget
process. The primary FHP budget exhibit is the Operational Plan 20 (OP-20). N78
constructs the necessary FHP budget exhibits and works closely throughout the year with
the Major Claimants (like CINCPACFLT, CNAP). The major claimants ensure ensures
necessary budget inputs are received along with the appropriate justification. The chart
also displays the aforementioned budget inputs in relation to the financial organization.
The three input mechanisms used at the squadron, air station, and N-78F levels are:
1. Budget OPTAR Report (BOR),
2. Flight Hour Cost Report (FHCR),
3. and the Operation Plan (OP-20).
The BOR and FHCR are the primary financial management inputs used at CNAP
to administer and track FHP obligations during the fiscal year. These reports collectively
form the data used by N-78F to build the new OP-20 Budget exhibits. CNAP has 2
primary roles in the budget formulation process. 1) collecting and reporting FHP
execution data , 2) developing FHP program and budget submissions. (Jones, 2001, P.
426)
C. BUDGET ALLOCATION CNAP is the focal point for allocating, executing and monitoring flight hour
funding for all Navy and Marine Corps Pacific fleet squadrons. Their primary goal and
responsibility during allocation and execution is to achieve a specific level of readiness

19
for each squadron within the constraints of the resources available. (Jones, 2001, P. 426)
At the start of the new Fiscal Year (FY), the FMB distributes quarterly Operating Budget
(OB) allocations of the approved FHP funding to CNAP. In theory, the FHP OB should
provide the necessary dollars to execute CNAP’s flying mission. However this is never
the case, with restricted DoD budgets and competing priorities financial resources are
scarce. CNAP is challenged with distributing limited funds using their primary tool the
OP-20. The OP-20 serves as a budgeting formulation document and an execution-
monitoring tool. During budgeting , the OP-20 displays funding requirements by aircraft
type, model, series (T/M/S) and the OP-20 also becomes the Navy’s primary budget
exhibit tool displaying the FHP funding requirements during submission and review, to
OSD and OMB.
1. Primary Mission Readiness (PMR) PMR serves as a subjective means to distribute a limited number of flight hour
funds among the various activities. PMR is currently maintained at a Navy wide rate of
83% plus 2% of the flying hours-per-formed in aircraft simulators. (Jones, 2001, P. 427)
To assist in the allocation of funds to the fleet, the OP-20 is separated into three
schedules to reflect different mission areas:
Sched Mission Definition
A TACAIR/ASW Carrier Air Wings, Marine air wings, land and sea-based units committed to combat operations funded at 83% PMR. This category constitutes the bulk of the Navy/Marine Corps aviation warfighting capability, which primarily consists of those squadrons capable of executing the “joint strike” and “crises response” missions in support of the National Military Strategy. (1A1A fund code)
B FLEET AIR TRAINING (FAT)
This category (also referred to as Fleet Replacement Squadrons (FRS), consists of squadrons that train pilots and navigators prior to joining TACAIR/ASW and Fleet Air Support units. These squadrons are dedicated to training fleet aircrews in each particular type aircraft and funded at 100% student throughput. (1A2A fund code)
C FLEET AIR SUPPORT (FAS)
The primary mission of these squadrons is to provide direct and indirect support (including logistics) to Navy and Marine Corps fleet operating units and shore installations. Their funding is based on Naval Center for Cost Analyses (NCCA) methodologies and historical execution. Common mission examples include Carrier-on-Board Delivery, and Search and Recovery (1A1A fund code)
(Jones, 2001, P. 427)

20
THIS PAGE INTENTIONALLY LEFT BLANK

21
IV. FLIGHT HOUR OTHER PROGRAM
FO costs are not included in the OP-20. These “other” costs represents outlays
for flight simulator operations, Fleet Replenishment Squadron operations, civilian labor,
administrative supplies, material, equipment, maintenance service contracts, and expense
for travel and lodging associated with pilot and crew Temporary Additional Duty (TAD).
(Keating, 1998) While most of the costs are considered essential to Naval Aviation, there
are no FHP resources programmed by N-88F. FO is a level of effort program and costs
are incorporated in the Major Claimants’ regular budget submission. The Air TYCOMs
provide input for the development of this budget, based on their forecasted requirements
for the FO category of funds (Last years spending + a predetermined Inflation Rate). FO
category has consistently been under funded and been a constant drain on the FHP dollars
as that funding gets reprogrammed to meet the FO shortfalls. Commander Naval Air
Forces Comptroller provided the following amplifying information regarding O&M,N
AGSAG fund code Descriptions that impact the Flight hour Other program:
A. 1A1A MISSION AND OTHER FLIGHT OPERATIONS Mission and Other Flight Operations includes all Navy and Marine Corps Tactical Air (TACAIR) and Anti-Submarine Warfare (ASW) forces, shore-based fleet air support, operational testing and evaluation, operation and maintenance of White House helicopters, and miscellaneous items such as transportation of squadron equipment, travel/TAD during deployment workup and training range support. Funding provides flying hours to maintain an adequate level of readiness enabling Navy and Marine Corps aviation forces to perform their primary mission as required in support of national objectives. Primary mission readiness (PMR) is expressed as a percentage and reflects the amount of hours that aircrews must fly to maintain adequate proficiency and perform the primary mission of a particular type-model-series (TMS) of aircraft including all weather day/night carrier operations and other assigned tasks. The requested funds buy 83% PMR plus two- percent simulator contribution totaling 85 percent PMR in FY 2001. This TACAIR/ASW level is considered the minimum acceptable level. To ensure readiness and pilot proficiency, deployed crews receive 110 percent PMR; crews in work-up receive 100 percent PMR, while non-deployed crews fly at reduced level. PMR executed in FY 1999 was 83%, and in FY 2000 and FY 2001 it is estimated to be 85%.

22
B. 1A2A FLEET AIR TRAINING Fleet Air Training includes Fleet Readiness Squadrons (FRS) which train replacement aircrews for each Navy and Marine Corps type/model/series in weapons tactics training, weapons delivery qualifications, carrier landing qualifications and provide services to fleet squadrons to develop and maintain air-to-air combat skills. These FRS are located throughout the country. Student levels are established by authorized TACAIR/ASW force level requirements, aircrew personnel rotation rates, and the student output from Undergraduate Pilot/NFO Training Program. Specialized schools include the Navy Test Pilot School and the Naval Strike and Air Warfare Center (NSAWC). Fleet Air Training also includes operations and maintenance of training devices and simulators. Management of the acquisition of training devices and simulators is also included.
C. 1C1C COMBAT COMMUNICATIONS Funding provides for communications systems which directly support fleet operations including Fleet Ballistic Missile Strategic and Airborne Communications to ensure survivable communications with deployed strategic forces. Airborne communication provides a percentage of airborne communication coverage for Fleet Command and Control as an integral part of national defense strategy and in support of worldwide retaliatory forces. Operations financed in this program include aircraft operating costs for fuel, organizational and intermediate maintenance, squadron supplies, aviation depot level repairables, contract flight crew training, and training sites. Commander, Pacific Fleet has resources for all Strategic Communications (STRATCOMM) operations. Current activity within this program provides synchronized low frequency spectrum communication coverage to deployed strategic forces. To provide this support, a mix of airborne and strip-alert coverage with aircraft utilizing foreign and domestic airfields is employed. STRATCOMM Wing One's primary mission is to provide connectivity between the National Command Authority (NCA) and the nation's nuclear forces as an element of the Strategic Connectivity System (SCS) and to maintain and operate facilities, provide services and material, and administrative control of support operations of strategic communications squadrons, and other operating forces and activities of the Navy as prescribed by higher authority. The Mobile Ashore Support Terminal (MAST) is a self-contained portable C41 system which can be rapidly deployed to provide an initial C41 capability for a Naval Component Commander (NCC) for a Naval Liaison Detachment operating ashore. The Mobile Integrated Command Facility (MICFAC) is a complete mobile command center designed to support the NCC in Joint Operations. MAST and MICFAC have replaced the old mission TAD. Additionally, the AN/MSQ-126 Tactical Command

23
System, also known as the Crash Out Package (COP), is a program funded in this budget line. Commander, U.S. Maritime Defense Zone Pacific (COMUSMARDEZPAC) is a Coast Guard activity that receives funding from CINCPACFLT for travel, transportation and other purchased services costs. COMUSMARDEZPAC is responsible to Fleet Commanders for planning and coordinating U.S. coastal and harbor defense. The Navy is responsible for peacetime financing of both supplies and equipment required to enable the U.S. Coast Guard to perform military functions upon incorporation into the Navy, or to prepare for such incorporation. Additional programs supported are Electronic Command and Control Systems including Anti-Submarine Warfare Operations Centers (ASWOCs), Operation Support System (OSS), Navy Tactical Command Systems Afloat (NTCSA), Global Command and Control System (GCCS), and Joint Maritime Command Information Systems (JMCIS) (ashore, tactical/mobile and afloat). The Follow-On Satellite Program supports the Fleet satellite constellation and provides reliable communication links among Navy forces with EHF, UHF and SHF capabilities. Finally, this budget line also includes funding for Arms Control implementation which provides inspection support, data collection and training for the Strategic Arms Reduction Treaty (START), Chemical Weapons Convention, Open Skies and Intermediate Range Nuclear Forces Treaty.
(CNAP Comptroller, 2003)

24
THIS PAGE INTENTIONALLY LEFT BLANK

25
V. PROCESS CHANGE
A. INTRODUCTION Many books have been published regarding change. There are a myriad of ways
one could pursue in undertaking an introduction to the material. The aim of this project
report is to provide the basic framework, examples, and a roadmap on the journey that is
process improvement, engineering, and reengineering.
If you can't describe what you are doing as a process, you don't know what you're doing.
(Deming, 1900-1993)
A process is a series of interrelated activities which bring about a result or which
are directed toward a particular aim. (LCPowers.com, 2004) Process improvement is the
analysis and improvement of a process or processes that lead to change on some level
within an organization. It is the level of change that determines if process improvement,
engineering, or re-engineering is occurring.
B. PROCESS IMPROVEMENT Process improvement is change on some small incremental level that enhances
one or two process within one Business Unit (BU) of an organization. It is the
streamlining of a process, elimination of inefficiency, or maximization of a resource
within a BU. As such, process improvement occurs on the operational level. It requires
no organizational strategic reassessment, no cultural shift, little to no buy-in from
coworkers or leadership, it can be as simple as an individual understanding the process
he/she is involved with, identifying a need for change, creating metrics to measure the
effectiveness of the change, and then implementing the change. As leaders in the armed
forces, it is this type of change we are most familiar with. Incremental process
improvement serves to improve organizational performance and enhance quality of life.
Leaders who allow this change to occur will reap the benefits of improved moral and a
workforce that is constantly searches for ways to exceed organizational expectations in
meeting there operational challenges.

26
C. PROCESS ENGINEERING Engineering means to establish efficient work processes when work is first
undertaken. One has to answer the question; is this process in need of reinvention or
reengineering. Reinvention is applied within organizations seeking to merely increase
efficiency (Jones, 1999, P. 81), in contrast reengineering concentrates on “starting over”
rather than on trying to “fix” existing process problems with marginal or incremental
“band-aid” solutions. (Jones, 1999, P. 47) The military is famous for its band-aid fixed,
better known as FITREP bullets -- which is not necessarily a bad thing. It is just easier at
the Echelon four and below level commands to process engineer because it is when you
get above this level of command the bureaucratic side of the armed forces rears its head.
And you cannot reengineer within the DoN without involving at least an Echelon Three
organization.
D. PROCESS REENGINEERING Reengineering is a top-down process where in the organization, typically driven
by resource constraints and competitive market pressures, attempts to serve its customers
better by reducing work process cycle time. Reengineering is intended to make quantum
rather than marginal performance improvements. (Jones, 1999, P. 47) Therefore, it is
critical that information technology play a role in process improvement wherever
possible. It is one of the simplest medians to help people work smarter. For Process
Reengineering (PR) to be successful, it must involve a commitment from the top down.
There is precedent within the Navy. The Navy with the help of The Thomas Group (a
Cycle Time management company) totally reengineered its Naval Aviation production
process. The Naval Aviation Production Process Improvement (NAPPI) program took
several years to institute, but resulted in a 30% reduction across the board in the Navy’s
Street-to-Fleet production process.
E. NAVAL AVIATOR PRODUCTION PROCESS IMPROVEMENT (NAPPI) CASE STUDY. A VIEW AS A USER
1. Introduction In the late nineties, it was apparent the Navy had under assessed the number of
pilots it would need to meet fleet demand. FRS (Fleet Replacement Squadron) Class
sizes were down, and fleet demand had remained constant. Under accession of

27
Replacement Pilots (RPs) in the 1993 to 1996 year groups led to first tour lengths
increasing to 43 months (target first tour length was 36 months). Additionally, TACAIR
(Tactical Air) pilots were averaging about 4 years to get to the fleet and helicopter pilot
averages had increased to over 2.5 years. Naval aviation was at a critical juncture as it
strived to stabilize its air force and rebuild the depth in its junior officer ranks. (N88,
2000)
The bottom line was, and still is, that Pilot/NFO production is expensive; with
first sea tours extending beyond the traditional 36-months, retention and moral were
beginning to suffer. The Navy needed to find ways to maximize efficiency, (given its
constrained resources) and get control of the production process. Lastly the Navy needed
to arrest its increased first tour lengths to help improve retention and morale (Emmel,
1999).
2. Leading Organizational Change The Navy developed the Naval Aviator Production Process Improvement
(NAPPI) program. To manage the NAPPI effort, the naval aviator production team
(NAPT) was established at the headquarters level, and three cross-functional teams
(CFT's) were established at the operator level (owners of the NAPP). The charter of
these teams is to reduce TTT while maintaining the high quality of our aviation
professionals. At that time, NAPT membership included N88, CNAL, CNET, USMC
DCS(air), CNP, CNAP, and CNATRA. The NAPP environment also included 26
training squadrons at 17 bases. It involved 29 types of aircraft, 3800 students (including
NFOs) with 1000 graduating each year (N88, 2000).
An additional member of the NAPPI process and NAPT team was the Thomas
Group (TG). A Dallas-based international production consulting company that provides
solutions to significantly improve business processes for corporate and government
clients. TG was contracted by the Navy (at over $6M a year) to help reduce the time to
train naval aviators. The NAPPI program was implemented working with the TG using a
proven methodology called “Total Cycle Time” (TCT), to drive the process
improvement. Key was to identify barriers to the production process and find ways to
eliminate or mitigate those barriers.

28
3. Gaining Control of the Process (Harnessing Time to Train) Following commissioning, all pilots start the training pipeline at Aviation
Preflight Indoctrination (API), a six week program taught at Naval Aviation Schools
Command onboard NAS Pensacola, FL. From API, they attend 22 weeks of Primary
pilot training. After that, the amount of time needed to complete the training pipeline
varies based on the platform the student will fly. Unknown variables such as inclement
weather, aircraft availability or personal issues such as illness, and order writing between
schools, can also affect the time required. Discounting all of those uncontrollable
elements, the process takes from 27 (HSL helo) to 48 months for strike pilots. (N88,
2000)
Developing a more efficient process, which results in timelier production of naval
aviators and minimizes the negative impact on manpower management and retention, is
one of the keys to improving future fleet readiness. The only effective and long-term
solution to accomplish the goal of significantly reducing time to train (TTT) is to focus
on improving the process itself by removing barriers to progress (N88, 2000). These
barriers include policy, structure and resourcing. Leaders at the Air Force level were also
realizing it was time to stop asking training commands to do more with less. Enter the
TG consultants (or as they introduced themselves to me, resultants). These guys were
salesman on steroids. No nonsense, down-in-the-trenches, results-oriented professionals
whose goal was to work side by side us (the operators) at the commissioning sources, in
the classrooms, and at the squadrons. They were not there to make friends; they were
there to improve the process.
4. Corporate (Command) Culture and Performance While at HSL-41 I was there from the beginning, providing initial interviews with
the resultants, and beta testing the early metrics through the first year and a half of
implementation. I worked side by side with the TG resultants to determine what metrics
were important in capturing FRS efficiency and effectiveness. The environment was
hostile at first. There were a lot of non-believers, no one really saw a problem, doing
more with less was so ingrained in our culture no one thought anything of it. TG initial
challenge was to examine the Navy Aviator Production Process (NAPP), identify
inefficiencies in the process, and determine methods of improvement. TG’s resultants

29
worked on-site with us, providing training to analyze operations, and helped implement
their speed-based improvement strategies.
The goal is to apply the team's focus on identifying and eliminating barriers to
production improvement while standardizing production efforts throughout the naval
aviation training process (VT’s through FRS). With an overall goal to involve all
training process owners from accessions through the FRS (street to the fleet) in rapidly
implementing a new standardized approach to production systems. “This approach is
similar in scope to the benefits achieved with the implementation of NATOPS” (N88,
2000).
Overcoming cultural bias is never easy; it was a challenge to get the department
Heads to discuss the issue seriously. At the time we had never graduated a class late (so
of course we did not have a problem). The problem was, we had never truly met fleet
demand either. Due to under accession, the training command was not delivering the
number of students our load demand called for. Therefore it was easy to get them in and
out on schedule because our resources were not being tested.
In other words our west coast LAMPS (Light Airborne Multipurpose System) squadron requirement called for approximately 65 first tour aviators annually. Production at that time was approximately 45-50. The fleet squadrons rarely complained because we had always been accustomed to doing more with less, and first tour pilot extensions had become routine (approx 43-45 months) and were always approved.
(Emmel, 1999)
We needed to get a hold of our production efforts, implement process
improvements, and monitor results. To a stick-and-rudder guy, tracking TTT (Time to
Train) requirements is a convoluted process and about as desirable as watching paint dry.
But with the metrics incorporated in the CockPit (C/P) charts (designed to track the
people, parts, and planes required in Pilot/NFO production), we began to get our hands
on what it takes to raise production levels up to those necessary to meet fleet demand.
As the Training Department became better at interpreting the C/P charts data,
other departments started to take note. Maintenance recognized that the number of
personnel, parts, and aircraft required to meet production might not be sustainable

30
without real change. Training was realizing its own inefficiencies. The training syllabus
would have to be streamlined to improve efficiency, maximize utilization of limited
resources, and minimize TTT. It became abundantly clear; we could no longer accept
extended TTT as the cost of doing business. We streamlined lectures, created more
flexibility (like scheduling trainers and classroom requirements on weekends). And
through the C/P charts we could measure whether or not or methods were successful.
5. Measuring Effectiveness In the early nineties, squadrons found ways to uniquely spin their
accomplishments. Most of their methods for doing so were subjective and they were not
standardized across community lines. The Cockpit charts provided a means for
squadrons to measure their effectiveness in a standardized manner across the board. On a
monthly basis, Squadrons rolled their C/P chart data up the chain of command (COC).
The data covered Manpower issues, Aircraft & parts, and Key performance (production).
Once each department understood the deliverables, it was not difficult to combine
the data into the final product. Production metrics gave each training squadron a standard
means of measuring effectiveness. These were briefed to the FRS CO, Wing
Commodore, and ultimately all the way up to the Air Board monthly.
6. Effectiveness vs. Efficiency While analyzing the key measurements chart (production), the manning and
Aircraft charts provided the means to identify inefficiencies, shortfalls, or barriers to
production (Emmel, 1999). Issues the FRS could not resolve were elevated up the chain
to give their COC a chance to help resolve the issue. I personally cannot say enough
about this new system of doing business. The Navy finally has a method of objectifying
performance. Publicly this has begun to win acceptance, but off the record its commands
see this as a double edged sword (i.e., COC can use the data to call commands on the
carpet based on C/P chart analysis). Bottom line: This tool is helping keep the press on
production and eliminate inefficiencies by enabling commands and those in their COC to
identify and even predict where problems are or are developing in the production process.
We can now focus on training and fixing the problem instead of spending all our time
trying to figure out what the problem is.

31
7. Seeing is Believing; Believing is Seeing Naval Aviation has always prided itself in its ability to adapt, improvise, and
overcome. That being said, its methods are pretty conventional. The Thomas Group
brought an out-of-the-box (in military circles anyway) approach to production
management into an old school system. And it was no big surprise that it was not
initially well received. Four years after its inception, I noted the C/P charts were still met
with raised eyebrows, but there is no denying the effectiveness of this tool. It enabled the
training command(s) to get a handle on the process of producing aviators. Production
results have been objectified. Squadrons can now isolate barriers to production, take pro-
active steps to correct, and then monitor for desired results. Only time will tell if
stakeholders will totally buy-in to this approach. It is clear the stakeholders above the
FRS level have, and while once a skeptic, the Thomas Group approach made a believer
out of me. I can also add (with absolute certainty), without the flag level support this
reengineering effort received; the NAPPI would have failed.
F. CNAP COMPTROLLER PROCESS ENGINEERING EXERCISE. A CONSULTANT VIEW
1. Introduction The project completed by team three was quite different than what anyone
thought it would be. After a three week delay at the start of the course, a project
involving reengineering the Flight Hour Program (FHP) for the Commander Naval Air
Pacific (CNAP) was selected by the team. The FHP program is a well documented and
often studied process that due to its large scope is a constant target for reengineering to
help further reduce costs and optimize the expense of every dollar.
The budget process is in need of process reengineering. A number of the goals of
reengineering are applicable in the budget process. Specifically: the need to increase
customer satisfaction (up and down the Chain of command), attain greater efficiency, and
optimize costs. Additionally, with greater emphasis being placed on the accuracy of our
budget proposals, the need to not exceed cost estimates, and the need to achieve the
greatest level of readiness possible given the financial constraints necessitates the need to
get a hold of this process.

32
After an initial meeting with Dr. Lawrence Jones (MBA project sponsor), Glenn
Cook (IS4220 course instructor), Capt Moore (CNAP Comptroller), and Clinton Miles
(CNAP Deputy Comptroller), it was determined that a process reengineering effort
involving the FHP program would be too broad in scope. We learned CNAP was
working another issue involving Flight- hour Other (FO) management with OPNAV and
it was agreed upon that reengineering the FO program was a more manageable task given
the constraints of the IS4220 course of study.
2. Project Preliminary Findings Myself, LT Mike Wagner, and LT Ashton Feehan traveled to CNAP (located on
NAS North Island in San Diego CA) on an information gathering/ fact finding mission.
We quickly realized there was more to this issue than discussed during the initial phone
conference. We essentially learned there was no FO program. FO costs are not included
in the OP-20. These “other” costs represent outlays for flight simulator operations, Fleet
Replenishment Squadron operations, civilian labor, administrative supplies, material,
equipment, maintenance service contracts, and expense for travel and lodging associated
with pilot and crew Temporary Additional Duty (TAD). While most of the costs are
considered essential to Naval Aviation, there are no FHP resources programmed by N-
88F for FO. FO is a “level-of-effort” program where costs are incorporated in the Major
Claimants’ regular budget submission. The Air Type Commanders (TYCOMs) provide
input for the development of this budget, based on their forecast requirements for the FO
category of funds (Last years spending plus a predetermined Inflation Rate). The FO
category has consistently been under funded and has been a constant drain on the FHP
dollars as that funding gets reprogrammed to meet the FO shortfalls throughout the
budget cycle. There are numerous additional programs included in FO, but we will forgo
the discussion as non value added to this project report.
Further investigation revealed that unlike the FHP program, there was no “As-Is”
process in place. Current management of FO is an ad-hoc effort lacking standardization
and verification. The team could easily have spent the term just developing an accurate
process map of how the comptroller department is managing FO. Due to the course
constraints and the busy time of year in the budget cycle even that was not an option. We
agreed upon a rough process map (Appendix A) and after much deliberation greatly

33
narrowed the scope of the project to creating a web-enabled database prototype that can
generate Fund Summary Reports (FSR) and manage the CNAP OPTAR Authorization(s)
Process. Subsequently, we dropped the OPTAR Authorization(s) Process portion due to
data unavailability. The “As-Is” process map for generating the FSR is shown in
Appendix B.
3. Existing Process The FSR is currently produced in manner that brings into question its timeliness
and accuracy. Essentially what occurs is similar funding data is tracked in various
manners with no standardization. Unit Transmittal Listings (TLs) are received 4 times a
month and input into the Standard Accounting and Reporting System, Field Level
(STARS-FL). This lets CNAP know what has been spent. CNAP Accounting
Department uses Financial Resource Management System (FRMS) to reconcile their
accounts. FRMS and STARS-FL data is integrated into an Excel spreadsheet that is
vulnerable to formulas and formats being written over. Ultimately personnel spend so
much time checking and validating the data that they roll into the follow-on week’s data
timeline having never submitted or completed a report. This observation was provided
and validated by the Deputy Comptroller.
In Appendix B, the red dashed box indicates the actions performed in the FRMS
database (FR 03, FR 04, FR 05). The blue dashed box indicates the actions performed in
the STARS-FL database (FR 01 and FR 02). The remaining actions are generated by
hand and with various Excel files. These hand-generated tasks (FR 6, FR 7, and FR 8)
are where the most difficulties occur and where our solution can offer the most benefit.
4. “As-Is” KVA Discussion The core processes listed in the “As-Is” process map (Appendix B) are further
detailed in our KVA spreadsheet (Figure 6) and are analyzed to measure their
productivity. We included the number of people involved in each sub-process, the time it
takes to complete the process, the number of times the process “fires” on a weekly basis,
and the time it takes to learn the knowledge required to perform the process. These four
pieces of data were used to determine how much productivity each sub-process adds to
the overall process.

This productivity measurement is a ratio called Return On Knowledge (ROK).
We derive ROK in our spreadsheet by dividing our benefits by cost. In our spreadsheet,
this is total revenue divided by expenses. Revenue is the “Actual Learning Time (hours)”
multiplied by number of people it takes to complete the sub-process (#People Involved)
and the number of times the process is repeated (Times Fired). This is divided by
“Expense”, which is calculated by multiplying “Time-To-Complete per firing” by the
number of people involved.
The five gray colored processes in our “As-Is” KVA Spreadsheet indicate where
the FSR is generated. These are the areas where we believe that Information Technology
(IT) could most improve the overall process. Currently these steps are performed by an
Excel spreadsheet that requires queries, pivot tables, refreshing, and in some cases
manual entry of data. Our KVA
Group Responsible Subprocess # People
Involved
Times Fired
(Occurrence per week)
Time to Complete per firing (hours)
Actual Learning
Time (hours)
Total Revenue (ALT*People
Involved*Knowledge Fired)
Expense (Man-Hours Expended)
(Time to Compl.*People Involved)
ROK (Revenue / Expense)
Budget Analyst
Input CPF Expense Limitation
Obligation Auth. By Unit into FRMS
2 1 1 8 16.00 2 80%
Budget AnalystInput OPTAR
obligations into FRMS
2 1 1 2 4.00 2 20%
Budget AnalystInput OM6
Authorizations by Unit into FRMS
2 1 1 2 4.00 2 20%
AccountingReconcile Weekly
Transmittal Listings in STARS
8 1 8 8 64.00 64 10%
Budget AnalystQuery Stars to
generate obligations
2 1 1 2 4.00 2 20%
Budget Analyst
Funds Status Report (FSR)
updated from FRMS and STARS
2 1 0.17 2 4.00 0.34 118%
Total ROK
Budget AnalystExcel Program
calculates Required Fields in FSR
2 1 0.01 0.01 0.02 0.02 10%
238%
Budget Analyst Update DATE field on FSR manually 2 1 0.02 0.02 0.04 0.04 10%
Budget Analyst Reconcile FSR 2 1 1 8 16.00 2 80%
Budget Analyst/ Asst. Comptroller Review FSR 5 1 1 8 40.00 5 80%
Figure 7 “As-Is” Knowledge Value Added Data (From: Team 3, 2003)
34

spreadsheet, shows these five steps yielding a 237.6% Return on Knowledge. While this
is not a modest figure, we recognize that there is still potential for improvement.
Implementing a web-enabled database eliminates the possibility of data transfer errors or
manual input errors. The functions that currently require human input will be seamless
and transparent to the user.
5. “To-Be” KVA Discussion As demonstrated on the “To-Be” KVA spreadsheet (figure 7), replacing the Excel
version of the FSR with our more robust web-enabled database has reduced the
previously required five steps to one step (listed in gray). The time to complete these
steps has been reduced from 2.2 hours to a mere .25 hours (15 minutes). The reduction in
number of processes and time to complete them causes our ROK to double from 237.6%
to 481.2%. The significance is not so much in the numbers themselves as it is in their
ratio. In a relative sense, this is a substantial improvement.
Group Responsible Subprocess # People
Involved
Times Fired
(Utilized per week)
Time to Complete per firing (hours)
%IT
Actual Learning
Time (hours)
Total Revenue
(ALT*People Involved*Knowle
dge Fired)
Expense (Man-Hours Expended)
(Time to Compl.*People
Involved)
ROK (Revenue / Expense)
Budget Analyst
Input CPF Expense Limitation
Obligation Auth. By Unit into FRMS
2 1 1 8 16 2 80%
Budget AnalystInput OPTAR
obligations into FRMS
2 1 1 2 4 2 20%
Budget AnalystInput OM6
Authorizations by Unit into FRMS
2 1 1 2 4 2 20%
AccountingReconcile Weekly
Transmittal Listings in STARS
8 1 8 8 64 64 10%
Budget Analyst Generate Funds Status Report 2 1 0.25 100% 12.03 24.06 0.5 481%
Budget Analyst/ Asst. Comptroller Review FSR 5 1 1 8 40 5 80%
Legend: 5 steps from the As is spread sheet reduced to one step.
We have increased our Return on Knowledge from 237.6% to 481.2% by reducing time of completion from 2.2 hours to .25 hours Figure 8 To-Be Knowledge Value Added Data (From: Team 3, 2003)
6. Our Solution “To-Be”/ Prototype Discussion
35
To narrow the scope and to enable the team to complete the project within the
time constraints of the course, we created our improved version of an FSR, ours being an

36
automated web-enabled database driven report vice a manual Excel spreadsheet. This
can provide Management a tool that would enable the leadership (Comptroller, Deputy
Comptroller) the capability to view the current status of the FO budget at any given point
in time. This is a significant improvement over the process that is currently being used.
Implementing our prototype, however, would simply be a Band-Aid. The much larger
issue is that CNAP Comptroller’s Office is a prime candidate for a more “radical”
Business Process Reengineering (BPR) project because there is no standardization, no
verification, and no validation processes in place within the organization to help them
successfully manage over 3 billion dollars a year in CNAP FHP/FO funding. Our
incremental solution is depicted in Appendix C. The areas targeted were:
Providing a method to input and edit data from the budgeting process, FRMS and STARS-FL.
Display the overall budget status in an easily readable format.
We determined that by utilizing web-enabled forms, we could reduce the
possibility of inaccurate reports. The current process is manual data entry in an Excel
spreadsheet. Analysts often end up corrupting the data by accidentally deleting formulas.
Our web-based solution takes the access to formulas out of the control of users.
A dummy database was created to represent the data from FRMS and STARS-FL.
Both the database and web portal were named, “COMNAVAIRPAC.” The better way to
perform this process would have been to build Structured Query Language (SQL)
statements to automatically draw this data from the existing databases (FRMS & STARS-
FL) to avoid redundancy in data input. We were unable, however, to gain access to these
databases. The FRMS is proprietary and developed by CACI International Incorporated
who also developed and maintains the Aviation Cost Evaluation System (ACES). ACES
is used to manage the Navy’s Flight Hour Program. The legalities of creating an
interface would have to be researched before any further development could be
undertaken. The Database Schema and several screenshots of the web Comptroller’s
Portal are included for review in Appendix D.
Our solution turned out to be a very basic representation of the current FO budget
status. It would be useful to create drill down and query capabilities for the reports. The
“Status” page however, turned out to be far more complicated to create than we had

37
originally anticipated. Visual Basic Script had to be used to sum up all of the records
since Dreamweaver does not contain this capability. This coding turned out to be fairly
complex and prohibitive to creating a query capability within our time and knowledge
level constraints. In addition, making the database more complicated to provide drill-
down capability would create the requirement to enter data multiple times. As a “proof
of concept”, the code and database of our prototype work fine and the client saw the
benefits of moving to a similar type of web-enabled comprehensive report.
7. Project Final Considerations We recognize our solution to build a new database was not the most effective
method to handle the problem, but given the constraints we faced it was a viable solution.
There are other methods to gain access to the necessary information within FRMS and
STARS-FL databases. A tool like Crystal Reports (already used within the CNAP
Comptroller Office) is a technology that can drill down into FRMS and STARS-FL. The
FRMS contractors we spoke with have the necessary skills to exercise this option, but
they have not been contracted to do this.
It is generally viewed that the entire DoD budget and execution process needs to
be radically overhauled (case and point are the Rumsfeld efforts currently underway). As
a result, it was difficult to apply the KVA to broken and non-existent processes. In order
to make the web database prototype fully functional, the first step should be to revise the
database interface between FRMS and STARS-FL, so that there is a single and
consolidated input to the website or presentation and tracking tool. This would allow the
data to be manipulated and displayed in a variety of ways. Contractor support is already
in place to perform this function and just requires the funding. This project only focused
on the Flight Other (FO) account, but the follow-on web database could easily
accommodate any or all of the other accounts under CNAP control. In order to realize
significant KVA increases, process control must be implemented throughout the
organization. Once this occurs, then the organization can be truly analyzed for
inefficiencies and ineffectiveness. Our team’s initial analysis of the CNAP organization
has provided the foundation for subsequent analysis and research.

38
G. KEY CONTRIBUTORS IN PROCESS IMPROVEMENT/ ENGINEERING/ REENGINEERING EFFORTS
For the purposes of discussion, Process Improvement, Engineering, and Re-
engineering are interchangeable in this section. Because regardless of the scale of
change, all of these factors play a role, it is merely a question of the magnitude of the
role. There are several noted key contributing factors that are necessary for any process
improvement to be successful:
Commitment to reform at the top of the organization.
A meaningful, clear vision, a set of goals, and a plan of action.
Organization-wide understanding of the vision, goals, and plan of action.
A sense of urgency.
An understanding of obstacles to change and persistence in overcoming them.
Performance measures and a willingness to learn from one’s mistakes.
Recognition of successes and extraordinary efforts.
Institutionalization of continuous improvement.
(Jones, 2001)
1. Committed Leadership This is the most critical aspect of any process improvement effort. The surest
guarantee that a process improvement effort will fail is if management is fails to strongly
endorse the effort or more dangerous, is overtly indifferent. While it was not clearly
communicated out of the gate in the NAPPI case, by the end of the 2nd quarter there was
no doubt the highest levels of leadership of OPNAV was clearly committed, and the
results showed. With the CNAP Comptroller case, the interest was clearly there, but
competing priorities kept any process improvement on hold.
2. Clear Vision and a Plan of Action
Often, the best of intentions fail in the absence of clear direction. An articulate,
inspiring vision statement from the highest levels of leadership where the desired end-
state is clearly articulated is essential to successful implementation of BPR. Likewise,
managements Plan of action should be in alignment with leaderships Vision statement
and provide a roadmap outlying the direction, milestones, and timelines the organization

39
must meet to effectively achieve senior leadership’s vision and successfully navigate the
murky waters of BPR. BPR is hard, and can cost and organization large amounts of
intellectual capital to see it through prior to any real process improvement gains being
realized. The absence of a Vision Statement and a Plan of Action can lead to an
organization chasing the preverbal Red Herring, loosing their direction, and ultimately
seeing what might have been a successful BPR effort failing. OPNAV and a chorus of
flag level leadership articulated the vision and they along with senior level resultants
communicated and monitored the plan of action. A suggested plan of action is offered
later in the project report for CNAP’s Comptroller.
3. Organizational-Wide Understanding The best way to ensure a clear understanding of an organizations vision and plan
of action is to articulate and drive them from the top. Senior leadership should look for
opportunities to show their commitment to BPR whenever possible. Senior leadership
often tends to lend support to BPR at the beginning of the effort, but routinely delegates
all aspects of the effort to the line/functional manager level to carry it out. When what
they should do is stay engaged in the effort. Let the line/functional managers run with
the day to day management of the BPR effort, but senior management must be visible and
vocal in their efforts to stay informed. Then they must articulate this level of interest in
the same manner they would articulate interest in any revenue enhancing measure the
organization is undertaking. Leaders who ensure, people in their organization are in
alignment with, and understand the importance and significance of a particular goal are
far more likely to reap the successes of their organization achieving the goal. BPR is no
different and should be treated accordingly by senior level leadership.
4. A Sense of Urgency On the NAPPI side, it took months for the operational layer to realize this effort
had flag level attention and was going to happen. Once this flag level sense of urgency
was communicated; as with any military unit; the change was great and immediate.
Within the CNAP Comptroller, the sense of urgency existed at the executive level but
was not being conveyed in an effective manner down the chain of command. The
absence of a sense of urgency creates an environment where nothing gets done.
Management must communicate this sense and provide the education necessary to

40
reinforce the reality and need for the sense of urgency. The momentum created through a
sense of urgency can go a long way in overcoming obstacles to change. As observed in
the NAPPI case study.
5. Understanding Obstacles to Change and Persistence in Overcoming Them
There are many motivators to Obstacles to change. They can be survival related,
political, rice-bowl, or even just plain old laziness. What ever the reason, management
has to recognize that in some form obstacles to change will exist, and they need to pro-
actively move to overcome them. Providing performance measurements and rewards
systems are two positive methods to overcoming obstacles to change. For whatever
reasons, the Thomas Group resultants seamed ill prepared to deal with the obstacles to
change. However, the performance measures provided and monitored in the NAPPI
effort proved very effective in overcoming obstacles to change. While not implemented
due time, the FSR could certainly attain the same results for CNAP’s Comptroller.
6. Performance Measurement and Willingness to Experiment This is a difficult and essential requirement to process reengineering. Metrics
must be objective, tangible, and measurable. With considerable effort, the NAPPI team
produced and implemented a set of metrics that were acceptable across the different
aviation communities (TACAIR, Fixed Wing, and Helicopter). This also provided a
standardized means to measure effectiveness across community lines that had not
previously existed for OPNAV. This factor could be encompassed in any IT related
solution agreed upon by the Comptroller and his staff.
7. Recognition of Successes and Extraordinary Efforts This is where leadership can have its greatest impact on reengineering efforts.
Generating an understanding is not enough. Recognizing those who are moving the
organization (in a positive way) in the direction of change is essential to getting buy-in
and to reinforcing (and rewarding) employees who embody the sense of urgency
communicated by management.
8. Continuous Improvement The real truth about BPR is that it is a journey not a destination. For long term
success it must become a part of the organizations culture. Anything less and the effort

41
becomes just the latest fad to be thrown into the proverbial wastebasket. Equally
important to getting on and staying on the path of continuous improvement is education
and training. It is critical staffs are trained in the correct implementation of the new
process and that a training plan is in place to ensure standardization is maintained
throughout the life cycle of the process.

42
THIS PAGE INTENTIONALLY LEFT BLANK

VI. ENTERPRISE RESOURCE PLANNING SYSTEM (ERP)
Figure 9 ERP Evolutionary Timeline (From: Jakovijevic, 2000, P. 8)
A. BACKGROUND The foundation of Enterprise Resource Planning (ERP) dates back to the 60’s in
the manufacturing sector and its evolution encompasses Materials Requirement Planning
(MRP), Closed Loop MRP, MRPII, ERP, and IERP over the course of a 40 year period
and continues to evolve as ERP systems migrate to the internet as ERPII systems are
brought on line.
1. Materials Requirement Planning (MRP)/ Closed Loop MRP
The focus of these systems was in the area of inventory control. It was developed
in the age of the Reorder Point System (ROP) where the assumption was that the
customers order/reorder habits would be consistent. MRP demonstrated its effectiveness
in reducing inventories and reductions in production and delivery lead times. MRP
enabled manufacturers to plan for “having the right materials at the right time”
(Jakovijevic, 2000) in the manufacturing process. However there was no accounting or
financial planning segments as of yet. As computing capacity evolved and became more
43

44
financially affordable the market was able to address the short comings of MRP with the
development of Closed loop MRP. Closed Loop MRP incorporated the necessary
accounting and financial planning segments MRP lacked. Additionally, Closed Loop
MRP took into account production capacity constraints (previously presumed to be
infinity), and Closed Look MRP came to be called Capacity Requirements Planning
(CRP). (Jakovijevic, 2000)
2. Materials Requirement Planning II (MRPII) Prior to MRPII the basic component packages of MRP and CRP where not fully
integrated. Technology had not allowed it but, once again technology evolved at a pace
that enabled MRP/CRP to continue its evolution.
MRPII closed the loop with the financial accounting and financial management
systems. The American Production and Inventory Control Society (APICS) defined
MRPII as follows:
MRPII is ‘a method for the effective planning of all resources of a manufacturing company. Ideally, it addresses operational planning in units, financial planning in dollars, and has a simulation capability to answer “what if” questions. It is made up of a variety of functions, each linked together: business planning, sales and operations planning, production planning, and the execution support systems for capacity and material.’
(Jakovijevic, 2000)
For the first time, organizations could have an integrated business system providing;
a. Visibility to material requirements and capacity limitations driven from a desired operations plan.
b. Enabled input of detailed activities.
c. Translated all this activity to a financial statement, and suggested actions to address those items that were not in balance with the desired plan.
It the belief that ‘good information leads to good decisions’ then the integrated
nature of MRPII system certainly provides a competitive advantage for functional areas
of organizations which are able to incorporate the system. However, not all functional
areas of the organization could use the MRPII system. As other functional areas
requested help, systems were developed within the organization to help support
additional functional areas. For example, Accounting and Finance had a set of programs

45
that helped it manage the general ledger, accounts payable & receivable, as well as
capital assets and financial reporting. Where MRPII integrated manufacturing programs,
these accounting programs were combined to form an integrated system for accounting.
Sales, Engineering, Purchasing, Logistics, Project Control, Customer Service, and
Human Resources followed suit and each developed their own individual (see the
problem) sets of integrated computer systems. Unfortunately, these disparate systems
were unable to interact and exchange information. Any exchange information between
these systems was time consuming and error prone. (Jakovijevic, 2000)
3. ERP/Internet-Based ERP By the 1980’s and early 1990’s it had become intuitively obvious that segmented
integration within an organization is problematic. While organizational business units
thrived, the organization as a whole often experienced problems such as; cost overruns,
process redundancy, organizational miscues, conflicting and untimely information flow
to organizational executives to name a few. During this period “time to market” had
become a driving force in measuring organizational success. This trend highlighted the
need for business units to adopt an enterprise wide view within their area in order to
attain and maintain a ‘time to market’ competitive advantage. Technology and software
development tool advancements coupled with reduced hardware costs paved the way to
the development of ERP products.
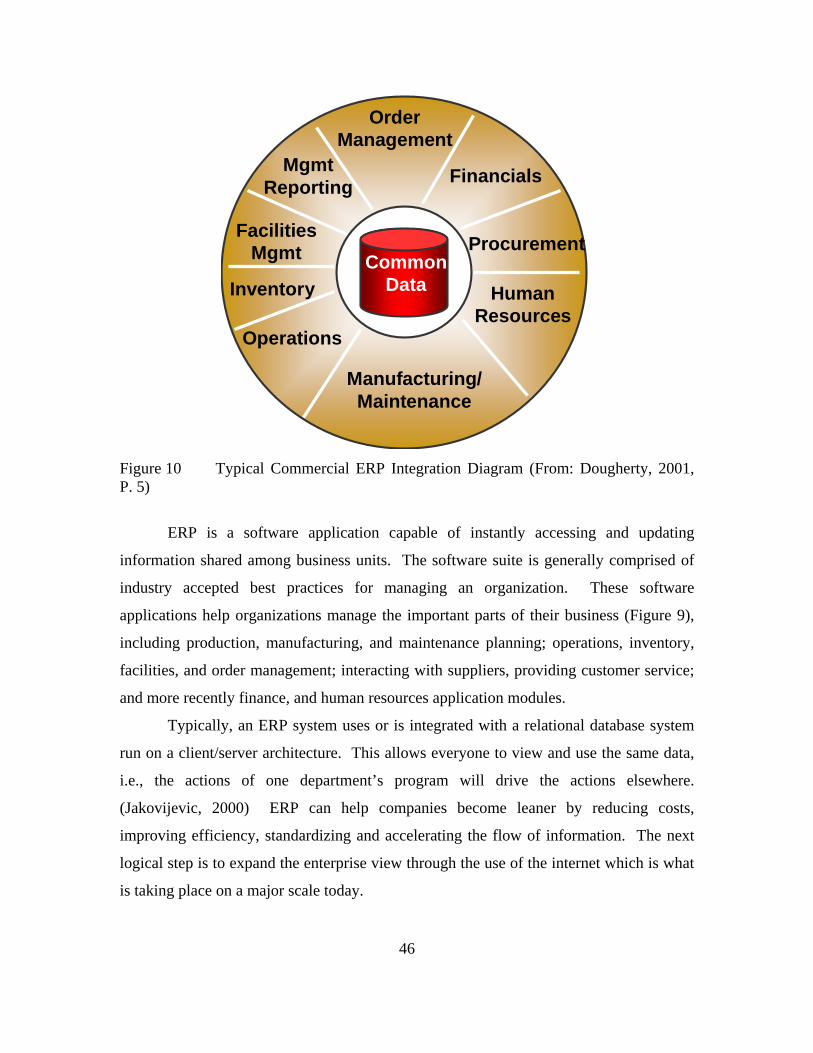
OrderManagement
Financials
Manufacturing/Maintenance
HumanResources
Procurement
MgmtReporting
Inventory
Facilities Mgmt Common
Data
Operations
Figure 10 Typical Commercial ERP Integration Diagram (From: Dougherty, 2001, P. 5)
ERP is a software application capable of instantly accessing and updating
information shared among business units. The software suite is generally comprised of
industry accepted best practices for managing an organization. These software
applications help organizations manage the important parts of their business (Figure 9),
including production, manufacturing, and maintenance planning; operations, inventory,
facilities, and order management; interacting with suppliers, providing customer service;
and more recently finance, and human resources application modules.
Typically, an ERP system uses or is integrated with a relational database system
run on a client/server architecture. This allows everyone to view and use the same data,
i.e., the actions of one department’s program will drive the actions elsewhere.
(Jakovijevic, 2000) ERP can help companies become leaner by reducing costs,
improving efficiency, standardizing and accelerating the flow of information. The next
logical step is to expand the enterprise view through the use of the internet which is what
is taking place on a major scale today.
46

47
B. KEYS TO SUCCESS There are five success factors necessary to help influence the chances of
successfully integrating ERP into ones business Model.
1. Recognize Out of the Gate, it is About the People not the Software Most ERP implementation failures can be attributed to businesses not taking into
account the people side of the equation. With large-scale investments of this type it is
imperative your ERP choice is in alignment with your business model, and your people
do their job. You also need to plan on the amount of training that will be involved and
how employee turnover will figure into the implementation.
2. Analyze and Formalize Your Own Business Best Practices from the Enterprise Level, Down to the Customer Service Representative
If your business model is flawed, this increases the chance of the ERP system
failing. The reasons are two fold. First, ERP is in essence a “best practice” business tool.
If your model is flawed, then your people will invariably fight the new technology.
Additionally, because of the divergent systems, if will invariably take more time to
implement the system, and that can significantly increase the cost of implementation as
well as your revenue. Working groups need to be formed in the different divisions,
departments, etc…to capture what your businesses “best practices” are. This should
include a model/ vision for the future of what your people feel your best practices should
be. The middle management needs to work hand in hand with the working groups. It is
middle managements job to sell their product to the board…in the end, the process is
completed when the organization (CEO, Management, Core employees) have achieved
“buy-in” to their vision of “best-practices”. Armed with this new knowledge, a business
can then decide if an ERP product is right for them and if the answer is “yes”, which one.
3. Leadership Endorsement (or Enforcement) of “Best Practices” Not everyone will ultimately buy in to this new model. It is the job of
management and the CEO to set the tone, to lead the change in the underlying culture and
support those in middle management leading the effort. Only a united organization is
capable of successfully implementing change on this scale.

48
4. CRM Must Be a Consideration ERP is largely a behind the scenes tool designed to optimize how departments
work together (through a common database). Current models (this is changing) do not
address the customer side of the house, nor does it address the e-commerce side of the
house. CRM is the answer to that side of the question but is does not readily integrate
into current CRM systems. This critical key should be addressed as early into the process
as feasible, and should impact which vender you choose.
5. Publish a Roadmap with Measurable Goals “How do you know where you’re going, if you do not know where you have
been?” ERP implementation is not easy, by all accounts it is down right painful and as
apposed to sale rep estimates on implementation time (3-6 months) it is more on the order
of 1-3 years. A business needs to have a detailed road map to fall back on when things
get tough. It needs to include negotiated measurable and review-able criteria. This will
help keep everyone focus in the right place during the dark days (and their will be many)
of the implementation process.

VII. ERP WITHIN THE DEPARTMENT OF THE NAVY
A. ORIGIN OF NAVY ERP ERP within the Department of the Navy (DoN) can trace its roots back to 1997
when the Secretary of the Navy mandated that the Navy begin drafting a DoN strategic
business plan as a means of addressing reform in the business affairs of the Department.
This led to the establishment of the Revolution in Business Affairs (RBA). In September
of 1998, the RBA established working teams designed to identify short and long range
goals and plans for reaching the identified goals. The Commercial Financial Practices
Working Group, led by VADM John Lockard (then COMNAVAIR), was one of the first
working groups to be chartered. (ERP Website, 2004) The working group members
were quick to realize the need to expand beyond financial business practices alone, rather
adopt an enterprise view and look at a wider range of business practices. This led to a
subsequent name change of Commercial Business Practices (CBP) Working Group. The
group focus was in the areas of; examination of the state of commercial sector business
practices, understanding the direction of changes in business practices, and developing a
49

50
way ahead for the DoN. ERP was a component in the CBPs solution for the DoN.
Specifically, the group believed this alternative would
Provide quality information for decision making to all levels of management
Improve efficiency and effectiveness (better, faster, cheaper) through re-engineered business processes and integrated information provided to managers
Manage costs for maximum reallocation of resources to recapitalization and modernization efforts
Enable compliance with statutory requirements: Government Management Reform Act (GMRA), Government Performance and Results Act (GPRA), Chief Financial Officer’s (CFO) Act, etc.
(DoN ERP Website, 2004)
The CBP recommended the DoN conduct six ERP pilot programs to explore the
applicability of implementing a Navy wide ERP solution; four were adopted.
B. CURRENT/LEGACY ERP SYSTEMS A succession of SECNAV’s has reiterated the importance of advanced
Technology and Business Practices spearheading the DoN’s efforts in reducing costs and
streamlining processes. With the end result of these efforts enabling more dollars to be
shifted to improve naval combat capability and quality of service. Given the desired end
state and as mentioned earlier, six programs were recommended to re-engineer business
processes and implement ERP solutions to cut operating and business costs across
specific targeted areas within DoN. Of the six ERP programs, four were commissioned
and are the legacy systems active in the DoN. The systems are SMART (targeting
Aviation Supply Chain), SIGMA (targeting program management), NEMAIS (targeting
Regional Maintenance), and CABRILLO (targeting Warfare Center Management) and
are discussed below.
1. CABRILLO (Navy Working Capital Fund Management “NWCF” Pilot Project)
CABRILLO went live in July of 2001 at Space and Naval Warfare Systems
Command (SPAWAR). The pilot serves 3,500 users and has resulted in over 30 legacy
business systems being retired at the Systems Support Center (SSC) in San Diego, CA.
The savings have been dramatic. The ERP Vendor selected was SAP. SAP is a German
based company founded in 1972 and is the recognized leader in providing industry

51
specific, collaborative business solutions. This program is managed by SSC and the
system integrator was PriceWaterhouseCoopers (now IBM). IBM’s team consisted of
Computer Sciences Corporation (CSC), Unified Industries Incorporated (UII), SAP, and
Logicon, Inc. The NWCF ERP pilot addressed the integration of the following business
practices and processes:
Project Management
Financial Management
Procurement Management
Asset Management
Human Resource Management
Strategic Planning
Subsequent experiences led to the incorporation of Business Warehouse and Supplier
Relationship Management into the production system. Specific accomplishments
include:
Online for 2+ years and stable
More than 6 million transactions processed
User acceptance and competence continues to grow
Civilian End Strength reduction of 15.8 work-years (FY 02)
Defense Financial Accounting System (DFAS) zero error rate for data
Contractor reductions = $3.02 million
Legacy system reduction: retiring 59 of 72 legacy systems, applications and manual processes
Business cycle time required from requisition to purchase order dropped from 44 days to 44 minutes for Electronic Catalog buying
ERP knowledge, as measured by hours of training received:
Goal = 38,000 hours Achieved = 41,500 hours
(ERP Newsletter Issue 1, 2004, P. 4)

52
System) 2. NEMAIS (Navy Enterprise Maintenance Automated Information
Operational since June of 2002,
the system is operational in three
locations (Mid-Atlantic, Southwest, and
Southeast regions) and will be rolled out
in Japan and Pascagoula, MS in 2005.
NEMAIS is a joint partnership between
NAVSEA (Naval Sea Systems
Command) and CFFC (Commander Fleet
Forces Command) targeted to optimize
Intermediate Level (I-Level) maintenance
support for the warfighter. The
improvement and standardization of
business processes across I-Level maintenance activities was designed to yield the
following benefits:
Commodores, maintenance activity commanders, planners and material managers will know the real-time maintenance and material status of ship’s equipment from a common information base to better assess current and future readiness.
Maintenance activity commanders will have real-time indicators of their priorities and resources available to maintain the fleet.
Type Commanders will have improved real-time information to more effectively allocate scarce maintenance dollars.
(ERP Newsletter Issue 1, 2004, P. 4)
The efforts were better than expected. In fact, the re-engineering efforts resulted
in a 43% reduction in the number of individual processes performed. This was
accomplished through the alignment of distinct redundant sub-processes within larger
separate core processes and through the automation of these processes with the automated
tools inherent in ERP systems requiring less transfer and verification of information.
SAP was the ERP vendor for the core software and IBM and its team of partnering
companies (BearingPoint, Inc. – formerly KPMG Consulting – SAIC/AMSEC, and
CACI) served as the integration team. Specific accomplishments include:

53
Online in Mid-Atlantic Region for nearly 2 years and stable; also implemented in Southwest and Southeast Regions; SRF Japan “Go Live” scheduled for Summer 2004
NEMAIS in January 2003 completed 3 weeks of Independent Third Party Testing, which found no material deficiencies during Blue Book review and recommended immediate rollout to obtain ROI on retiring 150 legacy systems
NEMAIS solution is consistent with the Future Logistics Enterprise (FLE) Domain Architecture and the Financial Management Enterprise Architecture (FMEA), which is now called the Business Enterprise Architecture (BEA); NEMAIS passed BEA-LOG compliancy certification in May 2003
NEMAIS integrated data base now includes data from 215 Navy ships (non-nuclear only)
More than 76,000 jobs have been inducted into the system, of which more than 54,000 have been completed
Material inventory savings achieved from identification, redirection and reduction of “gold piles” (unused parts left over from previous jobs)
18 military personnel reassigned from administrative and support to direct maintenance and repair (production) work (June '02 - June '03 Mid-Atlantic Region only)
Eliminated paper funding documents
Total actual benefits of NEMAIS in Mid-Atlantic Region, including above = $6.33 million
Legacy system reduction: 3 local unique information systems discontinued to date (June '02 - June '03 Mid-Atlantic Region only). NEMAIS is JFMIP compliant, capable of replacing hundreds of legacy systems, applications and manual processes
Core processes reduced in number from 203 in legacy to 91 in NEMAIS; support processes reduced from 132 in legacy to 112 in NEMAIS
System automatically prevents over obligation of funds: warning at 85% obligation, “All Stop” at 100% obligation
NEMAIS is a single, common maintenance process fully consistent with SHIPMAIN vision of entitlement (CFT1)
NEMAIS is building the I-Level Master Specification Catalogue (MSC) (CFT2)
(ERP Newsletter Issue 1, 2004, P. 4)
3. SIGMA (Program Management) SIGMA was first implemented in October of 2002. SIGMA has become the
system of record for NAVAIR’s Financials, Program Management, Time and

54
Attendance, Awards, Training and Employee Performance Evaluations. SIGMA
provides accurate real-time information in one integrated system. The project
encompasses a financial system of record for a 23 billion dollar annual budget. Over
20,000 users at 10 primary sites and 126 global locations share common processes and
business rules, a single set of data, and near real-time access to career development and
training human resources information. SIGMA is comprised of SAP core software with
“bolt-on” software packages to handle tasks such as Activity Based Costing, government
form generation and document management. SIGMA ERP also interfaces to 18
mandated legacy DoD and DoN systems. Specific accomplishments include:
Operational ~1½ years with more than 19,000 users at 10 primary sites and 126 global locations
Fully operational Disaster Recovery System in place
Sigma is operated within the NMCI environment
Retired 51 of 79 planned legacy systems
Financial system of record for entire $23 billion annual budget
NAVAIR Travel System is fully integrated with Sigma for Human Resources and Financials
Standard Procurement System (SPS) is fully integrated with Sigma for Financials and Procurement
Financial statements available within 48 hours of period close
(ERP Newsletter Issue 1, 2004, P. 2)
4. SMART (Supply Maintenance Aviation Re-engineering Team) First implemented in the fall of 2002 and Sponsored by NAVAIR/ NAVSEA,
SMART is designed to replace legacy supply, maintenance and financial management
systems with a modern, responsive, accurate and integrated system. (Issue 1, 2004, P. 4)
This pilot has demonstrated improved capabilities in repair turn-around time, Inventory
management, Data accuracy, and Financial recording and Reports development. Once
again the Vendor for the core software was SAP. Specific accomplishments to date
include:
Integrated Supply, Maintenance, Financials in one software suite
Wholesale and Retail supply in one database, enabling Multi-Echelon Sparing

55
Hosting and desktop support within NMCI enclave
NADEP scheduling, ATP and ICP Repair Planning / Funding Collaborative
CFO Compliant Financials (FMB Blue Book satisfied)
Ran first-ever Constrained Budget Plan in March 2003, which improved supply and maintenance decision-making based on constrained budgets
Finite (exact date) delivery of spares and repair orders enables Availability-to-Promise delivery to customer
Moving Average Cost of assets incorporated (vs. one price per item)
FY 03 closeout accomplished within 33 hours
(ERP Newsletter Issue 1, 2004, P. 4)
C. NAVY ERP CONVERGENCE In January 2003 the decision was made to realign the four pilot programs under
one Program Management Office (PMO) and to “converge” the four projects into one
Navy ERP Program. (Brief, 13 May 2004) This decision demonstrates the Navy’s
commitment to conform to a broader enterprise view and will required strong leadership
and involvement from all stakeholders at all levels of the DON. In February 2004, five
Process Councils were formed to direct the process changes required to standardize
operations Navy-wide and enable the Navy to reap the most benefit from its ERP
solution. The Navy will phase out funding in accordance with Table XX with 100% of
the funding being allocated to the Converged ERP program by FY2009. They will
converge the pilot programs into an integrated solution. From a civilian organizational
perspective; the Navy went live with 4 divisions of the organization and will now merge
the division solutions into one well planned program and risk minimizing approach.

134.0158.1133.4148.0156.6198.3182.0265.5Total ERP Program134.0158.1133.4137.2109.0125.068.958.9Total Converged ERP85.285.476.761.726.16.80.00.0Sustainment48.872.756.774.938.542.12.815.4Deployment0.00.00.00.644.476.266.143.5Development
Converged ERP
0.00.00.011.945.070.7108.5214.2Subtotal0.00.00.01.66.46.46.47.5CABRILLO0.00.00.00.00.00.010.770.9SMART0.00.00.00.06.330.053.671.6NEMAIS0.00.00.010.332.334.337.864.2SIGMA
Legacy ERP SystemsFY11FY10FY09FY08FY07FY06FY05FY04TY $M
Figure 11 Legacy/Convergence Transition Funding Plan (From: Stone, 2004, P. 11)
Key Events
Developmental Test & Evaluation (DT&E)
Operational Test & Evaluation (OT&E)
Supply
Aviation
Maritime
FMB/N8/Echelon 2
Dep
loym
ents
21 2 4 1 3 4 1 2 3 4 41 2 33 41 2 31 2 43FY06FY05 FY07 FY08 FY09FY04
Plant Supply Activities
NAVICP
AIMDs
SSC SD
NAWC
RMCs
NAVAIR HQ
Rel 1.1 – Adds Wholesale Supply
Rel 1.0Rel 1.1
Rel 1.0Rel 1.1
Rel 1.X – Adds U2
Rel 1.X
Rel 1.X
FISCs
SPAWAR HQNAVSEA HQ
NAVSUP HQ
NSWCs / NSLC
Other SSCs
Rel 1.0 - Pilot Functionality
FY11FOCFY11FOCFY11FOC
OT-B1 OT-B2 OT-C1
OT-B1 OT-B2 OT-C1OT-C1OT-B1 OT-B2
Retire CABRILLO
Retire SIGMA
Program Preparation(Normalization)
Milestones & FRPDROSD Program Reviews
System Development
A/B
IPR IPR IPR IPR
C FRPDR
Retire SMART
Retire NEMAIS
Retire SMART
SUPSHIP (New Construction)
AIMD (1)
Figure 12 Legacy/Convergence Transition Timeline (From: Stone, 2004, P. 6)
56

57
VIII. CONCLUSION
The OPNAV NAPPI process improvement case study is a good example of how
process reengineering has been effectively orchestrated within the DoN. Likewise, while
not highlighted, the four ERP pilot programs each could have served as strong examples
of successful change. Information Technology played a major role in the four programs,
but little in the NAPPI program. IT should have been an enabler in the NAPPI program
but it was not stressed. This led to large numbers of man hours lost each month to
generate the monthly inputs required. Commands fell into the trap of producing the data,
rather than analyzing the data. CNAP’s Comptroller recognizes their analysts are
spending too much time obtaining and maintaining data and not enough time analyzing it.
This observance and an understanding of the Comptroller’s strategic objective helps
formulate my recommendations.
A. CNAP COMPTROLLER STRATEGIC OBJECTIVES On several walls in the CNAP comptroller department their strategic objectives
are prominently displayed. These objectives are:
1. Manage force financial resources in the most efficient manner possible to ensure that maximum force operational readiness is achieved.
2. Ensure a coordinated staff effort towards management of resources.
3. Improve and quantify management to OFC-50 funds to attain a realistic budget structure.
4. Identify force long range and intermediate requirements and factors, and integrate into departmental planning operations.
5. Upgrade/strengthen force financial management through consolidation directives, detailing procedures and providing functional guidance.
6. Enhance quantitative guidelines to measure the efficiency of resource utilization.
7. Maintain a viable “in house” training program.
(From Photo on CNAP Comptroller Office, 2004)

58
B. ERP AS AN ALTERNATIVE SOLUTION AT CNAP The CNAP Comptroller Department is as effective as anyone could expect given
the constrained and dynamic budget environment within which they operate. After
gaining an understanding of the FHP/FO funding process and completing the preliminary
on-site investigation, the following observations were noted:
Current business practices and processes could be improved upon.
Comptroller is minimally meeting their Strategic objectives
There is no documented, trainable, repeatable Budget management As-Is process in place
As discussed earlier, ERP software attempts to integrate all departments and
functions across a business onto a single computer system that can serve each
department’s (or command’s) particular need. For an enterprise view to be adopted
successfully at the CNAP level the scope of the enterprise would have to be defined to
encompass Commander Naval Forces Pacific (CINCPAC) and CNAP’s tenant
commands (Echelon 2 thru 4) as stakeholders in the reengineering process.
C. POTENTIAL BENEFITS OF ERP FOR CNAP When managing a 3.8 billion dollar budget and 3 colors of money (Air, Ship, and
Combat /Support Operations) the benefits of an ERP system are undeniable. This would
have a tremendous Return on Investment (ROI). The expected benefits for CNAP are:
Common processes and business rules as well as a single set of data across the Enterprise
Elimination of redundant processes across accounts
Eliminate Over-Obligations and obtain zero error rate in obligation of funds
Quarterly Reconciliation time reductions by orders of magnitude.
Validate compliance with the Chief Financial Officer's (CFO) Act
Financial statements and FY closeout available within 48 hours of period close
Reduce civilian end strength. Far fewer personnel would be required for accounting, auditing, and budget analysis.
Reduced contractor costs in the long term by eliminating legacy systems.
Improved real-time information to more effectively allocate scarce dollars
Provides employees near real-time access to their human resources information such as career development and training

59
Each and every one of the listed potential ERP pilot benefits to CNAP is being
realized in the targeted areas of the four Pilot ERP programs by all the stakeholders
(SPAWAR, NAVSEA/CFFC, NAVAIR, and NAVSUP). With the deployment of the
Global Template Version 1 (the first Navy convergence product) the original
stakeholders and many more will share in the combined benefits of the pilots.
D. RECOMMENDATIONS Comptroller Department is a prime candidate for process re-engineering. The
Comptroller Department strongly desires to be more effective and efficient and they
recognize the benefits of an enterprise wide solution. This project report can serve as a
template for further study. The desired end state is to provide the CNAP Comptroller
Department with a roadmap and a template to successful management of their assets
(personnel), resources (information technology, unit knowledge), in order to better meet
their seven strategic objectives. The following course of action is recommended:
1. Conduct personal interviews to get a full understanding of how the department is aligned. Better organizational alignment will help ensure everyone’s efforts are focused on work relevant to core strategic objectives of the department.
2. Develop a detailed process map that defines the optimal use of departmental resources. This will build upon the initial research conducted.
3. Define an agreed upon metric to track departmental effectiveness at meeting core strategic objectives of the department. (one example might be the obligation rate contained in the Fund Status Report).
4. Make recommendations regarding information technology’s role in meeting the department’s strategic objectives.

60
THIS PAGE INTENTIONALLY LEFT BLANK
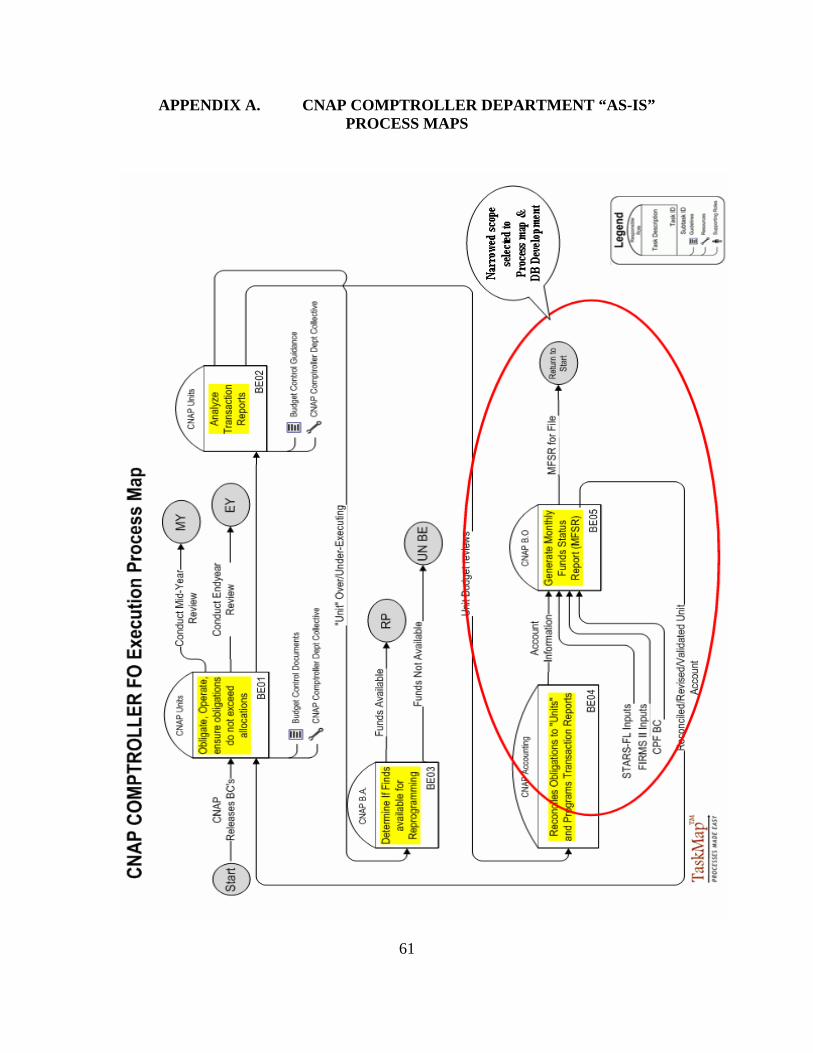
APPENDIX A. CNAP COMPTROLLER DEPARTMENT “AS-IS” PROCESS MAPS
61
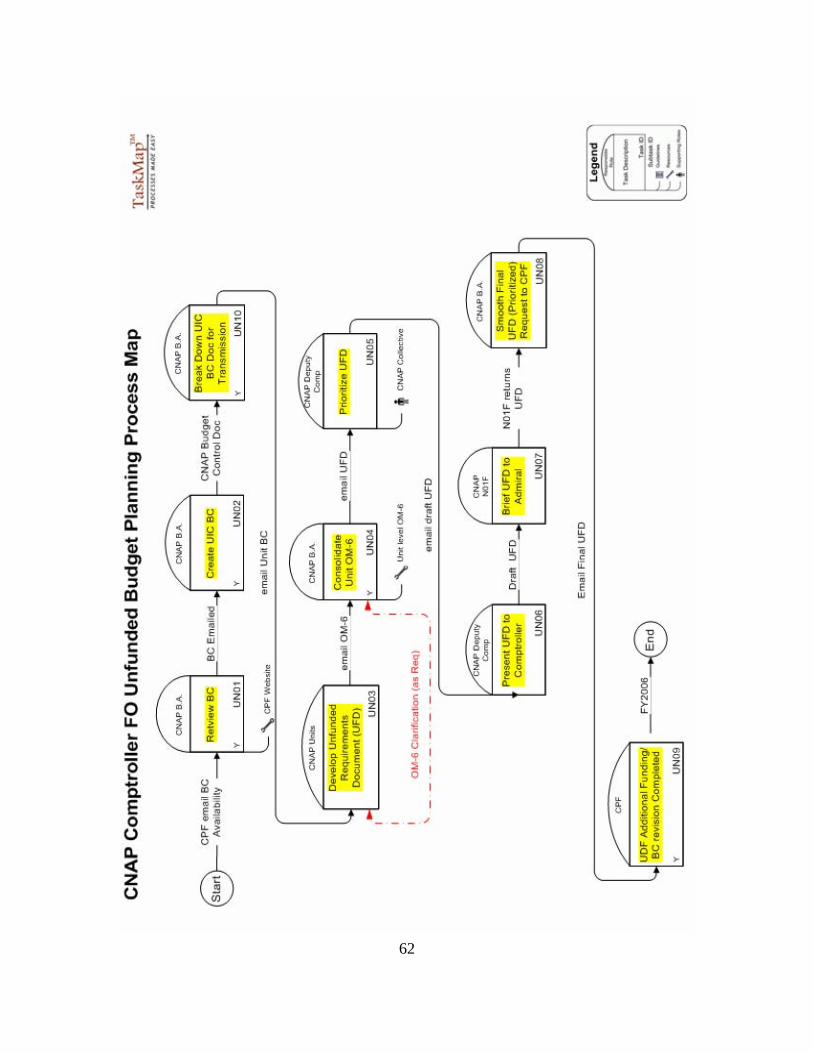
62

63

64

65

66

APPENDIX B. CNAP COMPTROLLER DEPT. FUND STATUS REPORT (FSR) “AS-IS” PROCESS MAP
67

68
THIS PAGE INTENTIONALLY LEFT BLANK

APPENDIX C. CNAP COMPTROLLER DEPT. FUND STATUS REPORT (FSR) “TO-BE” PROCESS MAP
69

70
THIS PAGE INTENTIONALLY LEFT BLANK

APPENDIX D. DATABASE PROTOTYPE IMAGE VIEWS
Database Schema
71

Portal Login Page
72

Current FO Budget Status Page
73

Annual FRMS Requirements Page
74

Expense Limitations Page
75

FMRS YTD Authorizations
76

FRMS FYTD OPTAR Page
77

STARS-FL Obligations Main Page
78

STARS-FL Obligations Input Page
79

STARS-FL Obligations Edit Page 1
80

STARS-FL Obligations Edit Page 2
81

82
THIS PAGE INTENTIONALLY LEFT BLANK

83
LIST OF REFERENCES
ASN (RD&A). Business Process Metrics Help Fleet Reap ERP Benefits. Navy ERP Newsletter, Issue 2. PP 2. July 2004
ASN (RD&A). Navy Holds Configuration Board. Navy ERP Newsletter, Issue 2. PP 1-3. July 2004
ASN (RD&A). SECNAV Approves Establishment of DRPM for Navy ERP Program. Navy ERP Newsletter, Issue 2. PP 1. July 2004
Author UNK. Clinger-Cohen Act Compliancy Report. Retrieved from: [http://www.dfas.mil/technology/pal/ssps/doc-stds/spm065.doc]. 2001
Author UNK. “ERP An Approach to Enterprise Integration in the DoD”, ODUSD (L&MR) LSM. Retrieved from: [http://www.acq.osd.mil/log/logistics_materiel_readiness/organizations/lsm/assetts/feb_02_information/erp_info/Aldridge%20ERP%20Brief%204%20May%202001%20v5.pdf]. 2001
Author UNK. Business Process Reengineering. Retrieved from: [http://www.michigan.gov/printerFriendly/0,1687,7-112-922_933---,00.html]. 2002
Author UNK. Executive Summaries Enterprise Resource Planning. Retrieved from: [http://www.cio.com/summaries/enterprise/erp/index.html?action=print]. 2003
Author UNK. IT Transformation Targets Readiness as Top Priority. Retrieved from: [http://www.sap.info/index.php4?ACTION=noframe&url=http://www.sap.info/public/en/article.php4/Article-237844122f5b224d65/en]. 2004
Author UNK. History and Accomplishments of the Four Production Systems. Navy ERP Newsletter, Issue 1. PP 1-4. 2004
Author UNK. Process Council Issues Single Company Code Decision. Navy ERP Newsletter, Issue 3. PP 2. 2004
Author UNK. What is the significance to the Program of the Milestone A/B decision. Navy ERP Newsletter, Issue 3. PP 1-2. 2004
Author UNK. (UNK) ERP Concepts and Cases. Retrieved from: [http://www.icfaipress.org/books/ERP_Concepts_Cases.asp]
Author UNK. (UNK). History of U.S. Navy Enterprise Resource Planning. Retrieved from:[http://www.erp.navy.mil/index.htm]
84
Bourgeos, P J. Flying Hour Cost Estimating at COMNAVAIRPAC. Unpublished master's thesis, Naval Postgraduate School, Monterey, CA. 2002
Brock J., Finedore, J. GAO Business Process Reengineering Assessment Guide. GAO/AIMD-10.1.15. 1997
Chatzkel, Jay and Paul R. Popick, Reengineering Experiments in Three Federal Organizations. In The Quality Yearbook, New York, McGraw-Hill, Inc. 1995
Chatzkel, Jay and Popick Paul. eengineering Experiments in Three Federal Organizations. Retrieved from: [http://www.progressivepractices.com]. UNK
Chief Information Officer.Com URL. Enterprise Resource Planning Executive Overview. Retrieved from : [http://www.cio.com/summaries/enterprise/erp/index.html]. 2004
CINCPACFLT Staff Document. Appendix C. Description of FO Programs. UNK
CNAF. COMNAVAIRFORINST 3500.1 Squadron Training and Readiness Manual. San Diego, CA: CNAF. 2002
CNAP Comptroller Site Visit. Assignment of Program Elements (PE) Document. August 2004
Cochran, C.B. and Sondheimer. Introduction To Defense Acquisition Management Sixth Edition. Defense Acquisition University Press, Fort Belvior, Virginia. PP 68-70. 2003
Collins James C.; Porras, J. Built to Last – Successful Habits of Visionary Companies. Harper Collins. 1994
Dougherty, Joe. NAVSUP Enterprise Resource Planning (ERP). Presentation Retrieved from: [http://www.navsup.navy.mil/npi/our_team/hq/org/04/scm/ppt/retro/ERP.ppt]. 2003
Emmel, W. Community Update Brief. PowerPoint handout. HSL-49 wardroom. 1999
England, Gordan, Secretary of the Navy, Clark, Vern Admiral, US Navy. Sea Enterprise: Capturing Business Efficiencies. Naval Power 21…A Naval Vision Document. 2002
Jakovljevic, P.J. The Essential of ERP – Its Genesis & Future. Retrieved from: [http://www.technologyevaluation.com/Research/ResearchHighlights/BusinessApplications/2000/12/research_notes/TU_BA_PJ_12_26_00_1.asp]. 2000
Jones, J., Aguirre, D., and Calderone M. 10 Principles of Change Management. Retrieved from: [http://www.strategy-business.com/resiliencereport/resilience/rr00006?pg=all&tid=230]. UNK

85
Jones, L.R. Public Management: Institutional Renewal for the Twenty-First Century Vol 10. PP 47-106. Stamford: JAI Press Inc. 1999
Jones, L.R., McCaffery, J.L.. Appendix B: Budgeting and Financial Management in the Federal Government. Greenwich, Connecticut. Information Age Publishing: PP 423-441. 2001
Keating, P. J., & Paulk, D. A. Examination of the flying hour program (FHP) budgeting process and an analysis of Commander Naval Air Forces Pacific (CNAP) FHP funding. Unpublished master's thesis, Naval Postgraduate School, Monterey, CA. 1998
Koch, C. The ABCs of ERP. Retrieved from: [http://www.cio.com/research/erp/edit/erpbasics.html]. 2002
LCPowers website. Author UNK. LC Powers Process Improvement website. Retrieved from: [http://www.lcpowers.com/whatispi.htm]. 2004
Martin, B. Leading Organizational Change. MSGL 505 Class handout. University of San Diego. 2002
Martin, B. Organizational Structure and Design. MSGL 505 Class handout. University of San Diego. 2002
McCaffery, J. L., & Jones, L. R. Budgeting and financial management for national defense. Greenwich, CT: Information Age Publishing. 2003
Miles, C., Deputy Comptroller. Commander Naval Air Force, San Diego, California, interview during onsite visit August 2004. 2004
N88, home. NAPPI Background and Talking Points. Retrieved from NAPPI Web page: [http://www.hq.navy.mil/airwarfare/navysite/navhome.htm]. 2000
O&MN AGSAG Descriptions. CNAP. Comptroller Phone Conference. August 2004
Rosas, S., Budget & Fiscal Policy Analyst. Commander Naval Air Force, San Diego, California, interview during onsite visit August 2004. 2004
Rosenthal, R. Navy Enterprise Resource Planning (ERP) Presentation to Admiral D. Stone, COMNAVSUP. 2004
Rosenthal, R., Frye, B., Fitzpatrick, K., and Petz, M. Navy ERP Project Overview. Presentation to Association For Enterprise Integration Conference. 2002
Sharitz, Jay M.; Ott Steven J. Classics of Organization Theory. Harcourt College Publishers. 2001

86
THIS PAGE INTENTIONALLY LEFT BLANK

87
INITIAL DISTRIBUTION LIST
1. Defense Technical Information Center Ft. Belvoir, Virginia
2. Dudley Knox Library Naval Postgraduate School Monterey, California
3. Lawrence R. Jones Naval Postgraduate School Monterey, California
4. Glenn R. Cook Naval Postgraduate School Monterey, California
5. William M. Emmel Naval Postgraduate School Monterey, California