naval postgraduate school - dtic.mil relationship diagram ... the logistics and maintenance of the...
TRANSCRIPT

NAVAL POSTGRADUATE
SCHOOL
MONTEREY, CALIFORNIA
THESIS
Approved for public release; distribution is unlimited
THE INTERNATIONAL SPACE STATION COMPARATIVE MAINTENANCE ANALYSIS MODEL (CMAM)
by
Brian T. Soldon
September 2004
Thesis Advisor: Chirold Epp Second Reader: Daniel Bursch

THIS PAGE INTENTIONALLY LEFT BLANK

i
REPORT DOCUMENTATION PAGE Form Approved OMB No. 0704-0188 Public reporting burden for this collection of information is estimated to average 1 hour per response, including the time for reviewing instruction, searching existing data sources, gathering and maintaining the data needed, and completing and reviewing the collection of information. Send comments regarding this burden estimate or any other aspect of this collection of information, including suggestions for reducing this burden, to Washington headquarters Services, Directorate for Information Operations and Reports, 1215 Jefferson Davis Highway, Suite 1204, Arlington, VA 22202-4302, and to the Office of Management and Budget, Paperwork Reduction Project (0704-0188) Washington DC 20503. 1. AGENCY USE ONLY (Leave blank)
2. REPORT DATE September 2004
3. REPORT TYPE AND DATES COVERED Master’s Thesis
4. TITLE AND SUBTITLE: The International Space Station Comparative Maintenance Analysis Model (CMAM) 6. AUTHOR(S):MAJ Brian T. Soldon
5. FUNDING NUMBERS
7. PERFORMING ORGANIZATION NAME(S) AND ADDRESS(ES) Naval Postgraduate School Monterey, CA 93943-5000
8. PERFORMING ORGANIZATION REPORT NUMBER
9. SPONSORING /MONITORING AGENCY NAME(S) AND ADDRESS(ES)
N/A
10. SPONSORING/MONITORING AGENCY REPORT NUMBER
11. SUPPLEMENTARY NOTES The views expressed in this thesis are those of the author and do not reflect the official policy or position of the Department of Defense or the U.S. Government. 12a. DISTRIBUTION / AVAILABILITY STATEMENT Approved for public release; distribution is unlimited
12b. DISTRIBUTION CODE A
13. ABSTRACT (maximum 200 words) The following thesis describes the current model (the Reliability and Maintainability Assessment Tool –
RMAT) used by NASA and related prime contractors for the forecasting of Orbital Replacement Unit (ORU) failure rates and associated maintenance demands for the International Space Station (ISS). A new model (the Comparative Maintenance Analysis Tool – CMAM) is introduced and developed for replicating some of the basic functionality of RMAT in order to provide a comparative look at RMAT results. The CMAM program, developed in Visual Basic.net and dynamically linked to a Microsoft ACCESS database, focuses on a representative set of critical Orbital Replacement Units (ORUs that represent key items that require both internal and external maintenance in both pressurized and un- pressurized storage) and generated failure rate data for each critical ORU. The results of the CMAM model are then compared with the failure rates generated by RMAT program for the same set of critical ORUs. These two independently developed sets of data are then analyzed against historic failure rates for these ISS parts.
The results of this analysis are used to conduct a sensitivity analysis of both the CMAM and RMAT programs in order to help identify the primary contributing factors behind divergence issues between forecasted / predicted failures and associated maintenance from actual (historical) failure rates.
Recommendations are provided, based upon the results of the comparison, with respect to the sensitivity of RMAT to changes in certain input parameters, as well as on the feasibility of implementing CMAM as a comparative tool for use by both NASA and Boeing L&M personnel for the purpose of RMAT sensitivity analysis, as well as use in initial operational planning for optimizing ORU stocking levels while awaiting more comprehensive RMAT results.
15. NUMBER OF PAGES 77
14. SUBJECT TERMS: ISS, CMAM, RMAT, ORU, NASA, JSC, LSAR, IVA, EVA, EVR, CM, PM, FORTRAN, VB.NET, EXCEL, ACCESS, EXCEL, Crystal Ball, GUI, MTBF, MTTR, MTBMA 16. PRICE CODE
17. SECURITY CLASSIFICATION OF REPORT
Unclassified
18. SECURITY CLASSIFICATION OF THIS PAGE
Unclassified
19. SECURITY CLASSIFICATION OF ABSTRACT
Unclassified
20. LIMITATION OF ABSTRACT
UL
NSN 7540-01-280-5500 Standard Form 298 (Rev. 2-89) Prescribed by ANSI Std. 239-18

ii
THIS PAGE INTENTIONALLY LEFT BLANK
iii
Approved for public release; distribution is unlimited
THE INTERNATIONAL SPACE STATION COMPARATIVE MAINTENANCE ANALYSIS MODEL (CMAM)
Brian T. Soldon Major, United States Army
B.S., United States Military Academy, 1993
Submitted in partial fulfillment of the requirements for the degree of
MASTER OF SCIENCE IN SPACE SYSTEMS OPERATIONS
from the
NAVAL POSTGRADUATE SCHOOL September 2004
Author: Brian T. Soldon
Approved by: Chirold Epp Thesis Advisor
Daniel Bursch Second Reader
Rudy Panholzer Chairman, Space Systems Academic Group

iv
THIS PAGE INTENTIONALLY LEFT BLANK
v
ABSTRACT The National Aeronautic and Space Administration (NASA) and its prime
contractors currently use a software tool called RMAT (the Reliability and
Maintainability Assessment Tool) for the forecasting of Orbital Replacement Unit
(ORU) failure rates and associated maintenance demands for the International
Space Station (ISS). This thesis introduces a new model: CMAM (the
Comparative Maintenance Analysis Tool), which was developed to replicate
some of the basic functionality of RMAT in order to provide a comparative look at
RMAT results. The CMAM program, developed in Visual Basic.net and
dynamically linked to a Microsoft ACCESS database, focuses on a
representative set of critical Orbital Replacement Units (ORUs that represent key
items that require both internal and external maintenance in both pressurized and
un-pressurized storage) and generated failure rate data for each critical ORU.
The results of the CMAM model are then compared with the failure rates
generated by RMAT program for the same set of critical ORUs. These two
independently developed sets of data are then analyzed against historic failure
rates for these ISS parts.
The results of this analysis are used to conduct a sensitivity analysis of
both the CMAM and RMAT programs in order to help identify the primary
contributing factors behind divergence issues between forecasted failures and
associated maintenance from actual (historical) failure rates.
Recommendations are provided, based upon the results of the
comparison, with respect to the sensitivity of RMAT to changes in certain input
parameters, as well as on the feasibility of implementing CMAM as a
comparative tool for use by both NASA and Boeing Logistics and Maintenance
(L&M) personnel for the purpose of RMAT sensitivity analysis, as well as use in
initial operational planning for optimizing ORU stocking levels while awaiting
more comprehensive RMAT results.

vi
THIS PAGE INTENTIONALLY LEFT BLANK

vii
TABLE OF CONTENTS I. INTRODUCTION............................................................................................. 1
A. PURPOSE............................................................................................ 1 B. LOGISTICS AND MAINTENANCE OF THE ISS ................................. 2 C. LOGISTICS SUPPORTABILITY ASSESSMENT ................................ 3 D. PREDICTIVE ANALYSIS USING RMAT ............................................. 6 E. OVERALL RESULTS FROM RMAT.................................................... 8
II. CMAM DEVELOPMENT............................................................................... 11 A. OVERVIEW ........................................................................................ 11 B. CMAM ................................................................................................ 12
1. Basic Functionality................................................................ 12 2. Database Connectivity .......................................................... 15 3. CMAM Distributions .............................................................. 16
a. Overview...................................................................... 16 b. The Exponential Distribution ..................................... 16 c. The Weibull Distribution............................................. 17
4. CMAM Algorithms.................................................................. 21 a. The Rutherford Equation............................................ 21 b. The Gamma Function ................................................. 23
5. CMAM Output......................................................................... 24
III. RMAT SENSITIVITY ANALYSIS.................................................................. 27 A. RMAT VERSUS CMAM OUTPUT COMPARISON............................ 27 B. CMAM UNCERTAINTY USING CRYSTAL BALL ............................. 34
1. Purpose of Crystal Ball Simulation Package....................... 35 2. Assumptions .......................................................................... 35 3. Crystal Ball Results ............................................................... 36
IV. RECOMMENDATIONS AND CONCLUSIONS............................................. 39 A. RECOMMENDATION FOR CMAM USE ........................................... 39 B. RECOMMENDATION FOR FOLLOW-ON RESEARCH.................... 40 C. CONCLUSION ................................................................................... 40
APPENDIX A. CMAM DATABASE........................................................................ 43 A. INTRODUCTION................................................................................ 43 B. ASSUMPTIONS AND REQUIREMENTS........................................... 43
Stakeholders..................................................................................... 43 Query Requirements ........................................................................ 43
C. RELATIONS, RELATIONSHIPS, AND CONSTRAINTS ................... 43 Entity Relationship Diagram (ERD)................................................. 44 Table/Column Diagram .................................................................... 44 Microsoft Access Relationships ..................................................... 44
D. USER INTERFACE............................................................................ 47
APPENDIX B. LIST OF ABBREVIATIONS AND ACRONYMS ............................. 49

viii
LIST OF REFERENCES.......................................................................................... 53
BIBLIOGRAPHY ..................................................................................................... 55
INITIAL DISTRIBUTION LIST ................................................................................. 57
ix
LIST OF FIGURES
Figure 1. ORU life-cycle failures versus time (from: Beardmore)........................ 8 Figure 2. CMAM Functionality Diagram............................................................. 12 Figure 3. RMAT Functionality Diagram (from: The Boeing Company).............. 14 Figure 4. Exponential Distribution Equations (from: Walpole)............................ 17 Figure 5. Weibull Distribution Equations (from: Walpole) ................................. 18 Figure 6. Weibull Distribution Example, Beta = 1 .............................................. 19 Figure 7. Weibull Distribution Example, Beta = 5 .............................................. 20 Figure 8. Rutherford Equations (from: McDonnell Douglas Space Systems) .... 22 Figure 9. Gamma Function (from: Walpole)....................................................... 23 Figure 10. Stirling’s Asymptotic Series (from: Beyer) .......................................... 23 Figure 11. CMAM Output screen ......................................................................... 25 Figure 12. RMAT CMG Maintenance Action forecasts w/ and w/o PM................ 33 Figure 13. CMAM Steady State Output Results .................................................. 36 Figure 14. Crystal Ball ®_ Output results ............................................................ 37 Figure 15. CMAM ORU Database ERD............................................................... 45 Figure 16. CMAM ORU Database Table/Column Diagram ................................. 46 Figure 17. CMAM ORU Microsoft Access Relationship....................................... 46 Figure 18. CMAM ORULIST Table User Interface............................................... 47 Figure 19. CMAM FLIGHT Table User Interface ................................................. 48

x
THIS PAGE INTENTIONALLY LEFT BLANK
xi
LIST OF TABLES
Table 1. RMAT Input parameters ..................................................................... 27 Table 2. RMAT Maintenance Action output results .......................................... 28 Table 3. CMAM Maintenance Action Output results......................................... 30 Table 4. CMAM CMG Maintenance Action forecasts w/ and w/o PM............... 31

xii
THIS PAGE INTENTIONALLY LEFT BLANK

xiii
ACKNOWLEDGMENTS I would like to thank the following individuals for their assistance in the
research and development of this thesis. Their professionalism and expertise
where critical in the areas of understanding both NASA and Boeing Logistics and
Maintenance (L&M) tasks in reference to the International Space Station, and in
the understanding of how reliability tools are used in relation to ISS L&M planning
and management:
Mr. Anthony J. Butina Sr. (NASA ISS Logistics and Maintenance,
Houston, TX)
Mr. Paul A. Rathbun (NASA ISS Logistics and Maintenance, Houston, TX)
Mr. Jesse Astorga (Boeing ISS Logistics and Maintenance, Houston, TX)

xiv
THIS PAGE INTENTIONALLY LEFT BLANK

xv
EXECUTIVE SUMMARY
The logistics and maintenance of the International Space Station (ISS) is a
one of a kind system with over 5700 orbital replacement units (ORUs)1, and
spare parts that number into the hundreds of thousands. Parts for the ISS come
from 127 major US vendors and 70 major international vendors. It is the
responsibility of the International Space Station Logistics and Maintenance (L&M)
organization at Johnson Space Center in Houston Texas to integrate and test
these spares before either delivery to the ISS or ground spare storage.
The objective of the ISS L&M organization is to define, procure, deliver,
and manage the resources required to support and maintain ISS systems and
support equipment both on-orbit and on the ground during assembly and
assembly complete operations of the ISS. In order to meet this objective NASA
ISS L&M must maintain a comprehensive ORU and spares database with up to
date reliability data for use in predicting and evaluating on-orbit, and ground
spares requirements.
The primary tool used for this purpose is the Reliability and Maintainability
Assessment Tool (RMAT). RMAT is a simulation tool that generates ORU
failures, quantifies corrective and preventative maintenance requirements, and
quantifies ISS resources needed to restore the ISS to an operational state.
RMAT is the ISS Program/GAO accepted2 tool for conducting maintenance
prediction analysis and trade studies, and, when used in concert with an accurate
and updated ORU database, as well as with other tools such as Steady State3
spreadsheets, provides a robust set of forecast data. However, RMAT is a
1 Although the total number of ORUs is estimated at 5700 the ORU database (MADS) lists
1379 unique ORU types available for reliability analysis. 2 The U.S. General Accounting Office (GAO) is the investigative arm of Congress whose
mission is to execute audits, surveys, investigations and evaluations of Government programs to support oversight and funding decisions
3 ISS Steady State is defined as after Assembly Complete (AC) operations

xvi
complex program written in an obsolete programming language (FORTRAN77)
that requires a high degree of user familiarity in order to produce meaningful
results, and to summarize those results for decision-making purposes. RMAT
requires the preparation of multiple text-based input files that can be and often is,
extremely time consuming. Additionally, while recent analysis of actual versus
predicted internal ORU failures shows a reasonable amount of correlation,
external ORU failures show an increasing divergence between RMAT forecasted
failures and actual failures.
The ISS Comparative Maintenance Analysis Model (CMAM) was
developed to replicate some of the basic functionality of RMAT in the areas of
Corrective and Preventative ORU failure rate forecasts and required crew
maintenance time requirements in order to:
-Gain an understanding of the underlying algorithms used by RMAT for
failure rate generation
-Provide a user friendly Graphical User Interface (GUI) based program
that allows for the generation of a basic set of comparative results against the
more complex and comprehensive RMAT forecasts
-Conduct a sensitivity analysis on both CMAM and RMAT results in order
to identify why divergence issues have arisen between external failure rates and
actual failure rates while internal failure rate forecasts remain relatively accurate.
The CMAM program developed during this thesis study is a Visual
Basic.Net (VB.net) based program that allows for the concurrent editing of an
Access based ORU database, the querying of the ORU database for analysis of
specific sets of ORUs, and the subsequent generation of corrective maintenance
(CM) and preventative maintenance (PM) failure rate data for that set of ORUs.
To analyze the inherent uncertainties of CMAM results, a representative
set of ORUs was chosen from the comprehensive ORU database (MADS)4. The
4 MADS or the Modeling Analysis Data Set is the comprehensive ORU data set with associated ORU reliability data. It is the primary responsibility of NASA R&M to update MADS and it is used extensively by NASA and Boeing L&M teams for reliability analysis.

xvii
representative set of ORUs consists of 60 internal, and 60 external ORUs with
the highest criticality code (C1)5, and heaviest by weight to orbit6. This set of
ORUs was assumed to have the same generic failure distribution characteristics
as the entire set of ISS ORUs.
Comparison of CMAM and RMAT results in terms of these 120 ORUs
shows a 7.5% discrepancy in failure rates when looked at over the life of the ISS.
Additionally, external ORU failure rate predictions of the two programs are within
2%, internal failure rate forecasts show an approximate 8% difference (CMAM
and RMAT show a relatively close correlation when overall failure rates are
compared.
The CMAM program is most sensitive to changes in Preventative
Maintenance timeframes for short MTBF (Mean Time Between Failure)7 ORUs
when wear-out failures are modeled. Since failure rates for wear-out failures
using a Weibull distribution increase exponentially towards the end of life of an
ORU it is imperative to conduct preventative maintenance of these parts in a
timely manner. If short MTBF ORUs are allowed to operate until failure (w/o
preventative maintenance) these parts will produce very high failure rates in the
forecast model. Analysis of the 120 ORUs within the CMAM database reveals
that the majority of planned PM is for internal ORUs while external parts are
more often allowed to operate past predicted failure (based upon criticality of
component). Since RMAT uses a similar Weibull distribution algorithm and
similar shape factors8, and if the critical ORU list used for CMAM results is
considered to be “representative” of the entire ORU list used by RMAT – then it
can be assumed that RMAT is also sensitive to Preventative maintenance
5 Criticality Code 1 (C1) is defined as a single point failure that could result in loss of Space
Station or loss of flight or ground personnel. 6 Weight to orbit was an arbitrary choice for ORU set analysis, and was made early in this
research due to ORU/spare up-mass to the ISS being such a critical factor at this time. 7 MTBF for this thesis is defined as the average time (in hours) that a component works
without failure. 8 The Weibull distribution often used to model wear-out failures of components has three
parameters: location, size and shape.

xviii
scheduling, especially for external ORUs. This sensitivity, along with inherent
uncertainty of ORU MTBF values may be enough to explain the divergence
issues between external failure rates and actual failures. The results of this
sensitivity analysis are discussed in detail within this thesis.
CMAM could potentially be used in concert with RMAT to provide a “first
cut” forecast of ISS ORU failures and crew requirements to give L&M planners a
general idea of what failures they can expect while waiting for the comprehensive
RMAT results. CMAM results can also be used as a sensitivity check of RMAT
for random, and wear-out failure modes for predictions of required corrective and
preventative maintenance actions. These comparative results could lead to the
rapid determination (and the corresponding correction) of future divergence
issues between RMAT results and historical (actual) ORU failure rates.

1
I. INTRODUCTION
A. PURPOSE Assembly of the International Space Station (ISS) began in November
1998 and will continue until completion sometime around 2010. During assembly
and over the ISS’s nominal 10 year lifetime it will serve as an orbital platform for
the United States and International Partners to make advances in microgravity,
space life, and earth sciences, as well as engineering research and technology
development. The utilization of the ISS for creating knowledge and technology is
an enterprise that not only requires the initial construction of a safe and viable
orbiting laboratory, but also requires the maintenance of this one-of-a-kind
system on a continuous basis in order to optimize the functional availability of
systems required for both experimentation, and crew life support.
The ISS Logistics and Maintenance (L&M) Organization has the following
philosophy:
The ISS does not have any landing gear, is not a satellite exploring the solar system, it has no International borders, and it has no organizational lines. It is one Station, that must be supported by ONE crew, twenty-four hours a day, seven days a week, three-hundred and sixty-five days a year.9
With this in mind the NASA and Boeing L&M teams rely upon developed, tested,
and proven modeling programs in order to forecast Orbital Replacement Unit
(ORU) failure data and associated maintenance requirements for use in
operational planning and to determine if the ISS is logistically supportable in
current and future configurations. The primary tool for ORU predictive analysis is
the RMAT program.
This thesis report describes the RMAT program used by NASA and
Boeing L&M, and introduces a new predictive tool (CMAM), developed as part of
this research, which replicates some of the basic functions of RMAT. The
objective is to gain a better understanding of the RMAT program, and to develop
9 NASA Logistics and Maintenance Overview Briefing, March 8, 2004

2
a user friendly tool for conducting quick ORU failure analysis and sensitivity
analysis of various failure parameters. These results can be used to determine
what may be the root cause of divergence issues discovered between RMAT
results and historical failures for external ISS ORUs.
B. LOGISTICS AND MAINTENANCE OF THE ISS The ISS has over 5700 orbital replacement units (ORUs), and spare parts
that number into the hundreds of thousands. Parts for the ISS come from 127
major US vendors and 70 major international vendors and in most cased require
the shipment of these parts from the prime vender (often called the Original
Equipment Manufacturer or OEM) location to Johnson Space Center (JSC) in
Houston, TX for testing, and then to Kennedy Space Center (KSC), FL for follow
on delivery to the ISS.
The objective of the ISS L&M organization is to define, procure, deliver,
and manage the resources required to support and maintain ISS systems and
support equipment both on-orbit and on the ground. The mission statement of
the L&M team is two-part:
Part I: During Design and Development Phase to define necessary
supportability requirements and to ensure they are planned for and met in order
to economically, time effectively, and safely support successful operations.
Part II: During Operations Phase to manage logistics resources and
conduct maintenance operations that ensure that the on-orbit vehicle and its
associated systems support safe, successful operations and utilization.
The On-Orbit Ops and Maintenance Re-supply section within the NASA
L&M organization is responsible for continuous monitoring of up-mass and crew
time required for maintenance and on-orbit stowage of spares both inside and
outside of the Station. This section uses a specific tool (called the Reliability
Maintainability Analysis Tool or RMAT) to help predict and evaluate all on-orbit
maintenance. ISS L&M management found that initial outputs of the RMAT
predictive model during the assembly phase (specifically from flights 2A through
12A) show that these flights, and the continued ISS operations and assembly

3
have limited failure tolerance and redundancy especially in the power and
thermal systems areas. The main goal of the On-Orbit Maintenance Re-supply
team is not simply to buy more spares but to maximize/optimize the ability to re-
supply spares quickly when needed and to store the most critical ORUs onboard
in the proper quantity during the assembly stages.
The ISS Program office has the overall responsibility for oversight of the
three main ISS contractors: Boeing, the United Space Alliance (USA), and the
Blackhawk Corporation. Boeing Logistics and Maintenance, headquartered in
Houston, TX is responsible for the production of the On-Orbit Logistics and
Supportability Assessment Report (LSAR). The On-Orbit LSAR is a bi-annual
report that uses historical data, and predictive analysis (primarily through the use
of RMAT) to make assessments of the ongoing logistic supportability of the ISS.
C. LOGISTICS SUPPORTABILITY ASSESSMENT The overall goal of the ISS L&M system is to support the Station within the
programs limited resources, to provide a safe and habitable environment for the
crew, and to minimize ISS system downtime (downtime that impacts the function
of the ISS as a research facility). To accomplish this goal the L&M personnel
provide periodic assessments to determine the resource requirements needed to
logistically support the ISS as designed and built. These requirements are
summarized in the On–Orbit Logistics Supportability Assessment Report (LSAR).
The resources for maintenance of the ISS taken into account within the LSAR
include:10
• Spares and spare parts (ORUs, and other spares)
• Launch locations for storage of spares
• Tools for performing required maintenance
• Extra-Vehicular Activity (EVA)
• Extra-Vehicular Robotic capability (EVR)
• Transportation assets for transport of supplies to the ISS In order to understand the LSAR it is important to understand the two
basic ISS maintenance types, and the ISS 3-Level Maintenance Concept.
10 This list only covers major resource items and is not all -inclusive.
4
Maintenance for the ISS will be either Corrective Maintenance (CM), or
Preventative Maintenance (PM). Corrective Maintenance is maintenance
performed to repair or replace ORUs/spare parts that fail while in service.
Preventative maintenance is maintenance performed to replace ORUs/spare
parts that have a specified operational life (in accordance with reliability data),
and have not failed yet but have reached the end of their operational effective
life.
Within the ISS 3-Level Maintenance Concept there are three levels of
maintenance: Organizational, Intermediate, and Depot maintenance.
Organizational Maintenance is either corrective maintenance by on-orbit
replaceable unit removal and replacement, or in situ repair, or preventative
through scheduled change out of items, service or inspection in order to maintain
system function in an operational condition and to prevent degradation of ISS
performance. Organizational repair can occur either on-orbit or on the ground.
Intermediate Maintenance is corrective maintenance only to repair ORUs
by disassembly, repair and reassembly, and is in response to real-time
requirements for a work-around solution. This type of maintenance is on-orbit
and internal to the ISS only.
Depot maintenance is corrective maintenance to repair/overhaul a
designated hardware item that cannot be accomplished at the other maintenance
levels (this requires broken ORUs/spare parts to be returned to earth and fixed at
either one of the 4 NASA depots, or back at the OEM facility).
Thus it can be stated that there are only two levels of on-orbit
maintenance – Organizational which consists of removal and replacement of
ORUs, in situ repair, servicing and manual fault isolation, and is conducted either
within the ISS (IVA), thru external spacewalk (EVA), or through external robotics
(EVR), and Intermediate which consists of removal and replacement of ORUs at
a maintenance work area through the application of authorized repair kits, and is
conducted IVA only.

5
The major logistics resources available to support the ISS include: ORUs/
spare parts, locations for storage of spares, tools for performing required
maintenance, Intra-Vehicular Activity (IVA), Extra-Vehicular Activity (EVA), Extra-
Vehicular Robotic capability (EVR), and transportation assets for transport of
supplies to the ISS.
It is important to note that, for the purposes of the ISS On-Orbit LSAR and
predictive analysis, the ISS post assembly complete re-supply/logistics support is
still based upon four (4) shuttle flights per year (3 defined as mixed mission
(pressurized/un-pressurized), and 1 completely un-pressurized). These four
flights are also planned for the assembly phase. The assembly phase requires a
large amount of new hardware (for assembly of the ISS) and thus much less
capability for ORUs/spares upmass. Therefore, it is expected that a supply
backlog will build up during the later stages of the assembly phase, and will take
some time to work-off upon Assembly Complete. This backlog consists of
maintenance and repair actions needed to restore the optimal functionality and
redundancy of ISS systems (to date the backlogs have consisted primarily of
non-critical ORUs since ISS on-orbit maintenance is scheduled based upon the
priority (criticality) of the task). ORU backlog is another critical element in the
predictive analysis process.
The overall goal of the L&M effort is to maximize the availability of key
functions of the ISS while maintaining a safe environment for the crew. Boeing
L&M and NASA utilize a tool called the Station Availability Reporting Tool
(START) to provide a snapshot, and running cumulative tally (monthly) of Station
hardware and functional availability. The 10 key functions looked at for this
availability report include:
• Provide usage power
• Provide CO2 removal
• Provide Intra-module Temperature and Humidity Control (THC)
• Provide Internal Thermal Control System (ITCS) Heat Transfer
• Provide Command & Telemetry (uplink/downlink)
• Provide Robotics capability
6
• Provide Payload Data Downlink
• Provide Command and control
• Provide Extra-Vehicular Activity (EVA) capability
• Provide Fire Detection/ Suppression These functions are reported in four separate ways:
• Predicted availability (shows a prediction of CURRENT availability of the function based on current sparing levels)
• Performance since activation of the function (measured)
• Performance for the last 6 months (measured)
• Availability Objective (estimated goals primarily for the performance since activation)
The supportability assessment addresses any shortcomings listed on the
functional availability reports, and also assesses whether future functional
objectives will be attainable, based primarily on predictive analysis. The primary
predictive analysis tool used in developing the LSAR is the Loral Reliability and
Maintainability Assessment Tool (RMAT).
D. PREDICTIVE ANALYSIS USING RMAT The Reliability and Maintenance Assessment Tool (RMAT) is a Monte
Carlo Based simulation tool used to project maintenance demands, including
maintenance performed and resultant backlog. The main constraints of the
RMAT program for simulation include (but are not limited to):
• Available spares
• Robotic capability
• Available weight/volume to orbit (primarily during assembly stage) RMAT also has a number of input parameters that need to be
entered in order to make predictions. There are 19 parameters that can
be altered to affect predictions. However, the primary parameters include:
• Mean Time Between Failures (MTBF) –to predict # of corrective actions needed per ORU
• Mean Time To Repair (MTTR) to predict # of crew hours needed (both CM/PM actions)
• Life Limit of ORU
• Number of crew members required to perform maintenance task

7
• Quantities (of spares on orbit)
• Reliability class (criticality)
• Duty cycle
• Frequency of Preventative Maintenance RMAT takes these constraints and input parameters and utilizes Monte
Carlo processes/mathematical algorithms to predict ORU failures, predict
corrective/preventative maintenance requirements, predict size and impact of
maintenance backlog, and predict ISS resources needed to keep the ISS in an
operational state.
RMAT uses iterative Monte Carlo simulation (primarily to account for
inherent uncertainties within ORU predicted MTBF and K-factor11 values), and
mathematical algorithms (primarily for failure distribution calculations) for
maintenance demand forecasting. An RMAT run consists of 600 iterations of a
specific set of constraints/input parameters placed into the simulation model for a
specific timeframe. The maintenance demand/result is an average of the
iterations. RMAT generates failures of three basic types:
• Infant Mortality failures: failures that occur at a higher rate early in the lifetime of the hardware.
• Random failures: failures that occur randomly throughout the life of the ISS.
• Wear-out/life limited failures: Failures occurring at a higher rate as they approach end of life.
RMAT uses the following distributions when modeling these three types of
failures:
• Exponential distribution: Random Failures
• Weibull distribution: Infant Mortality and Wear-Out failures These three failure types and their respective distributions leads to an
overall ORU life cycle curve that resembles what is called the “bathtub” curve:
11 K-factor is a multiplier that accounts for increased equipment maintenance actions not
included in the inherent MTBF estimates. See section III.C for further details.

8
Figure 1. ORU life-cycle failures versus time (from: Beardmore)
There are four primary outputs of the RMAT program:
• Predicted maintenance actions required by flight (these maintenance actions are EVA/IVA/EVR actions required in response to a failure or a scheduled preventative maintenance remove and replace (PMRR), or from required servicing/inspection activity)
• Maintenance Action Backlog (the backlog is made up of ORUs awaiting maintenance action due to a shortfall in resources (on-orbit spares/ Shuttle up-mass/shuttle flights),
• Predicted crew time for maintenance actions by flight. (This includes EVA/IVA/EVR man-hours consumed to conduct maintenance activities)
• Predicted Up-Mass requirements by flight (this includes total ORU spares weight that will be launched to conduct corrective or scheduled maintenance).
E. OVERALL RESULTS FROM RMAT Simulation results for the internal maintenance (IVA) of the ISS show
adequate support both during and post assembly. RMAT results show a slightly
negative margin between the number of maintenance actions required and the
number of maintenance actions that will be performed leading to a minimal
backlog buildup for IVA maintenance actions during the assembly stage. Since
RMAT conducts maintenance based on ORU priority, none of the ORU items
within the backlog are high criticality (C1) items. RMAT also shows a highly

9
positive margin upon assembly complete leading to the rapid work-off of this
backlog. This positive margin during post-assembly is due to the fact that more
up-mass and crew time can be allocated for spares and maintenance (as
opposed to assembly).
External maintenance (EVA/EVR) does not seem to be as well supported.
RMAT results show negative margins between maintenance required and
maintenance performed both during assembly and post assembly complete.
This will lead to a continual increase in EVA/EVR maintenance action backlog.
Specifically, RMAT predicts that the ISS will require an average of 70 external
maintenance actions per year during post assembly stage. Of these 70 an
average of 31.5 will be performed (based on available up-mass and EVA/EVR
crew times).
While RMAT seems to be predicting internal maintenance actions
relatively accurately, there is a growing divergence between RMAT external
maintenance predictions and actual/historical failures gathered to date. When
comparing RMAT predicted results to historical actuals (for both IVA and EVA
respectively) the following results were seen:
IVA: Cumulative IVA forecasted Corrective Maintenance (CM) crew times
exceeded actuals by 3%, while actual Preventative Maintenance (PM) crew times
exceed forecasts by approximately 11%. Total CM / PM actions turned out to be
within 15% of reported actuals.
EVA: Cumulative EVA forecasted CM crew times exceeded actuals by
over 95%, while forecasted PM crew times exceeded actuals by 100% (no actual
PM external activities were recorded). Average CM/PM EVA actions per year
were forecasted to be nearly 44 and 12 respectively, while only 5 EVA CM
actions were performed in total.
NASA and Boeing L&M are currently examining these divergence issues
by reviewing reliability data and RMAT model input fields in order to determine
the most sensitive aspects of the model itself and to estimate the effects of
variance resulting from inconsistencies between model and on-orbit maintenance

10
assumptions. This thesis attempts to assist in this activity by developing an
independent reliability model that replicates some of the basic functionality of
RMAT and can be used comparatively to determine what input parameters have
the greatest effect on model outputs.
11
II. CMAM DEVELOPMENT
A. OVERVIEW The ISS Comparative Maintenance Model (CMAM) is a Visual Basic.Net ®
program which calculates both corrective maintenance (CM) and preventative
maintenance (PM) action requirements for ISS Orbital Replacement Units
(ORUs) and associated crew maintenance time requirements (IVA/EVA/ EVR)12.
CMAM was developed in order to replicate some of the functionality of RMAT in
order to gain a better understanding of the algorithms used by RMAT, and to
provide a basis for assessing the sensitivity of the two programs to changes in
similar input parameters. Additionally, CMAM is meant as a user-friendly option
to the much more complex RMAT program for the understanding of general ORU
failure rate data. The process followed for CMAM development required the
development of a separate ORU database constructed in Microsoft Access ®
(see Appendix A) which was populated with a representative set13 of ORUs from
the entire NASA/BOEING L&M ORU Modeling Analysis Data Set (MADS).
Upon completion of the CMAM program, output data was gathered from both
CMAM and RMAT (based upon similar input parameters) and the results
compared. Once the two output sets were compared, a sensitivity analysis was
conducted on CMAM by altering the assumed failure rate distributions and
associated input parameters to determine the effects on output values.
Additionally, a Monte Carlo process Simulation package Crystal Ball ® was used
to quantify the uncertainties inherent within CMAM results. Finally, based upon
the similarities between the RMAT and CMAM programs for calculating a narrow
field of failure rate data, parallels were drawn between the two programs.
12 IVA is Intra-vehicle activity, EVA is Extra Vehicular Activity or “SpaceWalk”, and EVR is Extra-Vehicular Robotics.
13 60 Internal and 60 External C1 ORUs (120 total) where chosen from the MADS list that were thought to display the same failure rate trends as the entire ORU set.
12
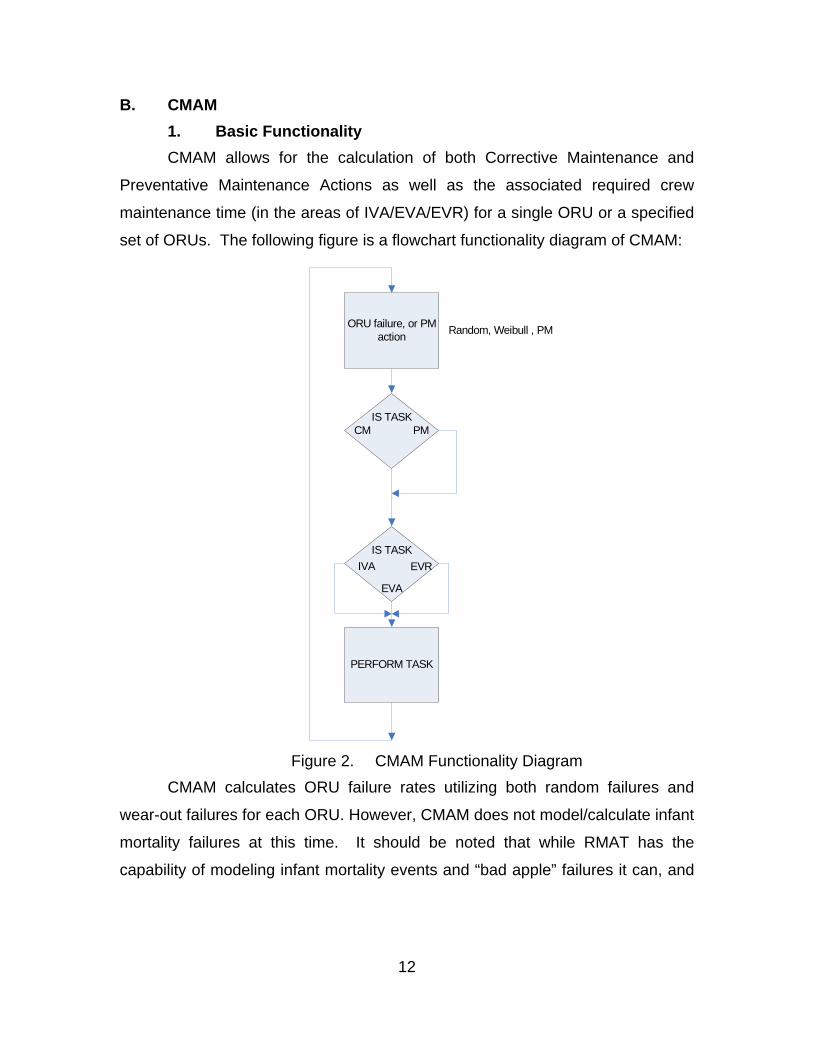
B. CMAM 1. Basic Functionality CMAM allows for the calculation of both Corrective Maintenance and
Preventative Maintenance Actions as well as the associated required crew
maintenance time (in the areas of IVA/EVA/EVR) for a single ORU or a specified
set of ORUs. The following figure is a flowchart functionality diagram of CMAM:
ORU failure, or PM action
IS TASK
IS TASK
PERFORM TASK
Random, Weibull , PM
PMCM
IVA EVR
EVA
Figure 2. CMAM Functionality Diagram
CMAM calculates ORU failure rates utilizing both random failures and
wear-out failures for each ORU. However, CMAM does not model/calculate infant
mortality failures at this time. It should be noted that while RMAT has the
capability of modeling infant mortality events and “bad apple” failures it can, and

13
often is turned off.14 Unlike RMAT, the CMAM program does not take into
account a spares list and available crew time – thus it does not calculate any
type of backlog (CM/PM maintenance action or crew time backlogs). The
following is a diagram that shows the overall functionality of the RMAT program
for comparison with CMAM:
14 Early failure modeling options within RMAT include: Fisher Price, Bad Apple, and No
Early failure options. No early failure option is often used due to ORU burn-in process conducted by part manufacturers.

14
ORU failure, or PM action
PLACED IN QUEUE
IS SPARE NEEDED?
IS SPARE AVAILABLE?
PLACE ORDER TO GROUND
GRND SPARE AVAIL?
IS TASK
IS RESOURCE AVAILABLE
(TIME)
LPDY = 180 DAYS
LPDY = 45 DAYS
LEAVE IN QUEUE & WAIT FOR
NEXT OP
CAN IT BE PACKAGEDIN CUR OP?
PERFORM TASK
DECREMENT QUEUE AND
LOG TIME
Random, Weibull , PM
PM
CM
IVA EVR
EVA
DECR. QUEUELOG TIME
REPORT NEWAVAIL TIME
DECR SPARES & PLACE ORDER
TO REPLENTISH
By Priority
N
Y
N N
YY
N
Y
Y
N
Figure 3. RMAT Functionality Diagram (from: The Boeing Company)
Lastly, CMAM is dynamically linked to a Microsoft Access ® based ORU
database which not only allows for the updating of the database from the CMAM
GUI user interface, but also allows for the real time querying of the database for

15
specific sets of ORUs for failure rate calculation. CMAM is designed with an
easy-to-use query form that has the following built-in database query types:
ORU Search By:
• Assembly Flight
• ISS Operational Year (Decimal Dated year)
• ISS Subsystem
• ORU name
• Internal or External Component
• Entire ORU Database 2. Database Connectivity The CMAM ORU database consists of three tables: an ORU master parts
list, an ISS Flight table, and an ISS Subsystem table. The ORU master parts list
and the ISS Flight table can be updated or modified from the CMAM user
interface.
The current CMAM database is populated with a “representative” set of
ORUs for comparison against RMAT and to allow for the assumption that the
primary sensitivities of this representative set will also be the primary sensitivities
of the ORU database as a whole. For the purposes of this thesis it was time
prohibitive to enter the entire MADS ORU database into the CMAM ACCESS ®
database. The MADS DB consists of approximately 1380 separate (unique)
ORUs with 59 separate fields for each ORU. The CMAM database uses only 26
of these 59 fields. Entry of all 1380 ORUs using the CMAM ORU update mask is
estimated to take between 1.5 and 2 minutes per ORU or between 34.5 and 46
hours for the entire ORU database.
The CMAM representative ORU set comprises approximately 8.7% of the
MADS database (120 ORUs) and is comprised of the highest criticality
components sorted by weight and volume (i.e. the top 60 Criticality Code 1 ORUs
with the highest volume and weight requirements to orbit where chosen from
both internal and external ORU parts lists). See Appendix 1 for further database
details.
16
3. CMAM Distributions a. Overview A user considers a system reliable if it is available and operational
when needed. From an engineering standpoint, reliability is the ability of a
system or unit to perform a required function under an assumed or stated set of
conditions, for a specified period of time. Quantifying reliability is achieved from
the concept of reliability as a probability distribution. The probability of a
component surviving to a time t is the reliability R(t), and is expressed as:
R(t) = # surviving at instant t / # at time =0
A component failure can be classified into two groups: 1.)
Degradation failures, where an important subcomponent drifts so far from original
tolerance values that the component no longer functions, or 2.) Catastrophic
failures, where the component reaches end of life. The failure rate can be
expresses as:
f(t) = # failing per unit time at instant t / # surviving at instant t
The failure rate can therefore be defined as the probability of failure in unit time
of a component that is still working satisfactorily.
CMAM assumed two types of failure rates for ORUs: a constant
failure rate (to model the random failures that occur during the intrinsic life of the
component), and an exponentially increasing failure rate (to model the wear-out
failures that occur towards end of life or towards the end of the intrinsic life of the
component). The CMAM program mimics RMAT by using the exponential
distribution to model constant rate failures, and the Weibull distribution for
modeling the increasing failure rate wear-out failures.
b. The Exponential Distribution The exponential distribution is a relatively common distribution in
reliability engineering that models the behavior of components that have a
constant failure rate and results in the component having a reliability that

17
exponentially decreases through time. The following equations show the
exponential distribution and its important characteristics:
( )
( )
Exponential Distribution (2-parameter):
failure rate = location parameter = flight decimal date
Reliability = ( )( )
Failure Rate = ( )( )
1/
( ):
t
t
R t ef t
tR t
MTBF
f t ewhere
λ γ
λ γ
λγ
λ λ
λ
λ
− −
− −
=
=
= =
=
=
⎛ ⎞⎜ ⎟⎝ ⎠
Figure 4. Exponential Distribution Equations (from: Walpole)
It is important to note that the two-parameter exponential distribution is utilized
and coded into CMAM. Since ORUs become activated at different times (flight
decimal dates) CMAM is NOT a steady state calculation program.
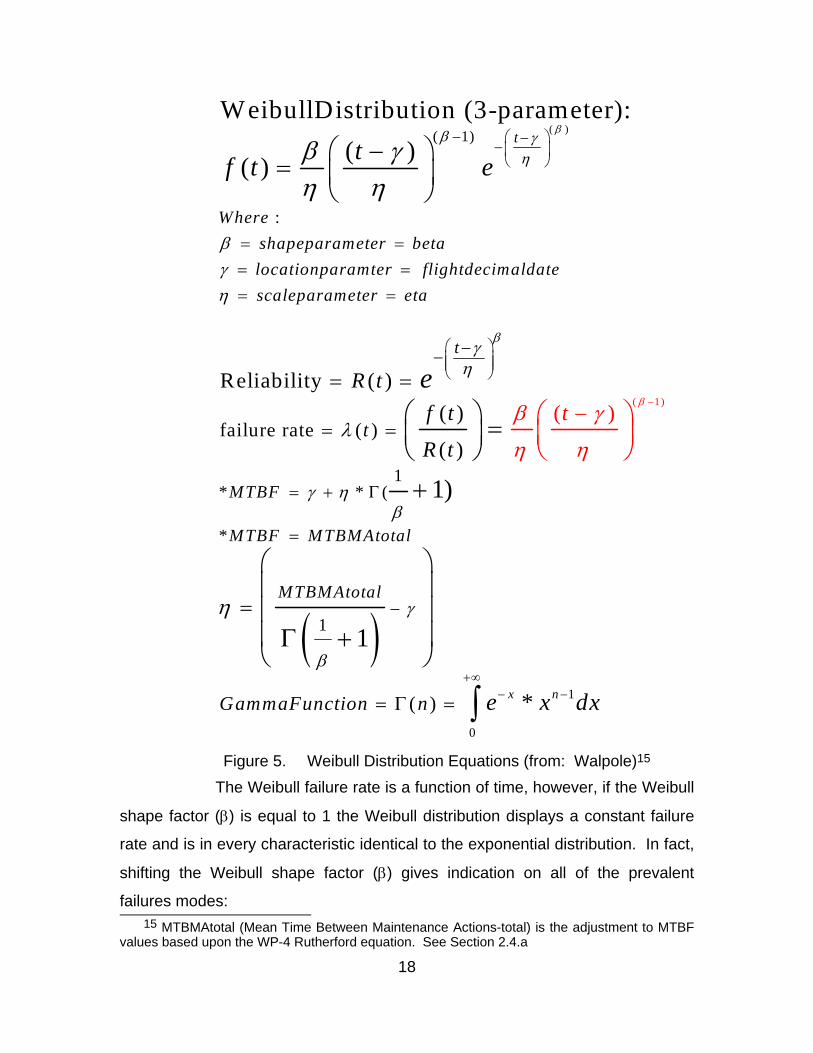
c. The Weibull Distribution The Weibull distribution is a general purpose distribution used to
model material strength, times-to-failure of electronic and mechanical
components, equipment or systems. The most general (3-parameter) case of the
Wiebull distribution was utilized in CMAM and is defined by the following
equations:
18
( )( 1)
:
failure rate
Reliability ( )
WeibullDistribution (3-parameter):( )( )
t
t
Whereshapeparameter betalocationparamter flightdecimaldatescaleparameter eta
R t
tf t e
e
β
β
β γη
γη
βγη
β γη η
− ⎛ ⎞−−⎜ ⎟⎝ ⎠
⎛ ⎞⎜ ⎟⎜ ⎟⎝ ⎠
−−
= == == =
= =
⎛ ⎞−= ⎜ ⎟
⎝ ⎠
( )
( 1 )
1
0
1* * (
*
1
( )
( )
((
(
))
)
*
1)
1
x n
MTBF
MTBF MTBMAtotal
MTBMAtotal
t
GammaFunction n
f t
R
t
t
e x dx
β
γ ηβ
γ
β
λβ γ
η
η
η
−
+∞− −
= + Γ
=
−
= =
= Γ =
−
=
⎛ ⎞ =⎜ ⎟⎝ ⎠+
⎛ ⎞⎜ ⎟⎜ ⎟⎜ ⎟Γ +⎝ ⎠
⎛ ⎞⎜ ⎟⎝ ⎠
∫
Figure 5. Weibull Distribution Equations (from: Walpole)15 The Weibull failure rate is a function of time, however, if the Weibull
shape factor (β) is equal to 1 the Weibull distribution displays a constant failure
rate and is in every characteristic identical to the exponential distribution. In fact,
shifting the Weibull shape factor (β) gives indication on all of the prevalent
failures modes:
15 MTBMAtotal (Mean Time Between Maintenance Actions-total) is the adjustment to MTBF values based upon the WP-4 Rutherford equation. See Section 2.4.a

19
• β < 1 indicates infant mortality (poor production or insufficient burn in)
• β = 1 indicates random failures
• β = 1 to 4 indicates early wear out, early fatigue
• β > 4 indicates old age or rapid wear-out at end of life
CMAM allows the user to input the desired β value and is meant to be used to
model wear-out failures – thus it is defaulted to 5 (similar to the RMAT program).
It is important to note that the Weibull scale parameter (γ), which is
imperative in determining the Weibull failure rate, is based on the Gamma
Function. The gamma function computation will be discussed in the next section
(CMAM Algorithms).
The following examples show the Weibull failure rates and
cumulative probability of a component surviving (reliability) over time for both a
long and short MTBF ORU with a beta value of 1:
Chart 1: Weibull distribution (Beta =1) of failure rate (DC/DC Converter- Internal -
MTBMA:65.8yrs)
0
0.0050.01
0.015
0.02
1 4 7 10 13 16 19 22 25
Year
Failu
re R
ate
Series2
Chart 2: Weibull distribution (Beta = 1) of probability of failure (DC/DC Converter- Internal MTBMA:
65.8yrs)
0.00E+00
1.00E-02
2.00E-02
3.00E-02
1 11 21 31 41 51 61 71 81 91 101
111
Year
Tota
l Fai
lure
s (o
f 1
part) Series2
Chart 4: Weibull Distribution (Beta = 1) Probability of failure for Breathing aparatus assy
0.00000.05000.10000.15000.20000.25000.30000.3500
1 3 5 7 9 11 13 15 17 19 21 23
Year
Failu
res
(tota
l po
pula
tion
of 1
)
Series2
Chart 3: Weibull distribution (Beta =1) of failure rate for Breathing Assy
0
0.2
0.4
0.6
0.8
1
1 3 5 7 9 11 13 15 17 19 21 23 25
Year
Failu
re ra
te
Series1
Figure 6. Weibull Distribution Example, Beta = 1
20
When Weibull shape factor (β) = 1 the failure rate remains constant, and
the reliability of the component exponentially decreases with time. In the graphs
above it is important to note how quickly the short MTBMA ORU (Breathing
Apparatus Assembly) reliability decreases to approximately zero over the life of
the ISS16 (Chart 4), while the long MTBMA ORU (DC/DC Converter) still has
fairly high reliability over the same timeframe.
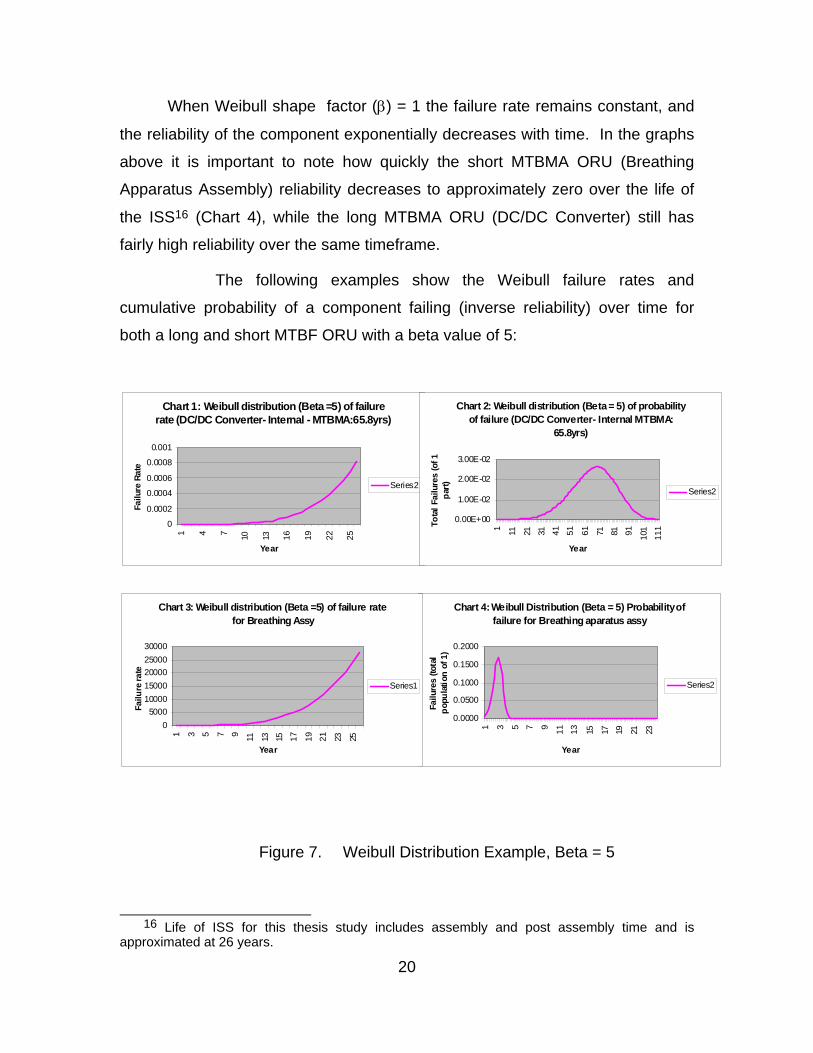
The following examples show the Weibull failure rates and
cumulative probability of a component failing (inverse reliability) over time for
both a long and short MTBF ORU with a beta value of 5:
Chart 1: Weibull distribution (Beta =5) of failure rate (DC/DC Converter- Internal - MTBMA:65.8yrs)
0
0.0002
0.0004
0.0006
0.0008
0.001
1 4 7 10 13 16 19 22 25
Year
Failu
re R
ate
Series2
Chart 2: Weibull distribution (Beta = 5) of probability of failure (DC/DC Converter- Internal MTBMA:
65.8yrs)
0.00E+00
1.00E-02
2.00E-02
3.00E-02
1 11 21 31 41 51 61 71 81 91 101
111
Year
Tota
l Fai
lure
s (o
f 1
part) Series2
Chart 4: Weibull Distribution (Beta = 5) Probability of failure for Breathing aparatus assy
0.0000
0.0500
0.1000
0.1500
0.2000
1 3 5 7 9 11 13 15 17 19 21 23
Year
Failu
res
(tota
l po
pula
tion
of 1
)
Series2
Chart 3: Weibull distribution (Beta =5) of failure rate for Breathing Assy
05000
1000015000200002500030000
1 3 5 7 9 11 13 15 17 19 21 23 25
Year
Failu
re ra
te
Series1
Figure 7. Weibull Distribution Example, Beta = 5
16 Life of ISS for this thesis study includes assembly and post assembly time and is
approximated at 26 years.

21
With a Weibull shape parameter (β=5) it is important to note that although
the failure rates increase exponentially in a similar fashion, the scaling of those
failure rates is radically different for short as opposed to long MTBMA ORUs
(charts 1 and 3).
4. CMAM Algorithms a. The Rutherford Equation
Each assembly, subassembly, or component within the ISS has its
own inherent reliability, often expressed as a Mean Time Between Failure
(MTBF). Often, MTBF by itself (without any modification) is used as the basis for
determining failure rates. This practice can and often does lead to unacceptable
inaccuracies in actual (and forecasted) failure rates due to two factors: usage,
and the nature of reliability data itself.
MTBF is by definition an average value of failure times based upon
a universal population of like devices/components.17 MTBF therefore does not
take into account duty cycles (component hot versus cold usage rates), human
error when performing corrective maintenance (K-factor), or other life limiting
factors (LifeLim). Due to these issues, the following equations, were developed
by L&M personnel and serve as the basis for all MTBF corrections within CMAM
for corrective maintenance actions and are summarized as the WP-4 Rutherford
equations:
17 Taken from the 15 April 1991 Application of K-factor to Life estimates in External
Maintenance Solution Team (EMST) Steady State Algorithm paper.

22
(8760* )
1 / 35(assumed value)
( )
1
1(
WP-4 Rutherford Equation:( * )
1Lchar
MTBFadj
OP OperatingRatio
DC DutyCycle
R HOTtoColdMTBF
Lchar LIFLIM yrs
MT
OP DC R DC R
MTBFhotMTBFadj
OP
MTTFadj MTBFadj
MTBMArandom
e−
=
=
= =
=
= + −
=
=
=
−⎛ ⎞⎜ ⎟⎜ ⎟⎝ ⎠
(8760* )
8760 */
8760 */
1
*
)
*
1Lchar
MTBMArandom
QTYCM year
MTBMAtotal
QTYPM year
MTBPMRR
K
BFadj MTTFadjK Kfactor
MTBMAtotal MTBMArandom e
CM
PM
−
=
−
=
=
=
+
⎛ ⎞⎜ ⎟⎜ ⎟⎜ ⎟⎝ ⎠
⎛ ⎞⎜ ⎟⎝ ⎠−
Figure 8. Rutherford Equations (from: McDonnell Douglas Space Systems)
Once again it is important to note that Preventative Maintenance
(PM) calculations are not a function of MTBMAtotal, and rely upon stated/
unmodified Mean Time Between Preventative Maintenance Remove and
Replace (MTBPMRR) times only.

23
b. The Gamma Function
As discussed earlier, the scale parameter (γ) of the Weibull
distribution is dependent on the solution to the Gamma Function which is defined
by:
1
0
1
1 2
00
2
0
Gamma Function
Integration by parts
gives
: 1recursion formula
( ) *
,
( ) ( 1) *
( 1)* *
( ) ( 1) ( 1)
x n
n x
x n x n
x n
for n
n e x dx
u x dv e dx
n e x n e x dx
n e x dx
n n n
+∞− −
− −
+∞∞− − − −
+∞− −
> =
= Γ =
= =
Γ = − + −
= −
= Γ = − Γ −
⎤⎦
∫
∫
∫
Figure 9. Gamma Function (from: Walpole) The recursion formula has no algebraic solution thus, in order to
code the Weibull distribution into CMAM an estimate for the solution of the
Gamma function had to be used. An estimate of the solution to the Gamma
function can be attained through the use of Stirling’s Asymptotic Series. Stirling’s
series is as follows:
( 1/ 2)2 3 4
Stirling's Asymptotic Series1 1 139 571( ) : 2 (1 )
12 288 51840 2488320n nn e n
n n z zπ− −Γ + + − −
Figure 10. Stirling’s Asymptotic Series (from: Beyer) This asymptotic series in the form above is a series expansion of
the gamma function accurate to 4 decimal places, which provides reasonable
accuracy in failure rate calculation for the purposes of CMAM development.

24
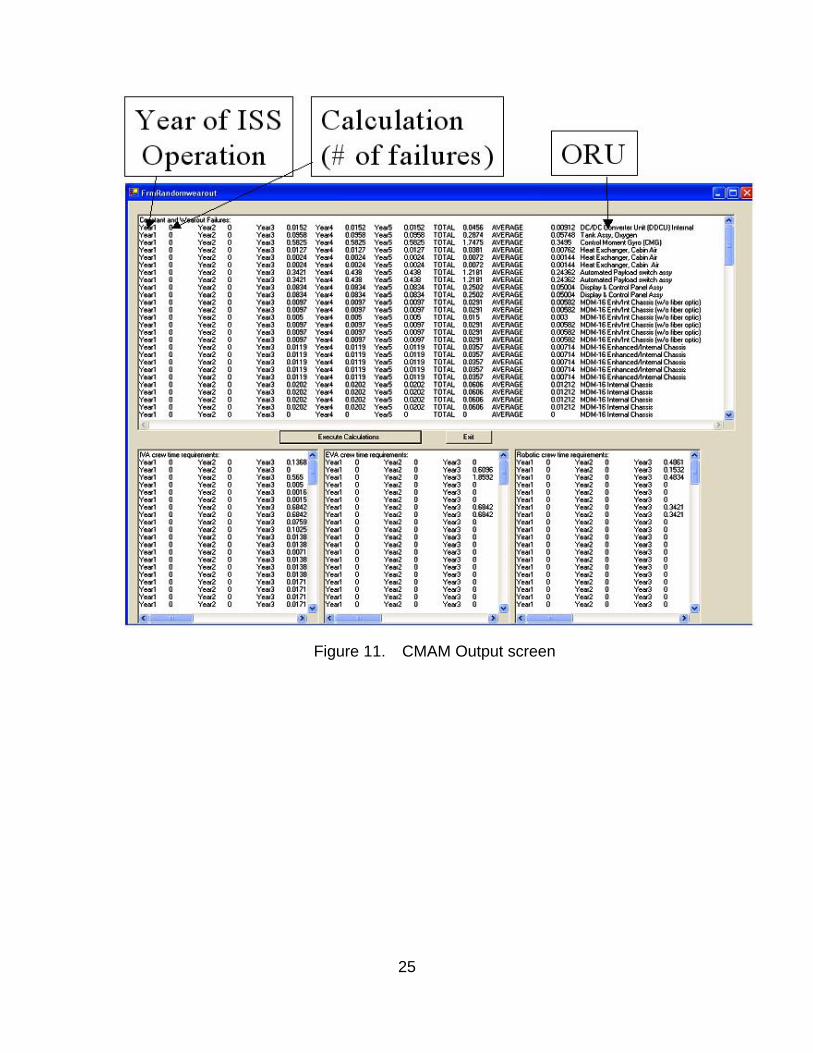
5. CMAM Output The CMAM output report is in the form of four separate text files that show
the following:
• File 1: Maintenance Actions per year
• File 2: IVA crew time requirements per year
• File 3: EVA crew time requirements per year
• File 4: EVR (Robotic) crew time requirements per year Each of the files is listed per ORU (each line in the report is a separate
ORU) with calculations listed by year (the year is listed with the calculation
immediately to the right of the year)18. Each of the files also has a summary
portion that lists both Overall (TOTAL) and Average per year calculations (similar
to RMAT calculation results). However, CMAM calculates both CM and PM
actions and summarized them in one column (unlike RMAT which has a separate
queue (queue 1) for PM calculations). Figure 11 is an example of the CMAM
output screen:
18 The Year is defined as the Operational year of the ISS with time = 0 defined as the
decimal date of the first assembly flight (AF-01A) which occurred on 20 November 1998.
25
Figure 11. CMAM Output screen

26
THIS PAGE INTENTIONALLY LEFT BLANK

27
III. RMAT SENSITIVITY ANALYSIS
A. RMAT VERSUS CMAM OUTPUT COMPARISON An attempt was made to directly compare the output of RMAT and CMAM
based upon an identical set of input ORUs (the CMAM top 120 critical ORU set),
and a similar set of input parameters. The following input parameters where
normalized for RMAT/CMAM output comparison:
• Duration of failure rate calculations: 26 years/result format by year
• Random and Wear-out failures calculated
• ORU Beta value set to default value of 5
• Corrective and Preventative Maintenance calculated per ORU Since RMAT calculations take into consideration spare ORU availability
and crew time availability, an infinite spares list and infinite crew time had to be
assumed within RMAT (unconstrained spares and crew time run). Additionally,
the bad apple and infant mortality functions of RMAT were turned off for the
comparison run. The following table is a summary of the RMAT preprocessor
input parameters:
Table 1. RMAT Input parameters

28
Upon execution of RMAT failure rate calculations it was determined that,
over a 26 year period a total of 3069.83 corrective and preventative maintenance
actions were forecasted with an average of 118.07 actions per year. Below
summarizes the RMAT output results:
RMAT Version 5.9.1 DATE: 07-15-2004 TIME: 18:40:51 USER NAME: Brian T. Soldon DATA DESCRIPTION: Top120 ORU output for CMAM comparison
<<<<< MAINTENANCE ACTION SECTION >>>>>
MAINTENANCE PERFORMED
TIME FLIGHT EVA only EVR only Co-op Tot EVA Tot EVR Tot IVA
2.014.02
3.000 0.02 0.00 0.09 0.11 0.09 74.14 4.000 0.02 0.00 0.05 0.07 0.05 105.04 5.000 0.20 0.00 0.13 0.33 0.13 104.39 6.000 0.95 0.00 1.42 2.37 1.42 112.61 7.000 0.27 0.00 0.45 0.72 0.45 120.94 8.000 0.61 0.00 1.92 2.53 1.92 127.43 9.000 0.47 0.00 0.69 1.16 0.69 120.7410.000 1.45 0.00 1.80 3.25 1.80 131.8411.000 1.40 0.00 2.27 3.66 2.27 129.6112.000 0.23 0.00 1.22 1.45 1.22 121.1413.000 0.90 0.00 1.31 2.20 1.31 133.9914.000 0.65 0.00 0.79 1.44 0.79 131.1815.000 0.78 0.00 0.82 1.60 0.82 136.37
128.3317.000 0.81 0.00 1.66 2.48 1.66 133.0818.000 0.89 0.00 1.51 2.39 1.51 131.6719.000 0.90 0.00 1.37 2.27 1.37 133.3
21.000 0.81 0.00 1.27 2.09 1.27 132.8322.000 0.84 0.00 1.33 2.17 1.33 130.8223.000 0.78 0.00 1.15 1.93 1.15 132.5424.000 0.97 0.00 1.51 2.49 1.51 150.1125.000 0.81 0.00 1.16 1.97 1.16 132.6826.000 0.89 0.00 1.30 2.19 1.30 132.78TOTAL 17.3 0.00 27.6 45.0 27.6 3024.83AVERAGE 0.67 0.00 1.06 1.73 1.06 116.34 118.07
152.6134.65134.973069.83
133.38134.92132.99134.47
130.27135.56134.06135.57
122.59136.19132.62137.97
129.96121.9
135.09133.27
105.11104.72114.98121.66
Total Maint Actions Top120
2.014.0274.25
16.000 0.87 0.00 1.06 1.94 1.06
20.000 0.83 0.00 1.33 2.16 1.33 131.22
1.000 0.00 0.00 0.00 0.00 0.002.000 0.00 0.00 0.00 0.00 0.00
Table 2. RMAT Maintenance Action output results

29
Upon execution of CMAM failure rate calculations, it was found that RMAT
was forecasting slightly higher failure rates than CMAM for overall failures and
averages of required failures per year. CMAM estimated 92.5% of the total CM
and PM failures estimated by RMAT19. However it was also determined that
CMAM output results are highly sensitive to changes in preventative
maintenance remove-and-replace (PMRR) scheduling, especially when
calculating failures on short MTBF (MTBMAtotal)20 ORUs over long periods of
time (i.e. duration of forecast calculations ≥ 20 years). This modeling sensitivity
was exemplified through changing the preventative maintenance schedule of just
1 ORU within the CMAM database. A CMAM run was executed both with and
without preventative maintenance on an external component: Control Moment
Gyro (CMG). The two runs resulted in nearly a 50% difference in total
maintenance actions required over the 26 year period (all attributed to increases
in corrective maintenance requirements on the CMG). The following tables show
the results of the CMAM run with and without CMG preventative maintenance:
19 RMAT forecasted failures = 3069.83, CMAM forecasted failures = 2840.14 (CMAM
failures / RMAT failures = 92.5%) 20 MTBMAtotal is the adjustment to MTBF values based upon the WP-4 Rutherford Equation
discussed in Section 2.4.a.

30
CMAM Version 3 DATE: 08-15-2004 CMAM Version 3 DATE: 08-15-2004 USER NAME: Brian T. Soldon USER NAME: Brian T. Soldon DATA DESCRIPTION: Top120 ORU output DATA DESCRIPTION: Top120 ORU output With Preventative Maintenance on CMG (external) Without Preventasive Maintenance on CMG (external)
Time EVA IVA Time EVA IVA
1 0.208 9.0323 1 0.208 9.03232 0.208 9.3975 2 0.208 9.39753 1.0838 67.9256 3 0.4593 67.92564 1.8385 100.7378 4 1.0471 100.73785 1.8385 100.7474 5 1.0896 100.74746 1.8385 100.7698 6 1.2129 100.76987 2.0077 100.6449 7 1.6537 100.64498 2.0077 106.4453 8 2.161 106.44539 2.0077 107.6574 9 3.0124 107.6574
10 2.0077 107.8614 10 4.3365 107.861411 2.0077 108.1665 11 6.2824 108.166512 2.0077 108.6041 12 9.0197 108.604113 2.0077 109.2142 13 12.7387 109.214214 2.0077 110.0387 14 17.6499 110.038715 2.0077 111.1268 15 23.9844 111.126816 2.0077 112.5334 16 31.9938 112.533417 2.0077 114.3163 17 41.9501 114.316318 2.0077 116.5421 18 54.146 116.542119 2.0077 119.2811 19 68.8944 119.281120 2.0077 122.6077 20 86.5288 122.607721 2.0077 126.6026 21 107.4033 126.602622 2.0077 131.354 22 131.8924 131.35423 2.0077 136.9525 23 160.391 136.952524 2.0077 143.4966 24 193.3146 143.496625 2.0077 151.0862 25 231.0992 151.086226 2.0077 159.8309 26 274.2011 159.8309
TOTAL 47.1693 2792.973 TOTAL 1466.878 2792.973AVE/yr 1.814204 107.422 AVE/yr 56.4184 107.422
Total Maint Actions Top120
9.24039.6055
69.0094102.5763102.5859102.6083102.6526108.453
109.6651109.8691110.1742110.6118
161.8386
111.2219112.0464113.1345114.5411116.324
2840.1424109.2362461
118.5498121.2888124.6154128.6103133.3617138.9602145.5043153.0939
Total Maint Actions Top120
9.24039.6055
68.3849101.7849101.837
101.9827102.2986108.6063110.6698112.1979114.4489117.6238121.9529127.6886135.1112144.5272156.2664170.6881188.1755209.1365234.0059263.2464297.3435
163.840403
336.8112382.1854434.032
4259.8506
Table 3. CMAM Maintenance Action Output results

31
CMG With and Without Preventative MaintenanceYEAR Maint Actions Required With PM Maint Actions Required no PM
1 0 02 0 03 0.6248 0.00034 0.8 0.00865 0.8 0.05116 0.8 0.17447 0.8 0.4468 0.8 0.95339 0.8 1.8047
10 0.8 3.128811 0.8 5.074712 0.8 7.81213 0.8 11.53114 0.8 16.442215 0.8 22.776716 0.8 30.786117 0.8 40.742418 0.8 52.938319 0.8 67.686720 0.8 85.321121 0.8 106.195622 0.8 130.684723 0.8 159.183324 0.8 192.106925 0.8 229.891526 0.8 272.9934
TOTAL 19.0248 1438.7338AVE/YR 0.731723077 55.33591538
Table 4. CMAM CMG Maintenance Action forecasts w/ and w/o PM
The sensitivity of CMAM to changes in preventative maintenance
scheduling, especially on short MTBF (MTBMAtotal) ORUs when calculating
failures over long period of time, can be attributed to characteristics of the
Weibull distribution when calculating wear-out failures. As discussed earlier,
when the Weibull shape factor (β) is greater than four (β = 5 in our case) it results
in exponentially increasing failure rates as components age (approach end-of-life
or wear-out). The goal is to schedule preventative maintenance on these

32
components prior to corrective maintenance requirements becoming
unacceptably high. However, if no preventative maintenance is scheduled,
corrective maintenance forecasts on these components will continue to increase
exponentially, and will result in high failure rate predictions (unrealistically high in
most cases). Thus, it can be said that if a β value of five is used in wear-out
failure calculation, it is imperative to accurately schedule preventative
maintenance on short MTBF (MTBMAtotal) ORUs.
The current ORU reliability forecasting issue, as stated in LSAR revisions
M, N, and O, is that: while Cumulative IVA actual versus forecasted PM and CM
maintenance actions and crew times remain relatively accurate (within 23% for
PM, and 8% for CM), Cumulative projected EVA crew times “grossly” exceed
actions and the EVA numbers continue to diverge21. It seems possible that
RMAT may have the same sensitivity to preventative maintenance scheduling as
CMAM. In order to test this theory, a comparative run was executed in RMAT
for CMG failure rates both with and without preventative maintenance over the
same period of time (26 years) and with the same Weibull shape parameter
(β=5). It was found that, although corrective maintenance actions increase when
no PM was scheduled, the CM actions did not increase exponentially after the
CMG wear-out period.22 The following table summarizes the results of the
RMAT run on the CMG with and without preventative maintenance:
21 LSAR (D684-10162-1-1, Revision O details this divergence issue and discusses possible
causes on pages 4-1 and 4-2. 22 The CMG wear-out period is defined as MTBMAtotal ≈ 6.5 years
33
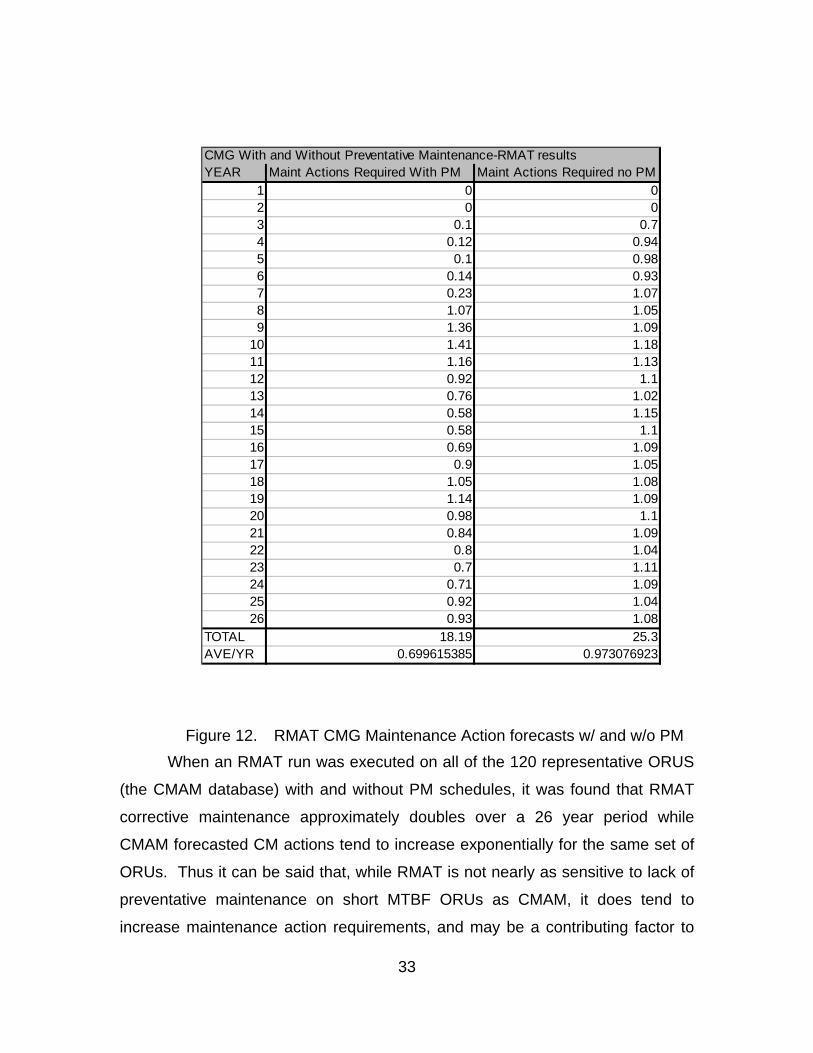
CMG With and Without Preventative Maintenance-RMAT resultsYEAR Maint Actions Required With PM Maint Actions Required no PM
1 0 02 0 03 0.1 0.74 0.12 0.945 0.1 0.986 0.14 0.937 0.23 1.078 1.07 1.059 1.36 1.09
10 1.41 1.1811 1.16 1.1312 0.92 1.113 0.76 1.0214 0.58 1.1515 0.58 1.116 0.69 1.0917 0.9 1.0518 1.05 1.0819 1.14 1.0920 0.98 1.121 0.84 1.0922 0.8 1.0423 0.7 1.1124 0.71 1.0925 0.92 1.0426 0.93 1.08
TOTAL 18.19 25.3AVE/YR 0.699615385 0.973076923
Figure 12. RMAT CMG Maintenance Action forecasts w/ and w/o PM
When an RMAT run was executed on all of the 120 representative ORUS
(the CMAM database) with and without PM schedules, it was found that RMAT
corrective maintenance approximately doubles over a 26 year period while
CMAM forecasted CM actions tend to increase exponentially for the same set of
ORUs. Thus it can be said that, while RMAT is not nearly as sensitive to lack of
preventative maintenance on short MTBF ORUs as CMAM, it does tend to
increase maintenance action requirements, and may be a contributing factor to
34
the overall trend of forecast versus actual failure divergence, especially in
reference to external ORUs.
An analysis of the RMAT ORU database (MADS) shows that of the 1379
distinct ORUs within the database 729 are Interior (IVA) ORUs and 650 are
Exterior (EVA) ORUs. Of the 729 IVA ORUs, 32 have an associated Mean Time
Between Preventative Maintenance Remove and Replace (MTBPMRR) , while of
the 650 EVA ORUs, only 9 have an associated MTBPMRR. Even more
significant is that although exterior components on average have longer lives
(longer MTBF/MTBMAtotals), there are still 71 EVA ORUs that have an MTBF
less than 100000 hours and only 2 of these ORUs have an associated
MTBPMRR (while of the 116 IVA ORUs with an MTBF less than 100000 hours,
18 have preventative maintenance schedules). This fact by itself may be enough
to explain the divergence issue with respect to external ORUs while internal
forecasts remain fairly accurate.
Lastly, it must be stated that the simple addition of EVA preventative
maintenance on short MTBF items does not seem to be the appropriate solution
to the problem of exaggerated forecasted EVA failure rates for two reasons:
• Historical/actual EVA maintenance actions (CM) do not seem to merit the addition of such maintenance (LSAR revision O shows only 5 EVA CM actions to date)
• Additional preventative maintenance on EVA components is avoided (if possible) because it is inherently dangerous and time consuming
Thus, it seems more likely that the use of a lower β value for determining wear-
out failures should be explored, especially in reference to short MTBF external
components. It seems highly likely that β values closer to 1 (constant rate
failures) would be more accurate to use based upon the historical/actual failure
rates that are collected as the ISS matures.
B. CMAM UNCERTAINTY USING CRYSTAL BALL So far our discussion and analysis of failure rates for ORUs has centered
on the distribution of time between failures (failure rate modes – constant rate
and wear-out), as opposed to the accuracy of stated MTBFs and associated

35
MTBMAtotals. Due to the unique nature of the ISS, and the unique components
of its associated systems, reliability analysis of the ISS as a system and its ORUs
individually is based upon predicted MTBF and K factor23 data. This ensures
that there will be added levels of uncertainly in ORU failure rates forecasts. The
idea is to quantify this uncertainly to the highest degree possible to aid in logistics
and maintenance action planning.
1. Purpose of Crystal Ball Simulation Package The two major sources of uncertainly for failure rate calculations relate to
inaccuracies of:
• Mean Time Between Failures: The Average time between failures of a specific ORU based upon characteristics of the ORU itself
• K-Factor: A multiplier that accounts for increased equipment maintenance actions not included in the inherent MTBF estimates. These maintenance actions include: human-induced, environmental induced, false maintenance, other equipment induced.
For the purpose of CMAM uncertainty analysis, these two input
parameters were treated as variables in developing failure rate estimates. This
was accomplished through the use of the Crystal Ball ® 2000 program.
Crystal Ball 2000 ® is a simulation program that assists in analyzing the
risks and uncertainties associated with forecasting models. Crystal Ball was
chosen for this uncertainly analysis for the following reasons:
• It allows the incorporation of all assumptions made for CMAM failure rate calculation purposes
• It allows for multiple replications as needed to avoid randomness • It provides a confidence level for data sensitivity analysis. • It provides a means of analyzing data by utilizing dissimilar
distributions exclusive of the probability distributions functions.24
2. Assumptions In order to simplify this uncertainty analysis a number of assumptions
needed to be made:
23 MTBF and K-factor (see Section III.C.1 for definition) are considered to be the two primary
causes of uncertainty in failure rate calculation. These factors are taken into account within RMAT (RMAT uses Monte-Carlo simulation with 600 iterations to account for these uncertainty factors).
24 http://www.crystalball.com/crystal_ball/index.html, May 15, 2003

36
• Only constant failure rate Corrective Maintenance action requirements were looked at for all 120 ORUs within the CMAM database.
• All 120 ORUs are assumed to be operational on the ISS (steady state calculation)
• Both the MTBF and K-factor for each ORU have a normal distribution about the stated value and both have a standard deviation about this mean of 10%.
• 600 iterations were performed for each ORU (in order to avoid randomness)
• All ORUs are considered independent of one another, and equally mission critical.
3. Crystal Ball Results Based upon constant failure rate calculation within CMAM a total of 6.38
CM maintenance actions per year can be expected on these 120 ORUs. The
following figure shows the CMAM output screen for steady state calculations:
Figure 13. CMAM Steady State Output Results

37
When MTBF and K-factors were assumed to vary (normally
disturbed w/ standard deviation of .1) the following results were attained:
Frequency Chart
Actions / yr
.000
.008
.015
.023
.030
0
4.5
9
13.5
18
6.00 6.23 6.45 6.68 6.90
600 Trials 3 Outliers
Forecast: Total CM Actions Required Top 120
Forecast: Total CM Actions Required Top 120
Statistic Value
Trials 600
Mean 6.42
Range Minimum 6.05
Range Maximum 7.07
Range Width 1.02
Cumulative Chart
Actions / yr
.000
.250
.500
.750
1.000
0
150
300
450
600
6.00 6.23 6.45 6.68 6.90
600 Trials 3 Outliers
Forecast: Total CM Actions Required Top 120
Figure 14. Crystal Ball ®_ Output results Thus based upon these simulation input parameters the steady
state CM failure rate forecasts can be expected (with 100% certainty) to
fluctuate by no more than 15.88% of the mean value (range width of 1.02
with a mean of 6.42). With these figures it can be said that most errors in
MTBF and K-factors alone cannot explain the divergence issues in relation
to EVA forecasted versus actual maintenance requirements but more
likely is a combination of MTBF & K-Factor uncertainty and inappropriate β
values when modeling wear-out failures.

38
THIS PAGE INTENTIONALLY LEFT BLANK
39
IV. RECOMMENDATIONS AND CONCLUSIONS
A. RECOMMENDATION FOR CMAM USE The Comparative Maintenance Analysis Tool (CMAM) is a user-friendly
alternative to RMAT for executing basic failure rate analysis on Orbital
replacement units for the ISS. It can provide immediate feedback for logistics
planners on estimates of both corrective and preventative maintenance
requirements for both internal and external ORUs. CMAM is not meant as a
replacement to the robust capabilities of RMAT, nor has the program been
independently validated to ensure that its results are completely accurate.
However, when validated it will provide a readily available tool for RMAT
comparison that allows for clarification/simplification of the algorithms through
which failure rate calculations are made. Therefore, it is recommended that
NASA L&M and Boeing L&M consider validating CMAM for use as a reference
tool when forecasts from RMAT are either not needed, or when only basic failure
rate data is required for planning purposes.
Following this recommendation, the CMAM ORU database should be
completed and updated in order to keep CMAM output results as accurate and
complete as possible, and to allow for a more meaningful comparison with RMAT
results. Completion of this database is estimated to take between 35 and 45
hours of work executed from the CMAM database input mask within the CMAM
program. Completion and usage of an Access-based database as opposed to
the current Excel-based MADS listing will reduce the overall number of input
errors into the ORU database and will most likely reduce the amount of time
required to both maintain the database, and the amount of time required to
format both CMAM and RMAT input files (through the cut and paste of Access
SQL query results).
40
B. RECOMMENDATION FOR FOLLOW-ON RESEARCH Based upon the results of the direct comparison between RMAT and
CMAM it is recommended that the effects of reduced β values in reference to
Weibull wear-out failures rates, as well as the effects of increased EVA
MTBPMRR be explored in RMAT to determine the overall effects on failure rate
forecasts, especially in reference to short MTBF external ORUs.
Lastly, it is recommended that further research be conducted to find out if
a program such as CMAM can be applied to such areas as forecasting failures of
submarine components to optimize sparing and/or maintenance scheduling. This
research could take significant time in terms of populating new spare part
databases with the appropriate reliability data but could provide a better
forecasting tool than what is currently in use.
C. CONCLUSION The International Space Station has a unique Logistics and Maintenance
system that requires the efficient and effective forecasting of part failures and
associated resource requirements. Due to the complexity of the ISS as a
system, and the environment in which it and its crew operates, forecasting these
failures is often as much an art as it is a science. Although the primary tool for
executing ORU failure rate forecasts (RMAT) is a powerful analytical and
simulation based program, it, just like any other probability forecasting tool, has
its own set of inefficiencies, inaccuracies and weaknesses. It is of primary
importance to identify these weaknesses and their causes as quickly as possible.
The growing divergence issue between external ORU forecasted failures and
actual failures is an issue that deserves attention and correction. This thesis is
an attempt to analyze this issue and its underlying causes. It is believed that,
after studying the underlying failure rate calculation algorithms of RMAT and
developing an independent program that replicates some of these calculations
(CMAM), the underlying problem is a combination of multiple factors. The
primary factors are:
• RMAT and CMAM are utilizing Weibull shape parameter (β) values that are too high in relation to wear-out failure forecasting

41
• Inherent uncertainty in the accuracy of ORU MTBF and K-factor values that tends to lead to inaccurate failure forecasts rates, especially when looking at a relatively small set of ORUs (120 for this analysis) over a relatively short period of time (approximately 6 years since first assembly flight).

42
THIS PAGE INTENTIONALLY LEFT BLANK
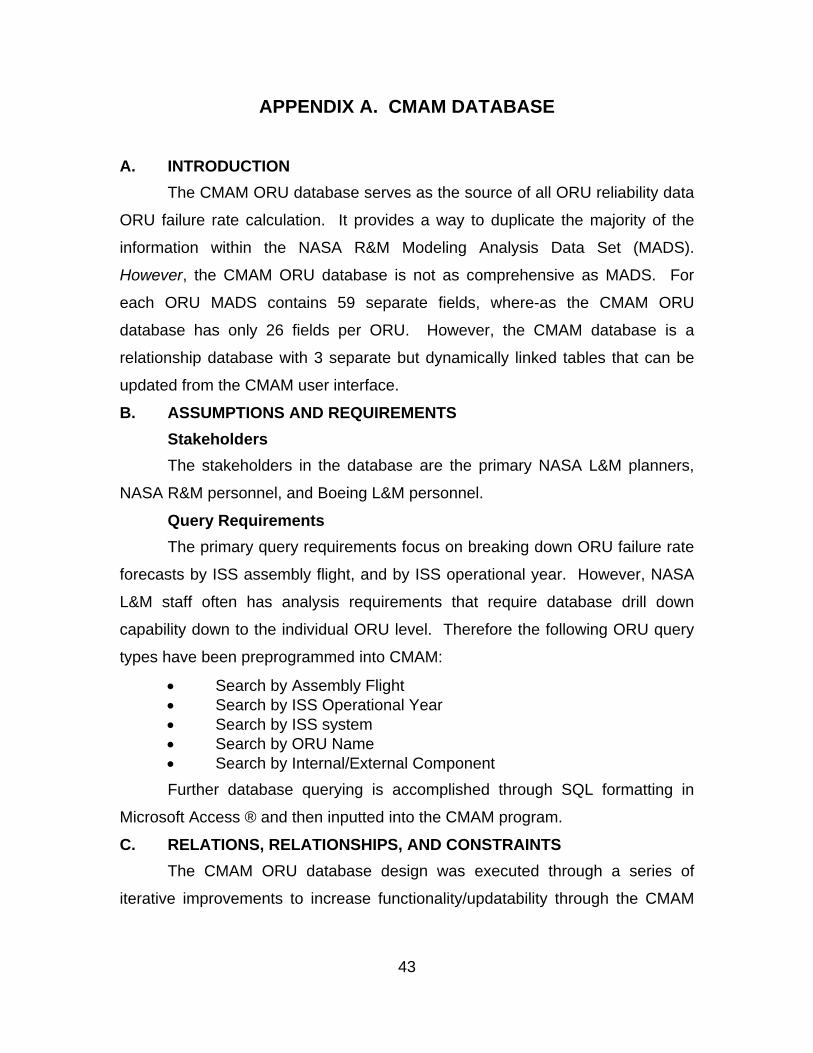
43
APPENDIX A. CMAM DATABASE
A. INTRODUCTION The CMAM ORU database serves as the source of all ORU reliability data
ORU failure rate calculation. It provides a way to duplicate the majority of the
information within the NASA R&M Modeling Analysis Data Set (MADS).
However, the CMAM ORU database is not as comprehensive as MADS. For
each ORU MADS contains 59 separate fields, where-as the CMAM ORU
database has only 26 fields per ORU. However, the CMAM database is a
relationship database with 3 separate but dynamically linked tables that can be
updated from the CMAM user interface.
B. ASSUMPTIONS AND REQUIREMENTS Stakeholders
The stakeholders in the database are the primary NASA L&M planners,
NASA R&M personnel, and Boeing L&M personnel.
Query Requirements The primary query requirements focus on breaking down ORU failure rate
forecasts by ISS assembly flight, and by ISS operational year. However, NASA
L&M staff often has analysis requirements that require database drill down
capability down to the individual ORU level. Therefore the following ORU query
types have been preprogrammed into CMAM:
• Search by Assembly Flight • Search by ISS Operational Year • Search by ISS system • Search by ORU Name • Search by Internal/External Component
Further database querying is accomplished through SQL formatting in
Microsoft Access ® and then inputted into the CMAM program.
C. RELATIONS, RELATIONSHIPS, AND CONSTRAINTS The CMAM ORU database design was executed through a series of
iterative improvements to increase functionality/updatability through the CMAM

44
user interface. To reduce implementation problems three database design tools
were developed:
• Entity Relationship Diagram (ERD) • Table/Column Diagram • Microsoft Access Relationship diagram
Entity Relationship Diagram (ERD) The ERD is a graphical schematic used to represent database entities and
their relationships. Entities are shown in rectangles while relationships are
shown in diamonds. Cardinalities between entities are within the diamonds.
Each entity has a number of attributes that describe it (i.e. the entity Flight has
the attributes of: Flight_Num and Flight_Date). Lastly, relationships bridge the
gap between entities. Each relationship has within it a minimum and a maximum
cardinality, which, in a binary relationship, identifies the number of elements
allowed on each side of the relationship. CMAM has three such relationships
that enhance the level of granularity of a users database search. See Figure 15.
Table/Column Diagram The table/column diagram was then constructed to ensure that the
corresponding tables and columns relevant to our ERD were ready for entry into
Microsoft Access ® database design. Primary keys for each table were
identified, along with ensuring functional dependency of each non-primary
attribute (The tables were normalized). See Figure 16.
Microsoft Access Relationships Lastly, the table/column diagram was translated into the Access® design
view and the relationships were linked. One of the key aspects of the CMAM
ORU database is that each table and each attribute has specific input
requirements (i.e. a field that requires a number will not accept a letter, etc), and
referential integrity exits between the tables (i.e. you cannot add an ORU on a
flight that doesn’t exist). These qualities ensure both data accuracy and integrity
on a much higher level than spreadsheets databases (MADS is an excel
spreadsheet based database). See Figure 17.
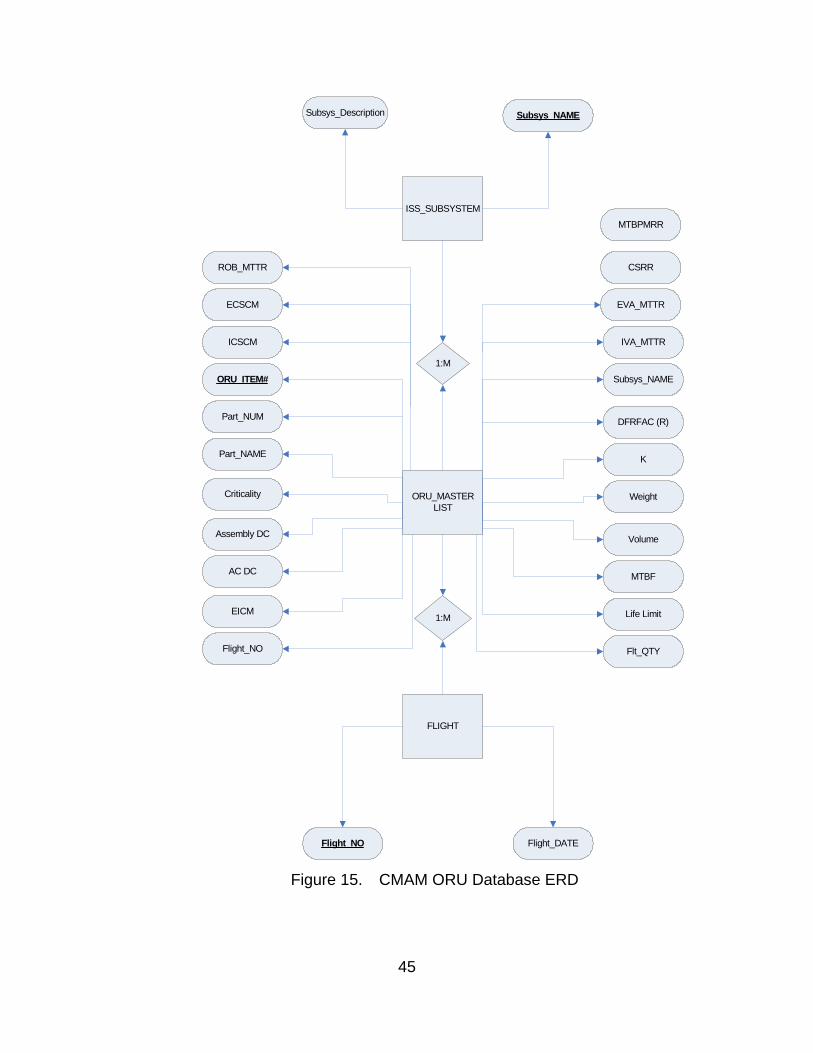
45
ORU_MASTERLIST
ISS_SUBSYSTEM
FLIGHT
1:M
1:M
IVA_MTTR
EVA_MTTR
ROB_MTTR
Flt_QTY
EICM
Flight_DATEFlight_NO
ECSCM
Subsys_NAME
ICSCM
Part_NUM
Part_NAME
Criticality
Assembly DC
K
Weight
Volume
MTBF
DFRFAC (R)
Life Limit
AC DC
Flight_NO
Subsys_NAME
Subsys_Description
ORU_ITEM#
CSRR
MTBPMRR
Figure 15. CMAM ORU Database ERD
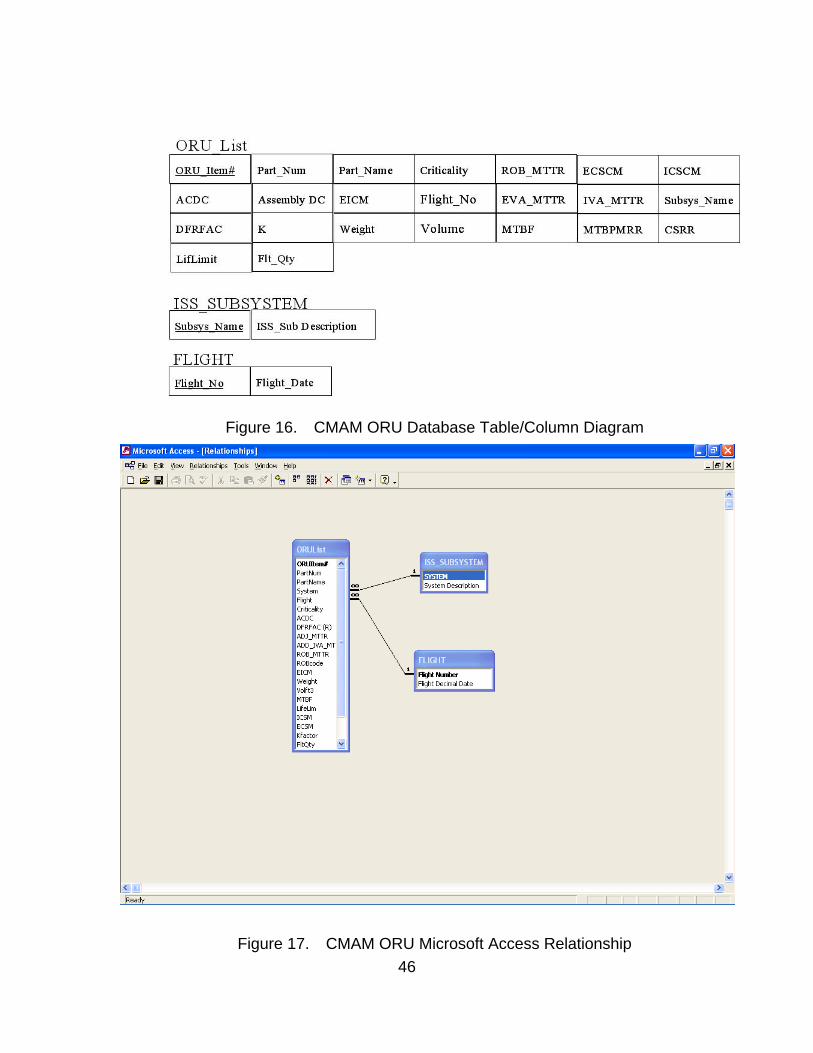
46
Figure 16. CMAM ORU Database Table/Column Diagram
Figure 17. CMAM ORU Microsoft Access Relationship

47
D. USER INTERFACE
The CMAM ORU database interface is through two separate forms that
allow for the dynamic update of both the ORUlist table and the Flight table. The
flight table input mask offers the added functionality of allowing standard dates to
be entered (MM/DD/YY) and automatically converting them to decimal dates.
(See Figures 18 and 19).
Figure 18. CMAM ORULIST Table User Interface
48
Figure 19. CMAM FLIGHT Table User Interface

49
APPENDIX B. LIST OF ABBREVIATIONS AND ACRONYMS
AC Assembly Complete
ACDC Assembly Complete Duty Cycle
CMAM Comparative Maintenance Assessment Tool
CMG Control Moment Gyro
CM Corrective Maintenance
C1 Criticality Code 1
C&T Command & Telemetry
CSRR Crew Size Removal and Replace
DC Duty Cycle
DECR Decrement
ECSCM External Crew Size Corrective Maintenance
EICM External/Internal Corrective Maintenance
EMST External Maintenance Solution Team
ERD Entity Relationship Diagram
EVA Extra-Vehicular Activity
Flt_Qty Flight Quantity
Flight_No Flight Number
GAO General Accounting Office
GUI Graphic User Interface
GRND Ground
ICSCM Internal Crew Size Corrective Maintenance
ISS International Space Station
ITCS Internal Thermal Control System
50
IVA Intra-Vehicular Activity
IVR Intra-Vehicular Robotics
JSC Johnson Space Center
KSC Kennedy Space Center
LIFLIM Life Limit
Lchar Life Characteristic
L&M Logistics and Maintenance
LSAR Logistics Supportability Assessment Report
MADS Modeling Analysis Data Set
MTBF Mean Time Between Failures
MTBMAtotal Mean Time Between Maintenance Actions total
MTBPMRR Mean Time Between Preventative Maintenance Remove and
Replace
MTTF Mean Time To Fail
MTTR Mean Time To Repair
NASA National Aeronautics and Space Administration
OEM Original Equipment Manufacturer
OP Operating ratio
ORU Orbital Replacement Unit
PM Preventative Maintenance
PMRR Preventative Maintenance Remove and Replace
RMAT Reliability and Maintainability Assessment Tool
R&M Reliability and Maintenance
ROBMTTR Robotic Mean Time To Repair
51
SQL Structured Query Language
START Station Availability Reporting Tool
THC Temperature and Humidity Control
USA United Space Alliance
VB.net Visual Basic.net

52
THIS PAGE INTENTIONALLY LEFT BLANK

53
LIST OF REFERENCES
Beardmore, R. Failure Distributions, http://www.roymech.co.uk/Useful_Tables/ARM/Failure_Distributions.html , accessed 16 April 2004.
Beyer, W. H. (1987) Standard Mathematical Tables (28th ed.). Boca Raton: CRC Press, Inc.
The Boeing Company. (2002, December). International Space Station Program
Logistics Supportability Assessment Report D684-10162-1-2 Revision M. Houston: Author.
The Boeing Company. (2003, July). International Space Station Program Logistics Supportability Assessment Report D684-10162-1-2 Revision N. Houston: Author.
The Boeing Company. (2004 January). International Space Station Program Logistics
Supportability Assessment Report D684-10162-1-2 Revision O. Houston: Author.
The Boeing Company. (1998 November). D684-10708-3 Revision B. Houston:
Author. The Boeing Company. (2000 March). D684-10708-3 Revision E. Houston: Author. The Boeing Company. (1995). RMAT 5.9.0 Quick Reference Manual. Houston:
Author. Byron, Dan. Increasing Availability at the Cost of Reliability,
http://www1.us.dell.com/content/topics/global.aspx/power/en/ps1q02_byron?c=us&1=en&s=corp , accessed 12 August 2004.
Decisioneering, Inc. (1996). Crystal Ball Version 4.0 User Manual. Aurora, CO:
Author. Halvorson, M. (2003). Microsoft Visual Basic.Net Step by Step: Version 2003.
Redmond: Microsoft Press.
McDonnell Douglas Space Systems Company. (1991, April). Application of K-Factor to Life Estimates in the EMST Steady State Algorithm. Houston: Author.
National Aeronautics and Space Administration. (2004 March) International Space
Station Logistics and Maintenance Overview. Houston: Author.

54
National Institute of Standards and Technology. NIST/SEMATECH e-Handbook of Statistical Methods, http://www.itl.nist.gov/div898/handbook/ , accessed 16 April 2004.
Walpole, R. E., & Myers, R. H. (1989). Probability and Statistics for Engineers and
Scientists (4th ed.). New York: MacMillan Publishing Company.
55
BIBLIOGRAPHY
Bukulich, F. Managing a Space Station, http://www.sae.org/aeromag/features/spacestation/ , accessed 16 April 2004.
Butina, A. (2001). Managing NASA’s International Space Station Logistics and
Maintenance Program. AIP Conference Proceeding Vol. 552 pp.161-169.
Hoffer, J. A., & Prescott, M. B. (2002). Database Management (6th ed.). Upper Saddle River, NJ: Pearson Education, Inc.
National Aeronautics and Space Administration. (2002). International Space Station
User’s Guide-Release 2.0. Houston: Author.
Sargent, R. G. (2000) VERIFICATION, VALIDATION, AND ACCRFEDITATION OF SIMULATION MODELS. Syracuse: Simulation Research Group, Department of Electrical Engineering and Computer Science, Syracuse University.

56
THIS PAGE INTENTIONALLY LEFT BLANK

57
INITIAL DISTRIBUTION LIST
1. Defense Technical Information Center Ft. Belvoir, Virginia
2. Dudley Knox Library Naval Postgraduate School Monterey, California
3. Tony Butina NASA Logistics and Maintenance Houston, Texas
4. Paul Rathbun
NASA Logistics and Maintenance Houston, Texas
5. Jesse Astorga Boeing Logistics and Maintenance Houston, Texas
6. Professor Chirold Epp Naval Postgraduate School Monterey, California
7. Captain Daniel Bursch Naval Postgraduate School Monterey, California