needs assessment 2020 - state.nj.us
TRANSCRIPT

1
Needs Assessment 2020
Bergen County
January 15, 2021
County Human Services Advisory Council Authored by: County of Bergen Your Name

2
Table of Contents
PART 1 Executive Summary
Introduction
County Description
Needs Assessment Methodology
PART 2 Key Findings Across All Needs Key Findings for Each Basic Need Area
• Housing • Food • Health Care • Community Safety • Employment and Career Services • Child Care
PART 3
Key Findings for Specialized Service Need Areas • Services for Families Caring for a Child of a Relative • Behavioral/Mental Health Services for Children • Behavioral/Mental Health Services for Adults • Substance Use Disorder Services • Domestic Violence • Parenting Skills Services • Legal and Advisory Services
N E E D S A S S E S S M E N T

3
PART 1
4
Executive Summary Narrative: In the Words of the County On behalf of the New Jersey Department of Children and Families (NJDCF), the Bergen County Department of Human Services and its Human Services Advisory Council (HSAC) conducted a needs assessment of Bergen County’s at-risk children and families. Although the goal was to reach as many professionals and consumers as possible, this proved to be a difficult task in the face of our current COVID-19 pandemic. Despite the new challenges that resulted, Bergen County was able to gather information related to this needs assessment per the following:
• Over 200 people completed a stakeholder survey; • 84 people participated in 10 focus groups; and • 8 key informant interviews were conducted.
The target population of at-risk children and families are defined as follows:
• Children who have been harmed, are at risk of being harmed, and/or may be exposed to abuse or neglect, and their families;
• Children and adolescents with emotional and behavioral health care challenges, and their families;
• Children with intellectual and/or developmental disabilities, and their families; • Children and families receiving support services to prevent abuse and neglect; and • Youth ages 14-21, who in the transition to adulthood, require services to achieve economic
self-sufficiency, independence, and healthy life styles. We assessed the Bergen County human services delivery system in the following target services areas:
• Basic Needs: Housing and Health Care; and • Specialized Service Needs: Behavioral/Mental Health Services for Children, and
Behavioral/Mental Health Services for Adults. An analysis of the County’s data profile was used, along with survey results, to determine what the greatest needs are, and also to see which barriers are preventing people from accessing services. Additional information and insight was collected through our focus groups and key informant interviews. Upon analyzing this information/data, it was discovered that the lack of awareness of services was identified most frequently as the largest barrier to accessing available services, while transportation and cultural barriers were also prevalent.

5
Introduction Purpose The New Jersey Department of Children and Families has collaborated with human services organizations in each county to undertake an assessment of local strengths and needs. The goal of this assessment is to collect the information needed to ensure that the right accompaniment of services and activities are available in every county in New Jersey to support families. The findings from this needs assessment can be used to support the development of local recommendations to assist with decision making; the identification of high priority human service needs and barriers to service delivery for New Jersey’s communities; the coordination and improvement of services to the Departments' target populations; and the planning, funding, coordination and implementation of Department Initiatives. This statewide approach to county-specific needs assessments aligns with the Department of Children and Families’ existing county based continuous quality improvement review cycle, in which each county is evaluated every two (2) years. The findings from each needs assessment will be embedded into the Department of Children and Families’ existing ChildStat process and shared with Department of Children and Families staff and stakeholders during the county’s ChildStat session. ChildStat is a learning, management and accountability tool used by the Department of Children and Families to support continuous quality improvement, foster a shared sense of accountability and promote system-wide problem solving around critical issues affecting child and family outcomes. A ChildStat session incorporates analysis and interpretation of administrative data to support planning and dialogue between the Department of Children and Families executive management, senior leadership, and system partners.

6
County Description Narrative: In the Words of the County Bergen County’s 239 square-miles are well situated in the northeastern corner of the state of New Jersey and strategically nestled in the heart of the New York Metropolitan area. The county is home to nearly one million residents residing in seventy municipalities, a vibrant and diverse business community, and many retail opportunities. Bergen County offers many attributes, including but not limited to, highway access, an educated workforce, diverse housing opportunities, and a supportive business environment for owners and employees to do business. Our road system and transportation infrastructure allow businesses to access customers and suppliers with a well-developed road system that includes the New Jersey Turnpike, the Garden State Parkway, and the Palisades Interstate Parkway. Many Bergen County commuters traveling into nearby Manhattan for business or pleasure enjoy access to the trans-Hudson River public transportation in the forms of bus, train, and ferry service. Teterboro Airport, located in the southern portion of the County, is another transportation option for general aviation, as well as charter flights, located just 12 miles from midtown Manhattan. Our demographic breakdown parallels the breakdown of the state of New Jersey, with annual growing diversity bringing these numbers even closer. Since 2013, the percentage of white residents has dropped from 74% to 73%, which is only 3 percentage points higher than the state average. In addition, there has been a rise in Hispanic/Latino residents. In 2013, this demographic consisted of 17% of Bergen County residents. That number has increased annually and now represents 19% of Bergen County residents, only 1 percentage point less than the state average. Bergen County also has the third largest number of foreign-born residents in the state and the overall largest youth population in New Jersey. Despite having such a large youth population, only 8% of families with children under the age of 18 are living in poverty. This is 4 percentage points lower than the state average and 9 percentage points lower than the national average. Furthermore, our county has a median household income of $91,572, which is the fifth largest in the state and higher than the state average ($76,475).

7
Needs Assessment Methodology
Quantitative and qualitative data from various sources and stakeholders related to housing, food, health care, community safety, employment and career services, child care, services for families caring for a child of a relative, behavioral/mental health services for children, behavioral/mental health services for adults, substance use disorder services, domestic violence services, parenting skills services, and legal and advocacy services were collected to inform this needs assessment. County Data Profile The Department of Children and Families provided a county data profile to each county Human Service Advisory Council (HSAC) to support the HSAC in identifying key topics to be explored in more depth through this needs assessment. This data profile contained the most recently available administrative data related to demographic population and selected indicators of poverty, housing, food security, childcare, health care, transportation, employment, community safety, mental health and substance use. The sources for the data included in the profile consisted of a combination of federal databases. The primary purpose of the county data profiles were to support the HSAC needs assessment team in identifying key areas to prioritize during our focus group data collection efforts. Approach for Prioritizing Needs The four (4) priority needs below were determined by an initial survey conducted in early December, 2020. Out of the 197 participants, 69.91% said behavioral/mental health services for children was the top service needed in Bergen County. This was followed by the 75.22% who said behavioral/mental health services for adults was the service that needed to be further addressed. Additionally, 74.34% identified housing as a major need, and health care services followed with 69.91%. This initial assessment was further confirmed by data from subsequent needs assessment survey results and through focus groups. The four (4) need areas selected by the county to be the focus areas and primary topics in the qualitative data (e.g., focus groups and key informant interviews) collection included: 1. Behavioral/Mental Health Services for Children 2. Behavioral/Mental Health Services for Adults 3. Housing 4. Health Care

8
Focus Groups In an effort to implement a uniform needs assessment approach across counties to support statewide trend analysis, the Department of Children and Families required HSACs to conduct a series of focus groups. The purpose of each focus group was to collect qualitative information to better understand the scope, nature and local context related to addressing community needs that influence families. Focus group sessions were scheduled for approximately one and half hours with the first thirty minutes being designated for introductions and survey completion and the remaining hour being designated for the focus group dialogue. In each focus group session, participants were asked to complete a standard survey to gather data about the key topic areas outlined in the aforementioned data profiles. The survey was developed to identify areas of strength and areas in need of improvement related to county-based supports and service array. The survey consisted of demographic data and approximately ten (10) questions related to each of the eleven (11) basic and service needs. Six (6) of the questions are based on a five-point Likert scale ranging from Strongly Disagree to Strongly Agree. Upon completion of the surveys, the focus group participants were asked to transition into the dialogue component of the session. The dialogue requirement was intended to allow participants to highlight their experiences and perceptions as community members and provide opportunity for a deeper discussion and assessment of top barriers in each area of need. Group members discussed two selected basic and service need priority areas. Facilitators use a structured protocol to explain the purpose, goals, confidentiality and informed consent and objectives of the focus group. Recruitment. Participants were contacted primarily through e-mail. These participants consisted of various stakeholders and organizations. This includes:
• Bergen County Board of Social Services • Bergen County Children’s Inter-Agency Coordinating Council • Bergen County Commission on the Status of Women • Bergen County Department of Health Services • Bergen County Department of Human Services, Division of Family Guidance • Bergen County Department of Human Services, Special Child Health Services • Bergen County Department of Human Services, Youth Services Commission • Bergen County Department of Human Services, Human Relations Commission • Bergen County Department of Health, Division of Mental Health Services • New Jersey Department of Children & Families, Division of Child Protection & Permanency
Focus Group Participants. A total of ten (10) focus groups were conducted in this county as part of this needs assessment. These focus groups were conducted from December 8, 2020 to January 14, 2021. There was a total number of 84 participants. The number of participants in each focus group ranged from a minimum of six (6) and a maximum of thirteen (13) participants. During the focus group sessions, a total of 84 surveys were completed.

9
Key Informant Interviews Key informant interviews were conducted to gather additional feedback from County Human Services Directors and other identified individuals. HSACs selected interviewees based upon the needs and concerns that were identified in the data profiles and focus group sessions. Facilitators used a structured protocol to explain the purpose, goals and objectives of each key informant interview to those who were selected to participate in these key informant interviews. Recruitment. The Bergen County Department of Human Services selected individuals who worked closely with and had knowledge of the basic and priority needs that were identified. Key Informant Interview Participants. A total of eight (8) key informant interviews were conducted in this county as part of this needs assessment. These interviews were conducted from December 24, 2020 to January 12, 2021. There were also a total of eight (8) surveys completed during these interview sessions. Participant Demographics As described in the above sections, both focus group and interview participants completed the needs assessment survey. Below is the combined information for all participants to provide an overview of the participant demographics. Role in the Community (not mutually exclusive)
Number of Participants
County Resident 247 Staff or Volunteer with a Community-Based Organization (e.g., Health and Human Services providers, Planning Board Participants)
153
Staff or Volunteer with a Public Service Organization (e.g., paramedics, fire fighter, police officers, air force, judges)
39
Local Business Owner in the County 33 Community leader and advocate in the county (e.g., hold a volunteer office, clergy, activist)
34
Other 59
Age
Number of Participants
Under 18 2 18-24 11 25-34 39 35-44 64
10
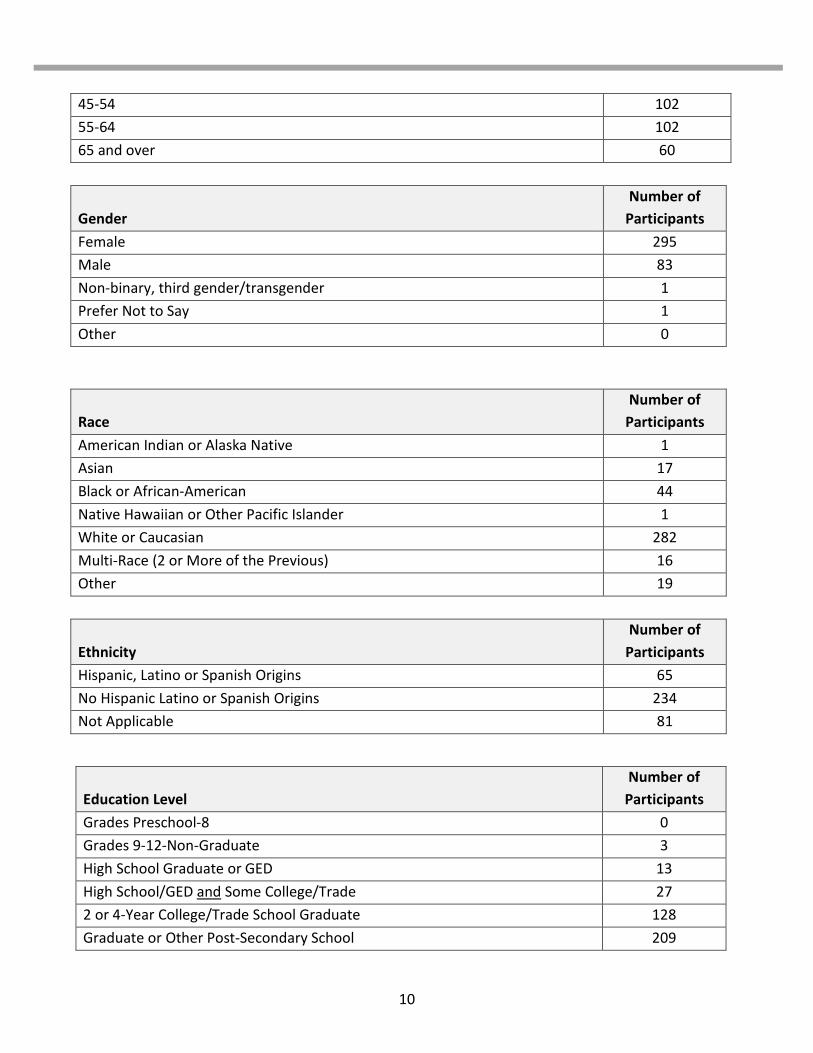
45-54 102 55-64 102 65 and over 60
Gender
Number of Participants
Female 295 Male 83 Non-binary, third gender/transgender 1 Prefer Not to Say 1 Other 0
Race
Number of Participants
American Indian or Alaska Native 1 Asian 17 Black or African-American 44 Native Hawaiian or Other Pacific Islander 1 White or Caucasian 282 Multi-Race (2 or More of the Previous) 16 Other 19
Ethnicity
Number of Participants
Hispanic, Latino or Spanish Origins 65 No Hispanic Latino or Spanish Origins 234 Not Applicable 81
Education Level
Number of Participants
Grades Preschool-8 0 Grades 9-12-Non-Graduate 3 High School Graduate or GED 13 High School/GED and Some College/Trade 27 2 or 4-Year College/Trade School Graduate 128 Graduate or Other Post-Secondary School 209

11
Employment Status
Number of Participants
Employed: Full-Time 294 Employed: Part-Time 21 Unemployed-Looking for Work 7 Unemployed-Not Looking for Work 3 Retired 26 Student 6 Self Employed 17 Unable to Work 6
Years of Community membership
Number of Participants
Range
How many years have you been a member of this community? 380 Less than 1 - 30 and over
Services Accessed by a Household Member within the last 2 Years
Number of Participants
Yes 76 No 297
Household Member History of Involvement with NJ Division of Child Protection and Permanency
Number of
Participants Yes 17 No 351
Participants represented the following municipalities The municipalities in Bergen County that are represented in this needs assessment are Allendale, Bergenfield, Carlstadt, Cliffside Park, Closter, Cresskill, Demarest, Dumont, East Rutherford, Edgewater, Elmwood Park, Englewood, Emerson, Fair Lawn, Fairview, Fort Lee, Franklin Lakes, Garfield, Hackensack, Harrington Park, Hasbrouck Heights, Haworth, Hillsdale, Ho-Ho-Kus, Little Ferry, Lodi, Lyndhurst, Mahwah, Maywood, Midland Park, Montvale, New Milford, North Arlington, Norwood, Oakland, Old Tappan, Oradell, Palisades Park, Paramus, Park Ridge, Ramsey, Ridgefield Park, River Edge, Rochelle Park, Rutherford, Saddle Brook, Saddle River, Teaneck, Teterboro, Waldwick,

12
Wallington, Washington Township, Westwood, Woodcliff Lake, Wood-Ridge, and Wyckoff. Residents who worked in Bergen County but live in other counties include the following municipalities: Belleville, Essex, Nutley, Paterson, Pompton Lakes, and Wayne.

13
PART 2

14
Key Findings Across Needs
Overall, this needs assessment is reflective of our four (4) targeted needs: Behavioral/Mental Health Services for Children, Behavioral/Mental Health Services for Adults, Housing, and Healthcare. 79.02% of participants indicated that Housing was a basic need that needed to be further addressed in Bergen County, and 68.29% indicated that Health Care was another priority need. In addition to these needs, in a separate question, 72.20% of participants indicated that Behavioral/Mental Health Services for children is an area of services that needs to be improved in Bergen County, while Behavioral/Mental Health Services for Adults was highlighted by 69.27% as another area in need. The barriers to services varied across the different needs/services identified, but mainly consisted of lack of awareness, transportation, and/or cultural barriers. Lack of awareness was the barrier that was highlighted the most among our four (4) prioritized needs. This barrier was indicated by 61.39 - 66.36% of participants among the four (4) needs.

15
Basic Need Areas

16
Need Area: Housing Status: General Need Area Housing includes the availability of affordable, stable, permanent and acceptable living accommodations. This need area seeks to assess the sufficiency of housing in the county and the degree to which residents are homeless or threatened with eviction, as well as the existence of community supports (e.g., subsidy, vouchers, etc.) and services aimed at ensuring housing for all (e.g., Homelessness Prevention Program, Housing Resource Center, community shelters, County Board of Social Services, Section 8, affordable housing, housing authorities, etc.) In Bergen County , 20% of households experienced severe cost burden (50% of income or more is spent on housing) for housing in 2017. This percentage is greater than the percentage for the state of New Jersey (American Community Survey; see County Data Profile for Additional Source Information). In 2019, which the latest year of data made available in the county profile packet, 22% of households experienced at least one of four severe housing problems: 1) overcrowding determined by high person-per-room, persons-per-bedroom, or unit square footage-per-person; 2) severe cost burden, 3) lack of kitchen facilities, or 4) lack of plumbing facilities (Comprehensive Housing Affordability Strategy; data compiled by HUD; see Data Profile for Additional Source Information). Need Assessment Key Findings Summary: Scope of the Need According to 53.38% of the survey participants, there are not enough services to help those in need of housing assistance, and 59.16% of participants indicated that the available services are not widely known. Since 2014, 23% of households in Bergen County have had severe housing problems, but that number dropped to 22% in 2017, which shows signs of improvement. Nevertheless, as indicated by the needs assessment and reiterated by several focus groups, housing is still a priority need for Bergen County. Summary: Nature of the Need As indicated by several focus groups, participants feel they do not know where to look when seeking help for their housing situation. This was reiterated in the needs assessment surveys as the biggest barrier by 64.95% of participants. In addition, participants expressed that it seems easier to change housing situations in other counties due to the barriers surrounding this issue. The top three barriers were lack of awareness, wait list, and transportation. However, the focus groups also indicated other issues such as stigma between buyer and seller, income, and accessibility.

17
Summary: Local Considerations for Addressing the Need for County Prioritized Need Area *Required only if focus group need area topic. As indicated by the needs assessment survey and the focus groups, housing is still an urgent need for Bergen County. There is a lack of affordable housing in Bergen County and rents can be very high. There is also a lack of Section 8 vouchers and a long wait list at the Housing Authority of Bergen County. With federal and state support, this is an issue that can continue to be improved at the county level. Bergen County currently has a variety of organizations that help with housing, including some that are available outside of office hours. This demonstrates that this is an issue that can be dealt with on the county level. However, lack of awareness within the county is a reoccurring barrier, which hinders headway towards improving this problem. There is not a clear place for consumers to apply for housing, and it is often difficult for these consumers to obtain/receive information related to housing. Through one of the key informant interviews, a proposed solution to this problem was to create a single point of entry for those seeking housing assistance across. This entry point would then be relied upon by the providers/organizations connected to housing assistance, and would be single route used to direct consumers for housing assistance. Similarly, a centralized website was another idea discussed during a focus group as a means to better address this issue. This website would provide resource and referral information, details for each housing provider/assistance program, hours of operation, and services available, and ultimately improve awareness of all housing resources.

18
Need Area: Survey Results
Item Total Number of
Respondents
Strongly Disagree
Disagree Agree Strongly Agree
Don’t Know
Total
1. There are enough services available in the county to help those who have this need.
311 19.94 % 33.44 % 23.15 % 7.40 % 16.08 % 100 %
2. Anyone in the county is able to access services.
311 17.68 % 29.90 % 33.12 % 6.11 % 13.18 % 100 %
3. Services are widely advertised and known by the county.
311 19.61 % 39.55 % 23.47 % 4.18 % 13.18 % 100 %
4. Services take race, age, gender, ethnicity and more into account.
311 5.47 % 18.01 % 36.01 % 9.00 % 31.51 % 100 %
5. Facilities that provide service to meet this need are of good quality (e.g., clean, well supplied).
311 3.86 % 10.93 % 40.51 % 10.29 % 34.41 % 100 %
6. Staff are well-trained, knowledgeable and provide good customer service.
311 4.82 % 12.54 % 42.12 % 10.29 % 30.23 % 100 %
Key Barriers Barrier Total Number of
Respondents Number of Times
Identified Percentage
of Responses Wait Lists 311 167 53.70 Services do not exist 311 54 17.36 Transportation 311 131 42.12 Cannot contact the service provider 311 62 19.94 Too expensive 311 86 27.65 Lack of awareness of service 311 202 64.95 Cultural Barriers 311 93 29.90 Services provided are one-size fits all, and don’t meet individual needs
311 86 27.65
Stigma Leads to Avoidance 311 105 33.76 Eligibility Requirement (explain below) 311 95 30.55 Other (explain below) 311 45 14.47

19
Need Area: Food Status: General Need Area Food security is the availability and ability to acquire nutritionally adequate and safe foods. This area of need seeks to assess the level to which residents throughout the county have adequate food and the existence of community services and supports to address unmet food needs (e.g., food banks, soup kitchen, local pantry, community-based organization, Supplemental Nutrition Assistance Program [SNAP], food stamps, Women, Infants, Children (WIC) Supplemental Nutrition Program, etc.) In Bergen County, the food insecurity rate for households was approximately 7.2% in 2017, the most recent date of available data (U.S. Census Bureau Current Population Survey and U.S. Department of Agriculture Economic Research Service; see County Data Profile for Additional Source Information). This percentage is less than the percentage rate for New Jersey. Need Assessment Key Findings Summary: Scope of the Need 33.56% of participants in the needs assessment indicated that there need to be more services providing food aid in Bergen County. As of 2017, the food insecurity rate for Bergen County was approximately 7.2%. Based on the focus group that discussed this issue, towns with lower socioeconomic status appear to have less resources available and/or less awareness for existing resources. A limited number of participants have identified this issue as a priority, but the needs assessment indicates that this is not a priority issue. It was the third most important basic need out of the six (6) options in the survey, behind health care and housing. Summary: Nature of the Need Except for the participants in one of the focus groups, the needs assessment data demonstrated that there are enough resources available regarding food. 49.31% of participants indicated that there are enough resources currently available. This data is consistent with Bergen County’s declining food insecurity rate. This rate has been consistently lower than the state average by at least 2% between 2014 and 2017. As mentioned in one focus group, neighborhoods with lower socioeconomic status seem to struggle more with having enough resources available. Lack of awareness and transportation were the two of the biggest barriers indicated by this focus group and according to the needs assessment data.

20
Need Area: Survey Results
Item Total Number of
Respondents
Strongly Disagree
Disagree Agree Strongly Agree
Don’t Know
Total
1. There are enough services available in the county to help those who have this need.
276 9.06 % 27.90 % 34.78 %
9.06 % 19.20 %
100 %
2. Anyone in the county is able to access services.
276 7.61 % 24.64 % 38.04 %
10.51 % 19.20 %
100 %
3. Services are widely advertised and known by the county.
276 10.87 % 38.41 % 28.26 %
6.52 % 15.94 %
100 %
4. Services take race, age, gender, ethnicity and more into account.
276 4.35 % 18.48 % 38.77 %
6.16 % 32.25 %
100 %
5. Facilities that provide service to meet this need are of good quality (e.g., clean, well supplied).
276 3.26 % 7.61 % 43.12 %
10.51 % 35.51 %
100 %
6. Staff are well-trained, knowledgeable and provide good customer service.
276 2.90 % 9.42 % 42.03 %
10.87 % 34.78 %
100 %
Key Barriers Barrier Total Number of
Respondents Number of Times
Identified Percentage
of Responses Wait Lists 276 54 19.57 Services do not exist 276 28 10.14 Transportation 276 116 42.03 Cannot contact the service provider 276 35 12.68 Too expensive 276 15 5.43 Lack of awareness of service 276 180 65.22 Cultural Barriers 276 60 21.74 Services provided are one-size fits all, and don’t meet individual needs
276 46 16.67
Stigma Leads to Avoidance 276 103 37.32 Eligibility Requirement (explain below) 276 43 15.58 Other (explain below) 276 42 15.22

21
Need Area: Health Care Status: Prioritized Need Area
Health care service providers deliver medical care to children and adults, these services include, but are not limited to, health promotion, disease prevention, diagnosis and treatment services. This need area seeks to determine the level of residents in the county with health care needs, the availability of insurance coverage, and the existence of community services and supports that address health and wellness (e.g., doctors and clinics, hospitals, Medicaid services, home visiting programs, Family Success Centers, etc.) In Bergen County, the estimated proportion of children under 18 years old (minors) with no health insurance coverage was 5.1% in 2017. This percentage is greater than the estimated percentage of minors with no health insurance for New Jersey in the same year (ACS; see Data Profile for Additional Source Information). In Bergen County in 2018, there were 312 reports of lack of or no prenatal care. This was a decrease by 30 reports from the previous year (Center for Disease Control and Prevention; see Data Profile for additional source information). Need Assessment Key Findings Summary: Scope of the Need Participants of the needs assessment indicated that there are currently not enough services available for healthcare. 45.95% of participants feel this way compared to the 37.07% who think the quantity of services available is not the biggest issue. 52.12% of participants indicated that available services are not widely known to those in need. As of 2018-2019, 95% of children meet all immunization requirements, which is 1 percentage point above the state average. However, as of 2017, 5.1% of children under the age of 18 did not have access to health insurance. This is a 0.7 percentage points above the state average of 4.4%. Lack of or prenatal care is another area where Bergen County is currently in the middle compared to other counties in New Jersey. Due to these facts, participants in the needs assessment survey, key informant interviews, and the focus groups all deemed this a priority issue. Summary: Nature of the Need As indicated in several focus groups and supported by multiple key informant interviews, lack of affordable insurance is a primary concern. Participants with insurance expressed how they have struggled with large copays, limited options, large insurance costs, and being under insured for the services that they need. For example, participants with a disability, physical or mental, have a disproportionately difficult time finding specialized care that is affordable and supported by their insurance. As indicated by the 61.39% of participants of the needs assessment, the biggest barrier for these issues seems to be lack of awareness on how to receive necessary aid. However, as mentioned

22
above, 45.95% of participants indicated a need for more support, especially pertaining to health insurance. Summary: Local Considerations for Addressing the Need for County Prioritized Need Area *Required only if focus group need area topic. With federal and state support, this issue is something that can be improved at the county level. As shown by the needs assessment and focus group data, this issue is urgent, especially during this pandemic. As discussed in one of the key informant interviews, the easiest way to immediately lessen this problem is to be more flexible with requirements for those in exceptional circumstances. At the community level, working to spread awareness for existing services will directly alleviate some of the discontent expressed during the focus groups and the needs assessment surveys. However, due to the vast size of this issue and the number of different problems embedded within this need, state and federal aid is required to in order to make a greater improvement in this area. There are currently services available to aid with this issue, but even those receiving aid have drawn our attention to problems like high cost and rigid deadlines during unprecedented circumstances. These problems need to be addressed by both the county and the state in order to effectively lessen this burden for Bergen County residents. There are areas of Bergen County where public transportation is very limited, especially in the northern part of the County, including Mahwah, Franklin Lakes, Oakland and Saddle River. While there are numerous commuter trains and bus lines that go into New York City, few buses have routes between individual towns. These transportation limitations often present a barrier for people who need to travel to services in various municipalities. Additionally, the COVID-19 pandemic has made transportation even more challenging this past year.
23
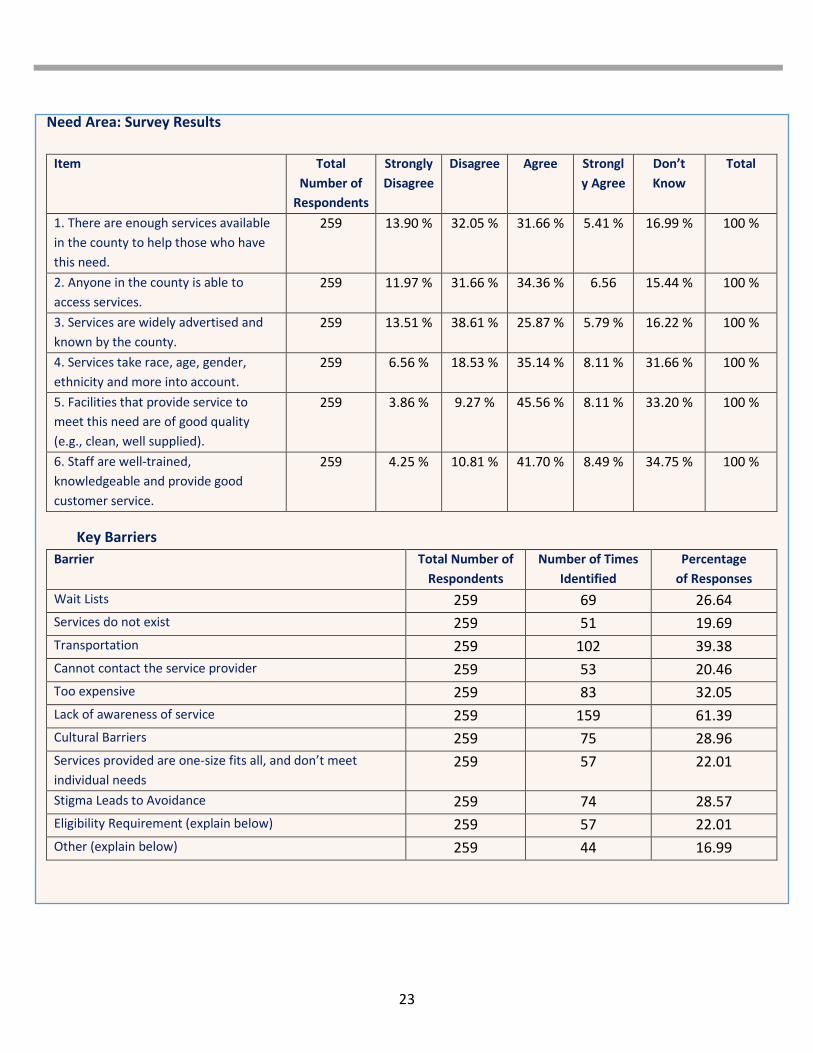
Need Area: Survey Results
Item Total Number of
Respondents
Strongly Disagree
Disagree Agree Strongly Agree
Don’t Know
Total
1. There are enough services available in the county to help those who have this need.
259 13.90 % 32.05 % 31.66 % 5.41 % 16.99 % 100 %
2. Anyone in the county is able to access services.
259 11.97 % 31.66 % 34.36 % 6.56 15.44 % 100 %
3. Services are widely advertised and known by the county.
259 13.51 % 38.61 % 25.87 % 5.79 % 16.22 % 100 %
4. Services take race, age, gender, ethnicity and more into account.
259 6.56 % 18.53 % 35.14 % 8.11 % 31.66 % 100 %
5. Facilities that provide service to meet this need are of good quality (e.g., clean, well supplied).
259 3.86 % 9.27 % 45.56 % 8.11 % 33.20 % 100 %
6. Staff are well-trained, knowledgeable and provide good customer service.
259 4.25 % 10.81 % 41.70 % 8.49 % 34.75 % 100 %
Key Barriers Barrier Total Number of
Respondents Number of Times
Identified Percentage
of Responses Wait Lists 259 69 26.64 Services do not exist 259 51 19.69 Transportation 259 102 39.38 Cannot contact the service provider 259 53 20.46 Too expensive 259 83 32.05 Lack of awareness of service 259 159 61.39 Cultural Barriers 259 75 28.96 Services provided are one-size fits all, and don’t meet individual needs
259 57 22.01
Stigma Leads to Avoidance 259 74 28.57 Eligibility Requirement (explain below) 259 57 22.01 Other (explain below) 259 44 16.99

24
Need Area: Community Safety Status: General Need Area Community safety is the ability to be and feel safe from crime or violence in one’s community and public spaces. This need area seeks to assess the level to which residents throughout the county are safe from crime or violence and the existence of community services and supports to assist residents with being and feeling safe in their community (e.g., local police, DCF’s Child Protection and Permanency, Family Success Centers, security companies, neighborhood watch, safe havens, hospitals, etc.) In Bergen County, there was a total of 804 violent crimes in 2016 and the violent crime rate per 1,000 was 0.9% (NJ Department of Law and Public Safety, Division of NJ State Police, Uniform Crime Reports, Updated 8/15/19; see Data Profile for Additional Source Information). Of the non-violent crimes committed, there was a total of 16 arson, 444 motor vehicle theft, 7,569 larceny and 1,113 burglary in 2016 (NJ Department of Law and Public Safety, Division of NJ State Police, Uniform Crime Report, Updated 8/15/19; see Data Profile for Additional Source Information). Need Assessment Key Findings Summary: Scope of the Need 60.8% of participants of the needs assessment survey indicated that there are currently enough services available regarding community safety. Only 19.2% of participants indicated that the available services do not take race, ethnicity, age, gender, etc., into account. Based on this data, and the consistency with the other questions asked, this is not considered a priority issue at this time. Summary: Nature of the Need 48% of participants in the needs assessment expressed that they believe current services regarding community safety do a sufficient job considering race, gender, age, ethnicity, etc. This is compared to the 19.2% that disagree with this statement. In addition, 56% of participants said that existing facilities providing service for this issue are all in good condition and provide adequate quality of service. Like most of the issues discussed in the needs assessment, the main barrier for receiving aid is a lack of awareness.

25
Need Area: Survey Results
Item Total Number of
Respondents
Strongly Disagree
Disagree Agree Strongly Agree
Don’t Know
Total
1. There are enough services available in the county to help those who have this need.
250 3.60 % 16.40 % 51.60 % 9.20 % 19.20 % 100 %
2. Anyone in the county is able to access services.
250 4.80 % 14.40 % 54.40 % 8.00 % 18.40 % 100 %
3. Services are widely advertised and known by the county.
250 6.00 % 27.20 % 38.00 % 7.20 % 21.60 % 100 %
4. Services take race, age, gender, ethnicity and more into account.
250 3.60 % 15.60 % 40.40 % 7.60 % 32.80 % 100 %
5. Facilities that provide service to meet this need are of good quality (e.g., clean, well supplied).
250 2.40 % 4.80 % 46.40 % 9.60 % 36.80 % 100 %
6. Staff are well-trained, knowledgeable and provide good customer service.
250 3.60 % 10.40 % 46.80 % 7.60 % 31.60 % 100 %
Key Barriers Barrier Total Number of
Respondents Number of Times
Identified Percentage
of Responses Wait Lists 250 28 11.20 Services do not exist 250 23 9.20 Transportation 250 31 12.40 Cannot contact the service provider 250 25 10.00 Too expensive 250 10 4.00 Lack of awareness of service 250 122 48.80 Cultural Barriers 250 93 37.20 Services provided are one-size fits all, and don’t meet individual needs
250 54 21.60
Stigma Leads to Avoidance 250 76 30.40 Eligibility Requirement (explain below) 250 14 5.60 Other (explain below) 250 40 16.00

26
Need Area: Employment and Career Services Status: General Need Area Employment is the condition of having paid work or an alternate ability to earn a living. This need area seeks to determine the employment status (e.g., full or part-time, permanent or temporary) of county residents and the employment opportunities within a county, as well as the existence of community services and supports to assist in ensuring employment (e.g., unemployment services, career development, County One-Stop Centers, Family Success Centers, County Board of Social Services, etc.) Need Assessment Key Findings Summary: Scope of the Need Between June 2018 and May 2019, the unemployment rate in Bergen County dropped from 3.8% to 2.5%, which was 0.5 percentage points below the state average (Source: County Data Profile). When asked to address three (3) of the most important basic needs, only 41.9% of participants identified employment as one of the top three. While this is not regarded as a priority issue, 43.34% of participants indicated that there are not enough services available to help with employment, and 49.83% indicated that existing services are not widely known. This was not considered a priority issue, but it received enough attention to be deemed one of relative importance. Summary: Nature of the Need 40% of participants indicated that services adequately take account of age, gender, ethnicity, race, etc., while only 20.83% oppose this notion. The main barrier for these services, as indicated by 66.25% of participants, is lack of awareness.

27
Need Area: Survey Results
Item Total Number of
Respondents
Strongly Disagree
Disagree Agree Strongly Agree
Don’t Know
Total
1. There are enough services available in the county to help those who have this need.
240 9.17 % 34.17 % 31.25 % 3.33 % 22.08 % 100 %
2. Anyone in the county is able to access services.
240 7.08 % 25.83 % 40.42 % 2.92 % 23.75 % 100 %
3. Services are widely advertised and known by the county.
240 9.58 % 41.25 % 27.08 % 3.33 % 18.75 % 100 %
4. Services take race, age, gender, ethnicity and more into account.
240 4.58 % 16.25 % 35.00 % 5.00 % 39.17 % 100 %
5. Facilities that provide service to meet this need are of good quality (e.g., clean, well supplied).
240 3.33 % 12.08 % 41.67 % 3.75 % 39.17 % 100 %
6. Staff are well-trained, knowledgeable and provide good customer service.
240 4.58 % 13.75 % 40.42 % 5.42 % 35.83 % 100 %
Key Barriers Barrier Total Number of
Respondents Number of Times
Identified Percentage
of Responses Wait Lists 240 47 19.58 Services do not exist 240 36 15.00 Transportation 240 82 34.17 Cannot contact the service provider 240 37 15.42 Too expensive 240 14 5.83 Lack of awareness of service 240 159 66.25 Cultural Barriers 240 64 26.67 Services provided are one-size fits all, and don’t meet individual needs
240 60 25.00
Stigma Leads to Avoidance 240 50 20.83 Eligibility Requirement (explain below) 240 30 12.50 Other (explain below) 240 44 18.33

28
Need Area: CHILD CARE Status: General Need Area Child care services include agencies that provide care and supervision to children, as well as before- and after-school care programs. This need area seeks to assess the level to which residents throughout the county need child care, before and after school care, and the existence of community services and supports that address the need for child care (e.g., licensed day care providers, subsidized and unsubsidized child care, Child Care Resource and Referral Agencies, Boys & Girls Clubs, YMCAs, Family Success Centers, County Board of Social Services, etc.) In Bergen County in 2017 the median monthly center-based child care cost for an infant was greater than the median monthly cost for New Jersey. The median monthly center-based child care cost for a toddler was greater than the median monthly cost for NJ. Median monthly center-based child care cost for Pre-K in Bergen County was greater than the median monthly cost for New Jersey. Need Assessment Key Findings Summary: Scope of the Need 44.78% of participants of this needs assessment indicated that there are not enough child care services available in Bergen County. In addition, 46.09% of participants expressed that these services are not available to everyone who needs them. Bergen County community members have identified this as an important issue, but not one of the priority issues because of how the data compares. Similar to employment, this is an issue of importance that may be a priority issue in the future if it is not addressed soon. Summary: Nature of the Need 37.83% of survey participants indicated that the existing services adequately take race, ethnicity, age, gender, etc., into consideration. This is compared to the 22.17% who oppose this notion. Furthermore, participants of the needs assessment indicated that existing services are in good condition and have well trained staff. The main issue seems to be the amount of services currently available. The main barrier, as expressed by 55.25% of survey participants, was lack of awareness.

29
Need Area: Survey Results
Item Total Number of
Respondents
Strongly Disagree
Disagree Agree Strongly Agree
Don’t Know
Total
1. There are enough services available in the county to help those who have this need.
230 13.04 % 31.74 % 26.96 % 3.91 % 24.35 % 100 %
2. Anyone in the county is able to access services.
230 12.61 % 33.48 % 26.09 % 3.48 % 24.35 % 100 %
3. Services are widely advertised and known by the county.
230 12.61 % 35.22 % 23.48 % 1.74 % 26.96 % 100 %
4. Services take race, age, gender, ethnicity and more into account.
230 6.52 % 15.65 % 34.35 % 3.48 % 40.00 % 100 %
5. Facilities that provide service to meet this need are of good quality (e.g., clean, well supplied).
230 3.04 % 8.70 % 38.70 % 6.09 % 43.48 % 100 %
6. Staff are well-trained, knowledgeable and provide good customer service.
230 3.04 % 9.13 % 38.26 % 6.09 % 43.48 % 100 %
Key Barriers Barrier Total Number of
Respondents Number of Times
Identified Percentage
of Responses Wait Lists 230 77 33.48 Services do not exist 230 41 17.83 Transportation 230 72 31.30 Cannot contact the service provider 230 14 6.09 Too expensive 230 86 37.39 Lack of awareness of service 230 128 55.65 Cultural Barriers 230 46 20.00 Services provided are one-size fits all, and don’t meet individual needs
230 42 18.26
Stigma Leads to Avoidance 230 23 10.00 Eligibility Requirement (explain below) 230 51 22.17 Other (explain below) 230 43 18.70


31
Need Area: Services for Families Caring for a Child of a Relative Status: General Need Area Kinship services are supports for caregivers who have taken on the responsibility of caring for kin, including financial assistance, support groups, navigation of government benefits and assistance, and more. This need area seeks to assess the level to which residents require kinship services and the existence of community services and supports to support the caregivers’ ability to care for their kin (e.g., Kinship Navigator Program, DCF’s Division of Child Protection and Permanency, Family Success Centers, County Board of Social Services, etc.) Need Assessment Key Findings Summary: Scope of the Need 34.08% of participants indicated that there are not enough services for this issue. This is compared to the 21.07% who opposed this notion. In addition, 26.91% of participants indicated that it is hard for anyone to have access to the services that are currently available. Given these low percentages, this need is not considered a priority need. Summary: Nature of the Need 29.15% of participants indicated that the services currently available take race, ethnicity, gender, age, etc., into consideration. This is compared to the 14.25% that disagreed with this notion. Furthermore, the vast majority of participants of this needs assessment indicated that the condition of existing facilities is adequate and that staff are well trained.

32
Need Area: Survey Results
Item Total Number of
Respondents
Strongly Disagree
Disagree Agree Strongly Agree
Don’t Know
Total
1. There are enough services available in the county to help those who have this need.
223 8.07 % 26.01 % 18.83 % 2.24 % 44.84 % 100 %
2. Anyone in the county is able to access services.
223 6.28 % 20.63 26.91 % 1.79 % 44.39 % 100 %
3. Services are widely advertised and known by the county.
223 11.21 % 31.39 % 14.80 % 1.79 % 40.81 % 100 %
4. Services take race, age, gender, ethnicity and more into account.
223 4.04 % 11.21 % 26.01 % 3.14 % 55.61 % 100 %
5. Facilities that provide service to meet this need are of good quality (e.g., clean, well supplied).
223 2.69 % 5.83 % 25.56 % 3.59 % 62.33 % 100 %
6. Staff are well-trained, knowledgeable and provide good customer service.
223 2.69 % 8.52 % 25.11 % 4.04 % 59.64 % 100 %
Key Barriers Barrier Total Number of
Respondents Number of Times
Identified Percentage
of Responses Wait Lists 223 30 13.45 Services do not exist 223 35 15.70 Transportation 223 34 15.25 Cannot contact the service provider 223 24 10.76 Too expensive 223 20 8.97 Lack of awareness of service 223 150 67.26 Cultural Barriers 223 35 15.70 Services provided are one-size fits all, and don’t meet individual needs
223 30 13.45
Stigma Leads to Avoidance 223 28 12.56 Eligibility Requirement (explain below) 223 24 10.76 Other (explain below) 223 44 19.73

33
Need Area: Behavioral/Mental Health Services for Children Status: Prioritized Need Area Child behavioral/mental health services are services designed to assess, address, and support the emotional, psychological, and social well-being of children. This need area seeks to assess the level to which children throughout the county have behavioral/mental health disorders, their ability to cope and function, and the existence of community services and supports to address children’s behavioral/mental health needs (e.g., hospitals, in/out-patient therapy, individualized counseling, medication management, PerformCare, DCF’s Children’s System of Care, Family Support Organizations, etc.) Need Assessment Key Findings Summary: Scope of the Need Focus group data and key informant interviews indicate that lack of eligibility due to strict criteria is a main barrier for this service. As a result, this issue is disproportionately affecting those with lower socioeconomic status due to lack of insurance or simply being underinsured. In addition, 41.74% of participants indicated that there are not enough services currently available. This is compared to the 34.86% who are satisfied with the current number of services available. Furthermore, 35.78% of participants indicated that it is difficult for anyone who needs these services to have access to them. Summary: Nature of the Need Only 42.66% of participants of this needs assessment indicated that these services are easily accessible for everyone. Multiple key informant interviews and focus groups provided that there is a lack of availability for those who need these services. Eligibility criteria was the main barrier discussed in these forums. Those in need often have no insurance or are underinsured, hindering his/her ability to receive this service. Moreover, 65.14% of participants of the needs assessment indicated that lack of awareness is the main barrier for this service. Lack of awareness of available services and ineligibility are the main issues residents are facing. Summary: Local Considerations for Addressing the Need for County Prioritized Need Area *Required only if focus group need area topic. Due to the vast attention received by participants in focus groups and key informant interviews, this is a primary need for Bergen County. Many challenges were discussed, including ineligibility, lack of awareness, transportation, difficulties with staff, and other issues. Telehealth options have increased accessibility for many who do not have a means of transportation, although the COVID-19 pandemic has restricted the ability to transport people to in-person programs.

34
Another obstacle discussed, was the fact that many providers require patients to engage in treatment prior to prescribing medication. Changes in the perception of mental health treatment have shifted to regulating/remedying issues with medication only. As a result, it is challenging to find a professional who will simply prescribe medication to unknown patients. The same is true of psychiatric time for children and adolescents. Advance Practice Psychiatric Nurses were intended to fill the gap, and have done so, but not to the extent necessary. The age of board certified psychiatrists is advancing, and the new generation of medical practitioners are not eager to enter this specialty for a variety of reasons. However, with state and federal assistance, Bergen County is confident that many of these issues can be improved at the county level. One proposed solution is to increase awareness of existing services that explicitly lists eligibility requirements. A media campaign about the vast resources available in Bergen County, in addition word-of-mouth “marketing,” will help to get the word out to the community. Finally, another solution is to increase prevention and education to help lessen the reliance on these services.

35
Need Area: Survey Results
Item Total Number of
Respondents
Strongly Disagree
Disagree Agree Strongly Agree
Don’t Know
Total
1. There are enough services available in the county to help those who have this need.
218 14.22 % 27.52 % 27.06 % 7.80 % 23.39 % 100 %
2. Anyone in the county is able to access services.
218 14.22 % 21.56 % 35.32 % 7.34 % 21.56 % 100 %
3. Services are widely advertised and known by the county.
218 18.35 % 35.78 % 21.56 % 4.59 % 19.72 % 100 %
4. Services take race, age, gender, ethnicity and more into account.
218 8.72 % 11.01 % 36.70 % 5.96 % 37.61 % 100 %
5. Facilities that provide service to meet this need are of good quality (e.g., clean, well supplied).
218 6.42 % 5.50 % 40.83 % 7.34 % 39.91 % 100 %
6. Staff are well-trained, knowledgeable and provide good customer service.
218 6.88 % 8.26 % 40.37 % 8.72 % 35.78 % 100 %
Key Barriers Barrier Total Number of
Respondents Number of Times
Identified Percentage
of Responses Wait Lists 218 67 30.73 Services do not exist 218 45 20.64 Transportation 218 76 34.86 Cannot contact the service provider 218 36 16.51 Too expensive 218 54 24.77 Lack of awareness of service 218 142 65.14 Cultural Barriers 218 66 30.28 Services provided are one-size fits all, and don’t meet individual needs
218 55 25.23
Stigma Leads to Avoidance 218 85 38.99 Eligibility Requirement (explain below) 218 36 16.51 Other (explain below) 218 37 16.97

36
Need Area: Behavioral/Mental Health Services for Adults Status: Prioritized Need Area Adult behavioral/mental health services include services designed to assess, address, and support the emotional, psychological, and social well-being of adults. This need area seeks to assess the level to which adult residents throughout the county have behavioral/mental health disorders, their ability to function, and the existence of community services and supports to address adult behavioral/mental health needs (e.g., hospitals, in/out-patient therapy, individualized counseling, medication management, Statewide Parent Advocacy Network, Division of Mental Health and Addiction Services, PerformCare, etc.) Need Assessment Key Findings Summary: Scope of the Need Focus group data and key informant interviews indicated that the lack of eligibility due to strict criteria is the main barrier to these services. Due to this notion, this issue is disproportionately affecting those with lower socioeconomic status due to lack of insurance or simply being underinsured. In addition, 39.72% of survey participants indicated that there are not enough services currently available. This is compared to the 38.78% who are satisfied with the current number of services available. In addition, 36.92% of survey participants noted that it is difficult for anyone who needs these services to access them. Summary: Nature of the Need Only 36.92% of survey participants of the needs assessment indicated that these services are easily accessible for everyone. Multiple key informant interviews and focus groups indicated a lack of availability for those who need these services. Eligibility criteria was the main barrier discussed in these forums. Those in need often have no insurance or are underinsured, hindering his/her ability to receive this service. In addition, 66.36% of survey participants indicated that lack of awareness is the main barrier to these services. Lack of awareness of available services and ineligibility appear to be the main issue here.

37
Summary: Local Considerations for Addressing the Need for County Prioritized Need Area *Required only if focus group need area topic. Due to the vast attention received by participants in focus groups and key informant interviews, this need is a primary need for Bergen County. Many barriers were discussed consisting of ineligibility, lack of awareness, transportation, difficulties with staff, etc. However, with state and federal assistance, this is an issue that can be improved at the county level. One proposed solution was increasing awareness for existing services and explicitly listing eligibility requirements. Another reoccurring solution is increasing preventative actions and education to help lessen the reliance on these services.

38
Need Area: Survey Results
Item Total Number of
Respondents
Strongly Disagree
Disagree Agree Strongly Agree
Don’t Know
Total
1. There are enough services available in the county to help those who have this need.
214 10.75 % 28.97 % 34.11 % 4.67 % 21.50 % 100 %
2. Anyone in the county is able to access services.
214 9.35 % 27.57 % 35.05 % 5.61 % 22.43 % 100
3. Services are widely advertised and known by the county.
214 14.02 % 34.58 % 25.23 % 4.67 % 21.50 % 100 %
4. Services take race, age, gender, ethnicity and more into account.
214 4.67 % 12.15 % 36.45 % 7.01 % 39.72 % 100 %
5. Facilities that provide service to meet this need are of good quality (e.g., clean, well supplied).
214 3.27 % 9.81 % 40.19 % 6.07 % 40.65 % 100 %
6. Staff are well-trained, knowledgeable and provide good customer service.
214 4.21 % 9.35 % 40.19 % 8.88 % 37.38 % 100 %
Key Barriers Barrier Total Number of
Respondents Number of Times
Identified Percentage
of Responses Wait Lists 214 64 29.91 Services do not exist 214 38 17.76 Transportation 214 66 30.84 Cannot contact the service provider 214 35 16.36 Too expensive 214 65 30.37 Lack of awareness of service 214 142 66.36 Cultural Barriers 214 61 28.50 Services provided are one-size fits all, and don’t meet individual needs
214 45 21.03
Stigma Leads to Avoidance 214 90 42.06 Eligibility Requirement (explain below) 214 27 12.62 Other (explain below) 214 34 15.89

39
Need Area: Substance Use Disorder and Prevention Services (Adults and Adolescents) Status: General Need Area Substance use treatment services includes services that provide a range of assessment and supportive treatment for substance use disorders. This need area seeks to gauge the substance use needs and the existence of community services and supports to address substance use disorder needs throughout the county (e.g., detoxification, short- and long-term inpatient treatment services, outpatient treatment services, medication management, Division of Mental Health and Addiction Services, NJ 2-1-1, etc.) Need Assessment Key Findings Summary: Scope of the Need Only 38.67% of participants indicated that there are not enough services available. In addition, only 35.38% of participants indicated that these services are not easily accessible for everyone who needs them. However, only 29.72% of participants indicated that services are widely advertised by the County. This need was not identified in any focus group or key informant interviews. Summary: Nature of the Need Only 14.62% of participants indicated that existing facilities need to improve consideration for race, ethnicity, age, gender, etc. This is one of the lowest out of all the topics. Furthermore, 43.87% of participants indicated that existing facilities are well kept and provide adequate assistance. This is compared to the 14.01% who oppose this notion.

40
Need Area: Survey Results
Item Total Number of
Respondents
Strongly Disagree
Disagree Agree Strongly Agree
Don’t Know
Total
1. There are enough services available in the county to help those who have this need.
212 15.09 % 23.58 % 26.89 % 2.83 % 31.60%
100%
2. Anyone in the county is able to access services.
212 11.32 % 24.06 % 31.13 % 3.77 % 29.72%
100%
3. Services are widely advertised and known by the county.
212 16.04 % 26.42 % 26.42 % 3.30 % 27.83%
100%
4. Services take race, age, gender, ethnicity and more into account.
212 5.19 % 9.43 % 33.49 % 6.13 % 45.75%
100%
5. Facilities that provide service to meet this need are of good quality (e.g., clean, well supplied).
212 3.30 % 11.79 % 35.85 % 3.77 % 45.28%
100%
6. Staff are well-trained, knowledgeable and provide good customer service.
212 3.77 % 10.38 % 37.47 % 6.13 %
41.98%
100%
Key Barriers Barrier Total Number of
Respondents Number of Times
Identified Percentage
of Responses Wait Lists 212 63 29.72 Services do not exist 212 37 17.45 Transportation 212 70 33.02 Cannot contact the service provider 212 31 14.62 Too expensive 212 54 25.47 Lack of awareness of service 212 128 60.38 Cultural Barriers 212 56 26.42 Services provided are one-size fits all, and don’t meet individual needs
212 48 22.64
Stigma Leads to Avoidance 212 82 38.68 Eligibility Requirement (explain below) 212 31 14.62 Other (explain below) 212 35 16.51

41

42
Need Area: Domestic Violence Services Status: General Need Area Domestic violence is violence or other forms of abuse by one person against another in a domestic setting, e.g., husband and wife, child and parent, sibling and sibling, etc. This need area seeks to assess the level to which domestic violence impacts residents throughout the county, and the existence of community services and supports that will keep families safe from physical, sexual, financial, digital, mental, and emotional forms of domestic violence (e.g., shelter services, victim services, batterers intervention services, DCF’s Office of Domestic Violence Services, domestic violence liaisons, domestic violence hotline, Family Success Centers, etc.) Need Assessment Key Findings Summary: Scope of the Need 35.55% of survey participants indicated that there are not enough services currently available pertaining to this issue. This is greater than the 31.76% who oppose this notion. However, 47.87% of participants indicated that the existing services are easily accessible for anyone who needs them. Only 23.22% indicated the opposite. Aside from lack of services available, participants indicated that a key barrier for this issue is the stigma leading to avoidance; 48.82% of participants highlighted this barrier. Summary: Nature of the Need Only 13.75% of survey participants indicated that existing facilities need to improve consideration for race, gender, culture, age, ethnicity, etc. Similarly, most participants indicated that existing facilities have well educated staff and were effective. The main problem listed, is lack of awareness with regard to where a consumer can find this support. This was the main barrier indicated by 64.45% of participants.

43
Need Area: Survey Results
Item Total Number of
Respondents
Strongly Disagree
Disagree Agree Strongly Agree
Don’t Know
Total
1. There are enough services available in the county to help those who have this need.
211 6.64 % 28.91 % 27.49 % 4.27 % 32.70 % 100 %
2. Anyone in the county is able to access services.
211 5.21 % 18.01 % 40.76 % 7.11 % 28.91 % 100 %
3. Services are widely advertised and known by the county.
211 9.48 % 31.28 % 25.12 % 3.32 % 30.81 % 100 %
4. Services take race, age, gender, ethnicity and more into account.
211 3.32 % 10.43 % 39.81 % 4.27 % 42.18 % 100 %
5. Facilities that provide service to meet this need are of good quality (e.g., clean, well supplied).
211 1.90 % 4.74 % 38.39 % 6.64 % 48.34 % 100 %
6. Staff are well-trained, knowledgeable and provide good customer service.
211 1.90 % 6.16 % 38.86 % 7.11 % 45.97 % 100 %
Key Barriers Barrier Total Number of
Respondents Number of Times
Identified Percentage
of Responses Wait Lists 211 38 18.01 Services do not exist 211 22 10.43 Transportation 211 49 23.22 Cannot contact the service provider 211 18 8.53 Too expensive 211 15 7.11 Lack of awareness of service 211 136 64.45 Cultural Barriers 211 75 35.55 Services provided are one-size fits all, and don’t meet individual needs
211 30 14.22
Stigma Leads to Avoidance 211 103 48.82 Eligibility Requirement (explain below) 211 12 5.69 Other (explain below) 211 34 16.11

44

45
Need Area: Parenting Skills Services Status: General Need Area Parenting skills services are programs that aim to enhance parental capacity and skills, improve parenting practices and behaviors, and teach age appropriate child development skills and milestones. This need area seeks to assess the level to which residents require parenting skills services and the existence of community services and supports which address parenting skills (e.g., home visiting programs, Nurse-Family Partnership, Family Preservation, Family Success Centers, Family Service Organizations, Parents Anonymous, Parent Mentors, SPAN, etc.). Need Assessment Key Findings Summary: Scope of the Need 40.47% of survey participants indicated that there are not enough services currently available. This is compared to the 25.23% who are satisfied with the number of services currently available. In addition, 32.38% of participants indicated that it is not easy for anyone to have access to these services. 45.24% of participants noted that existing services are currently not well known to those who need them. This is compared to the 21.9% of participants who opined that the existing services are well known. Summary: Nature of the Need Only 16.19% of survey participants indicated that the existing services need to improve consideration for race, ethnicity, age, gender, etc. In addition, less than 10% of participants indicated that existing services need improvements to overall quality and/or with regard to staff. This, as well as the data above, indicated that the biggest barrier surrounding this issue appears to be lack of availability and lack of awareness. This is further shown by the fact that 72.38% of participants indicated a lack of awareness as the main barrier to this service.

46
Need Area: Survey Results
Item Total Number of
Respondents
Strongly Disagree
Disagree Agree Strongly Agree
Don’t Know
Total
1. There are enough services available in the county to help those who have this need.
210 10.95 % 29.52 % 23.33 % 1.90 % 34.29 % 100 %
2. Anyone in the county is able to access services.
210 9.52 % 22.86 % 28.10 % 1.90 % 37.62 % 100 %
3. Services are widely advertised and known by the county.
210 15.24 % 30.00 % 20.95 % 0.95 % 32.86 % 100 %
4. Services take race, age, gender, ethnicity and more into account.
210 4.29 % 11.90 % 32.38 % 3.33 % 48.10 % 100 %
5. Facilities that provide service to meet this need are of good quality (e.g., clean, well supplied).
210 2.86 % 2.86 % 32.86 % 3.81 % 57.62 % 100 %
6. Staff are well-trained, knowledgeable and provide good customer service.
210 2.86 % 4.29 % 34.29 % 5.24 % 53.33 % 100 %
Key Barriers Barrier Total Number of
Respondents Number of Times
Identified Percentage
of Responses Wait Lists 210 27 12.86 Services do not exist 210 33 15.71 Transportation 210 52 24.76 Cannot contact the service provider 210 19 9.05 Too expensive 210 16 7.62 Lack of awareness of service 210 152 72.38 Cultural Barriers 210 61 29.05 Services provided are one-size fits all, and don’t meet individual needs
210 33 15.71
Stigma Leads to Avoidance 210 63 30.00 Eligibility Requirement (explain below) 210 17 8.10 Other (explain below) 210 34 16.19

47
48
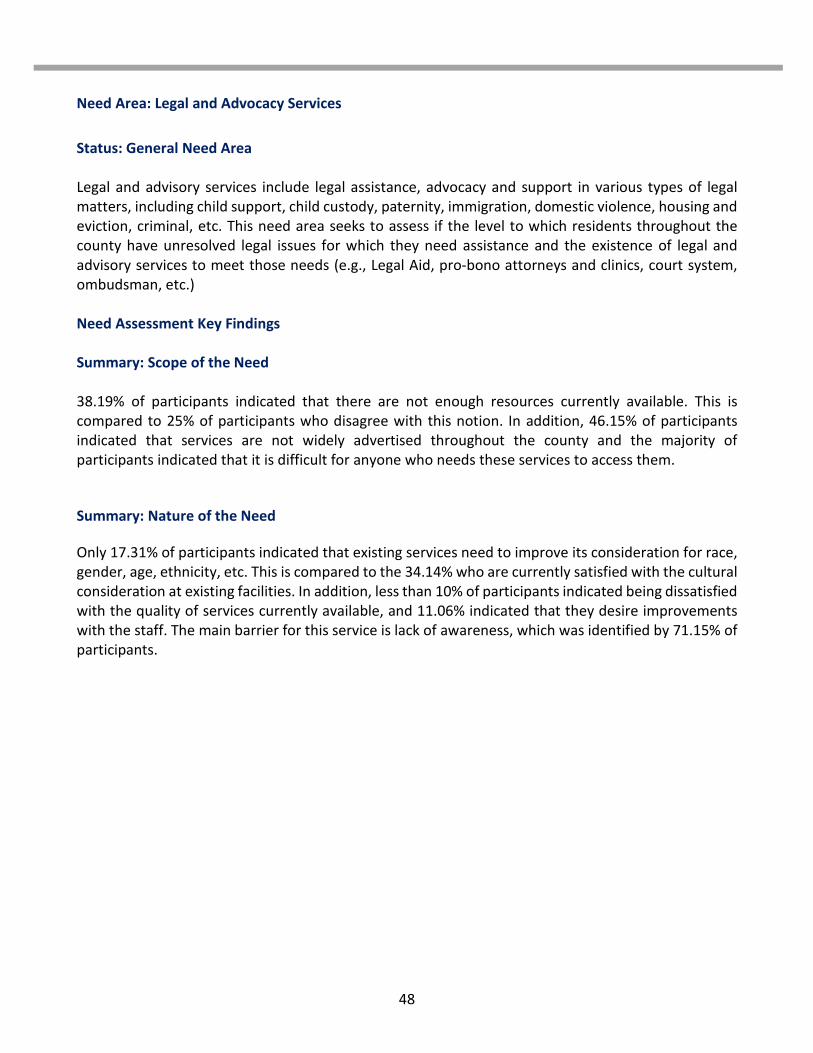
Need Area: Legal and Advocacy Services Status: General Need Area Legal and advisory services include legal assistance, advocacy and support in various types of legal matters, including child support, child custody, paternity, immigration, domestic violence, housing and eviction, criminal, etc. This need area seeks to assess if the level to which residents throughout the county have unresolved legal issues for which they need assistance and the existence of legal and advisory services to meet those needs (e.g., Legal Aid, pro-bono attorneys and clinics, court system, ombudsman, etc.) Need Assessment Key Findings Summary: Scope of the Need 38.19% of participants indicated that there are not enough resources currently available. This is compared to 25% of participants who disagree with this notion. In addition, 46.15% of participants indicated that services are not widely advertised throughout the county and the majority of participants indicated that it is difficult for anyone who needs these services to access them. Summary: Nature of the Need Only 17.31% of participants indicated that existing services need to improve its consideration for race, gender, age, ethnicity, etc. This is compared to the 34.14% who are currently satisfied with the cultural consideration at existing facilities. In addition, less than 10% of participants indicated being dissatisfied with the quality of services currently available, and 11.06% indicated that they desire improvements with the staff. The main barrier for this service is lack of awareness, which was identified by 71.15% of participants.

49
Need Area: Survey Results
Item Total Number of
Respondents
Strongly Disagree
Disagree Agree Strongly Agree
Don’t Know
Total
1. There are enough services available in the county to help those who have this need.
208 12.50 % 25.96 % 21.15% 3.85 % 36.54 % 100 %
2. Anyone in the county is able to access services.
208 11.06 % 23.08 % 23.08% 5.29 % 37.50 % 100 %
3. Services are widely advertised and known by the county.
208 15.38 % 30.77 % 17.79% 3.85 % 32.21 % 100 %
4. Services take race, age, gender, ethnicity and more into account.
208 5.29 % 12.02 % 28.37% 5.77 % 48.56 % 100 %
5. Facilities that provide service to meet this need are of good quality (e.g., clean, well supplied).
208 2.88 % 6.25 % 26.92% 6.25 % 57.69 % 100 %
6. Staff are well-trained, knowledgeable and provide good customer service.
208 3.37 % 7.69 % 30.29% 9.13 % 49.52 % 100 %
Key Barriers Barrier Total Number of
Respondents Number of Times
Identified Percentage
of Responses Wait Lists 208 34 16.35 Services do not exist 208 33 15.87 Transportation 208 44 21.15 Cannot contact the service provider 208 22 10.58 Too expensive 208 34 16.35 Lack of awareness of service 208 148 71.15 Cultural Barriers 208 45 21.63 Services provided are one-size fits all, and don’t meet individual needs
208 27 12.98
Stigma Leads to Avoidance 208 38 18.27 Eligibility Requirement (explain below) 208 25 12.02 Other (explain below) 208 33 15.87
Needs