network for teaching entrepreneurship (nfte) 2016 alumni ... · outcomes specifically for alumni of...
TRANSCRIPT

Network for Teaching Entrepreneurship (NFTE) 2016 Alumni Survey Findings
“NFTE Has Built My Confidence to Go After My Dreams”
— NFTE graduate
Jonathan Nakamoto John Rice
February 2017

© 2017 WestEd. All rights reserved.
WestEd — a national nonpartisan, nonprofit research, development, and service agency — works with education and other communities to promote excellence, achieve equity, and improve learning for children, youth, and adults. WestEd has more than a dozen offices nationwide, from Washington and Massachusetts to Arizona and California, with its headquarters in San Francisco. For more information about WestEd, visit WestEd.org; call 415.565.3000 or, toll-free, (877) 4-WestEd; or write: WestEd / 730 Harrison Street / San Francisco, CA 94107-1242.
Suggested Citation: Nakamoto, J. & Rice, J. (2017). Network for Teaching Entrepreneurship (NFTE) 2016 alumni survey findings. San Francisco, CA: WestEd.

i
Table of Contents
Executive Summary ................................................................................. ivOverview of the Network for Teaching Entrepreneurship ............................................ ivStudy Overview ............................................................................................................... ivEmployability Skills .......................................................................................................... vCollege Enrollment ......................................................................................................... vBusiness Launch .............................................................................................................. viEmployment Outcomes ................................................................................................. viiStartup Summer Participants .......................................................................................... viii
Background .............................................................................................. 1Entrepreneurship Education and Training ..................................................................... 1History of the Network for Teaching Entrepreneurship ................................................. 2The Entrepreneurial Mindset ........................................................................................... 2NFTE Programs ................................................................................................................. 3Study Goals ..................................................................................................................... 6
Method ...................................................................................................... 8Description of the 2016 NFTE Alumni Survey ................................................................. 8Contact Information Database ...................................................................................... 8Survey Administration ..................................................................................................... 10Response Rates ............................................................................................................... 10Characteristics of the Survey Respondents .................................................................. 11Analysis Plan ................................................................................................................... 12
Findings ...................................................................................................... 14Employability Skills .......................................................................................................... 14College Enrollment ......................................................................................................... 15Business Launch .............................................................................................................. 18Employment Outcomes ................................................................................................. 21Startup Summer Participants .......................................................................................... 24

ii
Conclusions ............................................................................................... 26
References ................................................................................................ 28
Appendix ................................................................................................... 30
List of Exhibits
Exhibit E-1. The top six areas in which survey respondents reported that NFTE contributed to their development included skills comprising the entrepreneurial mindset ....................................................................................................... vExhibit E-2. The majority of survey respondents went to college or graduated from college ..................................................................................................... viExhibit E-3. Businesses launched by survey respondents generated income ......... viiExhibit E-4. Survey respondents who dropped out of college or finished college had the highest employment rates .................................................................. viiExhibit E-5. Over two-thirds of the survey respondents who participated in Startup Summer launched a business ........................................................................ viiiExhibit 1. The largest number of survey respondents participated in NFTE programs in New York City, Miami/Fort Lauderdale, and Chicago ............... 12Exhibit 2. The top six areas in which survey respondents indicated that NFTE contributed to their development included skills comprising the entrepreneurial mindset .................................................................................................... 14Exhibit 3. The majority of survey respondents went to college or graduated from college ................................................................................................... 15Exhibit 4. The vast majority of NFTE alumni who finished college completed 4-year degrees or higher ............................................................................. 16Exhibit 5. Business was the most popular major of survey respondents who were currently in college or had graduated from college .............................. 17Exhibit 6. Nearly half of the survey respondents used their NFTE experience in their college applications, but the percentage varied across regions ...................................................................................................................... 18Exhibit 7. One-fourth of survey respondents launched at least one business ........ 18Exhibit 8. The percentage of survey respondents who launched businesses varied across regions ..................................................................................... 19Exhibit 9. Businesses launched by survey respondents generated income .................................................................................................................................. 20Exhibit 10. More than half of respondents employed at least one other individual .................................................................................................................... 21Exhibit 11. Survey respondents who dropped out of college or finished college had the highest employment rates ................................................................. 22Exhibit 12. Employed survey respondents who dropped out of college or finished college were more likely to be working full-time...................................... 23

iii
Exhibit 13. The majority of the employed survey respondents were satisfied with their current employment ........................................................................ 24Exhibit 14. Over two-thirds of the survey respondents who participated in Startup Summer launched a business ............................................................................ 25Exhibit A-1. The majority of survey respondents participated in NFTE from 2012–13 to 2015–16 ............................................................................................................. 30Exhibit A-2. The percentage of current college students who planned to open a business after they graduate ranged from 31 to 42 percent across NFTE regions ............................................................................................................. 31Exhibit A-3. The percentage of current college students who majored in business ranged from 35 to 47 percent across NFTE regions ..................................... 31Exhibit A-4. The percentage of respondents who very frequently or frequently used what they learned at NFTE in their current employment ranged from 51 to 63 percent across NFTE regions ..................................................... 32

iv
Executive Summary
Overview of the Network for Teaching Entrepreneurship The Network for Teaching Entrepreneurship (NFTE) was founded in New York City in 1987 by a high school math teacher and former entrepreneur. NFTE serves approximately 18,000 middle and high school students in under-resourced communities annually in the United States through five entrepreneurship education programs. The overarching goal of the programs is to improve students’ knowledge and skills related to entrepreneurship and activate their entrepreneurial mindset. As part of the programs, students learn about a range of topics related to entrepreneurship, including competitive advantage, opportunity recognition, marketing, finance, and product development. The students participate in experiential activities, such as fieldtrips and games. Additionally, the programs culminate in students developing and presenting business plans.
NFTE has focused considerable effort on developing students’ 21st century skills, which are included in what it has termed the entrepreneurial mindset. Generally speaking, an individual who acts and thinks like an entrepreneur has an entrepreneurial mindset. NFTE has identified the following eight core domains that comprise an entrepreneurial mindset: Future Orientation, Comfort with Risk, Opportunity Recognition, Initiative and Self-Reliance, Communication and Collaboration, Creativity and Innovation, Critical Thinking and Problem Solving, and Flexibility and Adaptability. The skills included in these eight domains are critical for students’ academic and career success, regardless of whether they start their own businesses. Individuals who can recognize opportunities, communicate clearly, and think critically are more likely to succeed in a range of different careers than individuals who do not have these skills (NFTE, 2016b).
Study Overview This study, conducted by WestEd, describes the results of an NFTE alumni survey administered in 2016. The overall aim was to gather information about NFTE’s influence on alumni’s employability skills, college enrollment, business launch, and employment outcomes. Additionally, we examined outcomes specifically for alumni of Startup Summer, which is NFTE’s most intensive business startup program. WestEd administered an online survey to all alumni (N = 33,722) with valid contact information in NFTE’s alumni databases who participated in one of the organization’s programs between 1995 and 2016. We received responses from 2,117 NFTE alumni. The response rate for all alumni likely ranged from 6 to 9 percent. The accuracy of the study’s contact information database impacted our ability to calculate an exact response rate and had a negative effect on the study’s overall response rate. The response rate for the small group of Startup Summer participants was 53 percent (i.e., 78 respondents / 146 total alumni). The response rate for Startup Summer participants was substantially higher than the response rate for the full sample and allowed for greater confidence in the findings for alumni of this program. The study was descriptive; therefore, based on these findings no claims can be made as to whether participation in NFTE programs caused any of the reported outcomes. For example, it may be that NFTE attracted the type of students who had a greater likelihood of eventually becoming self-employed regardless of whether or not they participated.

v
Employability Skills
The vast majority of the alumni who responded to the survey (89 percent) reported that NFTE contributed to their knowledge, skills, and/or personal development. The most commonly reported areas where NFTE contributed to the survey respondents’ development are shown in Exhibit E-1. Four of these areas overlapped with the 21st century skills included in the entrepreneurial mindset, suggesting NFTE’s programs have positively influenced students in these areas. Becoming independent, self-reliant, and responsible corresponded to the Initiative and Self-Reliance domain included in the entrepreneurial mindset. Speaking clearly/effectively and working as a team are skills that are part of the Communication and Collaboration domain. Additionally, critically assessing the value of information aligned with the Critical Thinking and Problem Solving domain.
Exhibit E-1. The top six areas in which survey respondents reported that NFTE contributed to their development included skills comprising the entrepreneurial mindset
College Enrollment Most NFTE alumni who responded to the survey were succeeding academically. As shown in Exhibit E-2, the majority of respondents who finished high school were currently attending college (58 percent) or had finished college (21 percent). Nearly half of survey respondents (49 percent) reported using their NFTE experience in their college applications. Of the survey respondents who were currently attending college, 36 percent planned to start a business after they graduate from college. The vast majority of the respondents (91 percent) who finished college completed a four-year degree or higher. In addition, business was by far the most frequently reported major for survey respondents who were currently in college or graduated from college. The percentage of survey respondents who majored in business was 38 percent, which was twice as high as the national average (U.S. Department of Education, 2016). Further research would be needed to determine whether NFTE influenced alumni to study business at higher rates or whether students who were already interested in studying business were more likely to enroll in NFTE courses.

vi
Exhibit E-2. The majority of survey respondents went to college or graduated from college
Business Launch One-quarter of the survey respondents (n = 484) launched the business they planned in their NFTE course or another business after their NFTE course. Additionally, the vast majority of respondents who launched a business (84 percent) thought that participation in NFTE helped them with their businesses. The rates at which alumni launched businesses varied across the NFTE programs. Over 42 percent of participants of the BizCamp and Startup Summer programs launched at least one business; only 16 percent of the respondents who participated in a single course launched a business. The four most common industries of the businesses launched by NFTE alumni were design/fashion, retail, culinary, and computer science/technology.
Of the 484 survey respondents who launched a business, nearly half (47 percent) indicated they had a business open in the past year. Additionally, 65 percent of the businesses that were open in the past year were profitable according to the respondents. As shown in Exhibit E-3, half of the respondents with profitable businesses had net incomes below $5,000. However, 20 percent of the respondents reported net incomes from their business that exceeded $25,000. Over 90 percent of the respondents who reported net incomes over $25,000 graduated high school before 2012; therefore it is possible that businesses started by the more recent high school graduates will generate more income in coming years. Furthermore, just over half of the respondents (52 percent) employed at least one individual other than themselves at one time and 9 percent of respondents employed six or more individuals. Given that just over half of the businesses were not sole proprietorship businesses, many of the respondents’ businesses may have ample opportunities for growth and the generation of additional employment in the future.

vii
Exhibit E-3. Businesses launched by survey respondents generated income
Employment Outcomes
The survey respondents’ employment rates are shown in Exhibit E-4, disaggregated by their college enrollment status. Respondents who dropped out of college and respondents who finished college had the highest employment rates (92 percent and 86 percent, respectively) and employment rates were lowest for respondents who were currently attending college (62 percent) or never attended college (57 percent). Additionally, the majority of employed respondents who dropped out of college (78 percent), finished college (79 percent), or were taking time off from college (65 percent) were working full-time. Not surprisingly, 70 percent of employed respondents who were currently attending college worked part-time.
Exhibit E-4. Survey respondents who dropped out of college or finished college had the highest employment rates

viii
The rate at which the NFTE alumni respondents indicated they were self-employed at the time they completed the survey was higher than the national average. Of all NFTE alumni who responded to the survey and indicated they were employed, 16 percent either reported they were self-employed or reported they had a business open in the past year. The self-employment rate for NFTE alumni is much higher than the national rate of 6 percent for young adults ages 25–34 (Hipple & Hammond, 2016). Although the self-employment rate for survey respondents is high, we cannot say definitively that participation in NFTE programs caused the high rates. It may be that NFTE attracted the type of students who had a greater likelihood of eventually becoming self-employed.
Startup Summer Participants
The survey findings for alumni who enrolled in Startup Summer suggested that the program had a particularly strong influence on the participants. Seventy-one percent of the survey respondents who participated in Startup Summer launched a business, which was much higher than the rate for non-Startup Summer participants (24 percent). As shown in Exhibit E-5, 13 percent of respondents launched the business they planned in Startup Summer as well as an additional business after Startup Summer. Another 51 percent of respondents launched the business they planned in Startup Summer. Seven percent of respondents launched another business after Startup Summer but not the one they planned in Startup Summer. Additionally, 76 percent of Startup Summer participants who were currently in college planned to start a business after they graduate and 80 percent of the Startup Summer respondents used their NFTE experience in their college applications. Finally, 83 percent of Startup Summer participants frequently used what they learned at NFTE at their current work.
Exhibit E-5. Over two-thirds of the survey respondents who participated in Startup Summer launched a business

1
Background
Entrepreneurship Education and Training Increasing entrepreneurship can generate income, increase employment opportunities for under-represented groups, and spur growth and innovation, among other economic and social benefits. Entrepreneurship education and training programs seek to stimulate entrepreneurship and support individuals who are already involved in entrepreneurial activities. These programs can be formal academic programs or freestanding training programs, and generally focus on developing students’ knowledge and skills related to entrepreneurship. Entrepreneurship training programs work with individuals outside of degree-granting programs and aim more directly to improve the participants’ knowledge and skills so that they can start businesses or improve their existing businesses (Valerio, Parton, & Robb, 2014).
There is a wide range of entrepreneurship training programs for potential and current entrepreneurs. Many of the programs for potential entrepreneurs provide training to under-represented groups, such as unemployed youth and women, so that they can launch new businesses. The programs for current entrepreneurs aim to help the business owners increase their profits, expand their businesses, improve productivity, and generally improve their businesses. The content of both types of programs can include financial literacy, accounting, marketing, and management training. The programs for potential entrepreneurs frequently include a range of supports, such as intensive follow-ups, the provision of grant funding, and life skills training. Similarly, the majority of programs for current entrepreneurs provide some kind of wrap-around support and connect this support to some type of financial support (Valerio et al., 2014).
Entrepreneurship education programs typically target secondary, undergraduate, and graduate students. In secondary schools, many of the programs are integrated into the standard curricula and include training for the participating teachers. The programs can be standard academic courses and include other activities, such as mentoring, opportunities for networking, and guest speakers (Valerio et al., 2014). The rapid growth in entrepreneurship education programs on college campuses in the United States began in the 1990s and by 2008 over 5,000 entrepreneurship courses were being taught in colleges across the country. The growth of the dot-com industry and the recession of the late 2000s also played roles in bringing entrepreneurship education into the mainstream on college campuses (Kauffman Foundation, 2013). Over 300 colleges currently offer undergraduate and graduate degree programs for entrepreneurship studies (Princeton Review, 2016) and these programs typically include business plan competitions and coaching from established entrepreneurs (Valerio et al., 2014).

2
History of the Network for Teaching Entrepreneurship The Network for Teaching Entrepreneurship (NFTE) was founded in New York City in 1987 by Steve Mariotti, a high school math teacher and former entrepreneur. As a new teacher, Mariotti noticed that his students were not engaged with the subject and he sought to change that by teaching them about how businesses worked and how businesses made profits, using real-world examples. Initially, Mariotti used a series of hands-on exercises in his own classes to teach students about entrepreneurship. These exercises eventually transformed into an individual class on entrepreneurship (Mariotti, 2015).
Mariotti hoped that teaching students from low-income communities about entrepreneurship might help them transform their “street smarts” into academic and business skills. The goal of NFTE’s programing is to help students connect what they are learning in the classroom to the real world so that they choose to remain connected to school and learning. Additionally, having an entrepreneurial mindset could help youth overcome adversity in their lives and address economic difficulties and challenges in their communities. Accordingly, NFTE says that its purpose is to “activate the entrepreneurial mindset in youth from under-resourced communities and build their knowledge about business startup, creating a more vibrant economy and sustainable society” (NFTE, 2016a, p. 6).
Over the last three decades, over 600,000 youth from low-income communities around the United States and the world have participated in NFTE’s programs. NFTE operates programs in 23 locations across the United States, including New York City, Miami, Washington D.C., Chicago, and Los Angeles. Additionally, NFTE has programs in 10 countries. Currently, NFTE serves around 18,000 middle and high school students in the United States annually and the organization continues to expand each year.
The Entrepreneurial Mindset There is a growing consensus in the field of education that students need to develop 21st century skills to succeed in the global economy (Ananiadou & Claro, 2009; Rotherham & Willingham, 2010). Although basic skills such as reading comprehension are still critical, employers report needing employees who also have 21st century skills. These applied (or 21st century) skills include professionalism/work ethic, oral and written communication, teamwork/collaboration, and critical thinking/problem solving (Casner-Lotto & Barrington, 2006).
An entrepreneurial mindset is another 21st century skill that may lead to increased academic, personal, and professional success. Although there is substantial overlap between the traits that comprise an entrepreneurial mindset and the 21st century skills noted in the literature, there are additional traits in entrepreneurial mindset that drive individuals to create new businesses. Generally
NFTE serves 18,000 youth in the United States annually.
NFTE’s purpose is to “activate the entrepreneurial mindset in youth from under-resourced communities and build their knowledge about business startup, creating a more vibrant economy and sustainable society.”

3
speaking, an individual who acts and thinks like an entrepreneur has an entrepreneurial mindset. NFTE has identified the following eight core domains that comprise an entrepreneurial mindset (NFTE, 2016b):
• Future Orientation: An optimistic disposition with a focus on obtaining the skills and knowledge required to transition into a career.
• Comfort with Risk: The capacity to move forward with a decision despite inevitable uncertainty and challenges.
• Opportunity Recognition: The practice of seeing and experiencing problems as opportunities to create solutions.
• Initiative and Self-Reliance: The power to take ownership of a project without input or guidance and work through obstacles independently.
• Communication and Collaboration: The ability to clearly express ideas to an intended audience, including persuading others to work towards a common goal.
• Creativity and Innovation: The ability to think of ideas and create solutions to problems without clearly defined structures.
• Critical Thinking and Problem Solving: The process of applying higher-level, process-oriented thinking skills, and of transitioning that applied reasoning to support the application of decision-making.
• Flexibility and Adaptability: The ability and willingness to change actions and plans to overcome present and future challenges.
Non-cognitive skills, such as those included in an entrepreneurial mindset, are malleable and can improve with instruction (Kautz, Heckman, Diris, Ter Weel, & Borghans, 2014). NFTE takes advantage of the malleability of these non-cognitive skills and its programs provide students the support and experiences they need to develop an entrepreneurial mindset. The project-based lessons and experiential activities included in NFTE’s programs afford students the opportunity to solve complex problems, identify business opportunities, and assess risks and potential benefits.
NFTE has focused considerable effort on developing the 21st century skills included in the entrepreneurial mindset because these skills are critical for the students’ academic and career success regardless of whether they start their own businesses. Individuals who can recognize opportunities, communicate clearly, and think critically are more likely to succeed in a range of different careers than individuals who do not have these skills (NFTE, 2016b). Accordingly, prior research found that the majority of NFTE students felt that the skills they learned as a result of participating in one of NFTE’s programs would be helpful to them when completing their school work and would assist them later in life (Silander, Chavez-Reilly, & Weinstein, 2015).
NFTE Programs NFTE’s programming targets middle and high school students in under-resourced schools. To be eligible for NFTE programming, at least 50 percent of the students in a school and/or district need to qualify for free or reduced-price lunch. NFTE programming typically occurs in classrooms at school sites, and the NFTE programming is generally built into pre-existing courses that are either

4
required by the school or taken as electives chosen by the students. However, in the case of NFTE’s summer programs, the NFTE curriculum is specifically designed for the summer and is not embedded into a pre-existing curriculum.
NFTE has both classroom and out-of-classroom programs, including Owning Your Future, Exploring Careers, BizCamps, Startup Summer, and Startup Tech. In addition to programs in the United States, NFTE also works globally across several continents. As part of each program, students are taught to identify economic opportunities. Additionally, the programs are designed to activate students’ entrepreneurial mindset by teaching them problem-solving skills and helping them develop their presentation and leadership abilities. The goal of the program is to provide students these skills so they can become successful beyond high school as they pursue postsecondary education, operate their own businesses, and/or enter the workforce. NFTE helps students achieve these goals through a pairing of entrepreneurial-mindset skill growth and small-business-management content instruction. This pairing teaches students employability skills, such as financial literacy and expense management.
Classroom Entrepreneurship Programs
NFTE’s classroom entrepreneurship programs are the most widespread of its programs and serve the largest number of youth. Classroom programs are delivered during the school day like academic subjects and last for a semester or a full school year. A teacher certified by NFTE leads the students through one of NFTE’s curricula, including “Entrepreneurship: Owning Your Future” and “Exploring Careers for the 21st Century.” The programs’ lessons focus on a range of concepts, including competitive advantage, ownership, opportunity recognition, marketing, finance, and product development. The lessons also make connections with the students’ math and literacy skills. The courses culminate in each student creating and presenting a business plan, which is the centerpiece of the program.
The classroom programs include a range of fieldtrips, games, and other experiential activities. As part of the “Buying and Selling Event,” students take a field trip to a wholesale district or a warehouse club to buy products in bulk. The students then sell the products for a profit. The students learn about supply and demand and how to market products through the event. The programs use a variety of games to make learning fun for students. For example, the “Product Innovation Game” has students create an invention using supplies such as construction paper and pipe cleaners and then present their invention to the class. The game teaches students how to communicate their ideas and helps them practice devising a sales pitch. During “Community Walks,” students go out into their communities and speak with business owners to learn more about operating businesses. Additionally, local business people volunteer their time to come to the classrooms to share their knowledge about running businesses.

5
The students identify an idea for a business and develop their business plans throughout the program. The process of creating a business plan gives students a chance to practice many of the skills included in the entrepreneurial mindset and overcome many of the challenges faced by entrepreneurs. The business plans include a marketing strategy and are aligned with the students’ interests and abilities. At the end of the programs, the students have the opportunity to compete for seed money through a series of business plan competitions. The competitions start in each classroom and the winners move on to regional competitions and eventually to NFTE’s national competition. The business plan competitions afford students the opportunity to practice their public speaking and they receive advice from the judges who are professionals in their fields.
Startup Tech
Startup Tech is a classroom program that provides students an opportunity to create functioning websites or apps while learning about entrepreneurship and tech startups. The curriculum and goals of Startup Tech were developed originally as an NFTE summer program called NYC Generation Tech. Startup Tech is taught in both middle and high schools. In the middle school program, students work with a platform developed by MIT called App Inventor, a visual, block-programming language that allows students to create functional apps. The students also learn about careers in the tech industry, develop a modified business plan for their app, and present at an end-of-year student showcase. In the high school program, students learn industry-standard coding languages such as HTML, CSS, and Javascript and apply these skills to develop a working website. The website is further associated with a business plan that students develop and eventually pitch at the end of the year. Both programs also feature experiential activities like in traditional NFTE programs, such as guest speakers and field trips to tech companies and business incubators so students can interact with entrepreneurs.
BizCamps
BizCamps are one- or two-week-long camps that occur during the summer or school breaks. The intensive BizCamp curriculum mirrors the curricula of Owning Your Future but is condensed to fit into the shortened time period of the camps. The camps are open to youth 13–18 years of age who have an interest in entrepreneurship. Youth who meet household income requirements can participate in the camps free of charge. One of the BizCamps — “Girl Empower” — is designed specifically for young women and teaches them about personal discovery, leadership, entrepreneurship, and teamwork. Prior research on BizCamps found that 38 percent of students reported at the end of the program that they would likely start a business in the next year, which was a 13 percentage point increase from before they started the program (Silander et al., 2015).
NFTE provides a guidebook to the camp staff that describes how to implement the BizCamps. The guidebook includes a variety of resources, including examples of experiential learning activities, PowerPoint slides, and templates for business plans. Consistent with the full-length classroom
The process of creating a business plan gives students a chance to practice many of the skills included in the entrepreneurial mindset.

6
programs, the youth participating in BizCamps develop a business idea and then create a business plan. In addition, the youth attend lessons covering a variety of topics such as supply and demand, marketing, and recognizing business opportunities. The youth participate in the same types of fieldtrips and experiential activities as do the students participating in the classroom programs. Guest speakers also come to the BizCamps to give talks about entrepreneurship that link to the lessons taught throughout the camps. At the end of the camp, students present their business plans to a panel of judges and have the opportunity to win seed money for their prospective businesses.
Startup Summer
Startup Summer targets a select group of students who are ready to start the business they planned when they participated in Owning Your Future or Startup Tech. Students complete an application for Startup Summer toward the end of their classroom program. The typical Startup Summer student has a deep interest in business startup and has promise to launch their business with the right mentoring and, eventually, funding. Since NFTE launched Startup Summer in 2011, approximately 150 students have participated in the program. The program was initially offered in New York City and then expanded to Los Angeles and South Florida.
The transition from planning a business to executing the plan is challenging and Startup Summer is designed to provide the support students need to jumpstart their businesses. Startup Summer is NFTE’s most intensive startup program and begins with a “Boot Camp” week when the students set their goals, create marketing materials, and plan the initial steps they will need to take to launch their businesses. During the six weeks after the Boot Camp, students meet with each other three times per week to share their progress and support one another. The Startup Summer participants each receive an investment grant and a stipend. The participants also meet with volunteer business coaches. At the end of the summer, the students present on their progress and continue to meet with NFTE staff and volunteer business coaches during the following school year. A select number of students are given the opportunity to pitch their businesses in front of a panel of judges and large audience in a “Shark Tank”-style event where they can request additional investment capital.
Global Programs
NFTE has been working globally since 1999 when it started its first international program in Belgium. Since then, NFTE has worked with partners to bring classes, afterschool programs, and BizCamps to other parts of Europe, the Middle East, Asia, and Latin America. Participating countries include Ireland, Germany, China, Mexico, and Israel. Programs in China have served at times as many as 40,000 students annually. In addition to these programs, NFTE also sponsors an event every year called the World Series of Innovation, an experiential activity that allows students from all over the world to “think creatively and invent new products or services that address every-day opportunities.”
Study Goals This study involved administering and analyzing the results of a 2016 NFTE alumni survey designed to gather information about experiences with NFTE programs from a broad range of alumni who

7
participated in one or more of the programs between 1995 and 2016. The study, conducted by WestEd, focused on the reported influence that NFTE had on alumni’s employability skills, college enrollment, business launch, and employment outcomes. Additionally, the study examined outcomes specifically for Startup Summer alumni. NFTE was interested in the outcomes of Startup Summer alumni as these students had participated in an NFTE program during the school year and then signed up for additional time to work on their businesses during the summer. NFTE believed that these students are likely the most invested in launching their businesses.

8
Method
Description of the 2016 NFTE Alumni Survey NFTE research staff developed the initial draft of the 2016 NFTE Alumni Survey. WestEd provided feedback on the survey content, item order, item format (e.g., open- vs. closed-ended), skip patterns, item wording, and response options. After multiple rounds of revision by NFTE and review by WestEd, NFTE research staff finalized the content of the survey. WestEd programmed the survey using Cvent, an online survey software. A PDF version of the survey is available on NFTE’s website.
The survey focused on a broad range of topics related to NFTE participation and not all of the items were analyzed as part of the current report. The survey began with background questions, such as which NFTE courses the respondents participated in, when they participated, and in which city/region their NFTE school was located. The survey next asked about the respondents’ education background, including when they graduated from high school, whether they attended college, whether they used their NFTE experience in their college applications, their college major, and their highest degree earned. After the education background questions, the survey asked about the respondents’ employment status and satisfaction with their current employment.
The next set of items on the survey pertained to the businesses (if any) that the respondents started. The items dealt with the number of people employed by the businesses, whether the businesses were profitable, whether participation in NFTE helped respondents with their businesses, the operational status of their businesses, and the industry the businesses were in. The survey asked whether NFTE contributed to the respondents’ knowledge, skills, and/or personal development, and had the respondents rank the top three areas (from a list of 19 areas) where NFTE contributed to their development. Basic demographic questions (e.g., gender and race/ethnicity) were initially close to the end of the survey. However, WestEd staff moved them up before the personal development items after the initial surveys were completed and item-response rates suggested that some respondents were not completing the demographic questions due to survey fatigue.
The maximum number of items on the survey was 70. However, none of the respondents completed all 70 items because of the skip patterns. For example, if respondents reported that they did not open any businesses, they skipped the entire section of the survey that asked about businesses that they opened. As a result, the median response time was 12 minutes for respondents who completed the survey.
Contact Information Database The final contact information database used to administer the survey contained the contact information for 33,722 NFTE alumni, including 146 participants of Startup Summer. NFTE created the initial contact information database that included records for 33,998 alumni by combining records from over a dozen of its alumni databases. NFTE aimed to create a census of all NFTE alumni who participated in one or more of its programs between 1995–96 and 2015–16. However,

9
given the number of students NFTE serves each year, we are certain that not all alumni were included in the alumni database. The contact information database included the alumni’s names and email addresses. The database also included a variety of additional information, such as the alumni’s school, gender, ethnicity, phone number, mailing address, and year of high school graduation. However, the additional information was not consistently available across databases and could not be used to contact alumni or for analyses to determine whether the survey respondents were representative of the entire population of alumni.
Prior to providing the initial contact information database to WestEd, NFTE contracted with a company named Melissa Data to validate the email addresses in the database and identify correct email addresses for the ones that were no longer active or invalid. Melissa Data identified 5,230 new email addresses for alumni in the database, which were different than the email addresses in NFTE’s databases. Melissa Data also flagged 27,413 email addresses as active and another 6,249 email addresses as having the potential to bounce when contacted. There were 265 records where the email was corrected and an additional 71 records in the database that Melissa Data did not investigate.
Given the importance of the Startup Summer program, extra efforts were taken to ensure that WestEd had a comprehensive list of participants of the program. After NFTE provided WestEd with the initial contact information database, NFTE provided WestEd with files from the local NFTE offices with the names and contact information of Startup Summer participants from Florida, New York City, and Los Angeles. WestEd cross-referenced these files with the initial contact information database, which included a variable that flagged 106 records as Startup Summer participants. Through this process, WestEd identified an additional 40 Startup Summer participants to survey. Of the additional 40 Startup Summer participants, 11 alumni were in the initial database but not flagged as participating in Startup Summer and 29 alumni were not in the initial database.
After the start of the survey administration, WestEd created a website that allowed additional NFTE alumni to sign up for the survey by providing their email addresses. NFTE staff distributed the link to the website via social media. Through the website, WestEd obtained the email addresses of 15 alumni whose email addresses were not in the initial contact information database.
WestEd’s examination of the contact information databases prior to the survey administration allowed us to remove 320 records from the final contact information database. Records were removed because there was no email address on file, the email address was invalid, the email address for one record in the database duplicated the email address for another record, the alumni’s name was invalid, or the contact previously opted out of all Cvent surveys. WestEd was able to identify problems with 402 other records in the final contact information database during the survey administration. For example, some of the email addresses in the database were matched to the wrong alumni’s name and the database included individuals who were not alumni of the programs. These records were removed from the calculation of the response rates.

10
Survey Administration WestEd administered the online survey using Cvent during a 10-week period in June, July, and August 2016. The non-Startup Summer participants received up to five emails inviting them to participate in the study and the Startup Summer participants received up to six emails. The first emails on June 23, 2016 coincided with a social media blast from NFTE’s marketing department via Facebook® and Twitter® that publicized the survey. In order to maximize the number of responses, the emails were customized to each respondent (e.g., they began with: Dear Jane Doe) and WestEd varied the days of the week and times of the day the emails were sent (Dillman, Smyth, & Christian, 2014). Additionally, some of the emails highlighted the importance of the survey for NFTE and others highlighted the respondents’ opportunity to win one of three iPads that were raffled off to respondents who completed the surveys. The emails contained unique links that allowed WestEd to track whether each NFTE participant completed the survey.
Each NFTE participant received emails throughout the survey administration window unless they completed the survey or opted out of the survey. Respondents who partially completed the survey, received one or two additional emails that informed them that their initial responses were saved by the survey system and encouraged them to complete the survey. As part of the fourth, fifth, and sixth emails, WestEd also sent emails to participants using the addresses that were in the contact information database prior to the updates identified by Melissa Data. This was done to ensure that all participants were contacted in case the email addresses identified as inactive by Melissa Data were active.
Response Rates The response rate for the full sample of NFTE alumni likely ranged from 6 to 9 percent. For the Startup Summer participants, the response rate of 53 percent (78 respondents / 146 Startup Summer alumni) was significantly higher than the full sample. In total, 2,117 alumni responded to the survey. We classified alumni as respondents if they completed up to and including the seventh question in the survey, which asked what region their NFTE school was located in. Another 150 alumni who started the survey but did not continue past the sixth question were treated as non-respondents for the response rate calculations and excluded from the analyses.
WestEd calculated conservative and liberal estimates to obtain the likely response rate range for the full sample of NFTE alumni (Fowler, 2009). The conservative estimate (6 percent; 2,117 respondents / 33,546 NFTE alumni) included the vast majority of the alumni in the contact information database in the denominator of the response-rate calculation but excluded duplicate records and individuals found to be ineligible (e.g., non-alumni). This calculation is consistent with the American Association for Public Opinion Research’s (AAPOR) methods for calculating response rates (AAPOR, 2011). The first liberal estimate (8 percent; 2,117 respondents / 26,520 NFTE alumni with accurate contact information) that we calculated removed individuals from the denominator who had invalid email addresses (e.g., email addresses that bounced when we sent them the survey). Although the vast majority of these individuals were NFTE alumni, they did not have the opportunity to complete the survey. For every email address that bounced, there is an unknown number of other emails that went to abandoned email addresses that were not checked

11
during the survey administration period. Similarly, for every individual in the database who we determined was not an NFTE alumnus, an unknown number existed that we did not identify. If the total number of these individuals in the database were 2,500, the response rate would be 9 percent (2,117 respondents / 24,020 NFTE alumni with accurate contact information).
The proportion of survey respondents from each NFTE region was generally consistent with what NFTE knows about the distribution of NFTE participants across these regions, which suggests that the respondents may be fairly representative of the entire population of NFTE participants. However, when response rates for online surveys are below 20 percent, it is generally thought that it is unlikely that the results of a survey will credibly represent the population as a whole (Fowler, 2009). Additionally, the responses to one of the items on the survey asking whether the alumni achieved first, second, or third place at the regional or national business plan competitions suggested that winners of these competitions were overrepresented in the survey respondents. Nevertheless, we obtained responses from over 2,000 NFTE alumni and the respondents are likely to be representative of a fairly large proportion of the population of NFTE participants.
Characteristics of the Survey Respondents The survey respondents (n = 2,117) reported they enrolled in a single NFTE course in their school (82 percent), BizCamps (12 percent), Startup Summer (7 percent), the After School program (5 percent), GenTech (1 percent), or another NFTE course (5 percent). Eleven percent of the respondents enrolled in more than one of the NFTE courses. The participants of the single NFTE courses in their schools indicated that the names of the courses were Entrepreneurship (76 percent), Business (24 percent), Economics (11 percent), National Academy Foundation (NAF) Academy (3 percent), Social Studies (1 percent), Startup Tech (1 percent), or another name (2 percent). Additionally, 7 percent reported they did not remember the name of their NFTE course and 21 percent reported more than one name. Ninety percent of the respondents participated in the NFTE course when they were in high school and the remaining 10 percent participated when they were in middle school. In addition, 60 percent of the respondents participated in NFTE during the 2012–13, 2013–14, 2014–15, and 2015–16 school years. Another 30 percent of respondents participated between 2006–07 and 2011–12 and the remaining 10 percent of respondents participated prior to 2006–07. Exhibit A-1 in the Appendix shows the percentages for each school year.
The survey respondents were racially/ethnically diverse. The respondents were 35 percent Hispanic/Latino, 31 percent Black/African American, 11 percent White, 10 percent Asian, 7 percent from two or more races, 2 percent Other, and 4 percent indicated they did not want to report their race/ethnicity. The racial/ethnic breakdown of the respondents is consistent with NFTE’s data on the demographics of all program participants from 2015–16 (NFTEa, 2016), which provides evidence for the representativeness of the respondents. Fifty-seven percent of the respondents were female, 42 percent were male, and 1 percent indicated they did not want to report their gender. As shown in Exhibit 1, the respondents participated in NFTE programs in nine major cities/regions throughout the country. The largest percentage of respondents participated in programs in New York City (26 percent), Miami/Fort Lauderdale (18 percent), and Chicago (13 percent).

12
Additionally, Baltimore/Washington D.C. and Los Angeles each provided 9 percent of the total respondents.
Exhibit 1. The largest number of survey respondents participated in NFTE programs in New York City, Miami/Fort Lauderdale, and Chicago
Note: Other included Atlanta, Charleston, Cleveland, Pittsburg, St. Louis, Topeka, and a small number of respondents from outside of the United States.
Analysis Plan WestEd conducted descriptive analyses with the survey data including the calculation of percentages and frequencies. All of the analyses were unweighted. Weighting can be used to adjust for potential bias due to non-response (Lohr, 2010). For example, the responses of individuals from regions with lower response rates could be weighted more heavily so the results better represent the entire population of NFTE alumni. However, this was not possible because none of the variables that could be used as part of the weighting were available for all or nearly all of the individuals in the final contact information database.
For each analysis that used data from only one survey item, WestEd included all of the available cases with responses in the analysis (i.e., casewise deletion). This approach allowed us to maximize the number of cases that could be included in each analysis. When conducting the analyses by region, WestEd used a pairwise deletion method and excluded all cases that had missing data for the region item and the other item included in the analyses. In addition, WestEd followed Evergreen’s (2017) data visualization recommendations when creating the report exhibits.
The analysis with the Startup Summer participants included only individuals who completed the survey and were identified as participating in the program by NFTE records (n = 78). Ninety percent of these respondents reported on the survey that they participated in Startup Summer. There were an additional 72 respondents who reported on the survey that they participated

13
in Startup Summer but did not participate in Startup Summer according to NFTE records. It is likely that these individuals participated in one of NFTE’s other summer programs and incorrectly selected Startup Summer when completing the survey.
Analyzing the qualitative data provided by the respondents for the small number of open-ended questions on the survey was beyond the scope of the current project. However, WestEd reviewed the responses to the second-to-last question on the survey (i.e., “If there is anything else you would like to share about NFTE, please do so below.”) and identified several possible quotes for inclusion on the title page of the report. WestEd provided these quotes to NFTE and jointly identified the quote that best aligned with NFTE’s vision for their programs.

14
Findings
Employability Skills
The vast majority of the alumni who responded to the survey reported that NFTE influenced their employability skills. Specifically, 89 percent of survey respondents thought NFTE contributed to their knowledge, skills, and/or personal development. Additionally, 66 percent of the survey respondents reported that the skills they learned in their NFTE course had more influence on their life compared to the other courses they took during middle or high school. Another 31 percent of respondents reported that the skills they learned in their NFTE course had the same amount of influence as their other courses from middle or high school.1 The positive results from the 2016 alumni survey are in line with the results from a previous study that found nearly 90 percent of students reported they would remember what they learned in BizCamps better than what they could learn in a regular classroom (Silander et al., 2015).
The most commonly reported areas where NFTE contributed to the survey respondents’ development are shown in Exhibit 2. The most frequently reported area where NFTE contributed
Exhibit 2. The top six areas in which survey respondents indicated that NFTE contributed to their development included skills comprising the entrepreneurial mindset
1 This item and the item asking about areas that NFTE contributed to their development were only completed by alumni who reported that NFTE contributed to their knowledge, skills, and/or personal development.
89 percent of survey respondents thought NFTE contributed to their knowledge, skills, and/or personal development.

15
to respondents’ development was with regards to helping them become independent, self-reliant, and responsible. This was reported by 37 percent of respondents. This finding suggests that NFTE’s programs have influenced the Initiative and Self-Reliance domain included in the entrepreneurial mindset. Another one-third of respondents indicated that NFTE helped them gain knowledge, technical skills, and/or competence required for a job or career. The other four areas most frequently reported dealt with participants’ speaking ability, working as a team, critically assessing information, and time management. These four areas align well with the skill sets that employers believe recent high school and college graduates need to succeed in the 21st century workplace. Three of the 21st century skills most frequently cited by employers were oral and written communications, teamwork/collaboration, and critical thinking/problem solving (Casner-Lotto & Barrington, 2006). Additionally, speaking ability and critically assessing information correspond to the Communication and Collaboration and Critical Thinking and Problem Solving domains in the entrepreneurial mindset that influences students’ academic and career success.
College Enrollment As shown in Exhibit 3, the majority of survey respondents who were no longer enrolled in high school are currently attending college (58 percent) or graduated from college (21 percent). Less than one-quarter of the respondents were taking time off from college, never attended college, or dropped out of college. The college enrollment rates for the respondents compare favorably with recent data published by the U.S. Department of Education for high school graduates. Between 2010 and 2014, nearly half of low-income students did not immediately enroll in 2- or 4-year colleges after they completed high school (Kena et al., 2016). Even though the survey data do not directly align with the U.S. Department of Education’s methodology, the data suggest that the respondents of NFTE’s alumni survey, who mostly attended urban schools serving low-income populations, had high college enrollment rates.
Exhibit 3. The majority of survey respondents went to college or graduated from college
Of the 1,047 survey respondents who were currently attending college, 36 percent planned to start a business after they graduate from college. The proportion of current college students who intended

16
to start a business after college was fairly consistent across the nine NFTE regions and ranged from 31 percent to 42 percent (see Exhibit A-2 in the Appendix). Large percentages of the current college students also reported they planned to seek employment (79 percent) and further their educations (61 percent) after college. Additionally, the vast majority of the respondents who finished college reported their highest degree was a 4-year degree or higher. As shown in Exhibit 4, 72 percent of respondents completed a 4-year degree and 20 percent completed a master’s or doctoral degree.
Exhibit 4. The vast majority of NFTE alumni who finished college completed 4-year degrees or higher
The top eight most commonly reported majors by survey respondents who were currently in college (n = 938) or had graduated from college (n = 357) are shown in Exhibit 5. Business was by far the most frequently reported major by both groups of survey respondents. The percentage of business majors for respondents who were currently in college ranged from 35 to 47 percent across regions (see Exhibit A-3 in the Appendix). Overall, respondents were twice as likely to be business majors as the national average. In the United States, business is the most common major for undergraduates but only accounted for 19 percent of conferred degrees in 2013–14 (U.S. Department of Education, 2016). It is clear from the survey data that business was a popular major among the survey respondents. However, further research would be needed to determine whether NFTE influenced alumni to study business at higher rates or whether students who were already interested in studying business were more likely to enroll in NFTE courses.
The second most popular major was health care for respondents currently enrolled in college and the percentage of respondents who reported it (11 percent) was consistent with the national average. Social sciences and liberal arts (18 percent) was the second most popular major for respondents who graduated from college and this group reported majoring in these subjects at twice the national average. As also shown in Exhibit 5, other popular majors that were reported by the survey respondents at rates consistent with the national average included psychology and counseling, arts, and communications (U.S. Department of Education, 2016).

17
Exhibit 5. Business was the most popular major of survey respondents who were currently in college or had graduated from college
Across regions, 49 percent of survey respondents reported using their NFTE experience in their college applications (see Exhibit 6). Future research will be needed to determine how the respondents used their NFTE experience in their applications. For example, the respondents may have written about NFTE in their essay, included NFTE in their extracurricular activities and work experience, or listed their NFTE course along with their other courses. In addition, the percentage of respondents who used their NFTE experience in their applications varied across regions. Fifty-seven percent of respondents in Boston used their NFTE experience in their applications while only 42 percent did in Dallas. Future research will be needed to identify the potential reasons why there are differences across regions.

18
Exhibit 6. Nearly half of the survey respondents used their NFTE experience in their college applications, but the percentage varied across regions
Business Launch One fourth of the survey respondents (n = 484) launched at least one business during or after their NFTE course. A total of 294 respondents (16 percent) launched the business they planned in their NFTE course and 301 respondents (16 percent) launched another business after they participated in their NFTE course. The overlap between these two groups is depicted in Exhibit 7. Specifically, 6 percent of respondents launched the business planned in their NFTE course and another business after their course. Another 9 percent of respondents launched only the business planned in the NFTE course and 10 percent launched a business after their NFTE course but not the one planned in their course.
Exhibit 7. One-fourth of survey respondents launched at least one business

19
Although nearly 500 respondents reported starting a business, the data also indicate that 75 percent of the respondents did not start a business. The vast majority of the respondents who did not start a business enrolled in a single NFTE course in their school. Only 19 percent of the respondents who participated in just a single course (n = 1,372) launched a business. The rates at which participants of BizCamps and Startup Summer started businesses were over 41 percent. BizCamps and Startup Summer are more intensive programs than the single NFTE courses offered at schools, thus it is not surprising that alumni of these programs start businesses at higher rates. If NFTE wants more alumni of their single courses to start more businesses, NFTE may need to investigate ways to make the courses more intensive.
The percentage of survey respondents who launched businesses during or after their NFTE course varied across the NFTE regions (see Exhibit 8). In Baltimore/Washington D.C., 20 percent of the respondents launched the business they planned in their NFTE course and 22 percent launched another business after they participated in their NFTE course. The percentage of respondents from New York City and Boston who launched the business they planned in their NFTE course was above the overall average of 16 percent. In contrast, Chicago had the lowest rates of launching businesses. Only 8 percent of the respondents in Chicago launched the business they planned in their NFTE course and 10 percent launched another business after they participated in their NFTE course.
Exhibit 8. The percentage of survey respondents who launched businesses varied across regions

20
The survey respondents also reported specifically on their businesses that were open in the past year. Of all the respondents who launched the business they planned in their NFTE course or another business after their NFTE course (n = 484), 47 percent indicated their business was open in the past year. Additionally, 65 percent of the businesses that were open in the past year were profitable according to the respondents. The respondents who indicated their businesses were profitable also reported on their net income from their businesses. As shown in Exhibit 9, half of the respondents’ net incomes from their businesses were below $5,000. However, 20 percent of the respondents reported net incomes from their business that exceeded $25,000. Over 90 percent of the respondents who reported net incomes from their businesses over $25,000 graduated high school before 2012 and it is likely that businesses started by the more recent high school graduates will generate more income in the coming years.
Exhibit 9. Businesses launched by survey respondents generated income
The vast majority of respondents who launched a business thought that participation in NFTE helped them with their businesses. Specifically, 84 percent of respondents reported that NFTE helped with their businesses. The percentage was fairly consistent across regions and ranged from 81 percent in Miami/Fort Lauderdale to 92 percent in Los Angeles. All of the respondents who launched a business reported on the largest number of individuals they employed at one time while their businesses were open (see Exhibit 10). Just over half of the respondents employed at least one individual other than themselves at one time and 9 percent of respondents employed six or more individuals. Given that just over half of the businesses were not sole proprietorship businesses, many of the respondents’ businesses may have ample opportunities for growth and the generation of additional employment.
65 percent of the businesses open in the past year were profitable.
84 percent of respondents reported NFTE helped with their businesses.

21
Exhibit 10. More than half of respondents employed at least one other individual
The survey respondents additionally reported on the status of all of the businesses they opened. The vast majority of the respondents who launched a business (n = 484) opened one (68 percent) or two businesses (22 percent). However, 5 percent of respondents opened three businesses and 4 percent of respondents opened four or more businesses. The four most common industries were design/fashion (15 percent), retail (13 percent), culinary (9 percent), and computer science/technology (8 percent). The three most common reasons that the respondents cited for why their businesses were no longer in operation were that they put their business on hold for school and/or employment (38 percent); their business did not gain enough traction/exposure with customers (17 percent); or a personal, non-business issue interfered with operating their business (16 percent).2
Employment Outcomes
The survey respondents reported on a number of employment outcomes, including whether they were employed currently. Respondents who dropped out of college and respondents who finished college had the highest employment rates (92 percent and 86 percent, respectively; see Exhibit 11). The employment rates were lowest for respondents who were currently attending college (62 percent) or never attended college (57 percent). The employment rates for respondents who were currently attending college or never attended college are fairly consistent with recent youth employment numbers. For example, in 2014, youth ages 16–24 who were not enrolled in school had an employment rate of 68 percent and youth of the same age enrolled in college had an employment rate of 46 percent (Child Trends, 2015).
2 The survey respondents reported on the industries and reasons for closure for their first three businesses only.

22
Exhibit 11. Survey respondents who dropped out of college or finished college had the highest employment rates
Exhibit 12 shows the proportion of employed survey respondents who reported working full-time; working part-time; or having other employment statuses such as independent consulting, being self-employed, or participating in an internship.3 The majority of employed respondents who dropped out of college (78 percent), finished college (79 percent), and were taking time off from college (65 percent) were working full-time. Not surprisingly, 70 percent of employed respondents who were currently attending college worked part-time.
3 The survey item asked respondents to mark all employment statuses that applied to them and, for example, they could indicate that they were working full-time and were self-employed.

23
Exhibit 12. Employed survey respondents who dropped out of college or finished college were more likely to be working full-time
Overall, 16 percent of the respondents who were employed at the time they completed the survey reported they were self-employed or had a business open in the past year.4 The percentage of employed respondents who were self-employed or had a business open was highest for individuals who dropped out of college (28 percent) or finished college (21 percent). Fourteen percent of employed respondents who were currently attending college were self-employed or had a business open. By comparison, in 2015, 10 percent of all employed individuals in the United States were self-employed (Hipple & Hammond, 2016). However, the self-employment rates were much lower for younger workers in the age range of most of the alumni who responded to the NFTE survey than for older workers. Only 2 percent of the 16–24 age range and 6 percent of the 25–34 age range were self-employed according to Bureau of Labor Statistics data (Hipple & Hammond, 2016). These data indicated that NFTE survey respondents were roughly three to eight times more likely to report being self-employed than the national average.
4 Although 25% of survey respondents reported they opened a business during or after their NFTE course, the percentage of respondents who reported having a business open in the past year was lower because of business closures.

24
Exhibit 13. The majority of the employed survey respondents were satisfied with their current employment
As shown in Exhibit 13, the majority of the employed survey respondents were satisfied with their current employment. Seventy-four percent of the respondents were very satisfied or somewhat satisfied with their current employment overall. Additionally, 62 percent of the respondents were very satisfied or somewhat satisfied with their opportunity for growth at their current employment. In addition to their level of satisfaction with their current employment, respondents reported on the frequency with which they used what they learned in NFTE in their current employment. Overall, 58 percent of respondents very frequently or frequently used what they learned at NFTE in their current employment. This percentage was consistent across the NFTE regions and ranged from 51 percent in Boston to 63 percent in Philadelphia (see Exhibit A-4 in the Appendix).
Startup Summer Participants
The participants of Startup Summer (n = 78) who responded to the survey had very positive outcomes. This section of the report presents the results separately for this select group of NFTE participants. With regard to NFTE’s influence on their employability skills, 99 percent of Startup Summer participants thought NFTE contributed to their knowledge, skills, and/or personal development. Additionally, 88 percent of Startup Summer participants thought that the skills learned in their NFTE course had more influence on their lives compared to other courses in middle or high school. These data highlight the strong influence that the summer program had on the lives of the participants.
58 percent of respondents frequently used what they learned at NFTE in their current employment.

25
The majority of the survey respondents who participated in Startup Summer were currently in college (64 percent) or still in high school (15 percent) at the time they completed the survey. Of the respondents who attended college (n = 59), 80 percent used their NFTE experience in their college applications. As noted in the section on college enrollment section above, we do not have information on how the respondents used their NFTE experience in their applications. However, it is clear that a much higher percentage of Startup Summer participants used their NFTE experience in their applications than did the non-Startup Summer participants (48 percent). In addition, 76 percent of Startup Summer participants who were currently in college planned to start a business after they graduate, which is much higher than the non-Startup Summer participants reported (34 percent).
As shown in Exhibit 14, 71 percent of the survey respondents who participated in Startup Summer launched a business, which was much higher than the rate for non-Startup Summer participants (24 percent). Thirteen percent of respondents launched the business they planned in Startup Summer as well as an additional business after Startup Summer. Another 51 percent of respondents launched the business they planned in Startup Summer. Seven percent of respondents launched another business after Startup Summer but not the one they planned in Startup Summer. Of the respondents who started a business, 94 percent thought that NFTE helped them with their businesses. Finally, 83 percent of Startup Summer participants frequently used what they learned in NFTE at their current work, which is 27 percentage points higher than the rate for non-Startup Summer participants.
Exhibit 14. Over two-thirds of the survey respondents who participated in Startup Summer launched a business
80 percent of Startup Summer participants used their NFTE experience in their college applications.

26
Conclusions
Overall, the results from the 2016 NFTE Alumni Survey indicated that respondents felt that the NFTE courses had a positive influence on their lives. Specifically, the majority of the survey respondents (89 percent) reported that NFTE contributed to their knowledge, skills, and/or personal development, and indicated that they used what they learned from NFTE in their current employment. One-quarter of survey respondents launched a business after participating in an NFTE course and just over one-third of the respondents planned to start a business after they finished college. In addition, the NFTE alumni who responded to the survey indicated they were succeeding academically. For example, the majority of respondents who finished high school were either currently attending college (58 percent) or had finished college (21 percent), and the vast majority of the respondents (91 percent) who had finished college completed a four-year degree or higher.
WestEd’s analysis identified the top six areas in which survey respondents felt NFTE contributed to their development. Four of these top six areas corresponded to the following skills included in the entrepreneurial mindset: Initiative and Self-Reliance; Communication and Collaboration; and Critical Thinking and Problem Solving. This finding suggests that NFTE is achieving its goal of teaching students to develop an entrepreneurial mindset, at least with regard to the small percentage of alumni who completed the survey. However, the survey data do not provide any information about the degree to which NFTE has influenced the students’ entrepreneurial mindsets. Future research that administers NFTE’s Entrepreneurial Mindset Index (EMI) measure to students before and after they participate in the NFTE programs would help determine whether the programs have a small or large influence on students’ entrepreneurial mindsets.
One-fourth of the NFTE alumni respondents had launched at least one business since completing their NFTE course and 16 percent of alumni had launched the business they planned in their NFTE courses. The rates at which alumni launched businesses varied across the NFTE programs. Over 41 percent of participants of the BizCamp and Startup Summer programs launched at least one business; 16 percent of the respondents who participated in only a single course launched a business. The four most common types of the businesses launched by NFTE alumni were design/fashion, retail, culinary, and computer science/technology. Additionally, the vast majority of respondents who launched a business (84 percent) thought that participation in NFTE helped them with their businesses.
The rate at which the NFTE alumni respondents indicated they were self-employed was higher than the national average. Of all NFTE alumni who responded to the survey and indicated they were currently employed, 16 percent reported they were self-employed or had a business open in the past year. The self-employment rate for NFTE alumni is much higher than the national rate of 6 percent for young adults ages 25–34 (Hipple & Hammond, 2016). Survey respondents who were currently attending college and working were self-employed at a high rate as well. Specifically, 14 percent of these respondents indicated they were self-employed or had a business open, which is substantially higher than the national self-employment rate of 2 percent for individuals 16–24 years of age (Hipple & Hammond, 2016). While the self-employment rates for survey respondents are high, we cannot claim that participation in NFTE programs caused the high rates. For example, it may be that

27
NFTE attracted the type of students who had a greater likelihood of eventually becoming self-employed regardless of whether or not they their participated. However, there has been one prior study (i.e., Nakkula et al., 2004 as cited in Valerio et al., 2014) that evaluated the impact of NFTE’s classroom programs using a quasi-experimental design. This study found that students’ self-reported entrepreneurial behavior, such as taking initiative and leadership activities, increased by a statistically significant margin for students who participated in one of NFTE’s classroom programs when compared to students who did not participate. Other outcomes, including self-reported curiosity, industriousness, and hopefulness, did not show statistically significant differences between NFTE and non-NFTE students. It remains to be seen whether the positive findings from Nakkula et al.’s (2004) study on NFTE’s classroom program in Boston can be replicated in other locations and with other NFTE programs.
With regard to the Startup Summer program, the survey findings suggest that the program had a particularly strong influence on the program participants. For example, 71 percent of the survey respondents who participated in Startup Summer launched a business and 80 percent of the respondents used their NFTE experience in their college applications. In comparison to all NFTE alumni, our confidence in the findings for Startup Summer participants was much greater because their survey response rate exceeded 50 percent. Given that Startup Summer is NFTE’s most intensive program, the organization may want to explore a cost-effectiveness analysis to compare the program benefits (e.g., number of businesses started) with the costs associated with running the program (Levin & McEwan, 2001) to determine the efficiency of Startup Summer.
The very low estimated survey response rate (i.e., 6 to 9 percent) precludes us from determining whether the findings apply to NFTE alumni in general. One strategy that NFTE could use in the future to obtain more reliable estimates for all alumni is to select a random sample of NFTE alumni from each year and then track these alumni over time. NFTE could collect more detailed contact information from the sample and follow-up with these alumni annually to update this contact information. To obtain relatively precise estimates of the self-employment rate (i.e., ± 5 percentage points), a sample of approximately 250 alumni would be needed (Dillman et al., 2014).
Although the findings from the current study provide interesting descriptive data about the outcomes of NFTE alumni after they finished the program, they do not provide a substantial amount of formative feedback for NFTE that could help guide program improvement. A future analysis of the responses to the current survey’s open-ended questions may produce data that NFTE could use to make critical changes to the programs. Additionally, future studies of NFTE could specifically examine strengths and weaknesses of each program (Patton, 2008). Surveys and interviews with program staff and current NFTE students during the implementation of the programs could also provide data that help improve NFTE’s programs.

28
References American Association for Public Opinion Research. (2011). Standard definitions: Final dispositions of case codes and
outcome rates for surveys. Ann Arbor, MI: AAPOR.
Ananiadou, K., & Claro, M. (2009). 21st century skills and competences for new millennium learners in OECD countries (OECD Working Papers No. 4). Paris, France: The Organisation for Economic Co-operation and Development.
Casner-Lotto, J., & Barrington, L. (2006). Are they really ready to work? Employers’ perspectives on the basic knowledge and applied skills of new entrants to the 21st century US workforce. Washington, DC: Partnership for 21st Century Skills.
Child Trends. (2015). Youth employment: Indicators on children and youth. Bethesda, MD: Child Trends.
Dillman, D. A., Smyth, J. D., & Christian, L. M. (2014). Internet, phone, mail, and mixed-mode surveys: The tailored design method (4th ed.). Hoboken, NJ: Wiley.
Evergreen, S. D. H. (2017). Effective data visualization: The right chart for the right data. Thousand Oaks, CA: Sage.
Fowler, F. J. (2009). Survey research methods (4th ed.). Thousand Oaks, CA: Sage.
Hipple, S. F., & Hammond, L. A. (2016, March). Self-employment in the United States. Washington, DC: U.S. Bureau of Labor Statistics.
Kauffman Foundation. (2013). Entrepreneurship education comes of age on campus: The challenges and rewards of bringing entrepreneurship to higher education. Kansas City, MO: Kauffman Foundation.
Kautz, T., Heckman, J. J., Diris, R., Ter Weel, B., & Borghans, L. (2014). Fostering and measuring skills: Improving cognitive and non-cognitive skills to promote lifetime success (NBER Working Paper No. 20749). Cambridge, MA: National Bureau of Economic Research.
Kena, G., Hussar W., McFarland J., de Brey C., Musu-Gillette, L., Wang, X., Zhang, J., Rathbun, A., Wilkinson-Flicker, S., Diliberti M., Barmer, A., Bullock Mann, F., & Dunlop Velez, E. (2016). The Condition of Education 2016 (NCES 2016-144). Washington, DC: U.S. Department of Education, National Center for Education Statistics.
Levin, H. M., & McEwan, P. J. (2001). Cost-effectiveness analysis: Methods and applications (2nd ed.). Thousand Oaks, CA: Sage.
Lohr, S. L. (2010). Sampling: Design and analysis (2nd ed.). Boston, MA: Brooks/Cole.
Mariotti, S. (2015). An entrepreneur’s manifesto. West Conshohocken, PA: Templeton Press.
Network for Teaching Entrepreneurship. (2016a). A pathway to inclusion in the innovation economy: 2015-16 annual report. New York, NY: Network for Teaching Entrepreneurship. Retrieved from http://www.nfte.com/pages/annual-reports
Network for Teaching Entrepreneurship. (2016b). Entrepreneurial mindset: Onramp to opportunity. New York, NY: Network for Teaching Entrepreneurship.
Patton, M. Q. (2008). Utilization-focused evaluation (4th ed.). Thousand Oaks, CA: Sage.

29
Princeton Review. (2016, November 16). Top schools for entrepreneurship press release. Retrieved from https://www.princetonreview.com/press/top-entrepreneurial-press-release
Rotherham, A. J., & Willingham, D. T. (2010). “21st-century” skills: Not new, but a worthy challenge. American Educator, 34, 17-20.
Silander, M., Chavez-Reilly, M., & Weinstein, M. (2015). Make Your Job Summer Program: A report to the Network for Teaching Entrepreneurship. New York, NY: The Institute for Education and Social Policy (IESP).
U.S. Department of Education (2016). Digest of Education Statistics 2015. Washington, DC: National Center for Education Statistics, Institute of Education Sciences, U.S. Department of Education. Retrieved from https://nces.ed.gov/programs/digest/
Valerio, A., Parton, B., & Robb, A. (2014). Entrepreneurship education and training programs around the world: dimensions for success. Washington, DC: The World Bank.
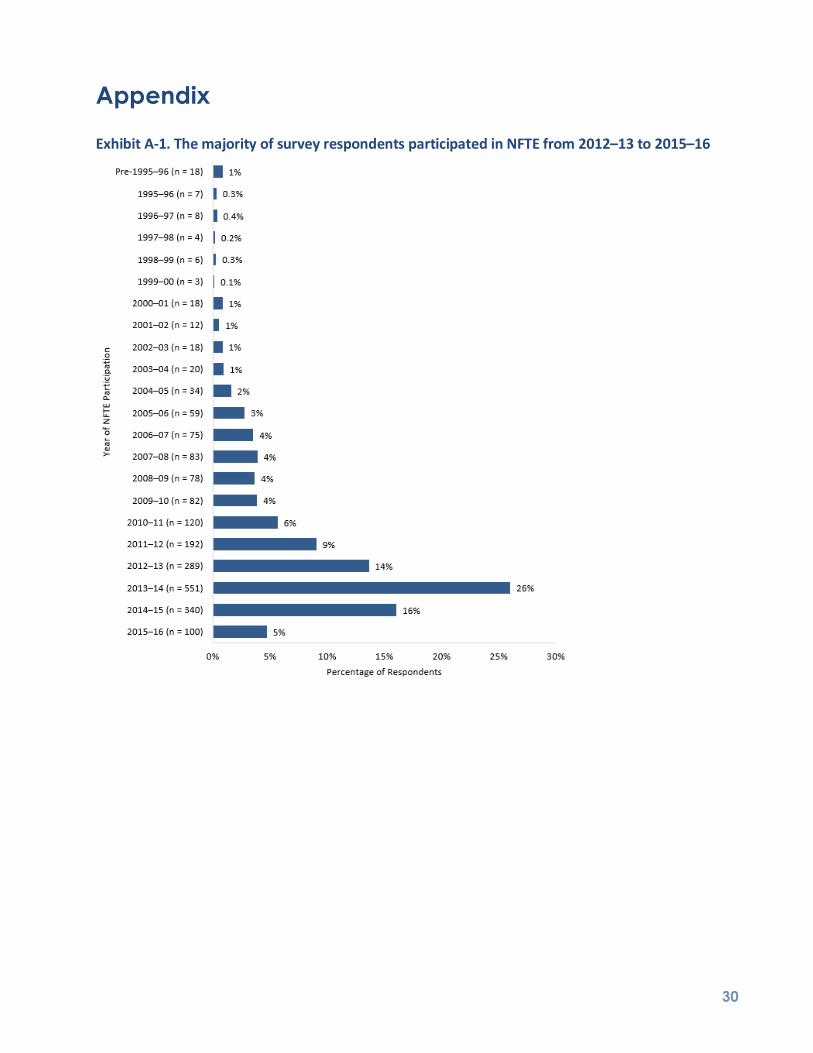
30
Appendix
Exhibit A-1. The majority of survey respondents participated in NFTE from 2012–13 to 2015–16

31
Exhibit A-2. The percentage of current college students who planned to open a business after they graduate ranged from 31 to 42 percent across NFTE regions
Note: The NFTE Average includes 15 respondents from Other regions.
Exhibit A-3. The percentage of current college students who majored in business ranged from 35 to 47 percent across NFTE regions
Note: The NFTE Average includes 14 respondents from Other regions.

32
Exhibit A-4. The percentage of respondents who very frequently or frequently used what they learned at NFTE in their current employment ranged from 51 to 63 percent across NFTE regions
Note: The NFTE Average includes 49 respondents from Other regions.
