new zealand regional tourism forecasts 2010 … · new zealand regional tourism forecasts 2010-2016...
TRANSCRIPT

NEW ZEALAND REGIONAL TOURISM FORECASTS 2010-2016
AUCKLAND RTO AUGUST 2010 | www.tourismresearch.govt.nz
Tourism Strategy Group
Ministry of Economic Development

Contents
Introduction 1
1. Summary for Auckland RTO 2
2. Visits to Auckland RTO 5
3. Visits to Auckland RTO by Origin of Traveller 6
4. Visitor Nights in Auckland RTO 7
5. Visitor Nights in Auckland RTO by Origin of Traveller 8
6. Visitor Expenditure in Auckland RTO 9
Appendix – Visitor Origins, RTOs Areas, and Underlying Sample Sizes 10
This report is one of a series of reports produced within the annual tourism forecasting programme.
The main report titles within the 2010 programme are:
New Zealand Tourism Forecasts 2010-2016 – Summary Document
New Zealand Regional Tourism Forecasts 2010-2016
(These are individual reports for Regional Tourism Organisation (RTO) areas)
These forecast reports, as well as pivot tables, are available for download at www.tourismresearch.govt.nz/forecasts.
All of the forecasting reports are prepared for the Tourism Strategy Group, MED, by Covec Limited.
Tourism Strategy Group
Ministry of Economic Development
PO Box 5640
Wellington
New Zealand
Ph: +64 4 498 7440
Fax: +64 4 498 7445
Email: [email protected]
Web: www.tourism.govt.nz; www.tourismresearch.govt.nz
Covec Limited
Ph: +64 9 916 1970
Fax: +64 9 916 1971
Email: [email protected]
Web: www.covec.co.nz
Image Credits:
Rangitata Rafts – www.rafts.co.nz
Fern – Rebecca Davis, www.moxie.co.nz
1
Introduction
This report contains tourism forecasts for the Auckland
RTO area that can be used to support local tourism
investment, planning and development. The annual
forecasts cover the period 2010-2016 and provide
estimates of future visits and visitor nights segmented
by traveller origin, purpose of travel and type of travel.
Forecasts of tourism expenditure are also included in
this year’s programme, although data constraints
prevent detailed segmentation beyond total
international and domestic spend. The expenditure
figures take inflation into account and include GST. Key
exclusions are expenditure on international airfares, as
well as some government and business expenditure.
More information can be found in electronic format in
the regional pivot tables which can be downloaded from
www.tourismresearch.govt.nz/forecasts. The regional
pivot tables allow users to view historical and forecast
data at the regional level in both tabular and graphical
form.
Base Data: The forecasts in this report are based on
historical data derived from the International Visitor
Survey (IVS) and the Domestic Travel Survey (DTS).
These data have been smoothed to reduce the volatility
caused by small sample sizes (see Table A2 in the
Appendix for a summary of sample sizes in 2009). The
smoothing process involves combining data across
multiple time periods in small sample areas to identify
long-term trends and relativities. The result is much
smoother historical data that preserve regional
differences and represent more realistic growth trends.
Also, the IVS and DTS data have been adjusted to
include travel by children under 15 years of age who fall
outside the scope of the surveys. In addition, some
government and business travel is not captured in the
DTS because it is primarily a household survey.
Methodology: The regional forecasts have been
developed by modelling and extrapolating historical
relationships between the origins of travellers, their main
purpose of travel, and their propensities to visit various
RTO areas. The model used to forecast international
visitor activity also takes port of entry into account as
this has a major influence on regional travel patterns. A
full methodology document can be downloaded from
www.tourismresearch.govt.nz/forecasts.
Definitions of Key Tourism Measures
Domestic International
Day Trip
A trip by a person of at least 40km (one way)
within New Zealand but outside their usual
environment, completed within the same day.
Not applicable.
Overnight Trip A trip by a person resulting in one or more
nights spent away from home within New
Zealand.
A trip by a person that results in one or more
nights being spent in New Zealand.
Day Visit The number of people visiting a destination within the RTO for one hour or more without staying
a night. Day visits can be generated by people on overnight trips and day trips.
Overnight Visit The number of visits to a destination within the RTO that result in a stay of at least one night.
Visitor Nights The number of visitor nights spent in destinations within the RTO in all forms of
accommodation.
Origin Regional council areas (see full list in
Appendix).
Australia, United States, Japan, South Korea,
China, United Kingdom, Germany, Rest of
World.

2
1. Summary for Auckland RTO
Total Visits Figure 1: Visits to Auckland RTO by Origin of Traveller
(000s) Total visits by travellers to Auckland RTO are forecast to
rise from 13.594 million in 2009 to 14.423 million in
2016 - an increase of 6.1% (829,000) or 0.8% p.a.
International visits are expected to increase from 2.550
million in 2009 to 3.261 million in 2016, representing
growth of 710,000 or 27.9%. The share of total visits
generated by international visitors is expected to
increase from 18.8% to 22.6%.
Domestic visits are expected to increase from 11.044
million in 2009 to 11.163 million in 2016, representing
growth of 119,000 or 1.1%. The share of total visits
generated by domestic visitors is expected to decrease
from 81.2% to 77.4%.
0 2,000 4,000 6,000 8,000 10,00012,000
International
Domestic
2009 2016f
Figure 2: Visitor Nights in Auckland RTO by Origin of
Traveller (000s) Total Visitor Nights
Total visitor nights in Auckland RTO are forecast to rise
from 23.538 million in 2009 to 26.603 million in 2016 -
an increase of 13.0% (3.065m) or 1.8% p.a.
International visitor nights are expected to increase
from 16.141 million in 2009 to 19.283 million in 2016,
representing growth of 3.142m or 19.5%. The share of
total visitor nights generated by international visitors is
expected to increase from 68.6% to 72.5%.
Domestic visitor nights are expected to decrease from
7.397 million in 2009 to 7.320 million in 2016,
representing a contraction of 77,000 or 1.0%. The share
of total visitor nights generated by domestic visitors is
expected to decrease from 31.4% to 27.5%.
0 5,000 10,000 15,000 20,000 25,000
International
Domestic
2009 2016f
Total Visitor Expenditure Figure 3: Visitor Expenditure in Auckland RTO by Origin of
Traveller ($NZm) Total expenditure by visitors to Auckland RTO is
forecast to increase from $4.150 billion in 2009 to
$5.102 billion in 2016 - growth of 22.9% ($952 million)
or 3.0% p.a.
International visitor expenditure is expected to increase
from $2.277 billion in 2009 to $3.008 billion in 2016,
representing growth of $731 million or 32.1%. The share
of total expenditure generated by international visitors is
expected to increase from 54.9% to 59.0%.
Domestic visitor expenditure is expected to increase
from $1.873 billion in 2009 to $2.094 billion in 2016,
representing growth of $221 million or 11.8%. The share
of total visitor expenditure generated by domestic
visitors is expected to decrease from 45.1% to 41.0%.
0 1,000 2,000 3,000 4,000
International
Domestic
2009 2016f

3
Figure 4: Shares of Total Visits to Auckland RTO by Origin of Traveller (% of all visits)
0
5
10
15
20
25
30
35
40
452009 2016fInternationalDomestic
Figure 5: Shares of Total Visitor Nights in Auckland RTO by Origin of Traveller (% of all visitor nights)
0
5
10
15
20
25
30
352009 2016fInternationalDomestic
4
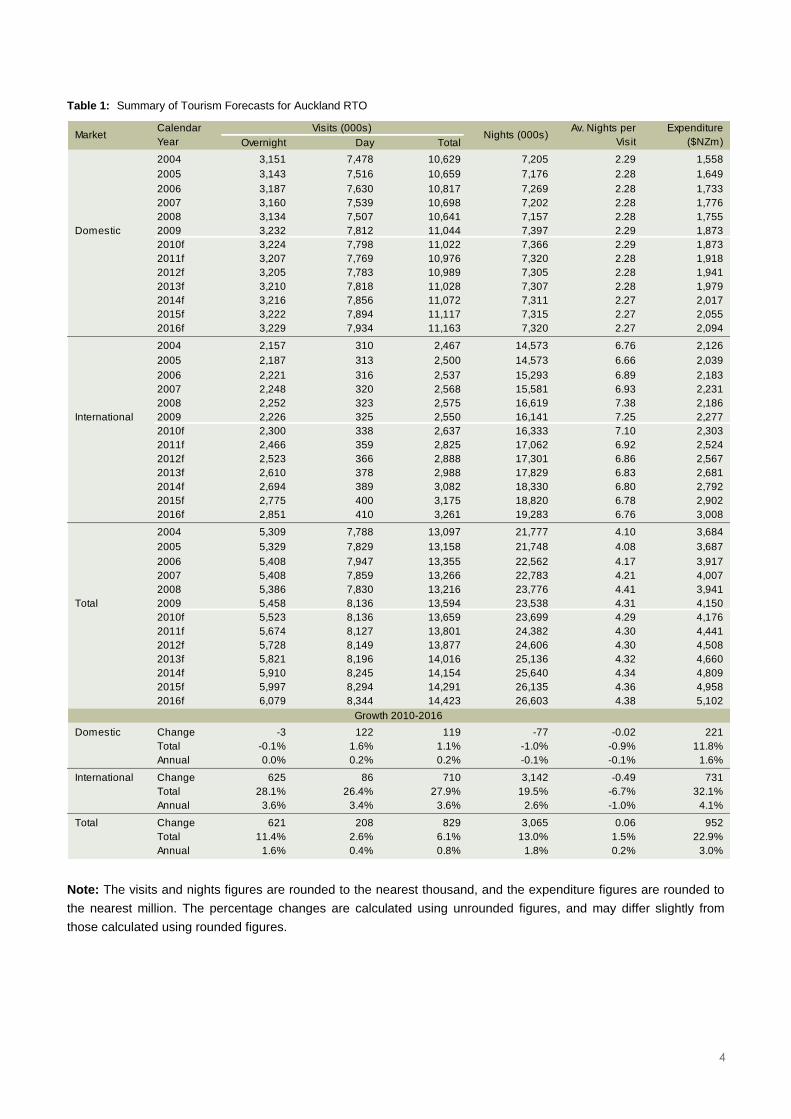
Table 1: Summary of Tourism Forecasts for Auckland RTO
Overnight Day Total
2004 3,151 7,478 10,629 7,205 2.29 1,558
2005 3,143 7,516 10,659 7,176 2.28 1,649
2006 3,187 7,630 10,817 7,269 2.28 1,733
2007 3,160 7,539 10,698 7,202 2.28 1,776
2008 3,134 7,507 10,641 7,157 2.28 1,755
Domestic 2009 3,232 7,812 11,044 7,397 2.29 1,873
2010f 3,224 7,798 11,022 7,366 2.29 1,873
2011f 3,207 7,769 10,976 7,320 2.28 1,918
2012f 3,205 7,783 10,989 7,305 2.28 1,941
2013f 3,210 7,818 11,028 7,307 2.28 1,979
2014f 3,216 7,856 11,072 7,311 2.27 2,017
2015f 3,222 7,894 11,117 7,315 2.27 2,055
2016f 3,229 7,934 11,163 7,320 2.27 2,094
2004 2,157 310 2,467 14,573 6.76 2,126
2005 2,187 313 2,500 14,573 6.66 2,039
2006 2,221 316 2,537 15,293 6.89 2,183
2007 2,248 320 2,568 15,581 6.93 2,231
2008 2,252 323 2,575 16,619 7.38 2,186
International 2009 2,226 325 2,550 16,141 7.25 2,277
2010f 2,300 338 2,637 16,333 7.10 2,303
2011f 2,466 359 2,825 17,062 6.92 2,524
2012f 2,523 366 2,888 17,301 6.86 2,567
2013f 2,610 378 2,988 17,829 6.83 2,681
2014f 2,694 389 3,082 18,330 6.80 2,792
2015f 2,775 400 3,175 18,820 6.78 2,902
2016f 2,851 410 3,261 19,283 6.76 3,008
2004 5,309 7,788 13,097 21,777 4.10 3,684
2005 5,329 7,829 13,158 21,748 4.08 3,687
2006 5,408 7,947 13,355 22,562 4.17 3,917
2007 5,408 7,859 13,266 22,783 4.21 4,007
2008 5,386 7,830 13,216 23,776 4.41 3,941
Total 2009 5,458 8,136 13,594 23,538 4.31 4,150
2010f 5,523 8,136 13,659 23,699 4.29 4,176
2011f 5,674 8,127 13,801 24,382 4.30 4,441
2012f 5,728 8,149 13,877 24,606 4.30 4,508
2013f 5,821 8,196 14,016 25,136 4.32 4,660
2014f 5,910 8,245 14,154 25,640 4.34 4,809
2015f 5,997 8,294 14,291 26,135 4.36 4,958
2016f 6,079 8,344 14,423 26,603 4.38 5,102
Domestic Change -3 122 119 -77 -0.02 221
Total -0.1% 1.6% 1.1% -1.0% -0.9% 11.8%
Annual 0.0% 0.2% 0.2% -0.1% -0.1% 1.6%
International Change 625 86 710 3,142 -0.49 731
Total 28.1% 26.4% 27.9% 19.5% -6.7% 32.1%
Annual 3.6% 3.4% 3.6% 2.6% -1.0% 4.1%
Total Change 621 208 829 3,065 0.06 952
Total 11.4% 2.6% 6.1% 13.0% 1.5% 22.9%
Annual 1.6% 0.4% 0.8% 1.8% 0.2% 3.0%
Visits (000s)Calendar
Year Market Nights (000s)
Av. Nights per
Visit
Expenditure
($NZm)
Growth 2010-2016
Note: The visits and nights figures are rounded to the nearest thousand, and the expenditure figures are rounded to
the nearest million. The percentage changes are calculated using unrounded figures, and may differ slightly from
those calculated using rounded figures.
5
2. Visits to Auckland RTO
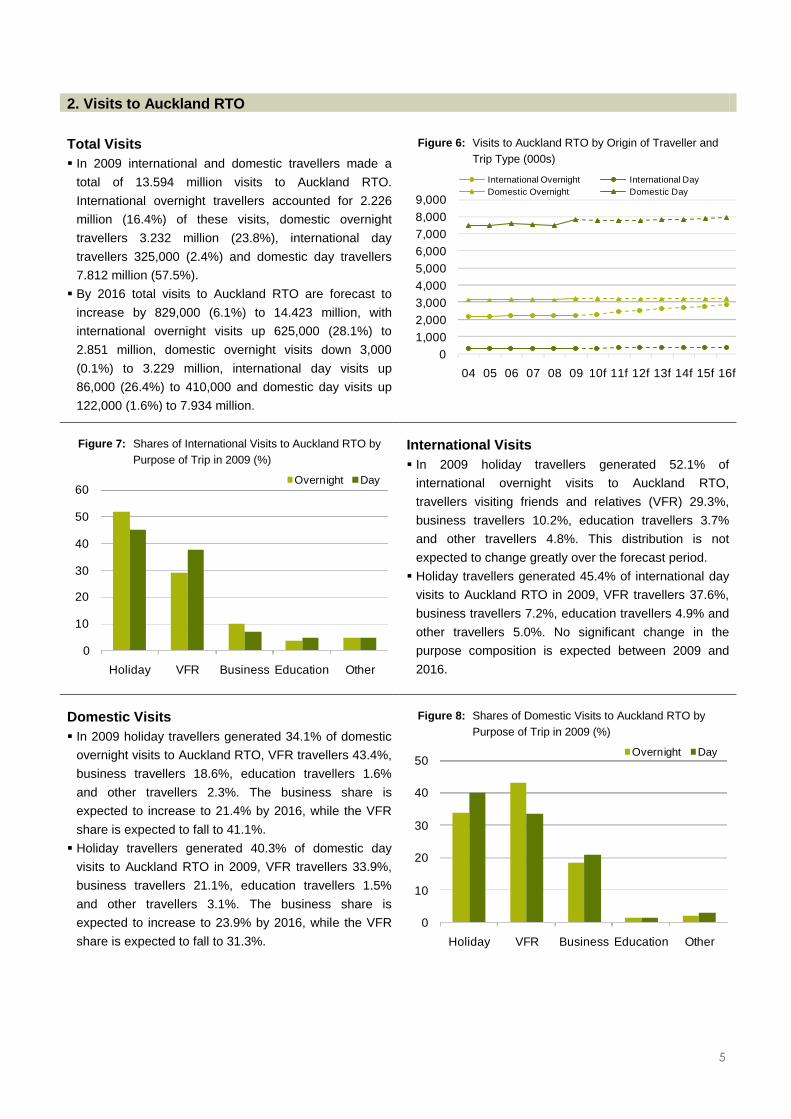
Total Visits Figure 6: Visits to Auckland RTO by Origin of Traveller and
Trip Type (000s) In 2009 international and domestic travellers made a
total of 13.594 million visits to Auckland RTO.
International overnight travellers accounted for 2.226
million (16.4%) of these visits, domestic overnight
travellers 3.232 million (23.8%), international day
travellers 325,000 (2.4%) and domestic day travellers
7.812 million (57.5%).
By 2016 total visits to Auckland RTO are forecast to
increase by 829,000 (6.1%) to 14.423 million, with
international overnight visits up 625,000 (28.1%) to
2.851 million, domestic overnight visits down 3,000
(0.1%) to 3.229 million, international day visits up
86,000 (26.4%) to 410,000 and domestic day visits up
122,000 (1.6%) to 7.934 million.
0
1,000
2,000
3,000
4,000
5,000
6,000
7,000
8,000
9,000
04 05 06 07 08 09 10f 11f 12f 13f 14f 15f 16f
International Overnight International Day
Domestic Overnight Domestic Day
Figure 7: Shares of International Visits to Auckland RTO by
Purpose of Trip in 2009 (%) International Visits
In 2009 holiday travellers generated 52.1% of
international overnight visits to Auckland RTO,
travellers visiting friends and relatives (VFR) 29.3%,
business travellers 10.2%, education travellers 3.7%
and other travellers 4.8%. This distribution is not
expected to change greatly over the forecast period.
Holiday travellers generated 45.4% of international day
visits to Auckland RTO in 2009, VFR travellers 37.6%,
business travellers 7.2%, education travellers 4.9% and
other travellers 5.0%. No significant change in the
purpose composition is expected between 2009 and
2016.
0
10
20
30
40
50
60
Holiday VFR Business Education Other
Overnight Day
Domestic Visits Figure 8: Shares of Domestic Visits to Auckland RTO by
Purpose of Trip in 2009 (%) In 2009 holiday travellers generated 34.1% of domestic
overnight visits to Auckland RTO, VFR travellers 43.4%,
business travellers 18.6%, education travellers 1.6%
and other travellers 2.3%. The business share is
expected to increase to 21.4% by 2016, while the VFR
share is expected to fall to 41.1%.
Holiday travellers generated 40.3% of domestic day
visits to Auckland RTO in 2009, VFR travellers 33.9%,
business travellers 21.1%, education travellers 1.5%
and other travellers 3.1%. The business share is
expected to increase to 23.9% by 2016, while the VFR
share is expected to fall to 31.3%.
0
10
20
30
40
50
Holiday VFR Business Education Other
Overnight Day

6
3. Visits to Auckland RTO by Origin of Traveller
International Visits Figure 9: Shares of International Visits to Auckland RTO by
Origin of Traveller (%) International visits to Auckland RTO are expected to
increase from 2.550 million in 2009 to 3.261 million in
2016, representing growth of 710,000 or 27.9%.
Travellers from Australia accounted for the largest share
of international visits to Auckland RTO in 2009 at
34.8%, followed by the United Kingdom at 12.8% and
the United States at 7.6%.
In 2016 the largest share of international visits to
Auckland RTO is expected to come from Australia at
35.0%, followed by the United Kingdom at 10.8% and
China at 8.5%. 0
5
10
15
20
25
30
35
40
AU UK JP SK CH US GE RW
2009 2016f
Figure 10: Shares of Domestic Visits to Auckland RTO by
Origin of Traveller (%) Domestic Visits
Domestic visits to Auckland RTO are expected to
increase from 11.044 million in 2009 to 11.163 million in
2016, representing growth of 119,000 or 1.1%.
Travellers from Auckland accounted for the largest
share of domestic visits to Auckland RTO in 2009 at
48.2%, followed by Waikato at 19.8% and Northland at
9.1%.
In 2016 the largest share of domestic visits to Auckland
RTO is expected to come from Auckland at 48.1%,
followed by Waikato at 20.4% and Northland at 8.9%. 0
10
20
30
40
50
60
ND AK WK BP GS HB TA MW WG MB NL WC CA OT SD
2009 2016f
Table 2a: Shares of International Visits to Auckland RTO by
Origin of Traveller
Origin 2009 2016f Change
Australia 34.8% 35.0% 0.2%
United Kingdom 12.8% 10.8% -2.0%
Japan 3.5% 3.3% -0.3%
South Korea 2.6% 3.9% 1.3%
China 6.1% 8.5% 2.4%
United States 7.6% 8.1% 0.5%
Germany 3.8% 3.7% -0.2%
Rest of World 28.8% 26.8% -1.9%
All Countries 100.0% 100.0% 0.0%
International Shares
Note: The “change” column describes the percentage point
difference, not the actual percentage change
Table 2b: Shares of Domestic Visits to Auckland RTO by
Origin of Traveller
Origin 2009 2016f Change
Northland 9.1% 8.9% -0.3%
Auckland 48.2% 48.1% -0.1%
Waikato 19.8% 20.4% 0.5%
Bay of Plenty 7.8% 7.8% 0.0%
Gisborne 0.4% 0.4% 0.0%
Hawke's Bay 1.4% 1.4% 0.0%
Taranaki 1.0% 0.9% -0.1%
Manawatu-Wanganui 2.6% 2.6% -0.1%
Wellington 5.1% 5.1% 0.0%
Marlborough 0.1% 0.1% 0.0%
Nelson-Tasman 0.5% 0.5% 0.0%
West Coast 0.1% 0.1% 0.0%
Canterbury 2.8% 2.9% 0.0%
Otago 0.7% 0.7% 0.0%
Southland 0.3% 0.3% 0.0%
New Zealand 100.0% 100.0% 0.0%
Domestic Shares
7
4. Visitor Nights in Auckland RTO
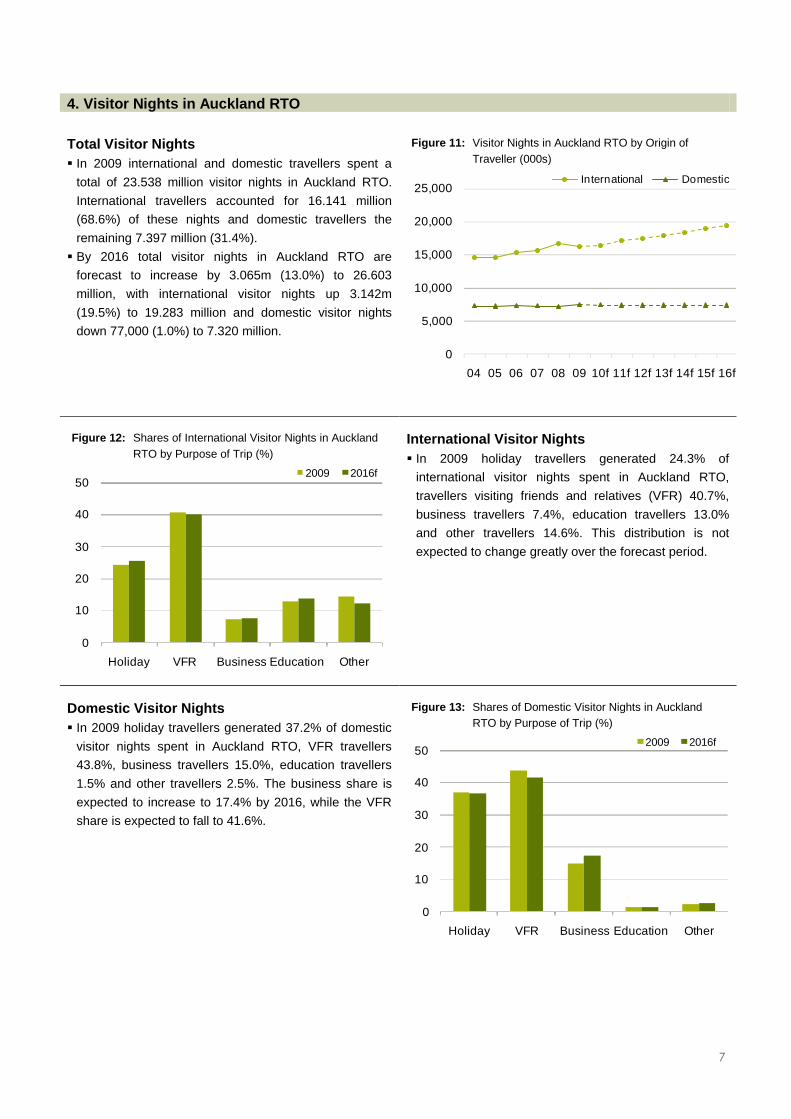
Total Visitor Nights Figure 11: Visitor Nights in Auckland RTO by Origin of
Traveller (000s) In 2009 international and domestic travellers spent a
total of 23.538 million visitor nights in Auckland RTO.
International travellers accounted for 16.141 million
(68.6%) of these nights and domestic travellers the
remaining 7.397 million (31.4%).
By 2016 total visitor nights in Auckland RTO are
forecast to increase by 3.065m (13.0%) to 26.603
million, with international visitor nights up 3.142m
(19.5%) to 19.283 million and domestic visitor nights
down 77,000 (1.0%) to 7.320 million.
0
5,000
10,000
15,000
20,000
25,000
04 05 06 07 08 09 10f 11f 12f 13f 14f 15f 16f
International Domestic
Figure 12: Shares of International Visitor Nights in Auckland
RTO by Purpose of Trip (%) International Visitor Nights
In 2009 holiday travellers generated 24.3% of
international visitor nights spent in Auckland RTO,
travellers visiting friends and relatives (VFR) 40.7%,
business travellers 7.4%, education travellers 13.0%
and other travellers 14.6%. This distribution is not
expected to change greatly over the forecast period.
0
10
20
30
40
50
Holiday VFR Business Education Other
2009 2016f
Domestic Visitor Nights Figure 13: Shares of Domestic Visitor Nights in Auckland
RTO by Purpose of Trip (%) In 2009 holiday travellers generated 37.2% of domestic
visitor nights spent in Auckland RTO, VFR travellers
43.8%, business travellers 15.0%, education travellers
1.5% and other travellers 2.5%. The business share is
expected to increase to 17.4% by 2016, while the VFR
share is expected to fall to 41.6%.
0
10
20
30
40
50
Holiday VFR Business Education Other
2009 2016f

8
5. Visitor Nights in Auckland RTO by Origin of Traveller
International Visitor Nights Figure 14: Shares of International Visitor Nights in Auckland
RTO by Origin of Traveller (%) International visitor nights in Auckland RTO are
expected to increase from 16.141 million in 2009 to
19.283 million in 2016, representing growth of 3.142m
or 19.5%.
Travellers from Australia accounted for the largest share
of international visitor nights in Auckland RTO in 2009 at
17.5%, followed by the United Kingdom at 11.3% and
China at 7.8%.
In 2016 the largest share of international visitor nights in
Auckland RTO is expected to come from Australia at
18.7%, followed by the United Kingdom at 10.2% and
China at 9.9%.
0
5
10
15
20
25
30
35
40
45
50
AU UK JP SK CH US GE RW
2009 2016f
Figure 15: Shares of Domestic Visitor Nights in Auckland RTO
by Origin of Traveller (%) Domestic Visitor Nights
Domestic visitor nights in Auckland RTO are expected
to decrease from 7.397 million in 2009 to 7.320 million
in 2016, representing a contraction of 77,000 or 1.0%.
Travellers from Auckland accounted for the largest
share of domestic visitor nights in Auckland RTO in
2009 at 22.4%, followed by Waikato at 15.3% and
Wellington at 13.0%.
In 2016 the largest share of domestic visitor nights in
Auckland RTO is expected to come from Auckland at
22.8%, followed by Waikato at 15.7% and Wellington at
12.9%. 0
5
10
15
20
25
ND AK WK BP GS HB TA MW WG MB NL WC CA OT SD
2009 2016f
Table 3a: Shares of International Visitor Nights in Auckland RTO
by Origin of Traveller
Origin 2009 2016f Change
Australia 17.5% 18.7% 1.1%
United Kingdom 11.3% 10.2% -1.1%
Japan 3.0% 3.2% 0.1%
South Korea 4.3% 4.6% 0.4%
China 7.8% 9.9% 2.0%
United States 5.0% 5.7% 0.7%
Germany 3.6% 3.8% 0.2%
Rest of World 47.4% 44.1% -3.4%
All Countries 100.0% 100.0% 0.0%
International Shares
Note: The “change” column describes the percentage point
difference, not the actual percentage change.
Table 3b: Shares of Domestic Visitor Nights in Auckland
RTO by Origin of Traveller
Origin 2009 2016f Change
Northland 8.6% 8.3% -0.2%
Auckland 22.4% 22.8% 0.3%
Waikato 15.3% 15.7% 0.4%
Bay of Plenty 11.3% 11.5% 0.2%
Gisborne 1.9% 1.8% -0.1%
Hawke's Bay 3.6% 3.6% -0.1%
Taranaki 2.7% 2.5% -0.2%
Manawatu-Wanganui 6.5% 6.3% -0.2%
Wellington 13.0% 12.9% -0.1%
Marlborough 0.5% 0.5% 0.0%
Nelson-Tasman 1.5% 1.5% 0.0%
West Coast 0.2% 0.1% 0.0%
Canterbury 8.1% 8.1% 0.1%
Otago 2.9% 2.9% 0.0%
Southland 1.5% 1.4% -0.1%
New Zealand 100.0% 100.0% 0.0%
Domestic Shares

9
6. Visitor Expenditure in Auckland RTO
Total Expenditure Figure 16: Visitor Expenditure in Auckland RTO by Origin of
Traveller ($NZm) In 2009 international and domestic visitors spent a total
of $4.150 billion in Auckland RTO. International visitors
accounted for $2.277 billion (54.9%) of this expenditure
and domestic visitors the remaining $1.873 billion
(45.1%).
By 2016 total visitor expenditure in Auckland RTO is
forecast to increase by $952 million (22.9%) to $5.102
billion, with international expenditure up $731 million
(32.1%) to $3.008 billion and domestic expenditure up
$221 million (11.8%) to $2.094 billion.
The share of national visitor expenditure captured by
Auckland RTO is forecast to increase from 27.48% in
2009 to 28.25% in 2016.
0
500
1,000
1,500
2,000
2,500
3,000
3,500
04 05 06 07 08 09 10f 11f 12f 13f 14f 15f 16f
International Domestic
Table 4: Visitor Expenditure in Auckland RTO by Origin of Traveller ($NZm)
Calendar Year International Domestic Total Share of NZ International Domestic Total
2004 2,126 1,558 3,684 27.24% 57.7% 42.3% 100.0%
2005 2,039 1,649 3,687 27.34% 55.3% 44.7% 100.0%
2006 2,183 1,733 3,917 27.69% 55.7% 44.3% 100.0%
2007 2,231 1,776 4,007 27.45% 55.7% 44.3% 100.0%
2008 2,186 1,755 3,941 27.52% 55.5% 44.5% 100.0%
2009 2,277 1,873 4,150 27.48% 54.9% 45.1% 100.0%
2010f 2,303 1,873 4,176 27.50% 55.1% 44.9% 100.0%
2011f 2,524 1,918 4,441 27.71% 56.8% 43.2% 100.0%
2012f 2,567 1,941 4,508 27.82% 56.9% 43.1% 100.0%
2013f 2,681 1,979 4,660 27.95% 57.5% 42.5% 100.0%
2014f 2,792 2,017 4,809 28.06% 58.1% 41.9% 100.0%
2015f 2,902 2,055 4,958 28.16% 58.5% 41.5% 100.0%
2016f 3,008 2,094 5,102 28.25% 59.0% 41.0% 100.0%
Growth 2010-16 731 221 952
Total 32.1% 11.8% 22.9%
Annual 4.1% 1.6% 3.0%
Share of Auckland RTO

10
Appendix
Table A1: Origins of Visitors and Abbreviations
Table A2: RTOs and Constituent Territorial Authorities
*Also counted as part of Canterbury RTO; **Divided into two RTOs; ***Currently not a funded RTO; Di = District
Domestic Origins (Regional Council Areas) International Origins
Northland Region (ND) Nelson-Tasman Region (NL) Australia (AU)
Auckland Region (AK) Marlborough Region (MB) United Kingdom (UK)
Waikato Region (WK) West Coast Region (WC) Japan (JP)
Bay of Plenty Region (BP) Canterbury Region (CA) South Korea (SK)
Gisborne Region (GS) Otago Region (OT) China (CH)
Hawke’s Bay Region (HB) Southland Region (SD) United States (US)
Taranaki Region (TA) Germany (GE)
Manawatu-Wanganui Region (MW) Rest of the World (RW)
Wellington Region (WG)
Northland RTO Far North Di Wanganui RTO Wanganui Di
Kaipara Di Wairarapa RTO Carterton Di
Whangarei Di Masterton Di
Auckland RTO Auckland City South Wairarapa Di
Franklin Di Kapiti-Horowhenua RTO Horowhenua Di
Manukau City Kapiti Coast Di
North Shore City Wellington RTO Lower Hutt City
Papakura Di Porirua City
Rodney Di Upper Hutt City
Waitakere City Wellington City
Coromandel RTO Hauraki Di Marlborough RTO Marlborough Di
Thames-Coromandel Di Nelson RTO Nelson City
Waikato RTO Hamilton City Tasman Di
Matamata-Piako Di Canterbury RTO Ashburton Di
Otorohanga Di Chatham Islands Territory
South Waikato Di Christchurch City
Waikato Di Hurunui Di
Waipa Di Kaikoura Di
Waitomo Di Mackenzie Di*
Bay of Plenty RTO Tauranga City Selwyn Di
Western Bay of Plenty Di Timaru Di*
Rotorua RTO Rotorua Di Waimakariri Di
Lake Taupo RTO Taupo Di Waimate Di
Kawerau-Whakatane*** Kawerau Di Timaru RTO Timaru Di*
Whakatane Di MacKenzie RTO Mackenzie Di*
Gisborne RTO Gisborne Di Waitaki RTO Waitaki Di
Opotiki Di West Coast RTO Buller Di
Taranaki RTO New Plymouth Di Grey Di
South Taranaki Di Westland Di
Stratford Di Lake Wanaka RTO Queenstown-Lakes Di**
Hawke's Bay RTO Central Hawke's Bay Di Queenstown RTO Queenstown-Lakes Di**
Hastings Di Central Otago RTO Central Otago Di
Napier City Dunedin RTO Dunedin City
Wairoa Di Clutha*** Clutha Di
Ruapehu RTO Ruapehu Di Fiordland RTO Southland Di**
Manawatu RTO Manawatu Di Southland RTO Gore Di
Palmerston North City Invercargill City
Rangitikei Di Southland Di**
Tararua Di
11
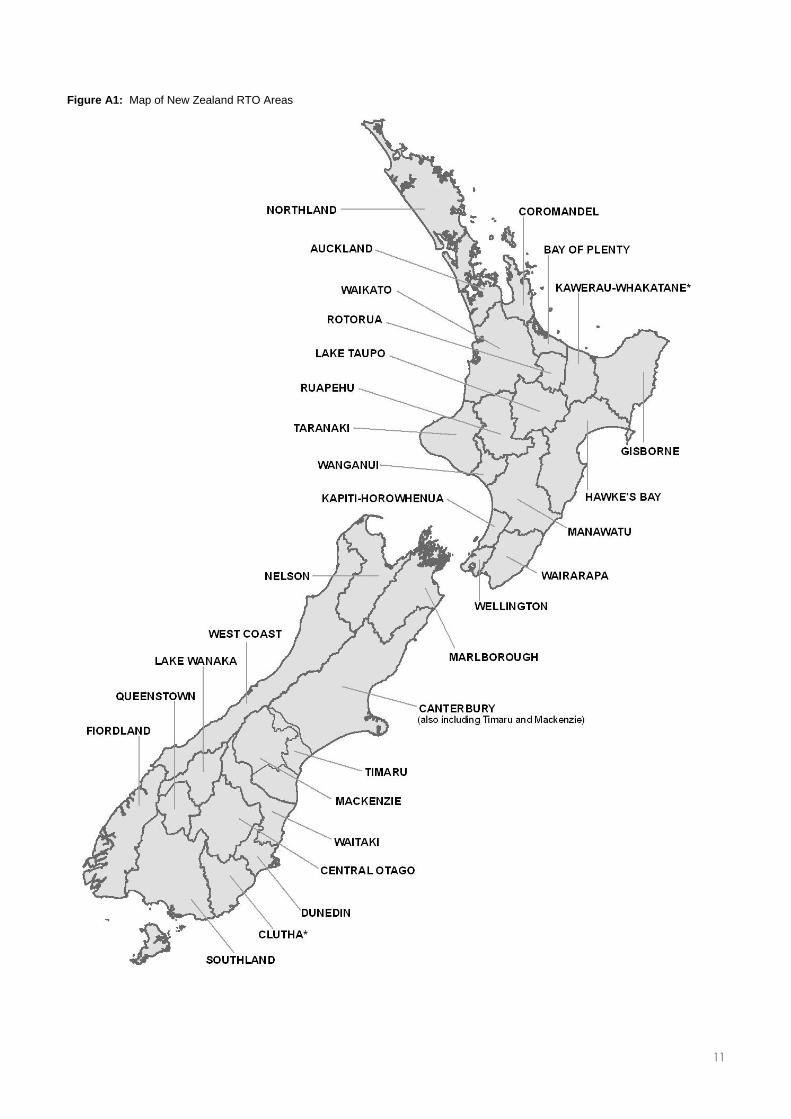
Figure A1: Map of New Zealand RTO Areas

12
Table A2: Sample Sizes Underlying Regional Estimates in 2009
Destination Overnight Day Overnight Day
Auckland RTO 5,086 1,483 1,103 902
Bay of Plenty RTO 512 191 379 337
Canterbury RTO 3,937 1,370 746 690
Central Otago RTO 107 141 112 111
Timaru RTO 171 178 62 78
Coromandel RTO 561 347 319 270
Dunedin RTO 815 256 208 192
Gisborne RTO 164 45 126 123
Fiordland RTO 845 986 43 23
Hawke's Bay RTO 559 158 356 316
Kapiti-Horowhenua RTO 112 112 148 189
Lake Taupo RTO 930 476 314 218
Lake Wanaka RTO 612 359 106 110
Mackenzie RTO 669 659 44 53
Manawatu RTO 279 147 246 301
Marlborough RTO 652 308 167 128
Nelson RTO 1,114 561 217 198
Northland RTO 1,115 886 462 542
Queenstown RTO 1,669 700 151 129
Rotorua RTO 1,459 390 259 263
Ruapehu RTO 185 70 114 109
Southland RTO 368 248 103 162
Taranaki RTO 238 83 198 203
Waikato RTO 866 759 435 542
Wairarapa RTO 105 121 110 110
Waitaki RTO 283 306 69 65
Wanganui RTO 127 45 72 80
Wellington RTO 1,784 195 594 389
West Coast RTO 1,956 1,231 156 158
New Zealand 27,489 12,947 7,522 7,116
International Visits Domestic Visits
The figures in the table above describe the number of International Visitor Survey (IVS) and Domestic Travel Survey
(DTS) respondents that reported visiting each RTO in 2009. The number of visitations is equivalent to the sample size
for a region e.g. the 2009 estimate of international overnight visits to Auckland is based on a sample of 5,086
responses.
The IVS is based on a sample of 5,200 departing international visitors each year, and the DTS is based on 15,000
telephone interviews each year.