nielsen investor...
TRANSCRIPT

DECEMBER 2013
NIELSEN INVESTOR OVERVIEW
Co
pyr
igh
t ©
2013
Th
e N
iels
en C
om
pan
y. C
on
fid
enti
al a
nd
pro
pri
etar
y.
2
FORWARD LOOKING STATEMENTS
The following discussion contains forward-looking statements, including those about Nielsen’s outlook and prospects, in the meaning of the Private Securities Litigation Reform Act of 1995. Forward-looking statements are those which are not historical facts. These and other statements that relate to future results and events are based on Nielsen’s current expectations as of November 12, 2013.
Our actual results in future periods may differ materially from those currently expected because of a number of risks and uncertainties. The risks and uncertainties that we believe are material are outlined in our disclosure filings and materials, which you can find on http://nielsen.com/investors. Please consult these documents for a more complete understanding of these risks and uncertainties. We disclaim any intention or obligation to update or revise any forward-looking statements, whether as a result of new information, future events or otherwise, except as may be required by law.
Our outlook is provided for the purpose of providing information about current expectations for 2013. This information may not be appropriate for other purposes.
Co
pyr
igh
t ©
2013
Th
e N
iels
en C
om
pan
y. C
on
fid
enti
al a
nd
pro
pri
etar
y.
3
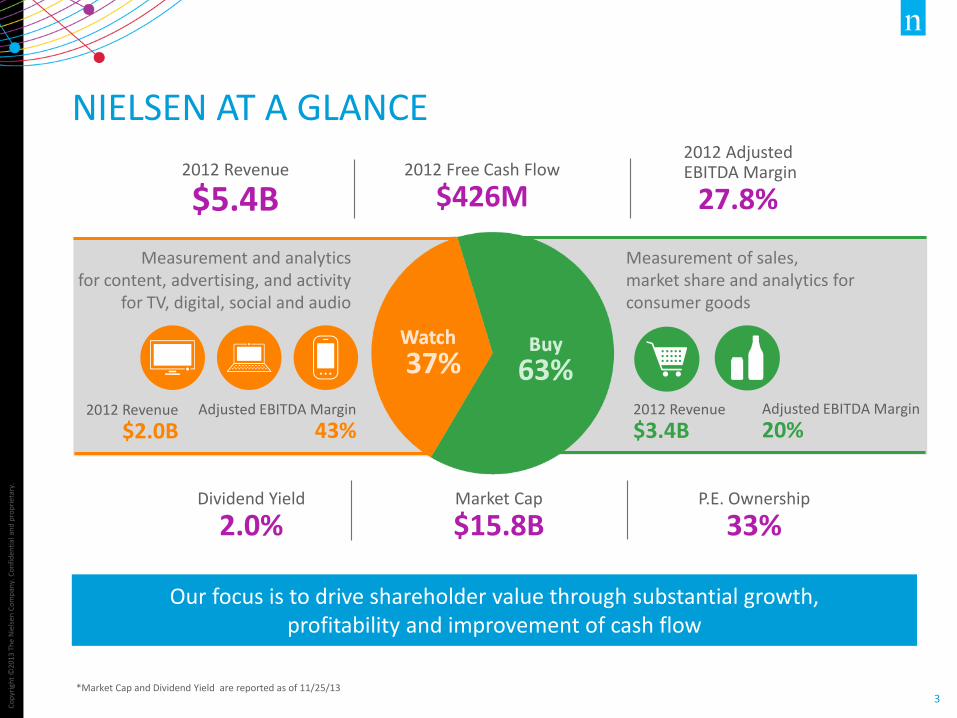
Our focus is to drive shareholder value through substantial growth, profitability and improvement of cash flow
NIELSEN AT A GLANCE
37% 63%
2012 Revenue
$5.4B 2012 Free Cash Flow
$426M
2012 Adjusted EBITDA Margin
27.8%
Dividend Yield
2.0% Market Cap
$15.8B P.E. Ownership
33%
Measurement and analytics for content, advertising, and activity
for TV, digital, social and audio
Measurement of sales, market share and analytics for consumer goods
2012 Revenue
$2.0B Adjusted EBITDA Margin
43% 2012 Revenue
$3.4B Adjusted EBITDA Margin
20%
*Market Cap and Dividend Yield are reported as of 11/25/13
Co
pyr
igh
t ©
2013
Th
e N
iels
en C
om
pan
y. C
on
fid
enti
al a
nd
pro
pri
etar
y.
4
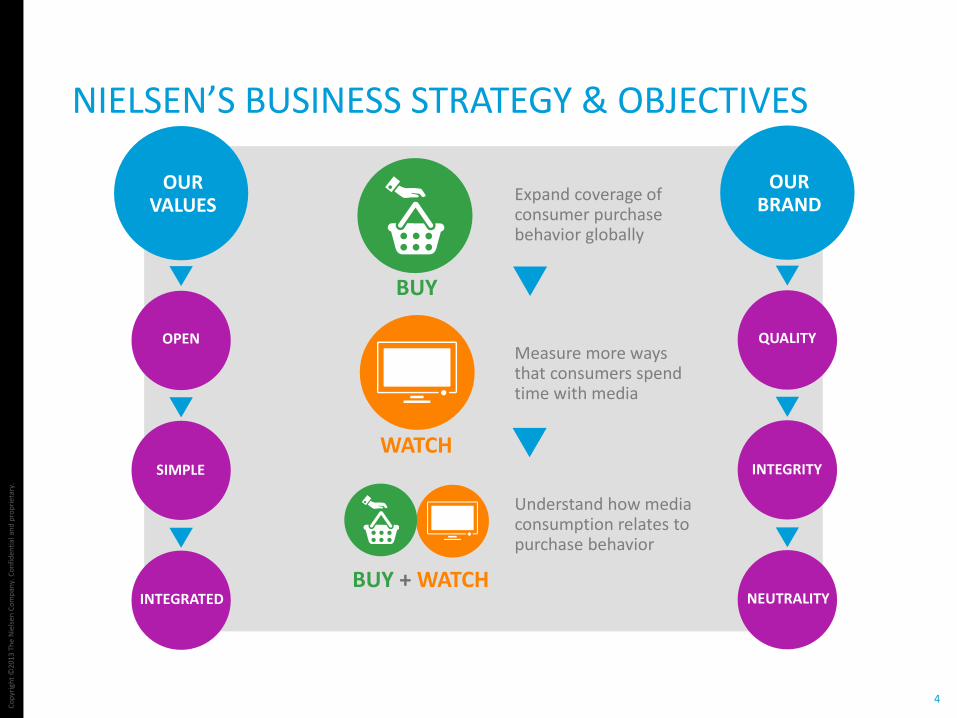
NIELSEN’S BUSINESS STRATEGY & OBJECTIVES
BUY
WATCH
Expand coverage of consumer purchase behavior globally
Measure more ways that consumers spend time with media
BUY + WATCH
Understand how media consumption relates to purchase behavior
OUR VALUES
OPEN
SIMPLE
INTEGRATED
OUR BRAND
QUALITY
INTEGRITY
NEUTRALITY
Co
pyr
igh
t ©
2013
Th
e N
iels
en C
om
pan
y. C
on
fid
enti
al a
nd
pro
pri
etar
y.
5
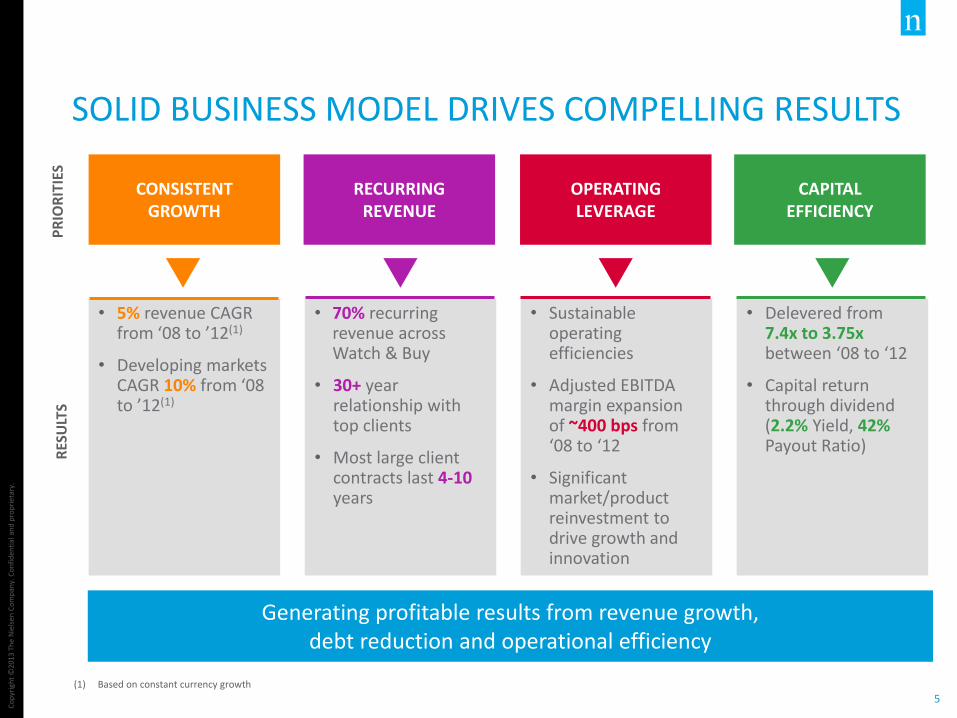
SOLID BUSINESS MODEL DRIVES COMPELLING RESULTS
Our focus is to drive shareholder value through substantial growth, profitability and improvement of cash flow
Generating profitable results from revenue growth, debt reduction and operational efficiency
• 5% revenue CAGR from ‘08 to ’12(1)
• Developing markets CAGR 10% from ‘08 to ’12(1)
• 70% recurring revenue across Watch & Buy
• 30+ year relationship with top clients
• Most large client contracts last 4-10 years
• Sustainable operating efficiencies
• Adjusted EBITDA margin expansion of ~400 bps from ‘08 to ‘12
• Significant market/product reinvestment to drive growth and innovation
• Delevered from 7.4x to 3.75x between ‘08 to ‘12
• Capital return through dividend (2.2% Yield, 42% Payout Ratio)
CONSISTENT GROWTH
RECURRING REVENUE
OPERATING LEVERAGE
CAPITAL EFFICIENCY
PR
IOR
ITIE
S R
ESU
LTS
(1) Based on constant currency growth
Co
pyr
igh
t ©
2013
Th
e N
iels
en C
om
pan
y. C
on
fid
enti
al a
nd
pro
pri
etar
y.
6
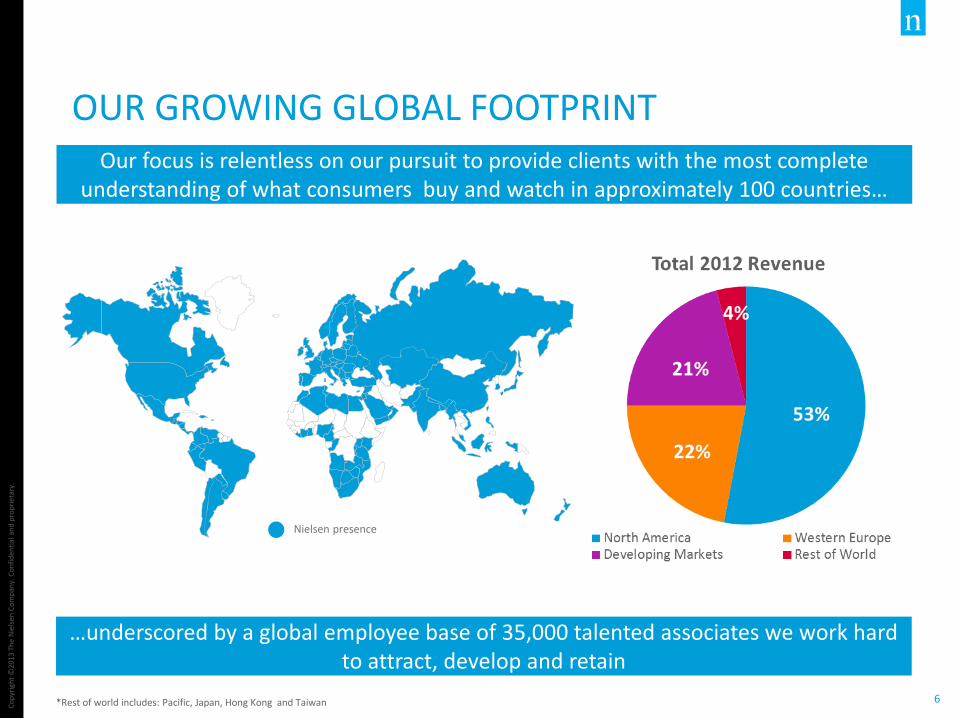
OUR GROWING GLOBAL FOOTPRINT
Nielsen presence
Our focus is relentless on our pursuit to provide clients with the most complete understanding of what consumers buy and watch in approximately 100 countries…
*Rest of world includes: Pacific, Japan, Hong Kong and Taiwan
…underscored by a global employee base of 35,000 talented associates we work hard to attract, develop and retain
Co
pyr
igh
t ©
2013
Th
e N
iels
en C
om
pan
y. C
on
fid
enti
al a
nd
pro
pri
etar
y.
7
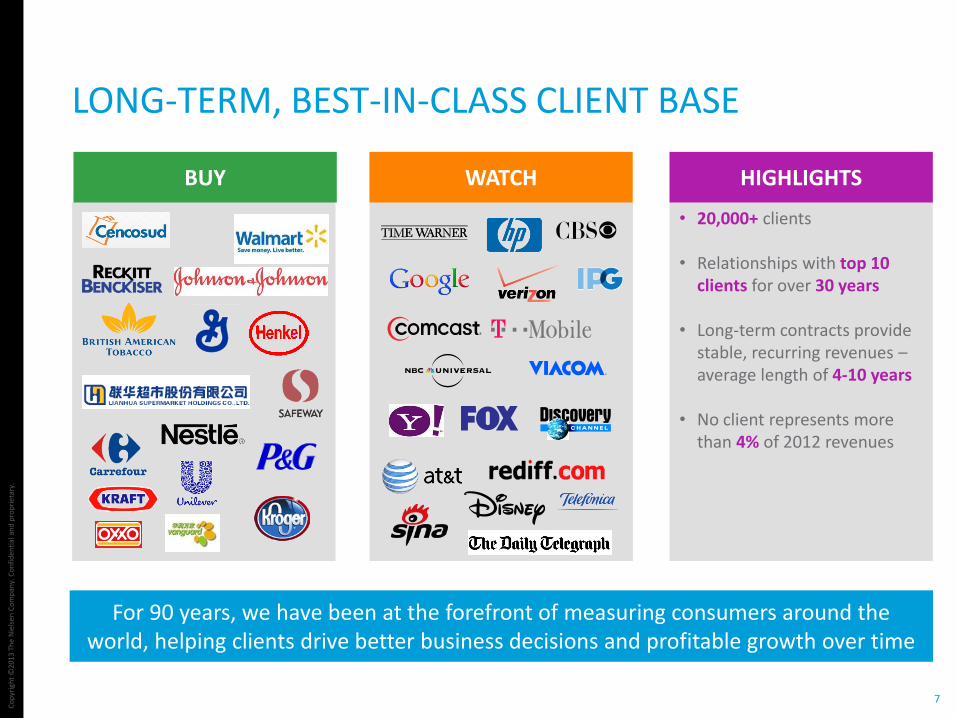
LONG-TERM, BEST-IN-CLASS CLIENT BASE
For 90 years, we have been at the forefront of measuring consumers around the world, helping clients drive better business decisions and profitable growth over time
• 20,000+ clients
• Relationships with top 10 clients for over 30 years
• Long-term contracts provide stable, recurring revenues – average length of 4-10 years
• No client represents more than 4% of 2012 revenues
BUY WATCH HIGHLIGHTS
Co
pyr
igh
t ©
2013
Th
e N
iels
en C
om
pan
y. C
on
fid
enti
al a
nd
pro
pri
etar
y.
8
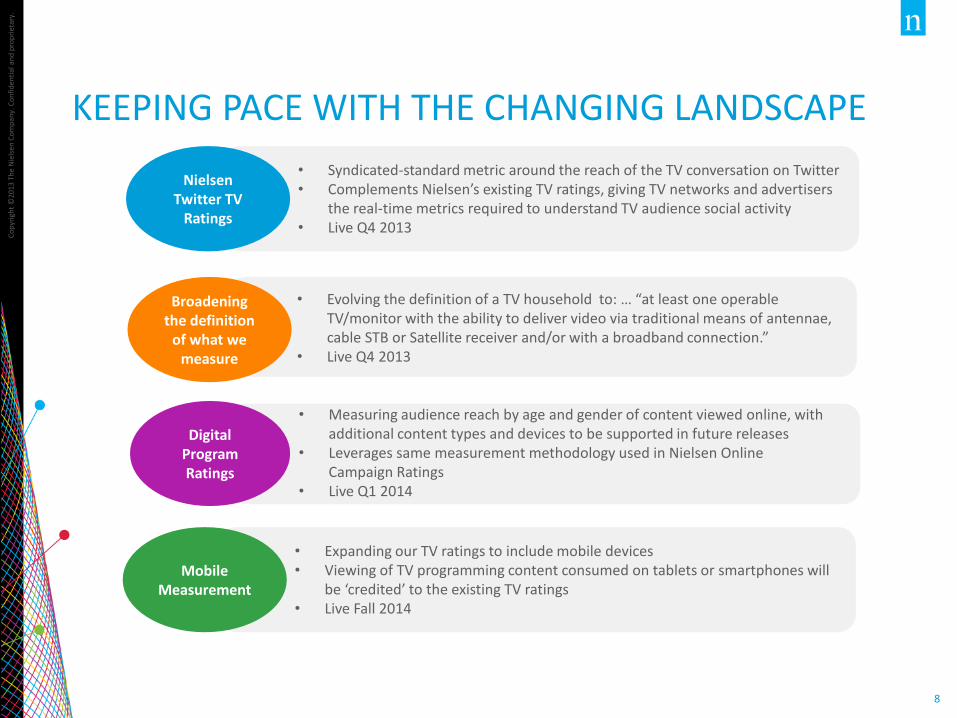
KEEPING PACE WITH THE CHANGING LANDSCAPE
Nielsen Twitter TV
Ratings
• Evolving the definition of a TV household to: … “at least one operable TV/monitor with the ability to deliver video via traditional means of antennae, cable STB or Satellite receiver and/or with a broadband connection.”
• Live Q4 2013
Broadening the definition
of what we measure
• Measuring audience reach by age and gender of content viewed online, with additional content types and devices to be supported in future releases
• Leverages same measurement methodology used in Nielsen Online Campaign Ratings
• Live Q1 2014
Digital Program Ratings
• Syndicated-standard metric around the reach of the TV conversation on Twitter • Complements Nielsen’s existing TV ratings, giving TV networks and advertisers
the real-time metrics required to understand TV audience social activity • Live Q4 2013
Mobile Measurement
• Expanding our TV ratings to include mobile devices • Viewing of TV programming content consumed on tablets or smartphones will
be ‘credited’ to the existing TV ratings • Live Fall 2014
Co
pyr
igh
t ©
2013
Th
e N
iels
en C
om
pan
y. C
on
fid
enti
al a
nd
pro
pri
etar
y.
9
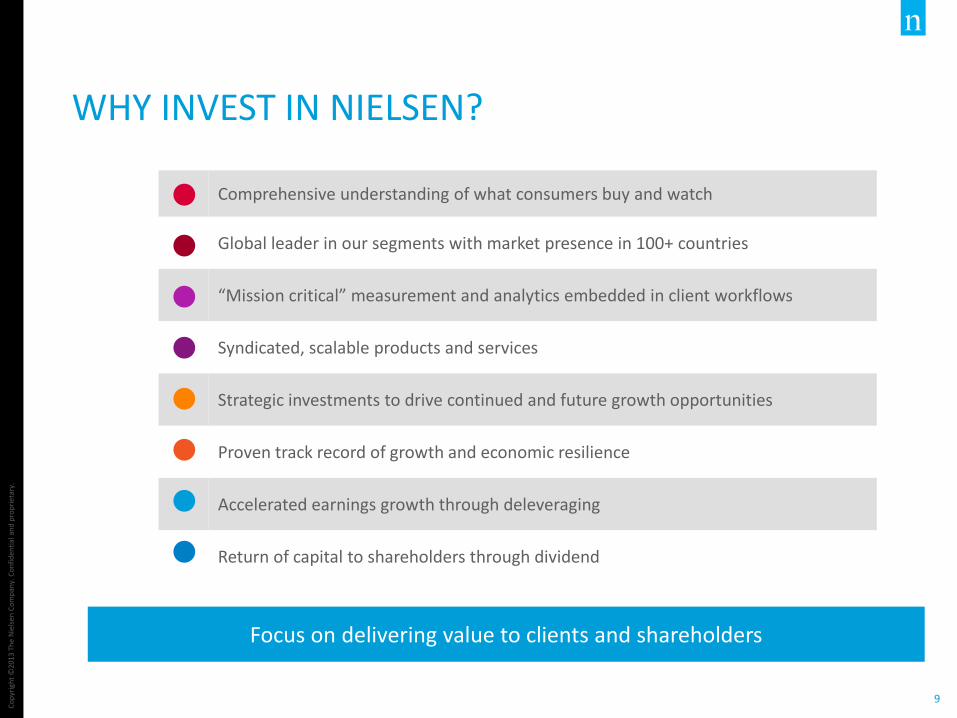
WHY INVEST IN NIELSEN?
Focus on delivering value to clients and shareholders
Comprehensive understanding of what consumers buy and watch
Global leader in our segments with market presence in 100+ countries
“Mission critical” measurement and analytics embedded in client workflows
Syndicated, scalable products and services
Strategic investments to drive continued and future growth opportunities
Proven track record of growth and economic resilience
Accelerated earnings growth through deleveraging
Return of capital to shareholders through dividend
Co
pyr
igh
t ©
2013
Th
e N
iels
en C
om
pan
y. C
on
fid
enti
al a
nd
pro
pri
etar
y.
10
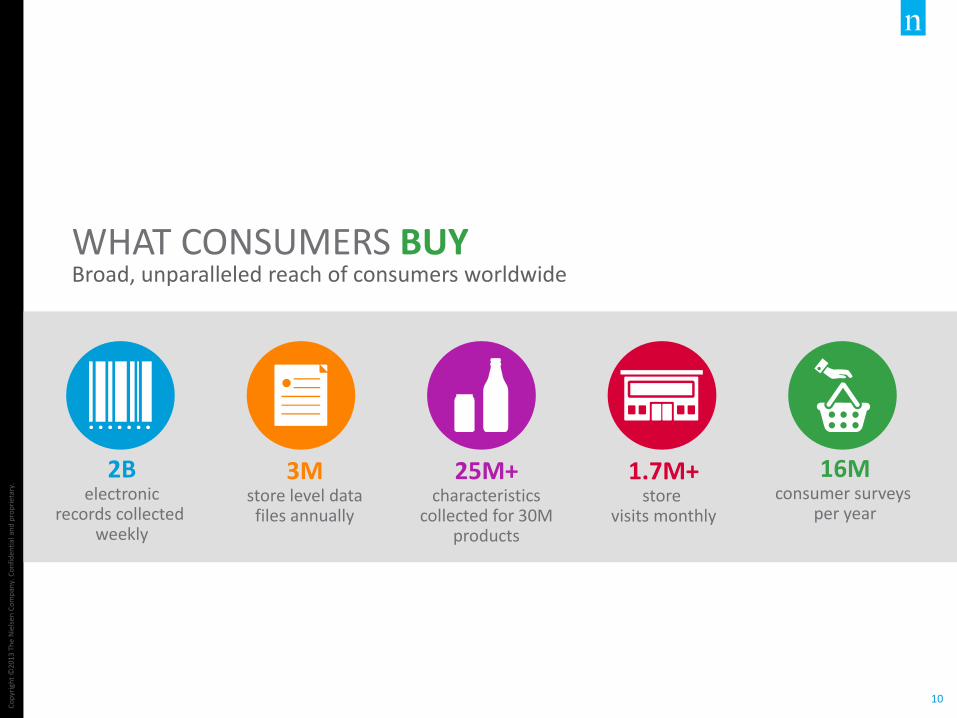
WHAT CONSUMERS BUY Broad, unparalleled reach of consumers worldwide
2B electronic
records collected weekly
1.7M+ store
visits monthly
25M+ characteristics
collected for 30M products
3M store level data files annually
16M consumer surveys
per year
Co
pyr
igh
t ©
2013
Th
e N
iels
en C
om
pan
y. C
on
fid
enti
al a
nd
pro
pri
etar
y.
11
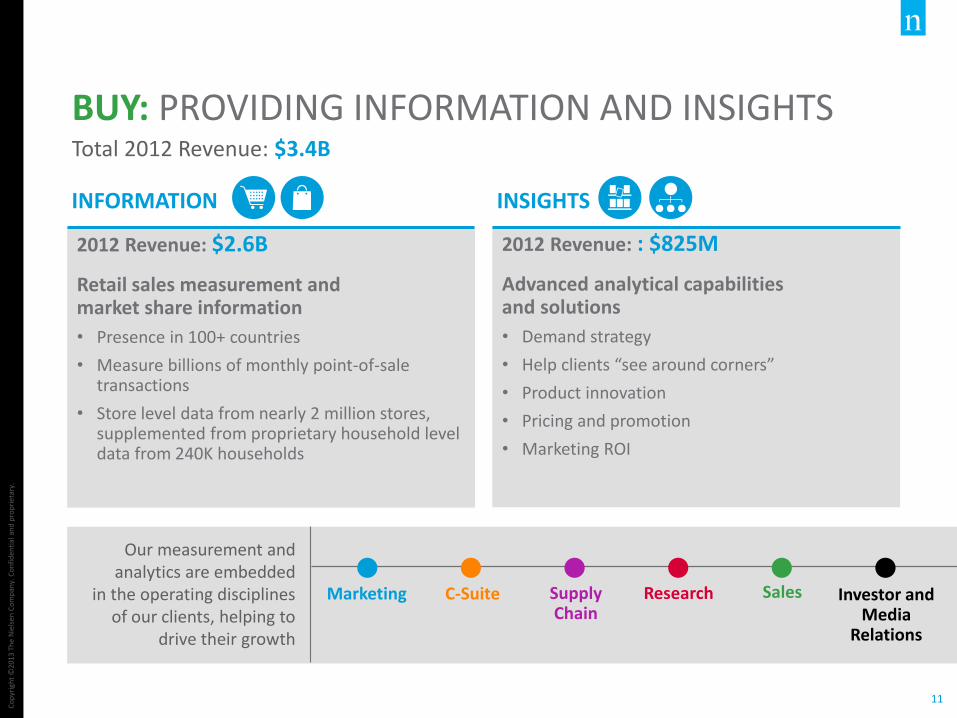
BUY: PROVIDING INFORMATION AND INSIGHTS Total 2012 Revenue: $3.4B
Our measurement and analytics are embedded
in the operating disciplines of our clients, helping to
drive their growth
Marketing C-Suite Supply Chain
Research Sales Investor and Media
Relations
2012 Revenue: $2.6B
Retail sales measurement and market share information
• Presence in 100+ countries
• Measure billions of monthly point-of-sale transactions
• Store level data from nearly 2 million stores, supplemented from proprietary household level data from 240K households
2012 Revenue: : $825M
Advanced analytical capabilities and solutions
• Demand strategy
• Help clients “see around corners”
• Product innovation
• Pricing and promotion
• Marketing ROI
INFORMATION INSIGHTS
Co
pyr
igh
t ©
2013
Th
e N
iels
en C
om
pan
y. C
on
fid
enti
al a
nd
pro
pri
etar
y.
12
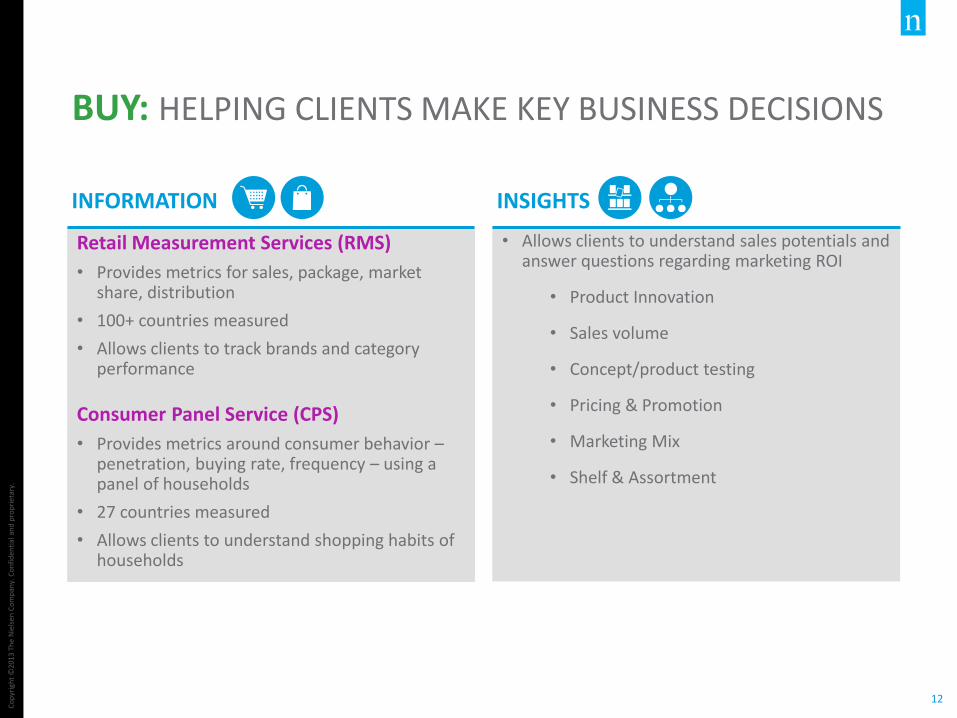
BUY: HELPING CLIENTS MAKE KEY BUSINESS DECISIONS
Retail Measurement Services (RMS)
• Provides metrics for sales, package, market share, distribution
• 100+ countries measured
• Allows clients to track brands and category performance
Consumer Panel Service (CPS)
• Provides metrics around consumer behavior – penetration, buying rate, frequency – using a panel of households
• 27 countries measured
• Allows clients to understand shopping habits of households
• Allows clients to understand sales potentials and answer questions regarding marketing ROI
• Product Innovation
• Sales volume
• Concept/product testing
• Pricing & Promotion
• Marketing Mix
• Shelf & Assortment
INFORMATION INSIGHTS
Co
pyr
igh
t ©
2013
Th
e N
iels
en C
om
pan
y. C
on
fid
enti
al a
nd
pro
pri
etar
y.
13
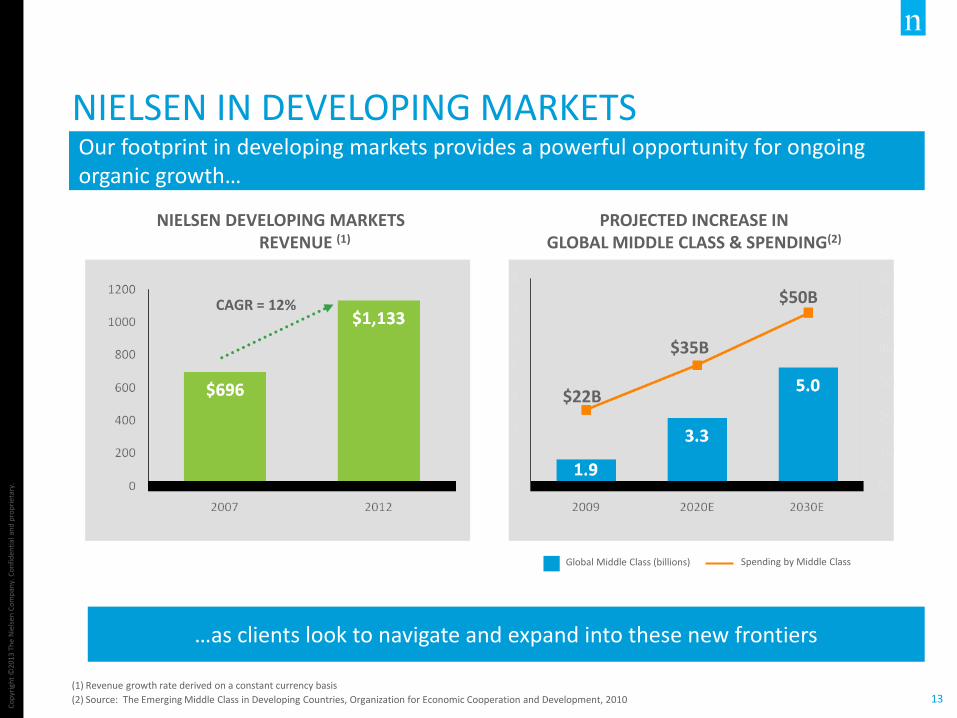
NIELSEN IN DEVELOPING MARKETS
(1) Revenue growth rate derived on a constant currency basis
(2) Source: The Emerging Middle Class in Developing Countries, Organization for Economic Cooperation and Development, 2010
Global Middle Class (billions) Spending by Middle Class
$22B
$35B
$50B
PROJECTED INCREASE IN GLOBAL MIDDLE CLASS & SPENDING(2)
NIELSEN DEVELOPING MARKETS REVENUE (1)
CAGR = 12%
…as clients look to navigate and expand into these new frontiers
Our footprint in developing markets provides a powerful opportunity for ongoing organic growth…
Co
pyr
igh
t ©
2013
Th
e N
iels
en C
om
pan
y. C
on
fid
enti
al a
nd
pro
pri
etar
y.
14
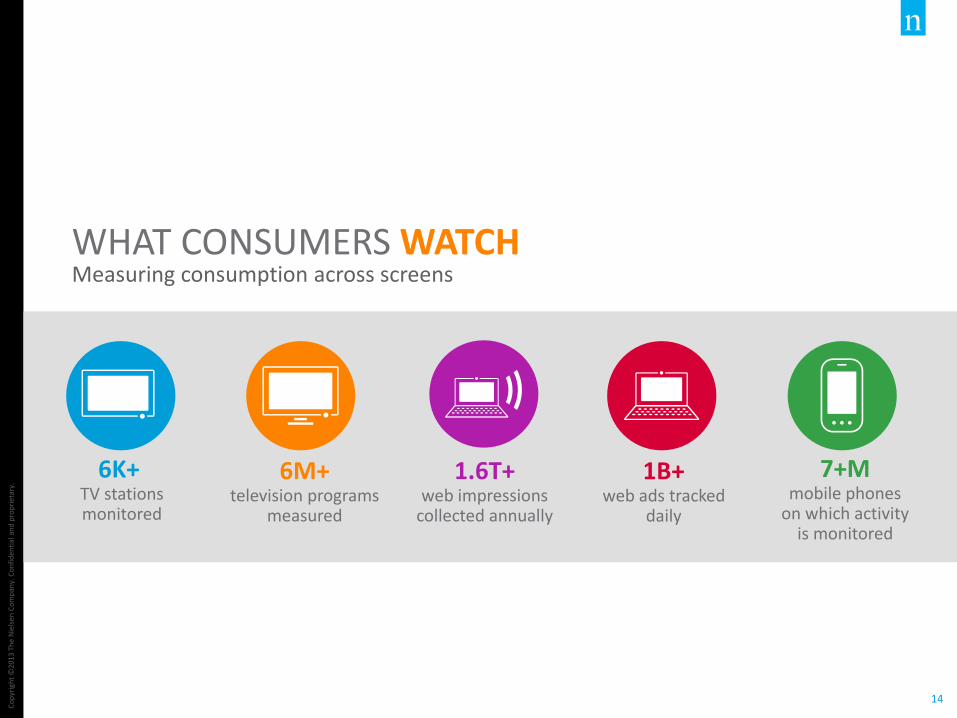
WHAT CONSUMERS WATCH Measuring consumption across screens
6K+ TV stations monitored
1B+ web ads tracked
daily
1.6T+ web impressions
collected annually
6M+ television programs
measured
7+M mobile phones
on which activity is monitored
Co
pyr
igh
t ©
2013
Th
e N
iels
en C
om
pan
y. C
on
fid
enti
al a
nd
pro
pri
etar
y.
15
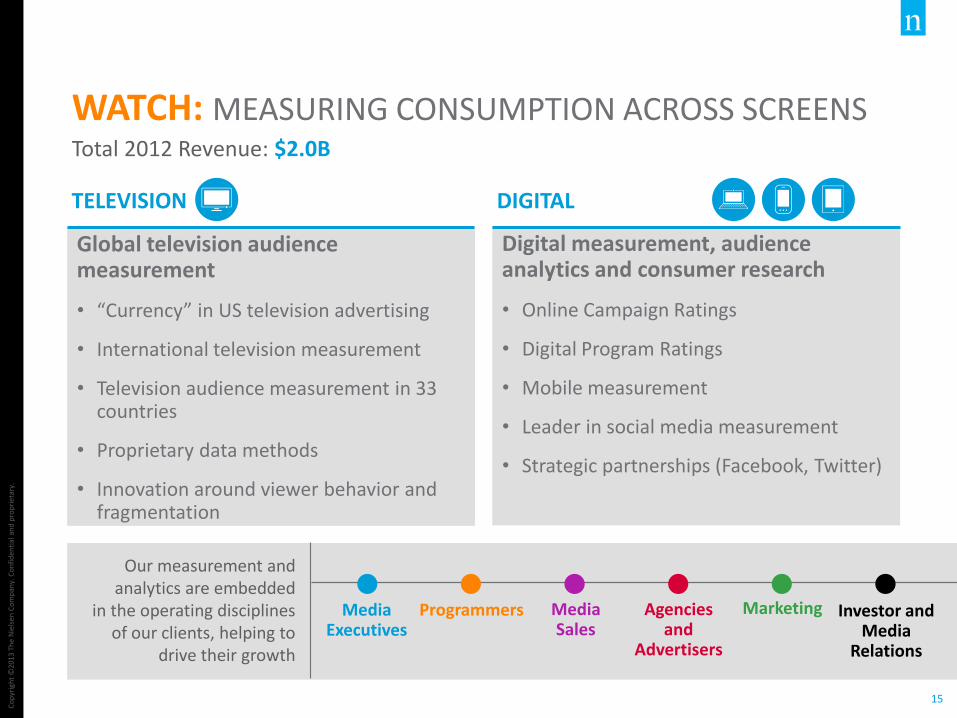
WATCH: MEASURING CONSUMPTION ACROSS SCREENS Total 2012 Revenue: $2.0B
Our measurement and analytics are embedded
in the operating disciplines of our clients, helping to
drive their growth
Media Executives
Programmers Media Sales
Agencies and
Advertisers
Marketing Investor and Media
Relations
Global television audience measurement
• “Currency” in US television advertising
• International television measurement
• Television audience measurement in 33 countries
• Proprietary data methods
• Innovation around viewer behavior and fragmentation
Digital measurement, audience analytics and consumer research
• Online Campaign Ratings
• Digital Program Ratings
• Mobile measurement
• Leader in social media measurement
• Strategic partnerships (Facebook, Twitter)
TELEVISION DIGITAL
Co
pyr
igh
t ©
2013
Th
e N
iels
en C
om
pan
y. C
on
fid
enti
al a
nd
pro
pri
etar
y.
16
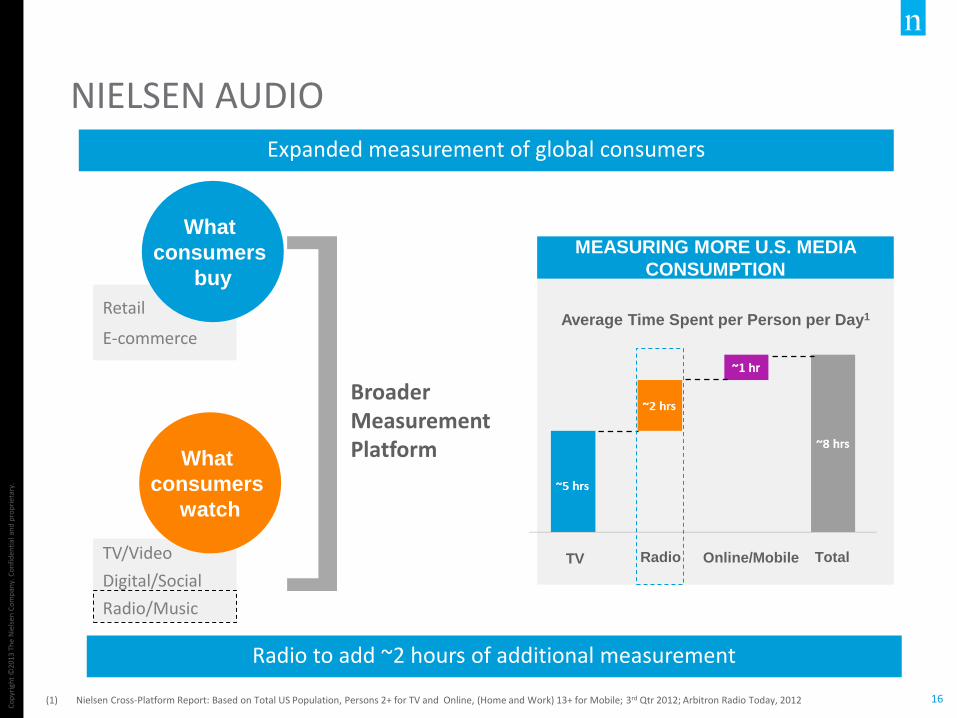
Radio to add ~2 hours of additional measurement
NIELSEN AUDIO
(1) Nielsen Cross-Platform Report: Based on Total US Population, Persons 2+ for TV and Online, (Home and Work) 13+ for Mobile; 3rd Qtr 2012; Arbitron Radio Today, 2012
MEASURING MORE U.S. MEDIA
CONSUMPTION
TV Radio Total
Average Time Spent per Person per Day1
Online/Mobile
Broader Measurement Platform
TV/Video
Digital/Social
Radio/Music
What
consumers
watch
Retail
E-commerce
What
consumers
buy
Expanded measurement of global consumers
Co
pyr
igh
t ©
2013
Th
e N
iels
en C
om
pan
y. C
on
fid
enti
al a
nd
pro
pri
etar
y.
17
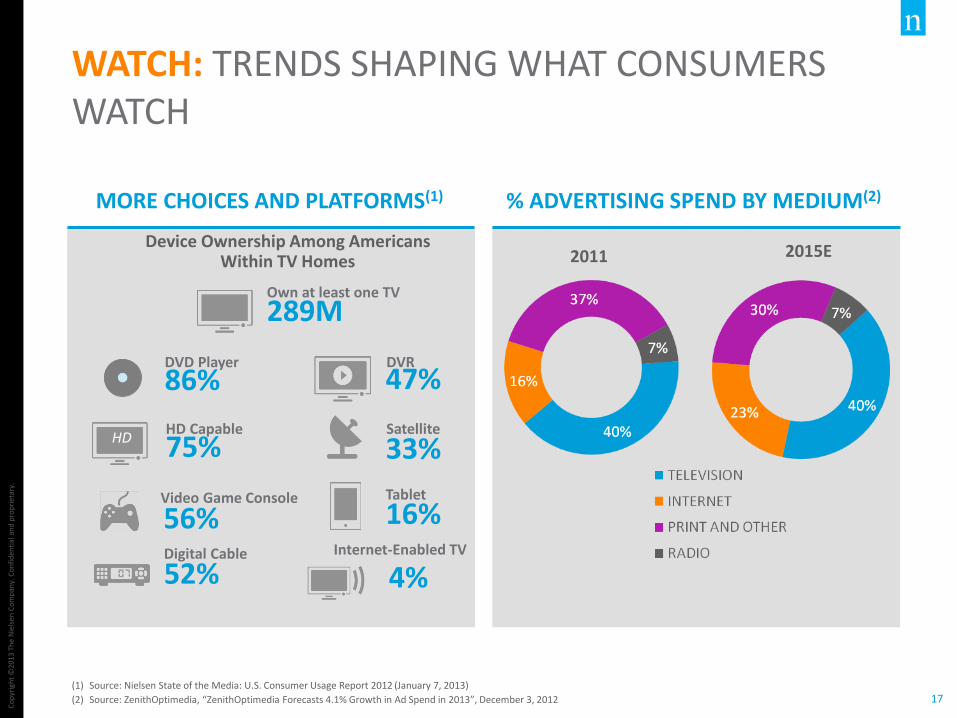
WATCH: TRENDS SHAPING WHAT CONSUMERS WATCH
MORE CHOICES AND PLATFORMS(1) % ADVERTISING SPEND BY MEDIUM(2)
Device Ownership Among Americans
Within TV Homes
86% DVD Player
75% HD Capable
56% Video Game Console
52% Digital Cable
47%
33% Satellite
4% Internet-Enabled TV
HD
289M Own at least one TV
Tablet
16%
DVR
2011 2015E
(1) Source: Nielsen State of the Media: U.S. Consumer Usage Report 2012 (January 7, 2013)
(2) Source: ZenithOptimedia, “ZenithOptimedia Forecasts 4.1% Growth in Ad Spend in 2013”, December 3, 2012
Co
pyr
igh
t ©
2013
Th
e N
iels
en C
om
pan
y. C
on
fid
enti
al a
nd
pro
pri
etar
y.
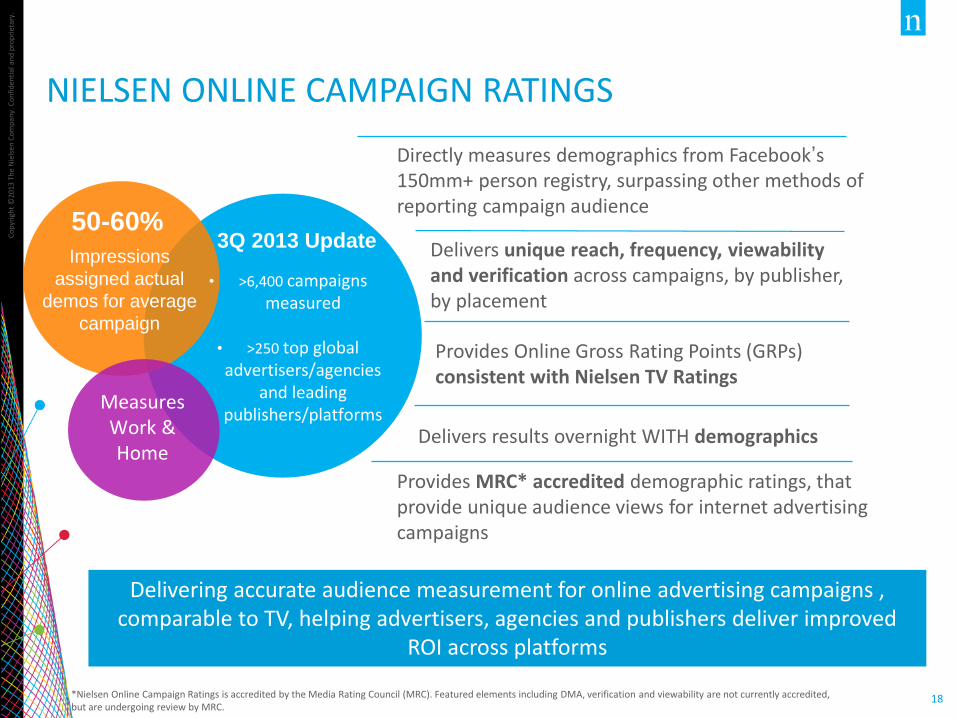
18
Directly measures demographics from Facebook’s 150mm+ person registry, surpassing other methods of reporting campaign audience
Provides Online Gross Rating Points (GRPs) consistent with Nielsen TV Ratings
Provides MRC* accredited demographic ratings, that provide unique audience views for internet advertising campaigns
Delivers unique reach, frequency, viewability and verification across campaigns, by publisher, by placement
Delivers results overnight WITH demographics
NIELSEN ONLINE CAMPAIGN RATINGS
3Q 2013 Update
Measures Work & Home
*Nielsen Online Campaign Ratings is accredited by the Media Rating Council (MRC). Featured elements including DMA, verification and viewability are not currently accredited, but are undergoing review by MRC.
50-60%
Impressions
assigned actual
demos for average
campaign
• >6,400 campaigns measured
• >250 top global advertisers/agencies
and leading publishers/platforms
Delivering accurate audience measurement for online advertising campaigns , comparable to TV, helping advertisers, agencies and publishers deliver improved
ROI across platforms
Co
pyr
igh
t ©
2013
Th
e N
iels
en C
om
pan
y. C
on
fid
enti
al a
nd
pro
pri
etar
y.
19
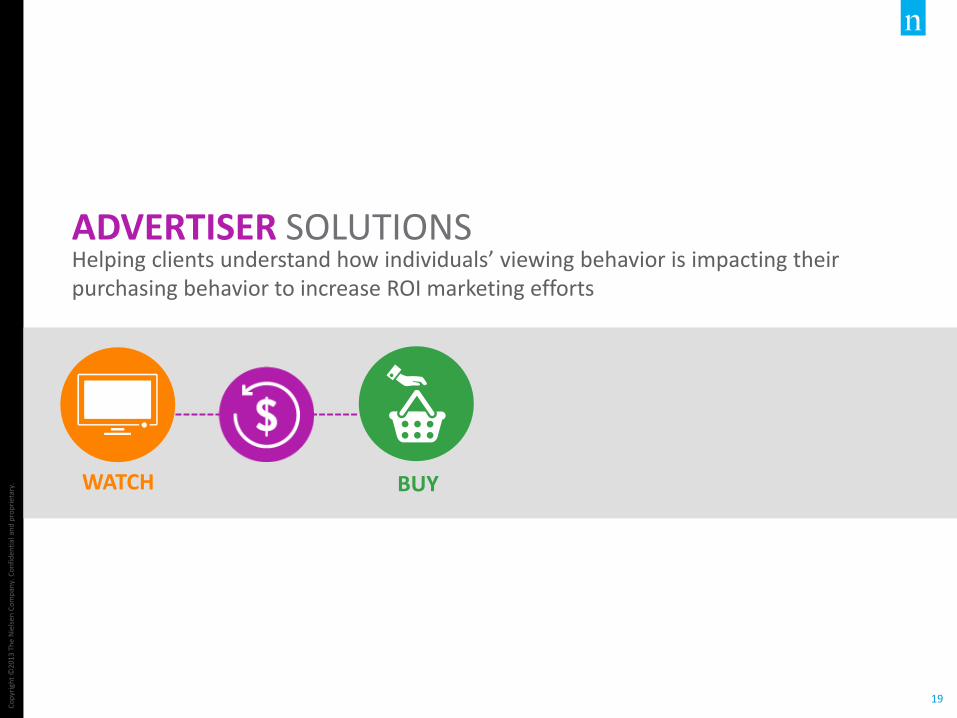
ADVERTISER SOLUTIONS Helping clients understand how individuals’ viewing behavior is impacting their purchasing behavior to increase ROI marketing efforts
BUY WATCH
Co
pyr
igh
t ©
2013
Th
e N
iels
en C
om
pan
y. C
on
fid
enti
al a
nd
pro
pri
etar
y.
20
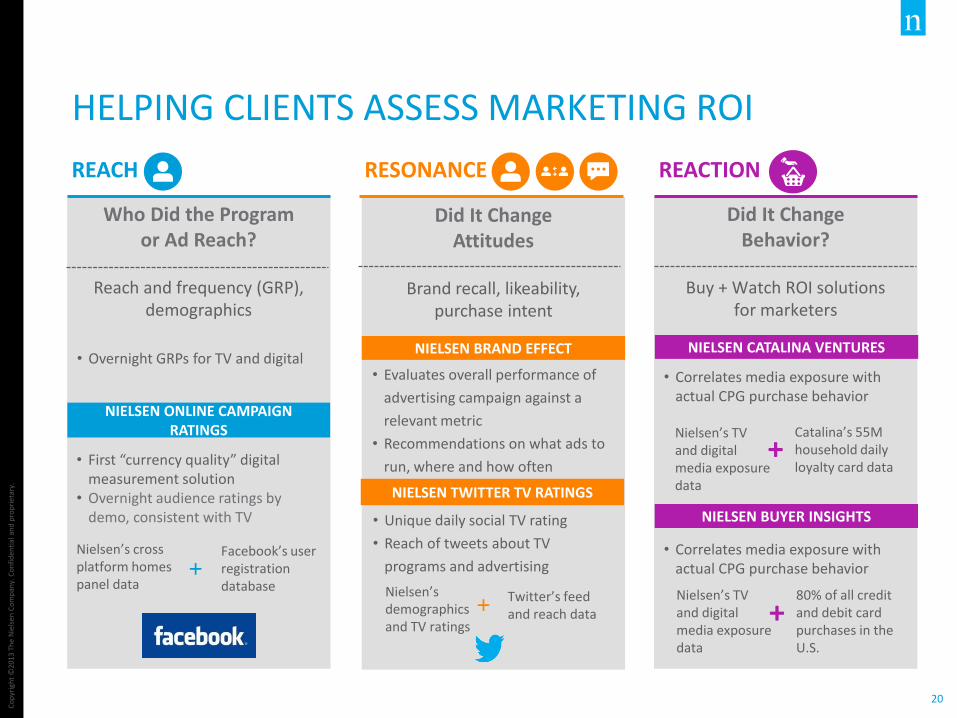
HELPING CLIENTS ASSESS MARKETING ROI
Who Did the Program or Ad Reach?
Reach and frequency (GRP), demographics
• Overnight GRPs for TV and digital
REACH
Did It Change Attitudes
Brand recall, likeability, purchase intent
RESONANCE
Did It Change Behavior?
Buy + Watch ROI solutions for marketers
• Correlates media exposure with
actual CPG purchase behavior
• Correlates media exposure with actual CPG purchase behavior
REACTION
NIELSEN ONLINE CAMPAIGN RATINGS
NIELSEN BRAND EFFECT NIELSEN CATALINA VENTURES
Nielsen’s TV and digital media exposure data
Catalina’s 55M household daily loyalty card data
+
NIELSEN BUYER INSIGHTS
Nielsen’s TV and digital media exposure data
80% of all credit and debit card purchases in the U.S.
+ Nielsen’s demographics and TV ratings
Twitter’s feed and reach data +
NIELSEN TWITTER TV RATINGS
• Evaluates overall performance of
advertising campaign against a
relevant metric
• Recommendations on what ads to
run, where and how often
• Unique daily social TV rating
• Reach of tweets about TV
programs and advertising
• First “currency quality” digital measurement solution
• Overnight audience ratings by demo, consistent with TV
Nielsen’s cross
platform homes panel data
Facebook’s user registration database
+
FINANCIALS
Co
pyr
igh
t ©
2013
Th
e N
iels
en C
om
pan
y. C
on
fid
enti
al a
nd
pro
pri
etar
y.
22
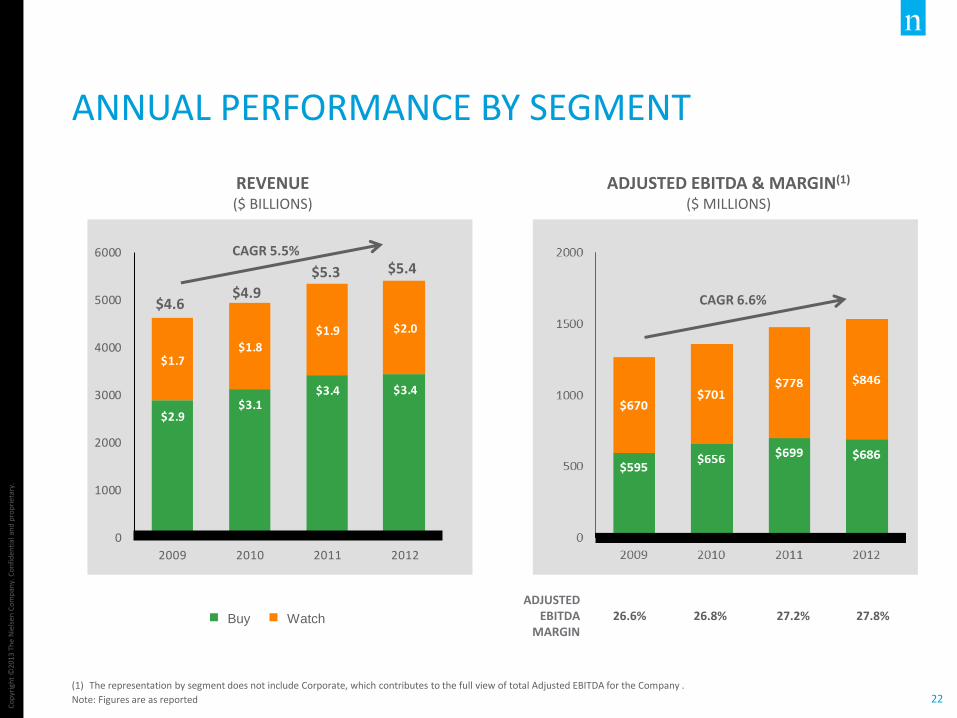
ANNUAL PERFORMANCE BY SEGMENT
(1) The representation by segment does not include Corporate, which contributes to the full view of total Adjusted EBITDA for the Company .
Note: Figures are as reported
REVENUE ($ BILLIONS)
ADJUSTED EBITDA & MARGIN(1) ($ MILLIONS)
$2.9$3.1
$3.4 $3.4
$1.7$1.8
$1.9 $2.0
0
1000
2000
3000
4000
5000
6000
2009 2010 2011 2012
Buy Watch
$4.6 $4.9
$5.3
ADJUSTED EBITDA
MARGIN 26.6% 26.8% 27.2% 27.8%
$5.4 CAGR 5.5%
CAGR 6.6%
Co
pyr
igh
t ©
2013
Th
e N
iels
en C
om
pan
y. C
on
fid
enti
al a
nd
pro
pri
etar
y.
23
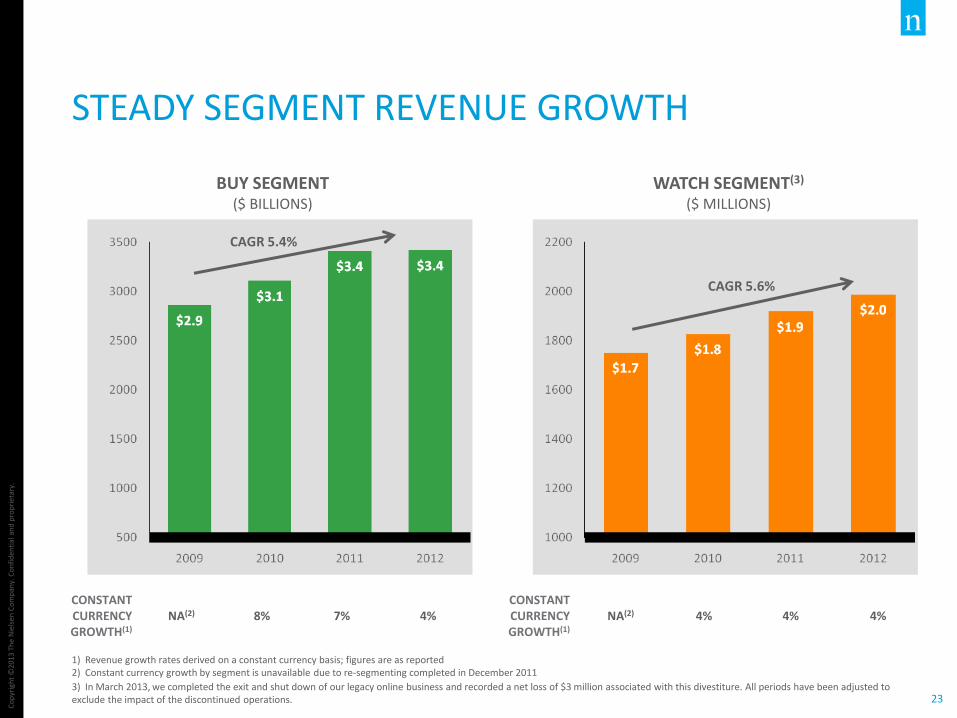
STEADY SEGMENT REVENUE GROWTH
1) Revenue growth rates derived on a constant currency basis; figures are as reported 2) Constant currency growth by segment is unavailable due to re-segmenting completed in December 2011
3) In March 2013, we completed the exit and shut down of our legacy online business and recorded a net loss of $3 million associated with this divestiture. All periods have been adjusted to exclude the impact of the discontinued operations.
BUY SEGMENT ($ BILLIONS)
WATCH SEGMENT(3) ($ MILLIONS)
CONSTANT CURRENCY GROWTH(1)
NA(2) 8% 7% 4% CONSTANT CURRENCY GROWTH(1)
NA(2) 4% 4% 4%
CAGR 5.4%
CAGR 5.6%
Co
pyr
igh
t ©
2013
Th
e N
iels
en C
om
pan
y. C
on
fid
enti
al a
nd
pro
pri
etar
y.
24
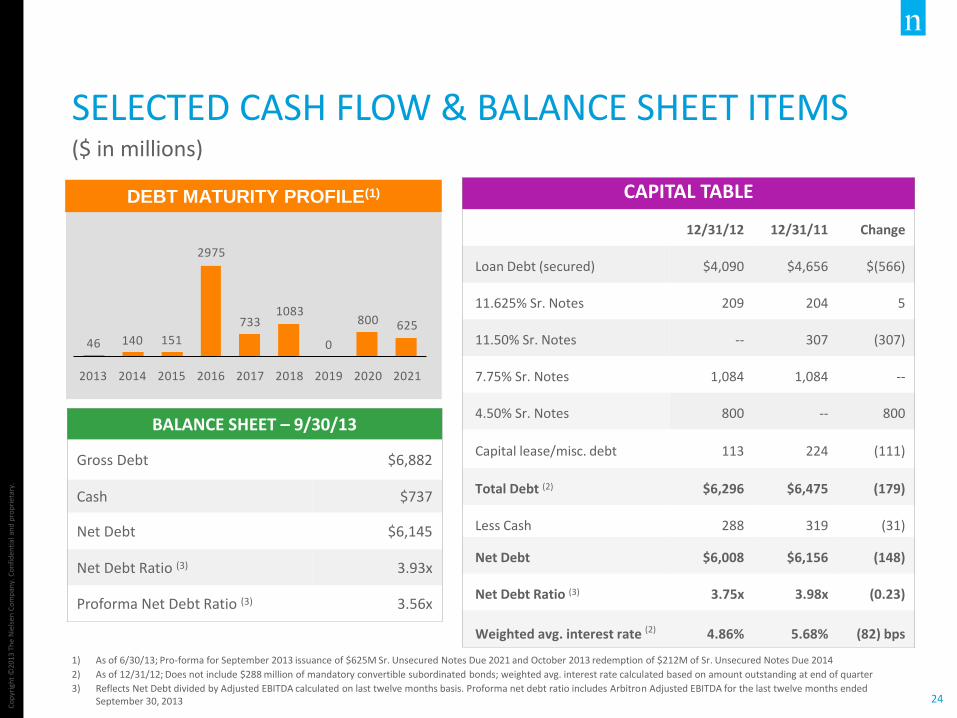
BALANCE SHEET – 9/30/13
Gross Debt $6,882
Cash $737
Net Debt $6,145
Net Debt Ratio (3) 3.93x
Proforma Net Debt Ratio (3) 3.56x
SELECTED CASH FLOW & BALANCE SHEET ITEMS ($ in millions)
1) As of 6/30/13; Pro-forma for September 2013 issuance of $625M Sr. Unsecured Notes Due 2021 and October 2013 redemption of $212M of Sr. Unsecured Notes Due 2014
2) As of 12/31/12; Does not include $288 million of mandatory convertible subordinated bonds; weighted avg. interest rate calculated based on amount outstanding at end of quarter
3) Reflects Net Debt divided by Adjusted EBITDA calculated on last twelve months basis. Proforma net debt ratio includes Arbitron Adjusted EBITDA for the last twelve months ended September 30, 2013
CAPITAL TABLE
12/31/12 12/31/11 Change
Loan Debt (secured) $4,090 $4,656 $(566)
11.625% Sr. Notes 209 204 5
11.50% Sr. Notes -- 307 (307)
7.75% Sr. Notes 1,084 1,084 --
4.50% Sr. Notes 800 -- 800
Capital lease/misc. debt 113 224 (111)
Total Debt (2) $6,296 $6,475 (179)
Less Cash 288 319 (31)
Net Debt $6,008 $6,156 (148)
Net Debt Ratio (3) 3.75x 3.98x (0.23)
Weighted avg. interest rate (2) 4.86% 5.68% (82) bps
DEBT MATURITY PROFILE(1)
46 140 151
2975
7331083
0
800 625
2013 2014 2015 2016 2017 2018 2019 2020 2021
Co
pyr
igh
t ©
2013
Th
e N
iels
en C
om
pan
y. C
on
fid
enti
al a
nd
pro
pri
etar
y.
25
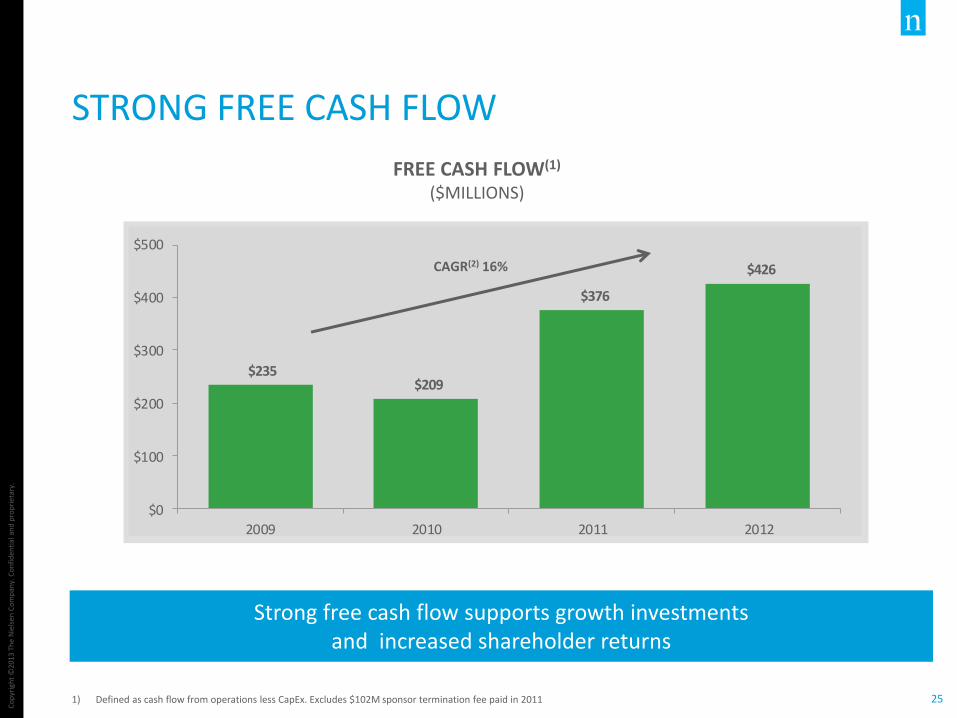
STRONG FREE CASH FLOW
Strong free cash flow supports growth investments and increased shareholder returns
FREE CASH FLOW(1)
($MILLIONS)
$235 $209
$376
$426
$0
$100
$200
$300
$400
$500
2009 2010 2011 2012
1) Defined as cash flow from operations less CapEx. Excludes $102M sponsor termination fee paid in 2011
CAGR(2) 16%
Co
pyr
igh
t ©
2013
Th
e N
iels
en C
om
pan
y. C
on
fid
enti
al a
nd
pro
pri
etar
y.
26
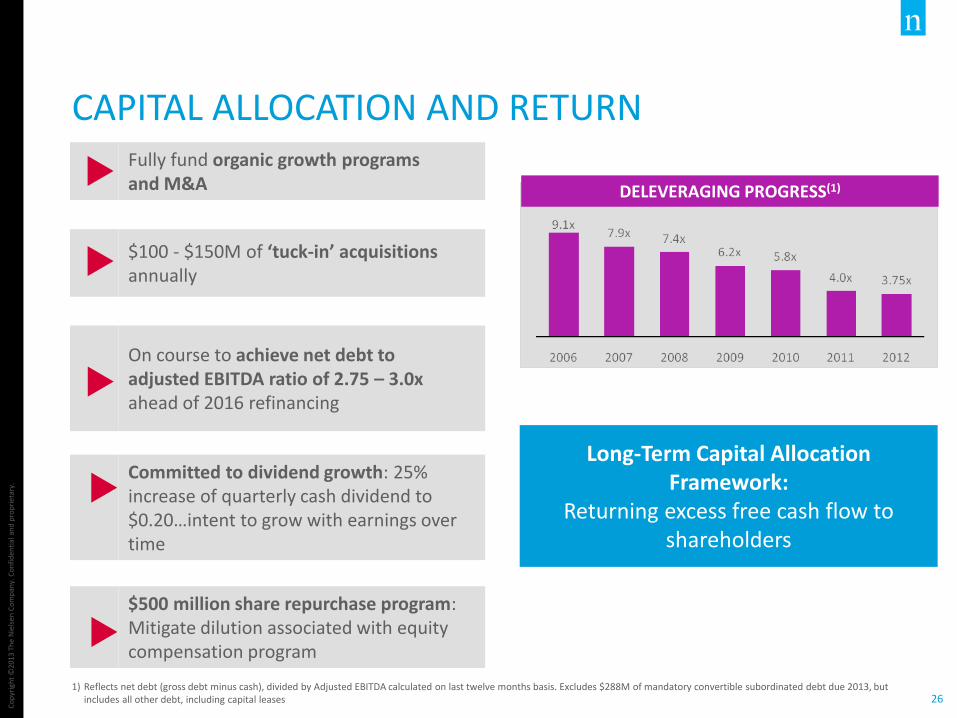
CAPITAL ALLOCATION AND RETURN
Long-Term Capital Allocation Framework:
Returning excess free cash flow to shareholders
DELEVERAGING PROGRESS(1)
Fully fund organic growth programs and M&A
$100 - $150M of ‘tuck-in’ acquisitions annually
On course to achieve net debt to adjusted EBITDA ratio of 2.75 – 3.0x ahead of 2016 refinancing
Committed to dividend growth: 25% increase of quarterly cash dividend to $0.20…intent to grow with earnings over time
$500 million share repurchase program: Mitigate dilution associated with equity compensation program
1) Reflects net debt (gross debt minus cash), divided by Adjusted EBITDA calculated on last twelve months basis. Excludes $288M of mandatory convertible subordinated debt due 2013, but includes all other debt, including capital leases
Co
pyr
igh
t ©
2013
Th
e N
iels
en C
om
pan
y. C
on
fid
enti
al a
nd
pro
pri
etar
y.
27
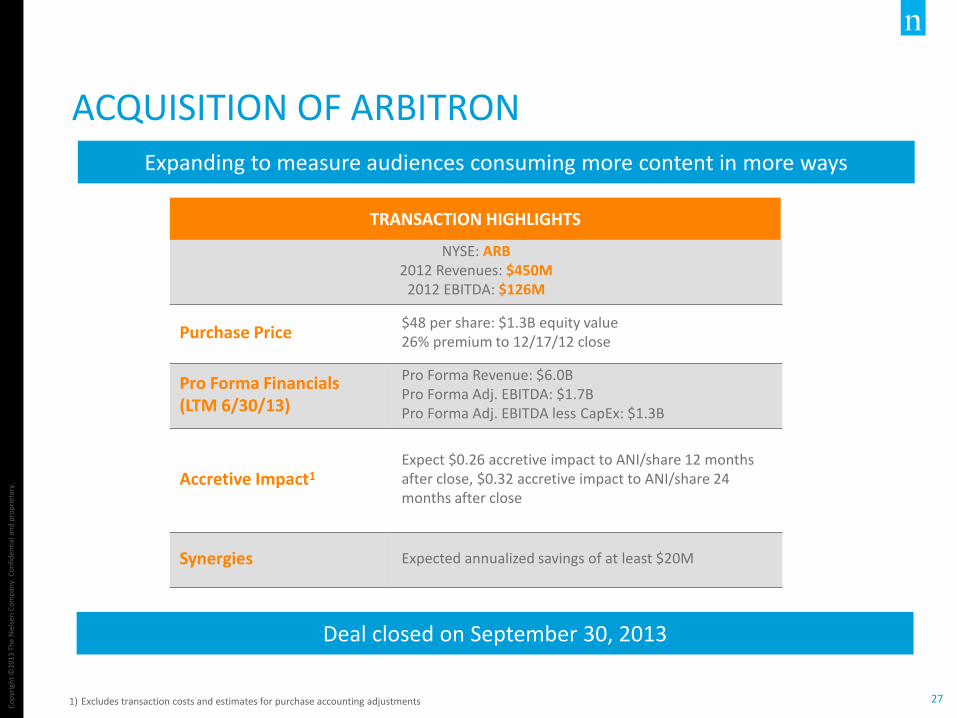
ACQUISITION OF ARBITRON
1) Excludes transaction costs and estimates for purchase accounting adjustments
Expanding to measure audiences consuming more content in more ways
NYSE: ARB 2012 Revenues: $450M
2012 EBITDA: $126M
Purchase Price $48 per share: $1.3B equity value 26% premium to 12/17/12 close
Pro Forma Financials (LTM 6/30/13)
Pro Forma Revenue: $6.0B Pro Forma Adj. EBITDA: $1.7B Pro Forma Adj. EBITDA less CapEx: $1.3B
Accretive Impact1 Expect $0.26 accretive impact to ANI/share 12 months after close, $0.32 accretive impact to ANI/share 24 months after close
Synergies Expected annualized savings of at least $20M
TRANSACTION HIGHLIGHTS
Deal closed on September 30, 2013
Co
pyr
igh
t ©
2013
Nie
lsen
Ho
ldin
gs N
.V.
28
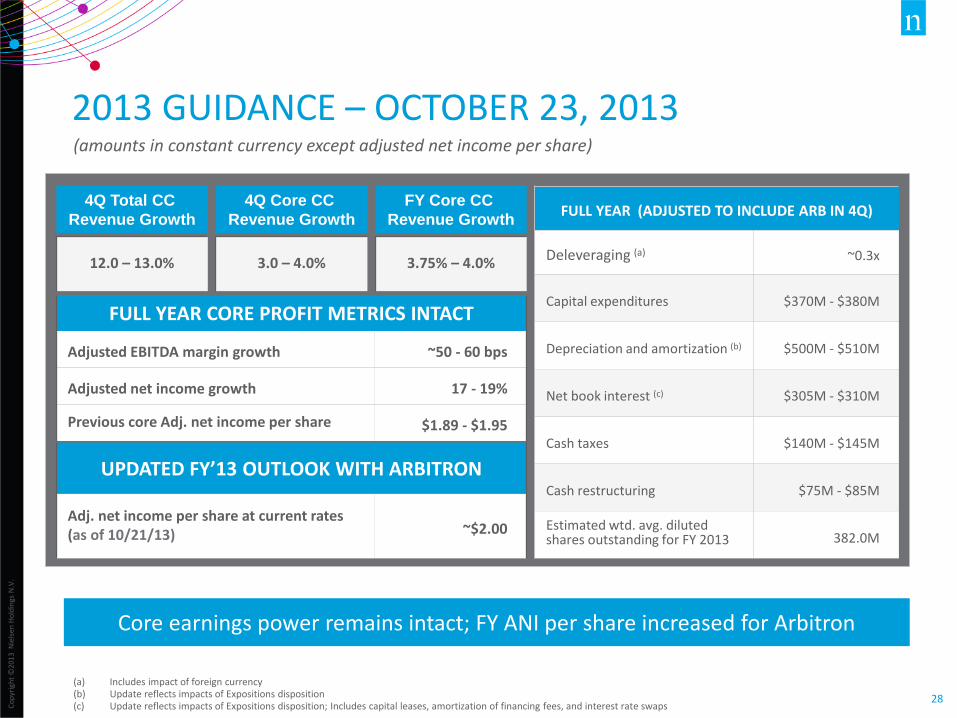
2013 GUIDANCE – OCTOBER 23, 2013 (amounts in constant currency except adjusted net income per share)
(a) Includes impact of foreign currency (b) Update reflects impacts of Expositions disposition (c) Update reflects impacts of Expositions disposition; Includes capital leases, amortization of financing fees, and interest rate swaps
FULL YEAR (ADJUSTED TO INCLUDE ARB IN 4Q)
Deleveraging (a) ~0.3x
Capital expenditures $370M - $380M
Depreciation and amortization (b) $500M - $510M
Net book interest (c) $305M - $310M
Cash taxes $140M - $145M
Cash restructuring $75M - $85M
Estimated wtd. avg. diluted shares outstanding for FY 2013 382.0M
UPDATED FY’13 OUTLOOK WITH ARBITRON
Adj. net income per share at current rates (as of 10/21/13) ~$2.00
4Q Total CC
Revenue Growth
12.0 – 13.0%
4Q Core CC
Revenue Growth
3.0 – 4.0%
FY Core CC
Revenue Growth
3.75% – 4.0%
Core earnings power remains intact; FY ANI per share increased for Arbitron
FULL YEAR CORE PROFIT METRICS INTACT
Adjusted EBITDA margin growth ~50 - 60 bps
Adjusted net income growth 17 - 19%
Previous core Adj. net income per share $1.89 - $1.95

Co
pyr
igh
t ©
2013
Th
e N
iels
en C
om
pan
y. C
on
fid
enti
al a
nd
pro
pri
etar
y.
29
WHY INVEST IN NIELSEN?
Focus on delivering value to clients and shareholders
Comprehensive understanding of what consumers buy and watch
Global leader in our segments with market presence in 100+ countries
“Mission critical” measurement and analytics embedded in client workflows
Syndicated, scalable products and services
Strategic investments to drive continued and future growth opportunities
Proven track record of growth and economic resilience
Accelerated earnings growth through deleveraging
Return of capital to shareholders through dividend
Co
pyr
igh
t ©
2013
Nie
lsen
Ho
ldin
gs N
.V.
30
CERTAIN NON-GAAP MEASURES
Overview of Non-GAAP Presentations We consistently use the below non-GAAP financial measures to evaluate the results of our operations. We believe that the presentation of these non-GAAP measures provides useful information to investors regarding financial and business trends related to our results of operations and that when this non-GAAP financial information is viewed with our GAAP financial information, investors are provided with a more meaningful understanding of our ongoing operating performance. None of the non-GAAP measures presented should be considered as an alternative to net income or loss, operating income or loss, cash flows from operating activities or any other performance measures of operating performance or liquidity derived in accordance with GAAP. These non-GAAP measures have important limitations as analytical tools and should not be considered in isolation or as substitutes for an analysis of our results as reported under GAAP.
Constant Currency Presentation We evaluate our results of operations on both an as reported and a constant currency basis. The constant currency presentation, which is a non-GAAP measure, excludes the impact of fluctuations in foreign currency exchange rates. We believe providing constant currency information provides valuable supplemental information regarding our results of operations, consistent with how we evaluate our performance. We calculate constant currency percentages by converting our prior-period local currency financial results using the current period exchange rates and comparing these adjusted amounts to our current period reported results. Net Debt and Net Debt Leverage Ratio The net debt leverage ratio is defined as net debt as of the balance sheet date divided by Adjusted EBITDA for the twelve months then ended. Net debt and the net debt leverage ratio are not presentations made in accordance with GAAP, and our use of these terms may vary from the use of similarly-titled measures by others in our industry due to the potential inconsistencies in the method of calculation and differences due to items subject to interpretation.
Co
pyr
igh
t ©
2013
Nie
lsen
Ho
ldin
gs N
.V.
31
CERTAIN NON-GAAP MEASURES (continued)
Adjusted EBITDA
We define Adjusted EBITDA as net income or loss from our consolidated statements of operations before interest income and expense, income taxes, depreciation and amortization, restructuring charges, goodwill and intangible asset impairment charges, stock-based compensation expense and other non-operating items from our consolidated statements of operations as well as certain other items considered unusual or non-recurring in nature. Adjusted EBITDA is not a presentation made in accordance with GAAP, and our use of the term Adjusted EBITDA may vary from the use of similarly-titled measures by others in our industry due to the potential inconsistencies in the method of calculation and differences due to items subject to interpretation. We use Adjusted EBITDA to consistently measure our performance from period to period both at the consolidated level as well as within our operating segments, to evaluate and fund incentive compensation programs and to compare our results to those of our competitors.
Adjusted Net Income
We define Adjusted Net Income as net income or loss from our consolidated statements of operations before income taxes, depreciation and amortization associated with acquired tangible and intangible assets, restructuring charges, goodwill and intangible asset impairment charges, other non-operating items from our consolidated statements of operations and certain other items considered unusual or non-recurring in nature, reduced by cash paid for income taxes. Also excluded from Adjusted Net Income is interest expense attributable to the mandatory convertible subordinated bonds converted on February 1, 2013. Free Cash Flow We define free cash flow as net cash provided by operating activities less capital expenditures. We believe providing free cash flow information provides valuable supplemental information regarding our ability to generate cash without additional external financing. Free cash flow is not a presentation made in accordance with GAAP.
Co
pyr
igh
t ©
2013
Nie
lsen
Ho
ldin
gs N
.V.
32
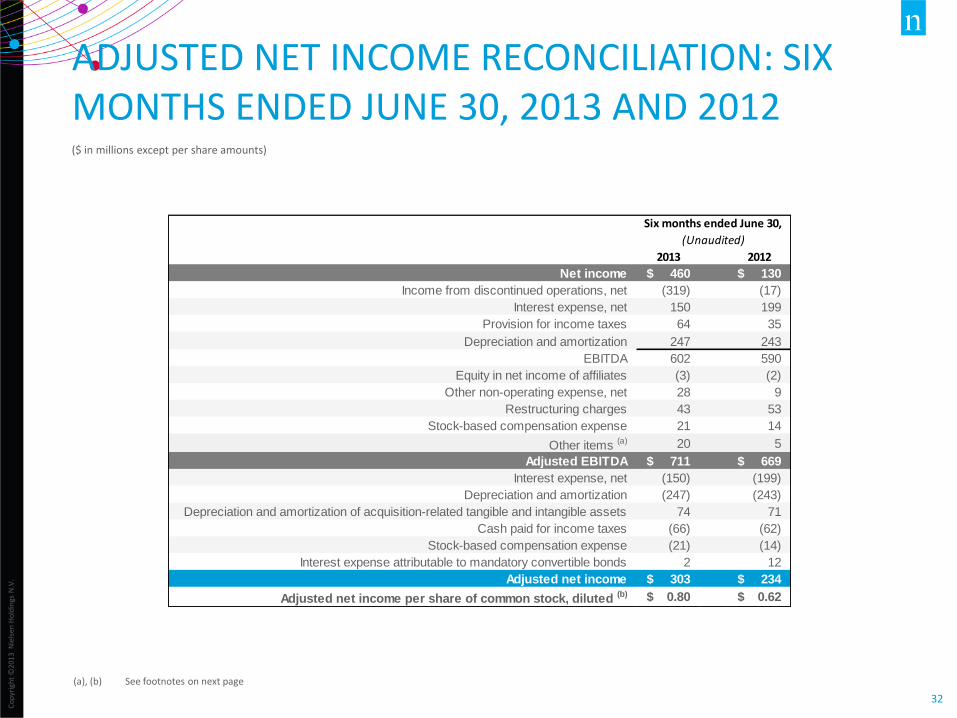
ADJUSTED NET INCOME RECONCILIATION: SIX MONTHS ENDED JUNE 30, 2013 AND 2012 ($ in millions except per share amounts)
(a), (b) See footnotes on next page
2013 2012
Net income $ 460 $ 130
Income from discontinued operations, net (319) (17)
Interest expense, net 150 199
Provision for income taxes 64 35
Depreciation and amortization 247 243
EBITDA 602 590
Equity in net income of affiliates (3) (2)
Other non-operating expense, net 28 9
Restructuring charges 43 53
Stock-based compensation expense 21 14
Other items (a) 20 5
Adjusted EBITDA $ 711 $ 669
Interest expense, net (150) (199)
Depreciation and amortization (247) (243)
Depreciation and amortization of acquisition-related tangible and intangible assets 74 71
Cash paid for income taxes (66) (62)
Stock-based compensation expense (21) (14)
Interest expense attributable to mandatory convertible bonds 2 12
Adjusted net income $ 303 $ 234
Adjusted net income per share of common stock, diluted (b) $ 0.80 $ 0.62
Six months ended June 30,
(Unaudited)
Co
pyr
igh
t ©
2013
Th
e N
iels
en C
om
pan
y. C
on
fid
enti
al a
nd
pro
pri
etar
y.
33
ADJUSTED NET INCOME RECONCILIATION – SIX MONTHS ENDED JUNE 30, 2013 AND 2012
(continued)
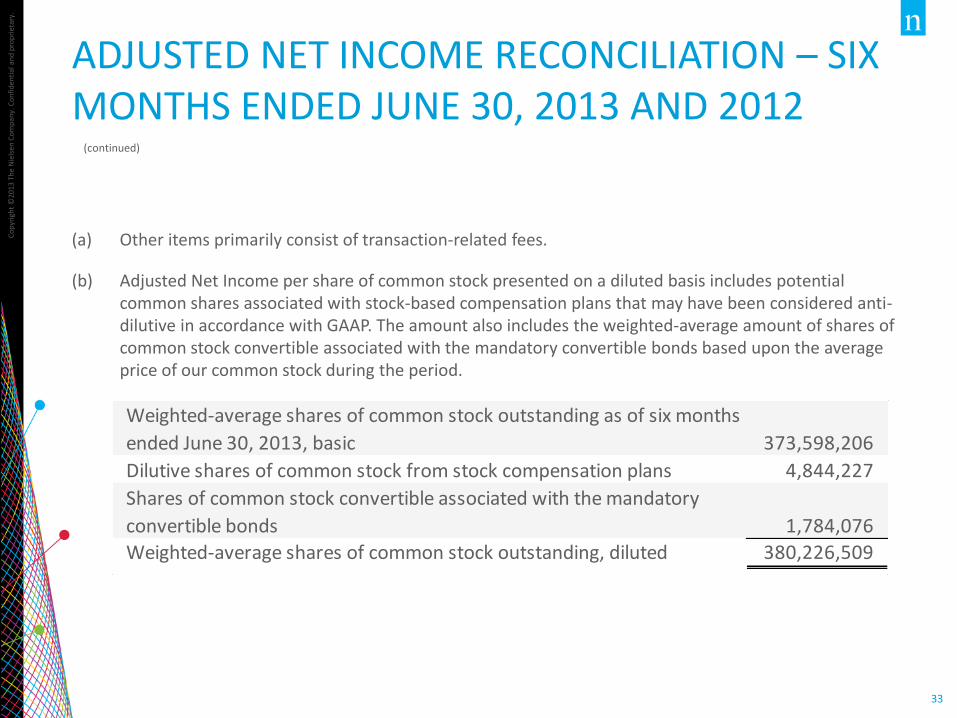
(a) Other items primarily consist of transaction-related fees.
(b) Adjusted Net Income per share of common stock presented on a diluted basis includes potential common shares associated with stock-based compensation plans that may have been considered anti-dilutive in accordance with GAAP. The amount also includes the weighted-average amount of shares of common stock convertible associated with the mandatory convertible bonds based upon the average price of our common stock during the period.
Weighted-average shares of common stock outstanding as of six months
ended June 30, 2013, basic 373,598,206
Dilutive shares of common stock from stock compensation plans 4,844,227
Shares of common stock convertible associated with the mandatory
convertible bonds 1,784,076
Weighted-average shares of common stock outstanding, diluted 380,226,509
Co
pyr
igh
t ©
2013
Nie
lsen
Ho
ldin
gs N
.V.
34
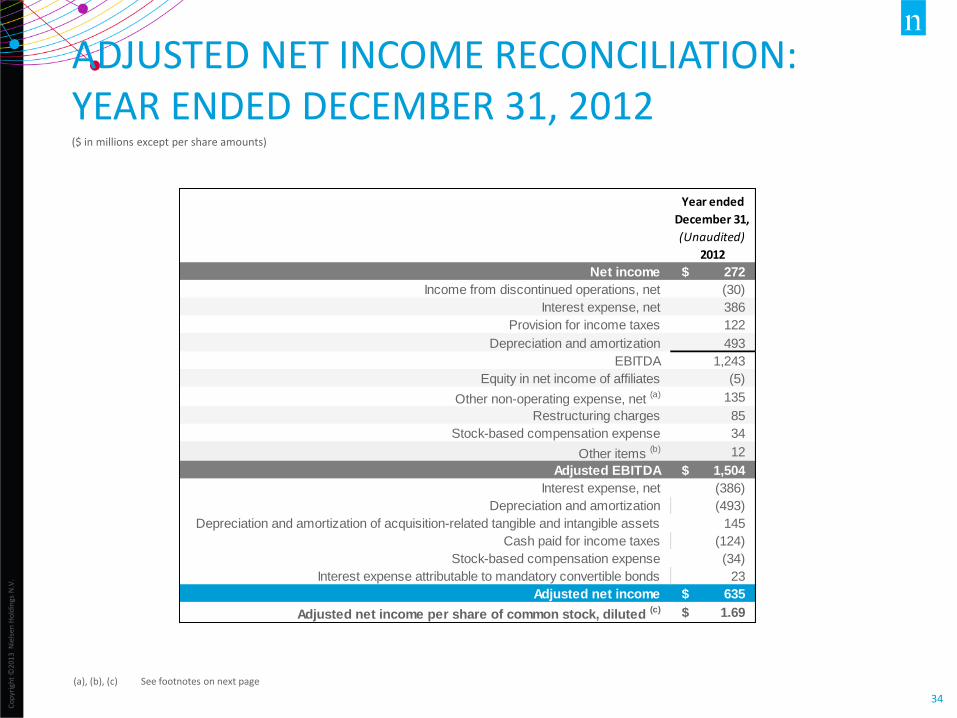
ADJUSTED NET INCOME RECONCILIATION: YEAR ENDED DECEMBER 31, 2012 ($ in millions except per share amounts)
(a), (b), (c) See footnotes on next page
Year ended
December 31,
(Unaudited)
2012
Net income $ 272
Income from discontinued operations, net (30)
Interest expense, net 386
Provision for income taxes 122
Depreciation and amortization 493
EBITDA 1,243
Equity in net income of affiliates (5)
Other non-operating expense, net (a) 135
Restructuring charges 85
Stock-based compensation expense 34
Other items (b) 12
Adjusted EBITDA $ 1,504
Interest expense, net (386)
Depreciation and amortization (493)
Depreciation and amortization of acquisition-related tangible and intangible assets 145
Cash paid for income taxes (124)
Stock-based compensation expense (34)
Interest expense attributable to mandatory convertible bonds 23
Adjusted net income $ 635
Adjusted net income per share of common stock, diluted (c) $ 1.69
Co
pyr
igh
t ©
2013
Th
e N
iels
en C
om
pan
y. C
on
fid
enti
al a
nd
pro
pri
etar
y.
35
ADJUSTED NET INCOME RECONCILIATION: YEAR ENDED DECEMBER 31, 2012
(continued)
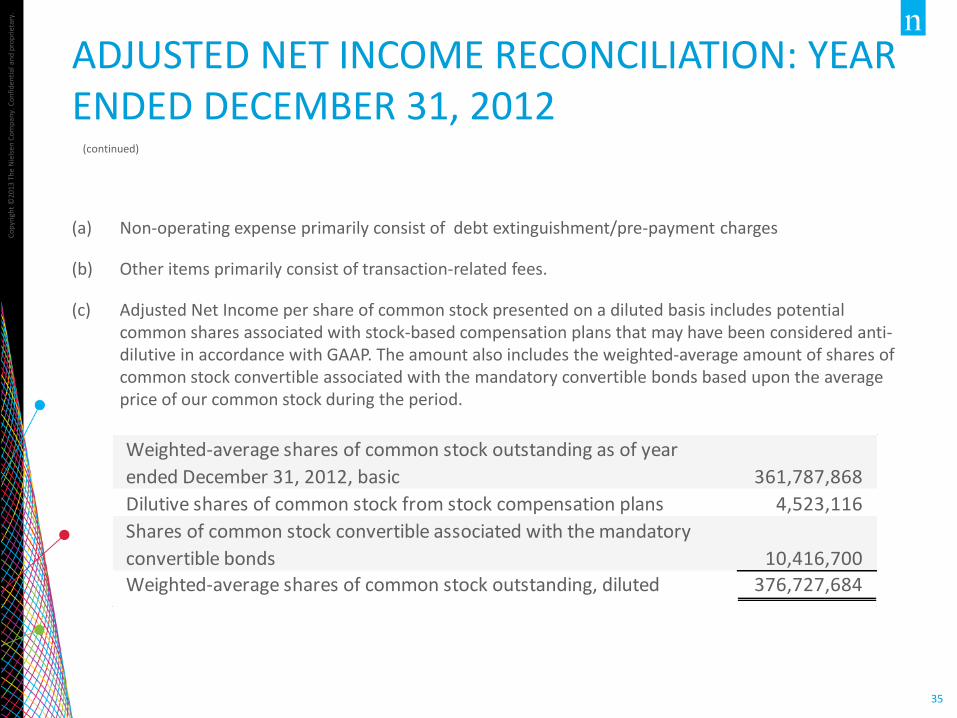
(a) Non-operating expense primarily consist of debt extinguishment/pre-payment charges
(b) Other items primarily consist of transaction-related fees.
(c) Adjusted Net Income per share of common stock presented on a diluted basis includes potential common shares associated with stock-based compensation plans that may have been considered anti-dilutive in accordance with GAAP. The amount also includes the weighted-average amount of shares of common stock convertible associated with the mandatory convertible bonds based upon the average price of our common stock during the period.
Weighted-average shares of common stock outstanding as of year
ended December 31, 2012, basic 361,787,868
Dilutive shares of common stock from stock compensation plans 4,523,116
Shares of common stock convertible associated with the mandatory
convertible bonds 10,416,700
Weighted-average shares of common stock outstanding, diluted 376,727,684

+1.646.654.4602
http://nielsen.com/investors
Follow Nielsen IR
Download the Nielsen IR iPad app
NIELSEN INVESTOR RELATIONS