noaa national oceanic and atmospheric ... - hfip.org · 1. introduction this report describes the...
TRANSCRIPT
i
2017 HFIP R&D Activities Summary: Recent Results and Operational Implementation
May 2018
HFIP Technical Report: HFIP2018-1
NOAA
NATIONAL OCEANIC AND ATMOSPHERIC ADMINISTRATION United States Department of Commerce

ii
Large image on cover page is of Hurricanes Katia (AL13, left), Irma (AL11, center)1 and Jose (AL12, right)
NOAA/GOES-13 and NASA/GSFC GOES 0545 Z Sep. 08, 2017
1 Small image is NOAA/GOES-16 13Z (UTC) September 08, 2017.
iii
2017 HFIP R&D Activities Summary: Recent Results and Operational Implementation S. Gopalakrishnan6, F. Toepfer11, S. Forsythe-Newell13, M. DeMaria9 F. Marks6, E. N. Rappaport9, V. Tallapragada5, J. Franklin9, S. Abarca5, A. Aksoy15, G. Alaka Jr.15, J. W. Bao4, M. Bender19, L. Bernardet4, S. Chen10, J. Cione1, M. Biswas7, M. Brennan9, J. Cangialosi9, M. Morin19, J. Doyle10, J. L. Franklin9, S. Goldenberg6, George Halliwell1, J. S. Hilderbrand20, R. Hodur10, C. Holt18, S. Jason5, H. Jin10, Y. Jin10, H. S. Kim5, W. Komaromi10, P. Kucera7, N. Kurkowski21, B. Kuo3, N. Lett12, P. McCaslin4, A. Mehra5, J. Moskaitis10, L. Nance3, K. Newman3, M. Onderlinde9, A. Penny9, A. Reinecke10, A. Simon9, J. Sippel5, S. Trahan5, H. Tolman5, R. Torn14, S. Upadhayay12, S. Wang10, X. Wang16, J. Whitaker4, D. A. Zelinsky9, F. Zhang17, X. Zhang15, Z. Zhang5 and Lin Zhu5. May 2018 1 Atlantic Oceanographic and Meteorological Laboratory (AOML), OAR/NOAA 2 Cooperative Institute for Research in the Environmental Sciences, University of Colorado 3 Development Testbed Center (DTC) 4 Earth System Research Laboratory (ESRL), OAR/NOAA 5 Environmental Modeling Center (EMC), NCEP/NOAA 6 Hurricane Research Division (HRD), AOML/NOAA 7 National Centers for Atmospheric Research (NCAR) 8 National Environmental Satellite Data Information Center NOAA 9 National Hurricane Center (NHC), NWS/NOAA 10 Naval Research Laboratory (NRL), Monterey 11 National Weather Service Science and Technology Integration (OSTI), NWS/NOAA 12 Science and Technology Corporation 13 Syneren Technologies Corporation 14 University at Albany, State University of New York 15 University of Miami, CIMAS/AOML 16 University of Oklahoma 17 Pennsylvania State University 18 Global Systems Division (GSD)/ESRL/OAR 19 Geophysical Fluid Dynamics Laboratory (GFDL), OAR/NOAA 20 National Weather Service Office of Planning and Programming for Service Delivery (OPPSD), NWS/NOAA
iv
Table of Contents Executive Summary .................................................................................................................................. vii
1. Introduction ......................................................................................................................................... 1
2. The Hurricane Forecast Improvement Project ................................................................................ 1
3. The HFIP Baseline for meeting the goals .......................................................................................... 2
4. The HFIP Model Systems ................................................................................................................... 4
a. State-of-the-Art: Operational HWRF System (Stream-1) ..................................................... 5 b. HMON System (Stream-1) ........................................................................................................ 6
5. The HWRF DA system ....................................................................................................................... 7
6. Community Involvement .................................................................................................................... 9
7. Operational Hurricane Guidance Improvements ............................................................................ 9
a. Track Guidance ......................................................................................................................... 9 b. Intensity Guidance ................................................................................................................... 10 c. Advancing Rapid Intensification Prediction ......................................................................... 12 d. HWRF Performance in other Global Basins......................................................................... 16
8. Important Stream-2 Results ............................................................................................................. 17
a. Research Advances: Multiple, Storm-following, Two-way Interactive Telescoping Nests (Stream-2) .............................................................................................................................................. 17 b. Unified Modeling System for Hurricane Forecasting (Stream-2) ....................................... 18 c. Research Advances: Regional Ensembles (Stream-2) .......................................................... 22
9. New Products, Tools, and Services at NHC .................................................................................... 23
a. Improvements to NHC Public Products ................................................................................ 23 b. Improvements to Forecaster Guidance and Visualization ................................................... 25
10. NOAA Announcement of Opportunity (AO) ................................................................................. 26
11. Hurricane Analysis and Forecast System (HAFS) ......................................................................... 26
12. Future direction of the HFIP program ........................................................................................... 28
References .................................................................................................................................................. 30
Appendix A: Model Acronyms ................................................................................................................ 33
v
List of Tables Table 1. HFIP Supported Projects from 2016-2018. .................................................................... 26 Table 2. Meteorology and Model Acronyms ................................................................................ 33 List of Figures Figure 1: HFIP (a) Track and (b) Intensity Error Baseline and Goals. Baseline errors .................. 3 Figure 2: NHC (a) Track errors (1960-2017) & (b) Intensity errors (1970-2017) in the Atlantic . 4 Figure 3: HWRF improvements in forecast track and intensity error for the Atlantic Basin ......... 5 Figure 4: HMON track & intensity skills relative to the GFDL model (2014-16 NATL basin) .... 6 Figure 5: Diagram of new HWRF DA system with full covariance cycling provided by EnKF ... 7 Figure 6: Performance of the research version of the HWRF DA system...................................... 7 Figure 7: Impact on HWRF Vmax and track in terms of skill, of reconnaissance on HWRF ....... 8 Figure 8: Track forecast skills for (a) AL and (b) EPAC basins. ................................................... 9 Figure 9: 2017 Intensity forecast skills for (a) AL and (b) EPAC basins. .................................... 10 Figure 10: NHC Intensity aids for Hurricane Harvey 12Z 23 Aug 2017 & 12Z 24 Aug 2017 .... 11 Figure 11: NHC and select model (a) intensity forecast errors for Irma & HWRF 10-m wind. .. 11 Figure 12: Best track for intensity, official & model intensity forecasts of intensity for Maria .. 12 Figure 13: NHC Atlantic intensity forecast errors for cases with and without RI at any time. .... 12 Figure 14: POD and FAR of RI for NHC forecasts and guidance models (2017 AL sample). .... 13 Figure 15: Brier Skill Scores of the 4 components of the operations SHIPS RI .......................... 15 Figure 16: Brier Skill Scores-exp. DTOPS & 2018v of SHIPS-RII for AL forecasts 2015-2017 16 Figure 17: WPAC Track & Intensity skill and S. Hemisphere Track & Intensity errors ............. 17 Figure 18: Basin-Scale configuration operational HWRF with multiple moving nests at 2-km .. 18 Figure 19: FV3 model Zoomed-in on the AL basin and 2-way interactive 3-km telescopic nest 19 Figure 20: Stream-2 models compared to Stream-1 operational models ...................................... 19 Figure 21: Basin-Scale HWRF wind speed predictions of Harvey compared to best .................. 20 Figure 22: Track skills of Basin-Scale HWRF compared to HWRF 2017 and GFS cases .......... 20 Figure 23: Example of a basin-scale HWRF DA product from 12Z 19 Sep. 2017 ...................... 21 Figure 24: HWRF HMON-COAMPS multi-model ensembles for Irma (2017/09/08 cycle) ...... 22 Figure 25: New or enhanced products: Earliest Reasonable Arrival Time of Tropical................ 23 Figure 26: Storm Surge Watch / Warning – Max.water levels (ft) measured from tide gauges .. 24 Figure 27: Cartoon from SIP presentations showing how hi-res nests may be moved ................ 27

vi
This page is intentionally left blank.
vii
Executive Summary This report describes the activities and results of the Hurricane Forecast Improvement Project2 (HFIP) in 2017. It should be generally noted that 2017 unlike 2015 and 2014, was not a representative season for the Atlantic due to very high tropical cyclone (TC) activity and many rapid intensification (RI) events. A major developmental focus in 2017 was on the Hurricane Weather Research and Forecasting3 (HWRF) regional model and advancements of Data Assimilation Technique for HWRF. In 2017, HFIP remained organized around two Streams: Stream-1: Operational model development and Stream-2: HFIP experimental models which test and evaluate new techniques and strategies for numerical model forecast guidance prior to testing for possible operational implementation. Stream-2 also tests techniques that cannot be tested on current operational computers due to size and time requirements but can be tested on HFIP’s High Performance Computing Center (HPC) in Boulder, CO (also referred to as Jet). The HFIP HPC research studies look ahead to possible future operational computational capability. This report outlines HFIP, how it is organized, its goals, models, and results from both the operational model development (Stream-1) and experimental model development (Stream-2). The following were the highlights in 2017:
1. 2017 had the highest number of major Atlantic hurricanes since 2005 season and perhaps the most challenging season for intensity predictions from high-resolution dynamical models
2. Operational HWRF was the best deterministic intensity forecast model in the ATL a. outperformed statistical models based on climatology
3. Improved Data Assimilation system in HWRF a. Improved vortex initialization with new composite vortex, Assimilated HDOBS, and
Fully cycled HWRF Ens. Hybrid DA for TDR data b. HWRF predicts secondary eyewall formation
4. Improvements in numerical guidance continuing to appear in NHC official forecast for track and intensity
5. New products and tools at NHC ready for Operations a. Time of Arrival operational in 2018 b. “Be Ready By” c. Storm Surge Watch and Warning
6. HMON first year in operations replaced legacy GFDL hurricane model 7. Continued development and improvements to the HFIP Corrected Consensus Approach
(HCCA) model 8. The basin scale HWRF demonstrated some superior track skill over the operational HWRF
illustrating a viable pathway for hurricane moving nest in NGGPS 9. Initial results of nested fvGFS demonstrated showed promise for track and intensity
predictions
2 http://www.hfip.org/ 3 http://www.emc.ncep.noaa.gov/gc_wmb/vxt/HWRF/index.php
1
1. Introduction This report describes the Hurricane Forecast Improvement Project (HFIP), its goals, proposed methods for achieving those goals, and recent results from the program with an emphasis on recent advances in the skill of operational hurricane forecast guidance. The first part of this report is very similar to previous versions of the annual report since it basically sets the background of the program. This year’s version has been shortened and focuses upon capturing state-of-the-art HFIP modeling and data assimilation techniques, accomplishments during 2017 season and future plans. For more background information readers are referred to earlier reports available at: http://www.hfip.org/documents/reports2.php. Acronyms are defined in the Appendix.
2. The Hurricane Forecast Improvement Project Twenty-seven named tropical storms and thirteen hurricanes crossed US coastlines from 2000-2010. The Hurricane Forecast Improvement Project (HFIP) was established within NOAA, in June 2007, in response to particularly damaging hurricanes (e.g., Charley, 2004; Wilma, Katrina, Rita, 2005) in the first half of that decade. HFIP’s 5-year (for 2014) and 10-year goals (for 2019) are:
● Reduce average track errors by 20% in 5 years, and 50% in 10 years for days 1-5. ● Reduce average intensity errors by 20% in 5 years, and 50% in 10 years for days 1-5. ● Increase the probability of detection (POD)4 for RI5 to 90% at Day 1 decreasing linearly
to 60% at day 5 and decrease the false alarm ratio (FAR) for rapid intensity change to 10% for day 1 increasing linearly to 30% at day 5 (the focus on RI change is the highest-priority forecast challenge identified by the National Hurricane Center).
● Extend the lead-time for hurricane forecasts out to Day 7 (with accuracy equivalent to that of the Day 5 forecasts when they were introduced in 2003).
HFIP provides the unifying organizational infrastructure and funding for NOAA and other agencies to coordinate the hurricane research needed to significantly improve guidance for hurricane track, intensity, and storm surge forecasts and accelerate the transition from research to operations. HFIP focuses multi-organizational activities to research, develop, demonstrate and implement enhanced operational modeling capabilities, dramatically improving the numerical forecast guidance made available to the National Hurricane Center (NHC). HFIP is organized along two lines of activities: Stream-1 and Stream-2. While Stream-1 works within presumed operational computing resource limitations, Stream-2 activities assume that resources will be found to greatly increase available computer power in operations above that
4 Probability of Detection (POD), is equal to the total number of correct rapid intensification (RI) forecasts divided by the total number of forecasts that should have indicated RI: number of correctly forecasted ÷ (correctly forecasted RI+ did not but should have forecasted RI). False Alarm Ratio (FAR) is equal to the total number of incorrect forecasts of RI divided by the total number of RI forecasts: forecasted RI that did not occur ÷ (forecasted RI that did occur + forecasted RI that did not occur). 5 RI for hurricanes is defined as an increase in wind speed ≥30 knots in 24 hours. This goal for HFIP also applies to
rapid weakening (RW) of a decrease of 25 knots in 24 hours.
2
planned for the next five years. The purpose of Stream-2 is to demonstrate that the application of advanced science, technology, and increased computing will lead to the desired increase in accuracy, and other improvements of forecast performance. Due to the level of computing necessary to perform such a demonstration is larger than can be accommodated by current operational computing resources, HFIP developed its own computing system at NOAA/OAR/ESRL in Boulder, Colorado. A major component of Stream-2 (also known as the Demonstration Project) is an Experimental Forecast System (EFS) that HFIP runs each hurricane season. The purpose of the EFS is to evaluate the strengths and weaknesses of promising new approaches that are testable only with enhanced computing capabilities. The progress of Stream-2 work is evaluated after each season to identify techniques that appear particularly promising to operational forecasters and/or modelers. These potential advances can be blended into operational implementation plans through subsequent Stream-1 activities, or further developed outside of operations within Stream-2. Stream-2 models represent cutting-edge approaches that have little or no track record; and therefore, are not used by National Hurricane Center (NHC) forecasters to prepare their operational forecasts or warnings. Nevertheless, most of the operational HWRF advancements, including the high-resolution nests and appropriate physics originated from Stream-2 work.
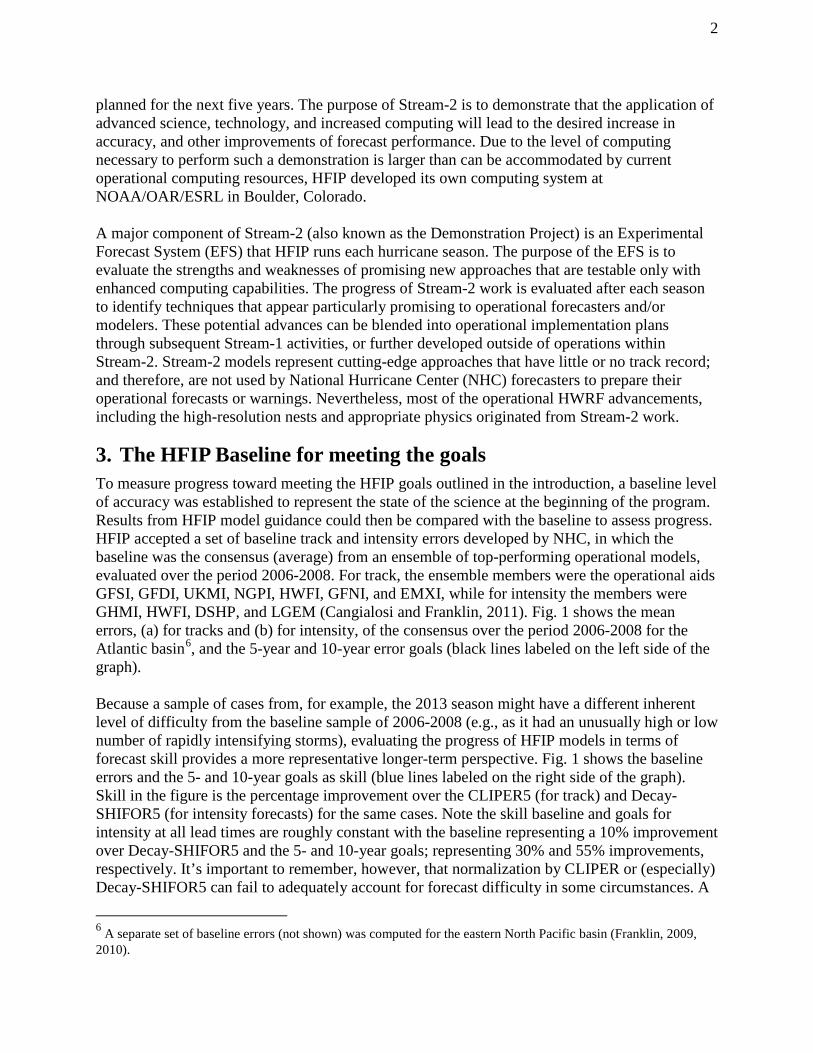
3. The HFIP Baseline for meeting the goals To measure progress toward meeting the HFIP goals outlined in the introduction, a baseline level of accuracy was established to represent the state of the science at the beginning of the program. Results from HFIP model guidance could then be compared with the baseline to assess progress. HFIP accepted a set of baseline track and intensity errors developed by NHC, in which the baseline was the consensus (average) from an ensemble of top-performing operational models, evaluated over the period 2006-2008. For track, the ensemble members were the operational aids GFSI, GFDI, UKMI, NGPI, HWFI, GFNI, and EMXI, while for intensity the members were GHMI, HWFI, DSHP, and LGEM (Cangialosi and Franklin, 2011). Fig. 1 shows the mean errors, (a) for tracks and (b) for intensity, of the consensus over the period 2006-2008 for the Atlantic basin6, and the 5-year and 10-year error goals (black lines labeled on the left side of the graph). Because a sample of cases from, for example, the 2013 season might have a different inherent level of difficulty from the baseline sample of 2006-2008 (e.g., as it had an unusually high or low number of rapidly intensifying storms), evaluating the progress of HFIP models in terms of forecast skill provides a more representative longer-term perspective. Fig. 1 shows the baseline errors and the 5- and 10-year goals as skill (blue lines labeled on the right side of the graph). Skill in the figure is the percentage improvement over the CLIPER5 (for track) and Decay-SHIFOR5 (for intensity forecasts) for the same cases. Note the skill baseline and goals for intensity at all lead times are roughly constant with the baseline representing a 10% improvement over Decay-SHIFOR5 and the 5- and 10-year goals; representing 30% and 55% improvements, respectively. It’s important to remember, however, that normalization by CLIPER or (especially) Decay-SHIFOR5 can fail to adequately account for forecast difficulty in some circumstances. A
6 A separate set of baseline errors (not shown) was computed for the eastern North Pacific basin (Franklin, 2009, 2010).
3
hurricane season that features extremely hostile environmental conditions will lead to very high Decay-SHIFOR intensity forecast errors (as climatology will be a poor forecast in such years), but relatively low dynamical model and NHC official forecast errors (as few storms will intensify rapidly, making life easy on both models and forecasters). This combination of baseline and model errors yields an unrealistic skill estimate.
Figure 1: HFIP (a) Track and (b) Intensity Error Baseline and Goals. Baseline errors (black lines) were determined from an average of the top-flight operational models during the period 2006-2008. The HFIP expressed goals (dashed lines) are to reduce this error by 20% in 5 years and 50% within 10 years. Comparisons of forecasts over non-homogenous samples, however, are best done in terms of skill. To obtain the 5-year and 10-year HFIP goal in terms of skill (blue lines-baseline skill in solid, HFIP goals dashed), the goals are also expressed as the percentage improvement over the CLIPER5 errors (track) and Decay-SHIFOR5 (intensity) of the baseline sample (see text).
It is important to note that HFIP performance baselines were determined from a class of operational aids known as “early” models. Early models are those that are available to forecasters early enough to meet forecast deadlines for the synoptic cycle. Nearly all the dynamical models currently in use at tropical cyclone forecast centers, such as the GFS or the GFDL model (or “GFDL”), are considered “late” models because their results arrive too late to be used in the forecast for the current synoptic cycle. For example, the 12:00 Coordinated Universal Time or Zulu Time Zone (Z) GFDL run does not become available to forecasters until around 16:00Z, whereas the NHC official forecast based on the 12:00Z initialization must be issued by 15:00Z, one hour before the GFDL forecast can be viewed. It’s actually the older, 06:00Z run of the GFDL model that would be used as input for the 15:00Z official NHC forecast, through a procedure developed to adjust the 06:00Z model run to match the actual storm location and intensity at 12:00Z. This procedure also adjusts the forecast position and intensity at some of the forecast times as well and then applies a smoother to the adjusted forecast. This adjustment, called “interpolation” procedure, creates the 12:00Z “early” aid GFDI that can be used for the 15:00Z NHC forecast. Model results so adjusted are denoted with an “I” (e.g., GFDI). The distinction between early and late models is important to assessing model performance, since late models have an advantage of more recent observations/analysis than their early counterparts. However, it is interesting to note that although the early version loses about 3-5% of the skill for
4
track forecasts compared to the late version, the skill for intensity forecasts are virtually the same for late and early versions (Goldenberg et al, 2015).
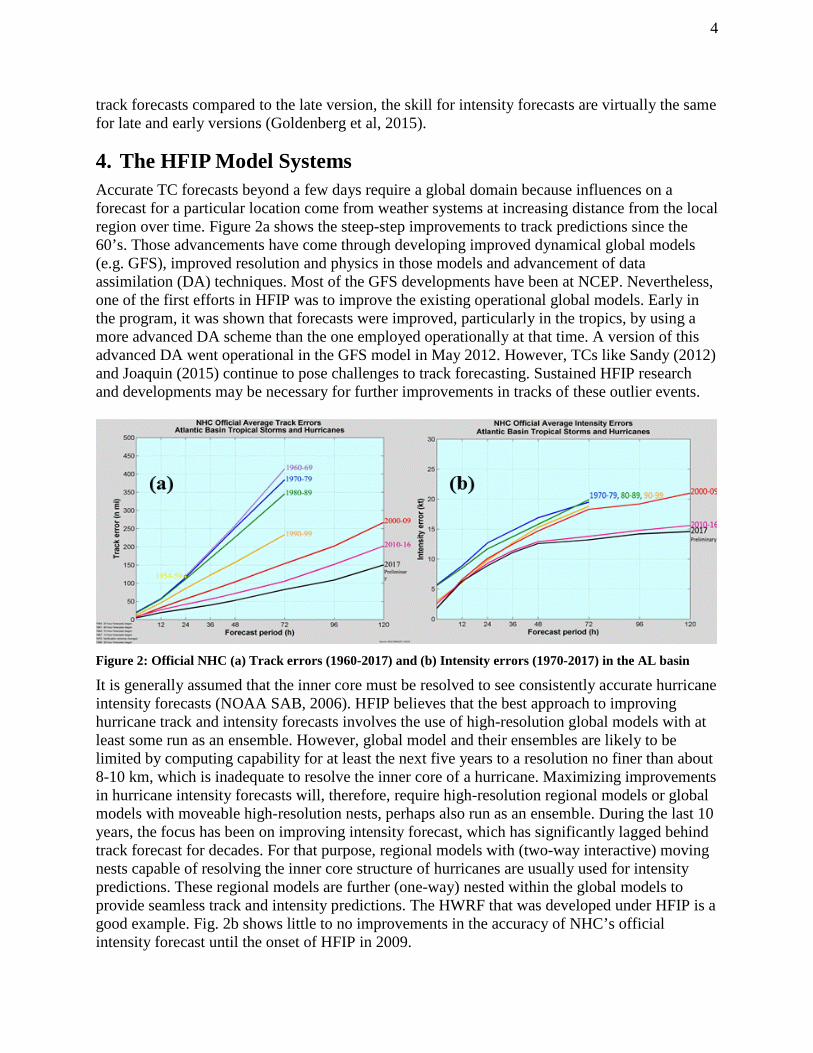
4. The HFIP Model Systems Accurate TC forecasts beyond a few days require a global domain because influences on a forecast for a particular location come from weather systems at increasing distance from the local region over time. Figure 2a shows the steep-step improvements to track predictions since the 60’s. Those advancements have come through developing improved dynamical global models (e.g. GFS), improved resolution and physics in those models and advancement of data assimilation (DA) techniques. Most of the GFS developments have been at NCEP. Nevertheless, one of the first efforts in HFIP was to improve the existing operational global models. Early in the program, it was shown that forecasts were improved, particularly in the tropics, by using a more advanced DA scheme than the one employed operationally at that time. A version of this advanced DA went operational in the GFS model in May 2012. However, TCs like Sandy (2012) and Joaquin (2015) continue to pose challenges to track forecasting. Sustained HFIP research and developments may be necessary for further improvements in tracks of these outlier events.
Figure 2: Official NHC (a) Track errors (1960-2017) and (b) Intensity errors (1970-2017) in the AL basin
It is generally assumed that the inner core must be resolved to see consistently accurate hurricane intensity forecasts (NOAA SAB, 2006). HFIP believes that the best approach to improving hurricane track and intensity forecasts involves the use of high-resolution global models with at least some run as an ensemble. However, global model and their ensembles are likely to be limited by computing capability for at least the next five years to a resolution no finer than about 8-10 km, which is inadequate to resolve the inner core of a hurricane. Maximizing improvements in hurricane intensity forecasts will, therefore, require high-resolution regional models or global models with moveable high-resolution nests, perhaps also run as an ensemble. During the last 10 years, the focus has been on improving intensity forecast, which has significantly lagged behind track forecast for decades. For that purpose, regional models with (two-way interactive) moving nests capable of resolving the inner core structure of hurricanes are usually used for intensity predictions. These regional models are further (one-way) nested within the global models to provide seamless track and intensity predictions. The HWRF that was developed under HFIP is a good example. Fig. 2b shows little to no improvements in the accuracy of NHC’s official intensity forecast until the onset of HFIP in 2009.
5
It is expected that the Next Generation Global Prediction System (NGGPS) may be able to provide some accelerated progress in improving track and intensity predictions within one unified modeling system. The eventual goal here is to transition the multi-nested “Basin-Scale” type of nest (illustrated in Figure 18) to NGGPS (illustrated in Figure 19).
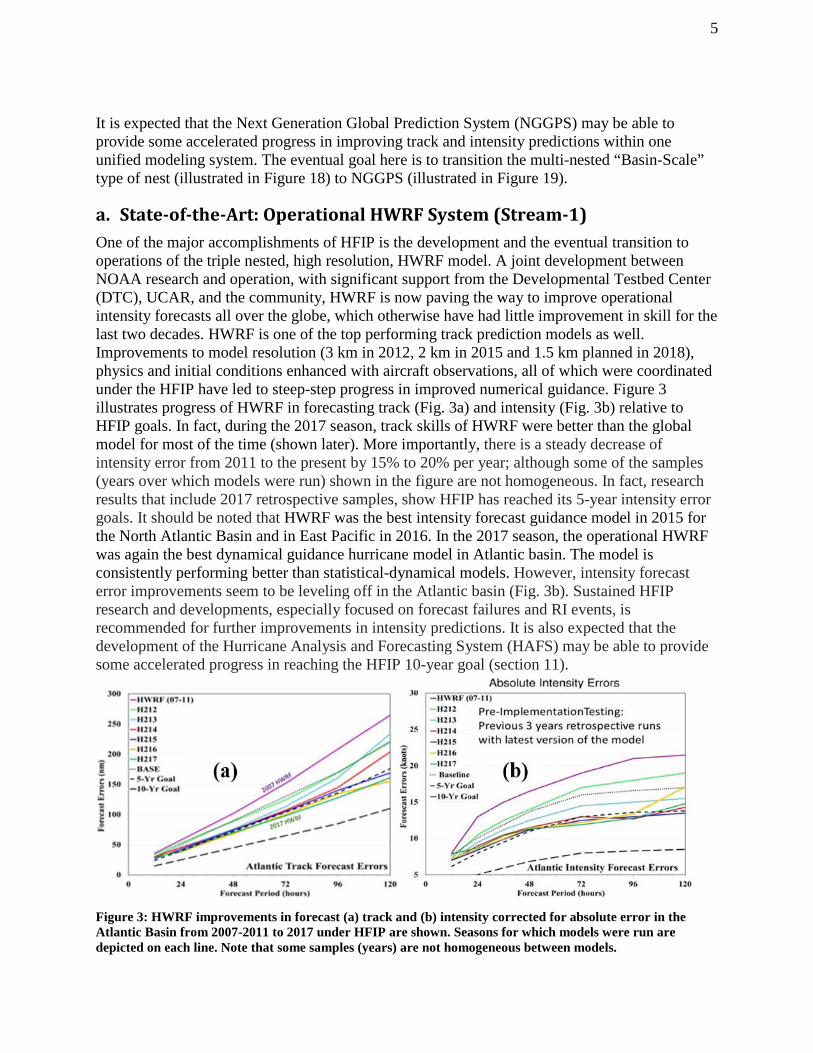
a. State-of-the-Art: Operational HWRF System (Stream-1) One of the major accomplishments of HFIP is the development and the eventual transition to operations of the triple nested, high resolution, HWRF model. A joint development between NOAA research and operation, with significant support from the Developmental Testbed Center (DTC), UCAR, and the community, HWRF is now paving the way to improve operational intensity forecasts all over the globe, which otherwise have had little improvement in skill for the last two decades. HWRF is one of the top performing track prediction models as well. Improvements to model resolution (3 km in 2012, 2 km in 2015 and 1.5 km planned in 2018), physics and initial conditions enhanced with aircraft observations, all of which were coordinated under the HFIP have led to steep-step progress in improved numerical guidance. Figure 3 illustrates progress of HWRF in forecasting track (Fig. 3a) and intensity (Fig. 3b) relative to HFIP goals. In fact, during the 2017 season, track skills of HWRF were better than the global model for most of the time (shown later). More importantly, there is a steady decrease of intensity error from 2011 to the present by 15% to 20% per year; although some of the samples (years over which models were run) shown in the figure are not homogeneous. In fact, research results that include 2017 retrospective samples, show HFIP has reached its 5-year intensity error goals. It should be noted that HWRF was the best intensity forecast guidance model in 2015 for the North Atlantic Basin and in East Pacific in 2016. In the 2017 season, the operational HWRF was again the best dynamical guidance hurricane model in Atlantic basin. The model is consistently performing better than statistical-dynamical models. However, intensity forecast error improvements seem to be leveling off in the Atlantic basin (Fig. 3b). Sustained HFIP research and developments, especially focused on forecast failures and RI events, is recommended for further improvements in intensity predictions. It is also expected that the development of the Hurricane Analysis and Forecasting System (HAFS) may be able to provide some accelerated progress in reaching the HFIP 10-year goal (section 11).
Figure 3: HWRF improvements in forecast (a) track and (b) intensity corrected for absolute error in the Atlantic Basin from 2007-2011 to 2017 under HFIP are shown. Seasons for which models were run are depicted on each line. Note that some samples (years) are not homogeneous between models.
6
based on climatology. Accelerated improvements to track and intensity forecasting with HWRF model demonstrates that a focused program such as HFIP is needed to further accelerate numerical guidance of hurricanes.
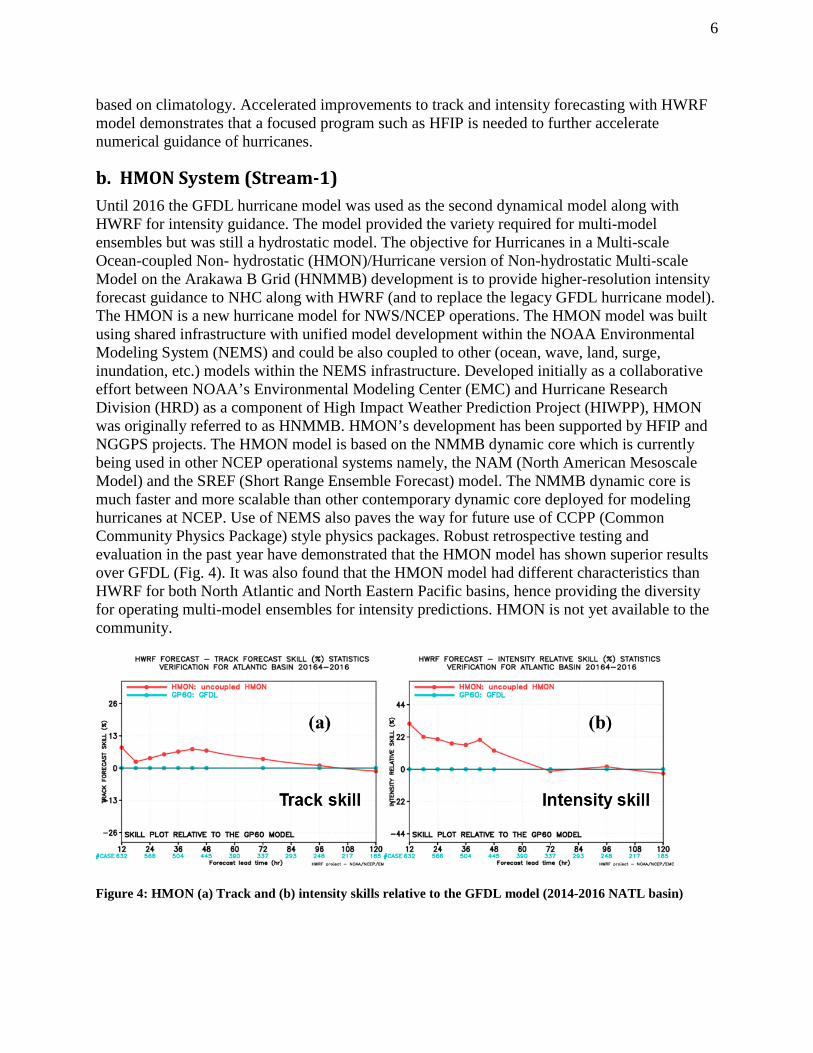
b. HMON System (Stream-1) Until 2016 the GFDL hurricane model was used as the second dynamical model along with HWRF for intensity guidance. The model provided the variety required for multi-model ensembles but was still a hydrostatic model. The objective for Hurricanes in a Multi-scale Ocean-coupled Non- hydrostatic (HMON)/Hurricane version of Non-hydrostatic Multi-scale Model on the Arakawa B Grid (HNMMB) development is to provide higher-resolution intensity forecast guidance to NHC along with HWRF (and to replace the legacy GFDL hurricane model). The HMON is a new hurricane model for NWS/NCEP operations. The HMON model was built using shared infrastructure with unified model development within the NOAA Environmental Modeling System (NEMS) and could be also coupled to other (ocean, wave, land, surge, inundation, etc.) models within the NEMS infrastructure. Developed initially as a collaborative effort between NOAA’s Environmental Modeling Center (EMC) and Hurricane Research Division (HRD) as a component of High Impact Weather Prediction Project (HIWPP), HMON was originally referred to as HNMMB. HMON’s development has been supported by HFIP and NGGPS projects. The HMON model is based on the NMMB dynamic core which is currently being used in other NCEP operational systems namely, the NAM (North American Mesoscale Model) and the SREF (Short Range Ensemble Forecast) model. The NMMB dynamic core is much faster and more scalable than other contemporary dynamic core deployed for modeling hurricanes at NCEP. Use of NEMS also paves the way for future use of CCPP (Common Community Physics Package) style physics packages. Robust retrospective testing and evaluation in the past year have demonstrated that the HMON model has shown superior results over GFDL (Fig. 4). It was also found that the HMON model had different characteristics than HWRF for both North Atlantic and North Eastern Pacific basins, hence providing the diversity for operating multi-model ensembles for intensity predictions. HMON is not yet available to the community.
Figure 4: HMON (a) Track and (b) intensity skills relative to the GFDL model (2014-2016 NATL basin)
7
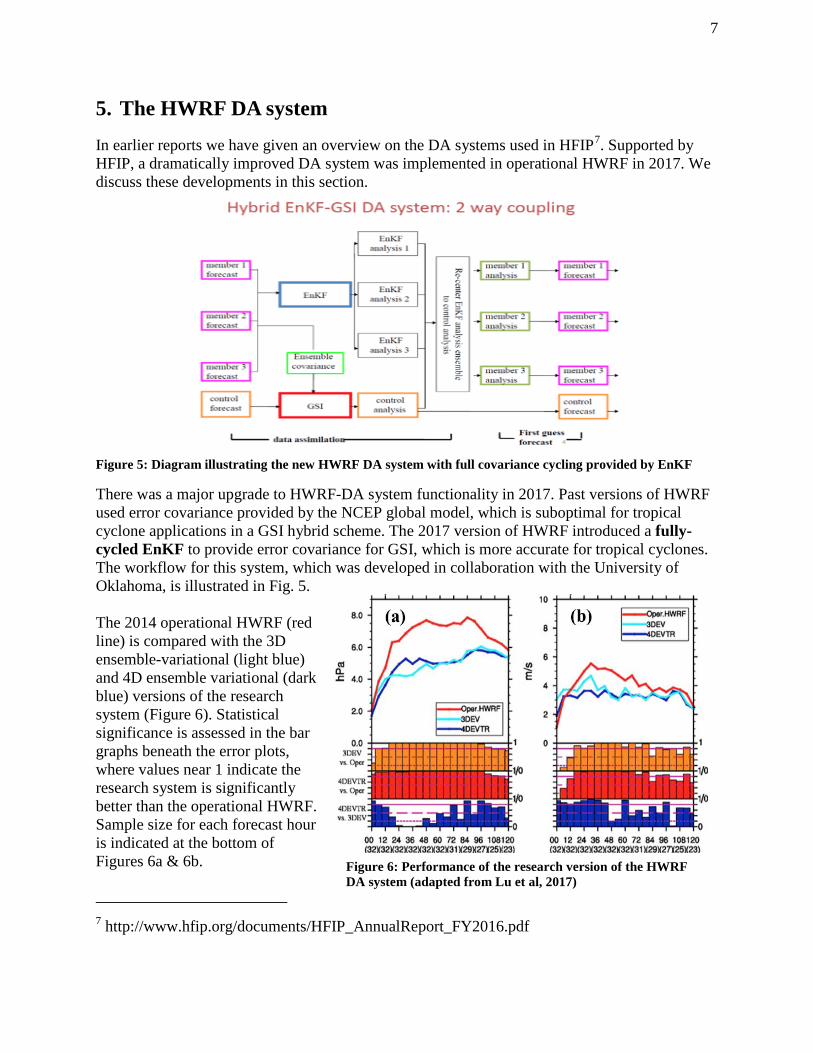
5. The HWRF DA system In earlier reports we have given an overview on the DA systems used in HFIP7. Supported by HFIP, a dramatically improved DA system was implemented in operational HWRF in 2017. We discuss these developments in this section.
Figure 5: Diagram illustrating the new HWRF DA system with full covariance cycling provided by EnKF
There was a major upgrade to HWRF-DA system functionality in 2017. Past versions of HWRF used error covariance provided by the NCEP global model, which is suboptimal for tropical cyclone applications in a GSI hybrid scheme. The 2017 version of HWRF introduced a fully-cycled EnKF to provide error covariance for GSI, which is more accurate for tropical cyclones. The workflow for this system, which was developed in collaboration with the University of Oklahoma, is illustrated in Fig. 5. The 2014 operational HWRF (red line) is compared with the 3D ensemble-variational (light blue) and 4D ensemble variational (dark blue) versions of the research system (Figure 6). Statistical significance is assessed in the bar graphs beneath the error plots, where values near 1 indicate the research system is significantly better than the operational HWRF. Sample size for each forecast hour is indicated at the bottom of Figures 6a & 6b. 7 http://www.hfip.org/documents/HFIP_AnnualReport_FY2016.pdf
Figure 6: Performance of the research version of the HWRF DA system (adapted from Lu et al, 2017)
8
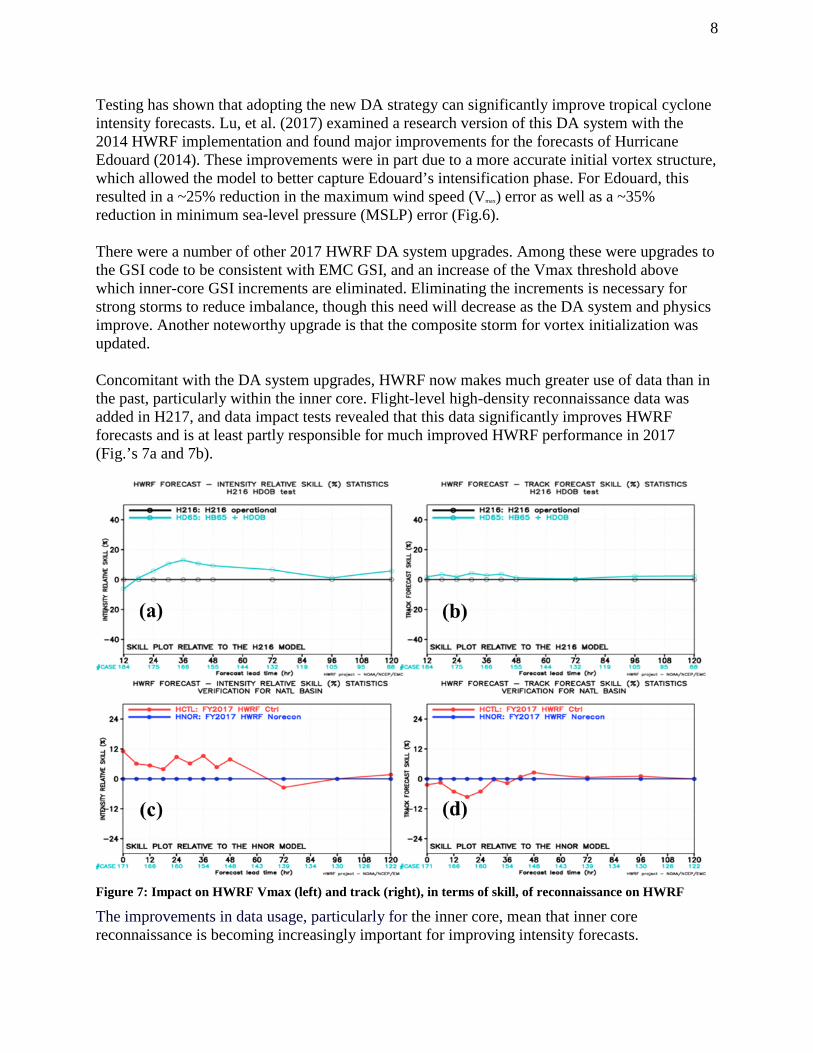
Testing has shown that adopting the new DA strategy can significantly improve tropical cyclone intensity forecasts. Lu, et al. (2017) examined a research version of this DA system with the 2014 HWRF implementation and found major improvements for the forecasts of Hurricane Edouard (2014). These improvements were in part due to a more accurate initial vortex structure, which allowed the model to better capture Edouard’s intensification phase. For Edouard, this resulted in a ~25% reduction in the maximum wind speed (Vmax) error as well as a ~35% reduction in minimum sea-level pressure (MSLP) error (Fig.6). There were a number of other 2017 HWRF DA system upgrades. Among these were upgrades to the GSI code to be consistent with EMC GSI, and an increase of the Vmax threshold above which inner-core GSI increments are eliminated. Eliminating the increments is necessary for strong storms to reduce imbalance, though this need will decrease as the DA system and physics improve. Another noteworthy upgrade is that the composite storm for vortex initialization was updated. Concomitant with the DA system upgrades, HWRF now makes much greater use of data than in the past, particularly within the inner core. Flight-level high-density reconnaissance data was added in H217, and data impact tests revealed that this data significantly improves HWRF forecasts and is at least partly responsible for much improved HWRF performance in 2017 (Fig.’s 7a and 7b).
Figure 7: Impact on HWRF Vmax (left) and track (right), in terms of skill, of reconnaissance on HWRF
The improvements in data usage, particularly for the inner core, mean that inner core reconnaissance is becoming increasingly important for improving intensity forecasts.
9
Retrospectives from 2017 storms revealed that reconnaissance improved HWRF intensity forecasts by about 10% through 48 hours (Fig. 7c) for select major hurricanes. Note that major hurricanes represent the most difficult cases for reconnaissance DA improvement in HWRF.
6. Community Involvement Research to Operations (R2O) was one of the initial goals of the WRF program and is supported by HFIP in developing a repository for a community-based hurricane modeling system which ensures the same code base can be used for research and in operations. During 2009-2016, both the EMC and the DTC worked to update the operational version of HWRF from version 2.0 to the current community version of HWRF, version 3.9a. The 3.9a version makes the operational model completely compatible with codes in community repositories, allows researchers access to operational codes, and makes improvements in HWRF developed by the research community easily transferable into operations. At this time (2017) there are more than 1,300 registered HWRF users world-wide. Support provided by the DTC in 2015-2016 included two in-person HWRF tutorials; one at NCEP in College Park, MD and another at Nanjing University of Information Science and Technology (NUIST) in China. User support was expanded with the Stream-2 effort, Basin-Scale HWRF. This research system can support any number of high-resolution movable nests centered on TCs in either the Atlantic or eastern North Pacific basin. Working with HRD, the DTC also supported the transition of this research version to the latest community repository, enabling users to access all advancements in the HWRF system including the end-to-end Basin-Scale configuration (excluding ocean coupling and data assimilation). A similar testbed activity is recommended for transitioning the proposed FV3 based hurricane forecasting system.
7. Operational Hurricane Guidance Improvements8
a. Track Guidance
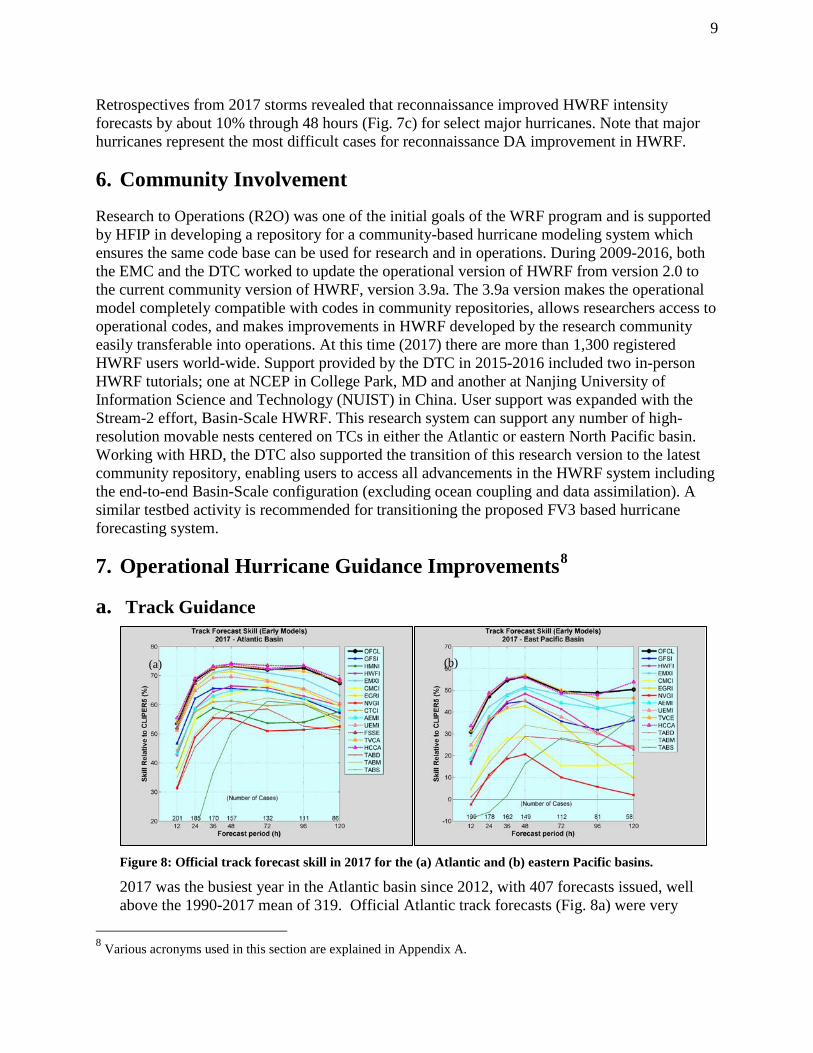
Figure 8: Official track forecast skill in 2017 for the (a) Atlantic and (b) eastern Pacific basins.
2017 was the busiest year in the Atlantic basin since 2012, with 407 forecasts issued, well above the 1990-2017 mean of 319. Official Atlantic track forecasts (Fig. 8a) were very
8 Various acronyms used in this section are explained in Appendix A.
(a) (b)
10
skillful and close to the best-performing consensus aids (FSSE, HCCA, TVCA), among which there was little difference in performance. EMXI was the best dynamical model in 2017, but it was not quite as good, on average, as the NHC official forecast nor the consensus aids, particularly at longer lead times. EGRI and UEMI were the next best models, followed by GFSI, HWFI, AEMI, and CMCI in the middle of the pack. Performing relatively poorly in 2017 were the NVGI, HMNI, and CTCI. In the eastern Pacific (Fig. 8b), the consensus aids HCCA and TVCA led the way with the highest skill. NHC official forecasts were very skillful and close to the performance of the best consensus aids. The best individual model was the EMXI. The GFSI, HWFI, EGRI, and UEMI were in the middle of the pack, followed by HMNI, CMCI and NVGI. Note that the HMNI, a new model for 2017, performed poorly in both basins.
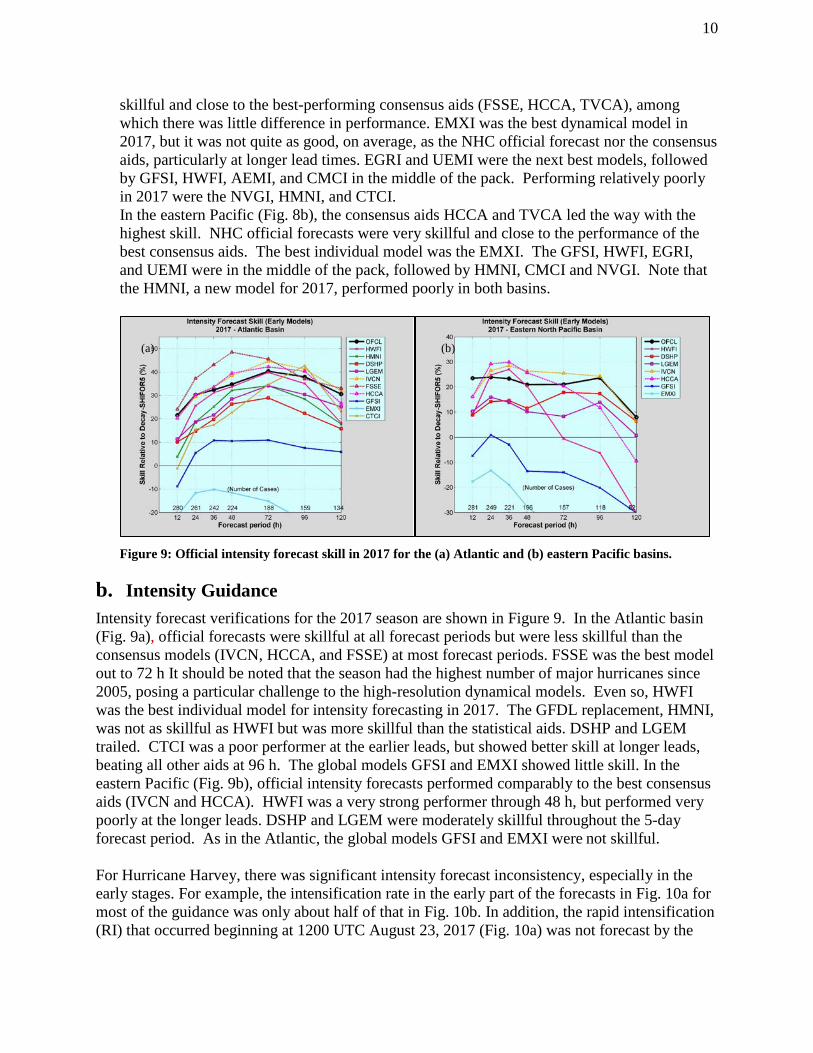
Figure 9: Official intensity forecast skill in 2017 for the (a) Atlantic and (b) eastern Pacific basins.
b. Intensity Guidance Intensity forecast verifications for the 2017 season are shown in Figure 9. In the Atlantic basin (Fig. 9a), official forecasts were skillful at all forecast periods but were less skillful than the consensus models (IVCN, HCCA, and FSSE) at most forecast periods. FSSE was the best model out to 72 h It should be noted that the season had the highest number of major hurricanes since 2005, posing a particular challenge to the high-resolution dynamical models. Even so, HWFI was the best individual model for intensity forecasting in 2017. The GFDL replacement, HMNI, was not as skillful as HWFI but was more skillful than the statistical aids. DSHP and LGEM trailed. CTCI was a poor performer at the earlier leads, but showed better skill at longer leads, beating all other aids at 96 h. The global models GFSI and EMXI showed little skill. In the eastern Pacific (Fig. 9b), official intensity forecasts performed comparably to the best consensus aids (IVCN and HCCA). HWFI was a very strong performer through 48 h, but performed very poorly at the longer leads. DSHP and LGEM were moderately skillful throughout the 5-day forecast period. As in the Atlantic, the global models GFSI and EMXI were not skillful. For Hurricane Harvey, there was significant intensity forecast inconsistency, especially in the early stages. For example, the intensification rate in the early part of the forecasts in Fig. 10a for most of the guidance was only about half of that in Fig. 10b. In addition, the rapid intensification (RI) that occurred beginning at 1200 UTC August 23, 2017 (Fig. 10a) was not forecast by the
(a) (b)
11
guidance. Once the RI was well underway, the models were more successful in anticipating future RI events (e.g., Fig. 10b), and were very successful in all cycles after 1200 UTC on August 24, 2017 (Fig. 10b).
Figure 10: NHC intensity aids (knots, colored lines) for Harvey at (a) 1200 UTC 23 August 2017, and (b) 1200 UTC 24 August 2017. Verifying intensity is shown in white.
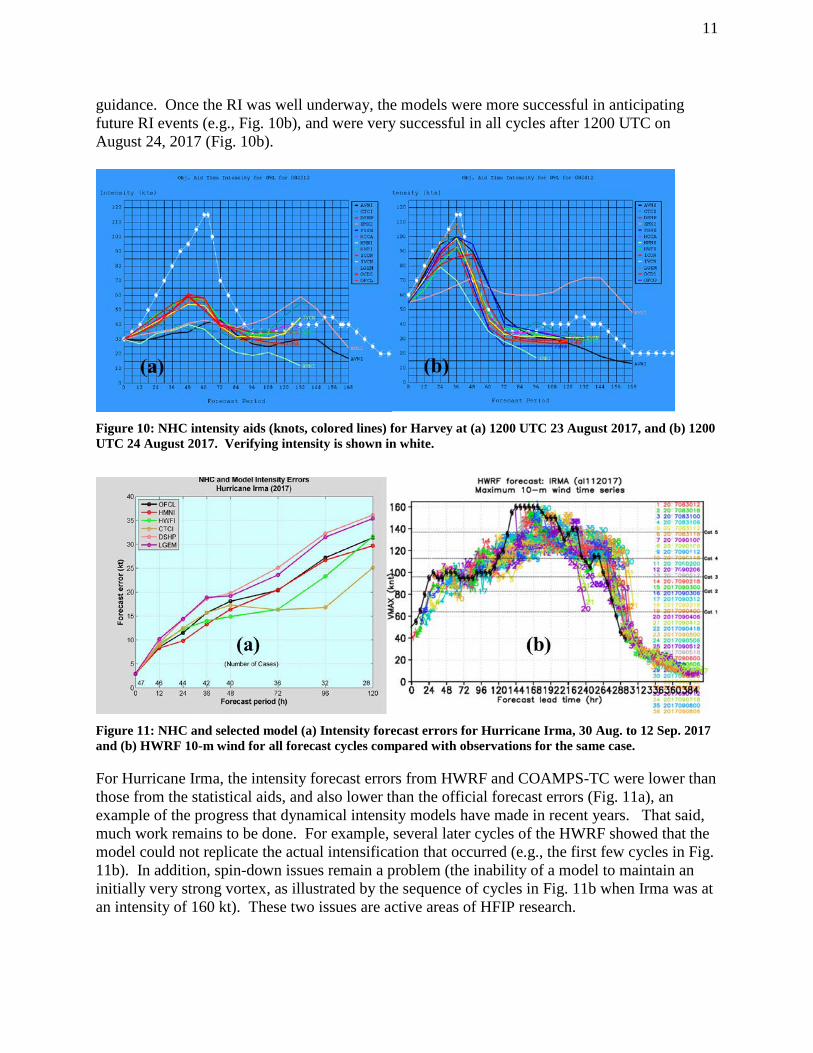
Figure 11: NHC and selected model (a) Intensity forecast errors for Hurricane Irma, 30 Aug. to 12 Sep. 2017 and (b) HWRF 10-m wind for all forecast cycles compared with observations for the same case.
For Hurricane Irma, the intensity forecast errors from HWRF and COAMPS-TC were lower than those from the statistical aids, and also lower than the official forecast errors (Fig. 11a), an example of the progress that dynamical intensity models have made in recent years. That said, much work remains to be done. For example, several later cycles of the HWRF showed that the model could not replicate the actual intensification that occurred (e.g., the first few cycles in Fig. 11b). In addition, spin-down issues remain a problem (the inability of a model to maintain an initially very strong vortex, as illustrated by the sequence of cycles in Fig. 11b when Irma was at an intensity of 160 kt). These two issues are active areas of HFIP research.
12
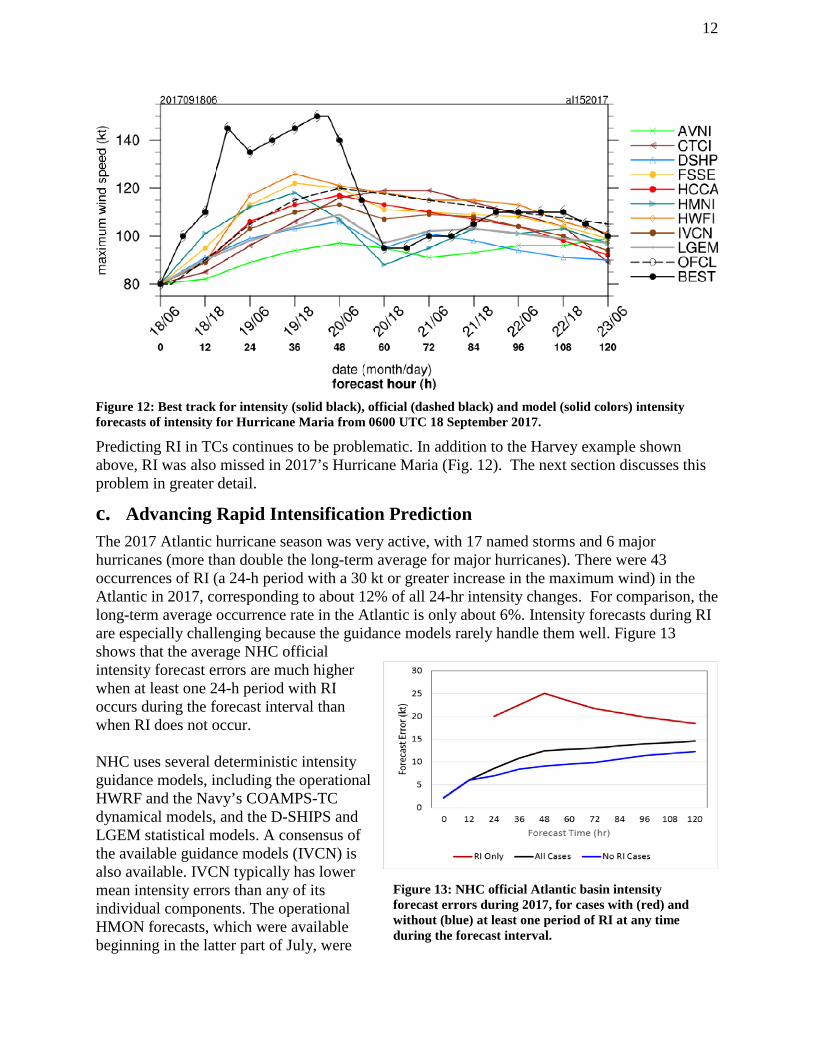
Figure 12: Best track for intensity (solid black), official (dashed black) and model (solid colors) intensity forecasts of intensity for Hurricane Maria from 0600 UTC 18 September 2017.
Predicting RI in TCs continues to be problematic. In addition to the Harvey example shown above, RI was also missed in 2017’s Hurricane Maria (Fig. 12). The next section discusses this problem in greater detail.
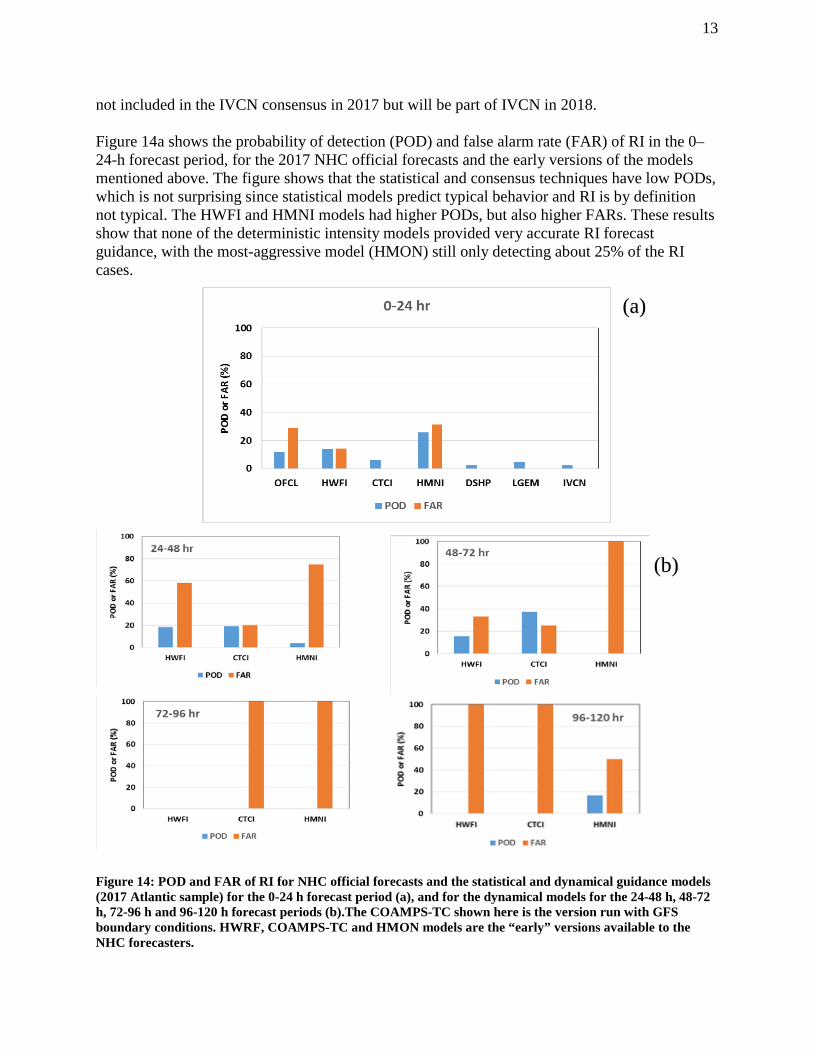
c. Advancing Rapid Intensification Prediction The 2017 Atlantic hurricane season was very active, with 17 named storms and 6 major hurricanes (more than double the long-term average for major hurricanes). There were 43 occurrences of RI (a 24-h period with a 30 kt or greater increase in the maximum wind) in the Atlantic in 2017, corresponding to about 12% of all 24-hr intensity changes. For comparison, the long-term average occurrence rate in the Atlantic is only about 6%. Intensity forecasts during RI are especially challenging because the guidance models rarely handle them well. Figure 13 shows that the average NHC official intensity forecast errors are much higher when at least one 24-h period with RI occurs during the forecast interval than when RI does not occur. NHC uses several deterministic intensity guidance models, including the operational HWRF and the Navy’s COAMPS-TC dynamical models, and the D-SHIPS and LGEM statistical models. A consensus of the available guidance models (IVCN) is also available. IVCN typically has lower mean intensity errors than any of its individual components. The operational HMON forecasts, which were available beginning in the latter part of July, were
Figure 13: NHC official Atlantic basin intensity forecast errors during 2017, for cases with (red) and without (blue) at least one period of RI at any time during the forecast interval.
13
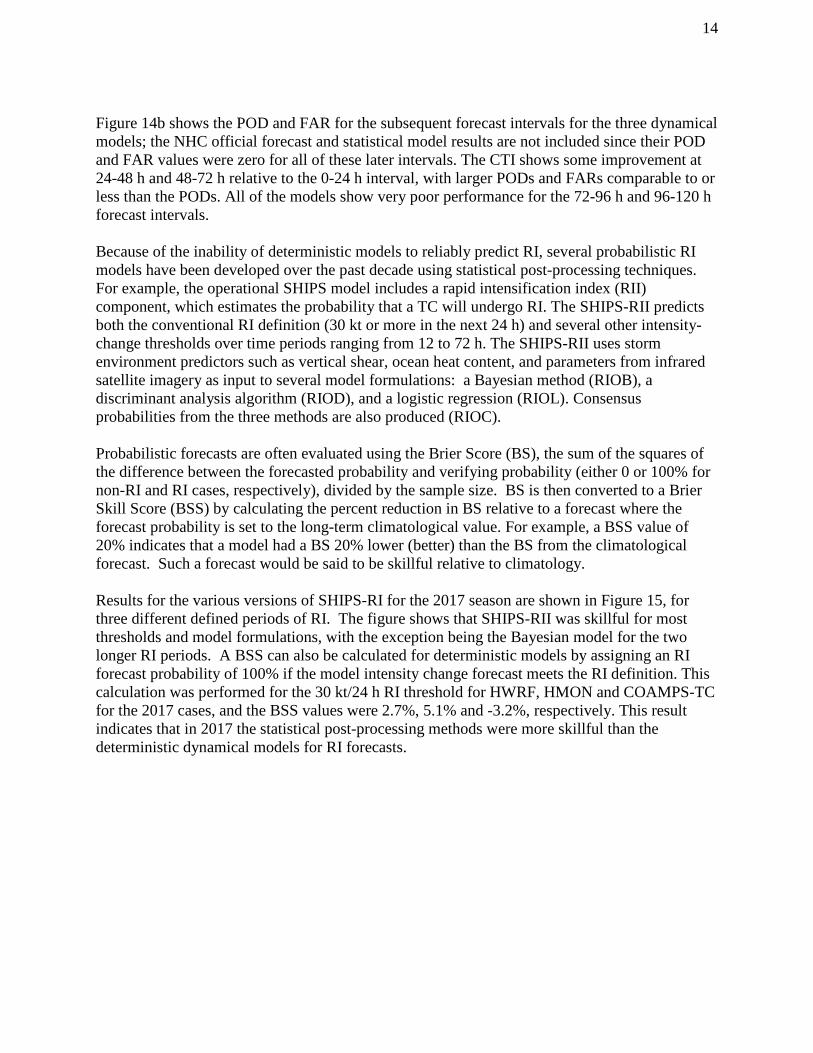
not included in the IVCN consensus in 2017 but will be part of IVCN in 2018. Figure 14a shows the probability of detection (POD) and false alarm rate (FAR) of RI in the 0–24-h forecast period, for the 2017 NHC official forecasts and the early versions of the models mentioned above. The figure shows that the statistical and consensus techniques have low PODs, which is not surprising since statistical models predict typical behavior and RI is by definition not typical. The HWFI and HMNI models had higher PODs, but also higher FARs. These results show that none of the deterministic intensity models provided very accurate RI forecast guidance, with the most-aggressive model (HMON) still only detecting about 25% of the RI cases.
Figure 14: POD and FAR of RI for NHC official forecasts and the statistical and dynamical guidance models (2017 Atlantic sample) for the 0-24 h forecast period (a), and for the dynamical models for the 24-48 h, 48-72 h, 72-96 h and 96-120 h forecast periods (b).The COAMPS-TC shown here is the version run with GFS boundary conditions. HWRF, COAMPS-TC and HMON models are the “early” versions available to the NHC forecasters.
(a)
(b)
14
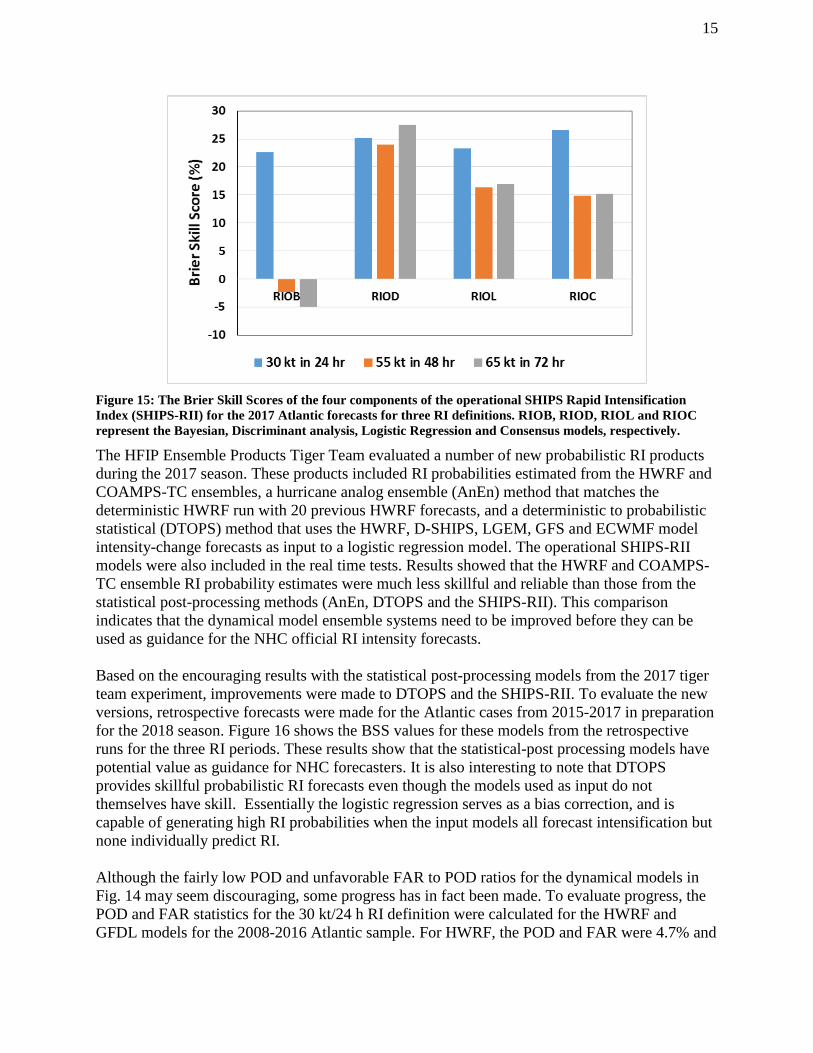
Figure 14b shows the POD and FAR for the subsequent forecast intervals for the three dynamical models; the NHC official forecast and statistical model results are not included since their POD and FAR values were zero for all of these later intervals. The CTI shows some improvement at 24-48 h and 48-72 h relative to the 0-24 h interval, with larger PODs and FARs comparable to or less than the PODs. All of the models show very poor performance for the 72-96 h and 96-120 h forecast intervals. Because of the inability of deterministic models to reliably predict RI, several probabilistic RI models have been developed over the past decade using statistical post-processing techniques. For example, the operational SHIPS model includes a rapid intensification index (RII) component, which estimates the probability that a TC will undergo RI. The SHIPS-RII predicts both the conventional RI definition (30 kt or more in the next 24 h) and several other intensity-change thresholds over time periods ranging from 12 to 72 h. The SHIPS-RII uses storm environment predictors such as vertical shear, ocean heat content, and parameters from infrared satellite imagery as input to several model formulations: a Bayesian method (RIOB), a discriminant analysis algorithm (RIOD), and a logistic regression (RIOL). Consensus probabilities from the three methods are also produced (RIOC). Probabilistic forecasts are often evaluated using the Brier Score (BS), the sum of the squares of the difference between the forecasted probability and verifying probability (either 0 or 100% for non-RI and RI cases, respectively), divided by the sample size. BS is then converted to a Brier Skill Score (BSS) by calculating the percent reduction in BS relative to a forecast where the forecast probability is set to the long-term climatological value. For example, a BSS value of 20% indicates that a model had a BS 20% lower (better) than the BS from the climatological forecast. Such a forecast would be said to be skillful relative to climatology. Results for the various versions of SHIPS-RI for the 2017 season are shown in Figure 15, for three different defined periods of RI. The figure shows that SHIPS-RII was skillful for most thresholds and model formulations, with the exception being the Bayesian model for the two longer RI periods. A BSS can also be calculated for deterministic models by assigning an RI forecast probability of 100% if the model intensity change forecast meets the RI definition. This calculation was performed for the 30 kt/24 h RI threshold for HWRF, HMON and COAMPS-TC for the 2017 cases, and the BSS values were 2.7%, 5.1% and -3.2%, respectively. This result indicates that in 2017 the statistical post-processing methods were more skillful than the deterministic dynamical models for RI forecasts.
15
Figure 15: The Brier Skill Scores of the four components of the operational SHIPS Rapid Intensification Index (SHIPS-RII) for the 2017 Atlantic forecasts for three RI definitions. RIOB, RIOD, RIOL and RIOC represent the Bayesian, Discriminant analysis, Logistic Regression and Consensus models, respectively.
The HFIP Ensemble Products Tiger Team evaluated a number of new probabilistic RI products during the 2017 season. These products included RI probabilities estimated from the HWRF and COAMPS-TC ensembles, a hurricane analog ensemble (AnEn) method that matches the deterministic HWRF run with 20 previous HWRF forecasts, and a deterministic to probabilistic statistical (DTOPS) method that uses the HWRF, D-SHIPS, LGEM, GFS and ECWMF model intensity-change forecasts as input to a logistic regression model. The operational SHIPS-RII models were also included in the real time tests. Results showed that the HWRF and COAMPS-TC ensemble RI probability estimates were much less skillful and reliable than those from the statistical post-processing methods (AnEn, DTOPS and the SHIPS-RII). This comparison indicates that the dynamical model ensemble systems need to be improved before they can be used as guidance for the NHC official RI intensity forecasts. Based on the encouraging results with the statistical post-processing models from the 2017 tiger team experiment, improvements were made to DTOPS and the SHIPS-RII. To evaluate the new versions, retrospective forecasts were made for the Atlantic cases from 2015-2017 in preparation for the 2018 season. Figure 16 shows the BSS values for these models from the retrospective runs for the three RI periods. These results show that the statistical-post processing models have potential value as guidance for NHC forecasters. It is also interesting to note that DTOPS provides skillful probabilistic RI forecasts even though the models used as input do not themselves have skill. Essentially the logistic regression serves as a bias correction, and is capable of generating high RI probabilities when the input models all forecast intensification but none individually predict RI. Although the fairly low POD and unfavorable FAR to POD ratios for the dynamical models in Fig. 14 may seem discouraging, some progress has in fact been made. To evaluate progress, the POD and FAR statistics for the 30 kt/24 h RI definition were calculated for the HWRF and GFDL models for the 2008-2016 Atlantic sample. For HWRF, the POD and FAR were 4.7% and
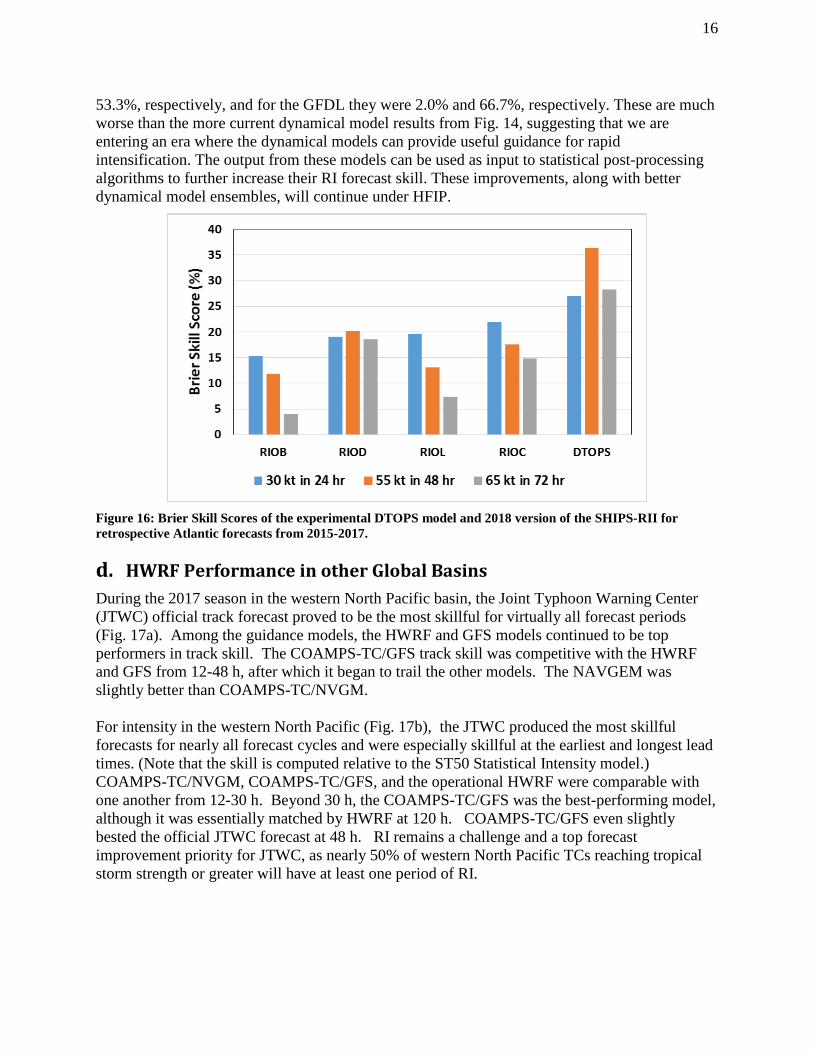
16
53.3%, respectively, and for the GFDL they were 2.0% and 66.7%, respectively. These are much worse than the more current dynamical model results from Fig. 14, suggesting that we are entering an era where the dynamical models can provide useful guidance for rapid intensification. The output from these models can be used as input to statistical post-processing algorithms to further increase their RI forecast skill. These improvements, along with better dynamical model ensembles, will continue under HFIP.
Figure 16: Brier Skill Scores of the experimental DTOPS model and 2018 version of the SHIPS-RII for retrospective Atlantic forecasts from 2015-2017.
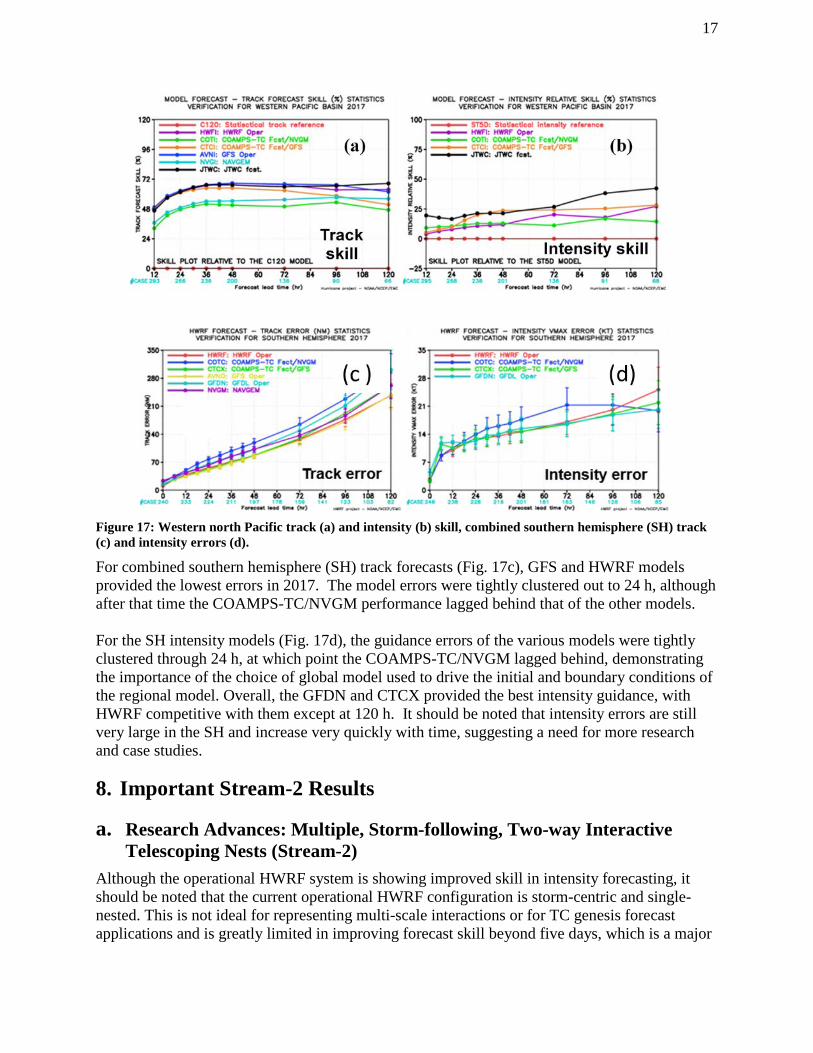
d. HWRF Performance in other Global Basins During the 2017 season in the western North Pacific basin, the Joint Typhoon Warning Center (JTWC) official track forecast proved to be the most skillful for virtually all forecast periods (Fig. 17a). Among the guidance models, the HWRF and GFS models continued to be top performers in track skill. The COAMPS-TC/GFS track skill was competitive with the HWRF and GFS from 12-48 h, after which it began to trail the other models. The NAVGEM was slightly better than COAMPS-TC/NVGM. For intensity in the western North Pacific (Fig. 17b), the JTWC produced the most skillful forecasts for nearly all forecast cycles and were especially skillful at the earliest and longest lead times. (Note that the skill is computed relative to the ST50 Statistical Intensity model.) COAMPS-TC/NVGM, COAMPS-TC/GFS, and the operational HWRF were comparable with one another from 12-30 h. Beyond 30 h, the COAMPS-TC/GFS was the best-performing model, although it was essentially matched by HWRF at 120 h. COAMPS-TC/GFS even slightly bested the official JTWC forecast at 48 h. RI remains a challenge and a top forecast improvement priority for JTWC, as nearly 50% of western North Pacific TCs reaching tropical storm strength or greater will have at least one period of RI.
17
Figure 17: Western north Pacific track (a) and intensity (b) skill, combined southern hemisphere (SH) track (c) and intensity errors (d).
For combined southern hemisphere (SH) track forecasts (Fig. 17c), GFS and HWRF models provided the lowest errors in 2017. The model errors were tightly clustered out to 24 h, although after that time the COAMPS-TC/NVGM performance lagged behind that of the other models. For the SH intensity models (Fig. 17d), the guidance errors of the various models were tightly clustered through 24 h, at which point the COAMPS-TC/NVGM lagged behind, demonstrating the importance of the choice of global model used to drive the initial and boundary conditions of the regional model. Overall, the GFDN and CTCX provided the best intensity guidance, with HWRF competitive with them except at 120 h. It should be noted that intensity errors are still very large in the SH and increase very quickly with time, suggesting a need for more research and case studies.
8. Important Stream-2 Results
a. Research Advances: Multiple, Storm-following, Two-way Interactive Telescoping Nests (Stream-2)
Although the operational HWRF system is showing improved skill in intensity forecasting, it should be noted that the current operational HWRF configuration is storm-centric and single-nested. This is not ideal for representing multi-scale interactions or for TC genesis forecast applications and is greatly limited in improving forecast skill beyond five days, which is a major
18
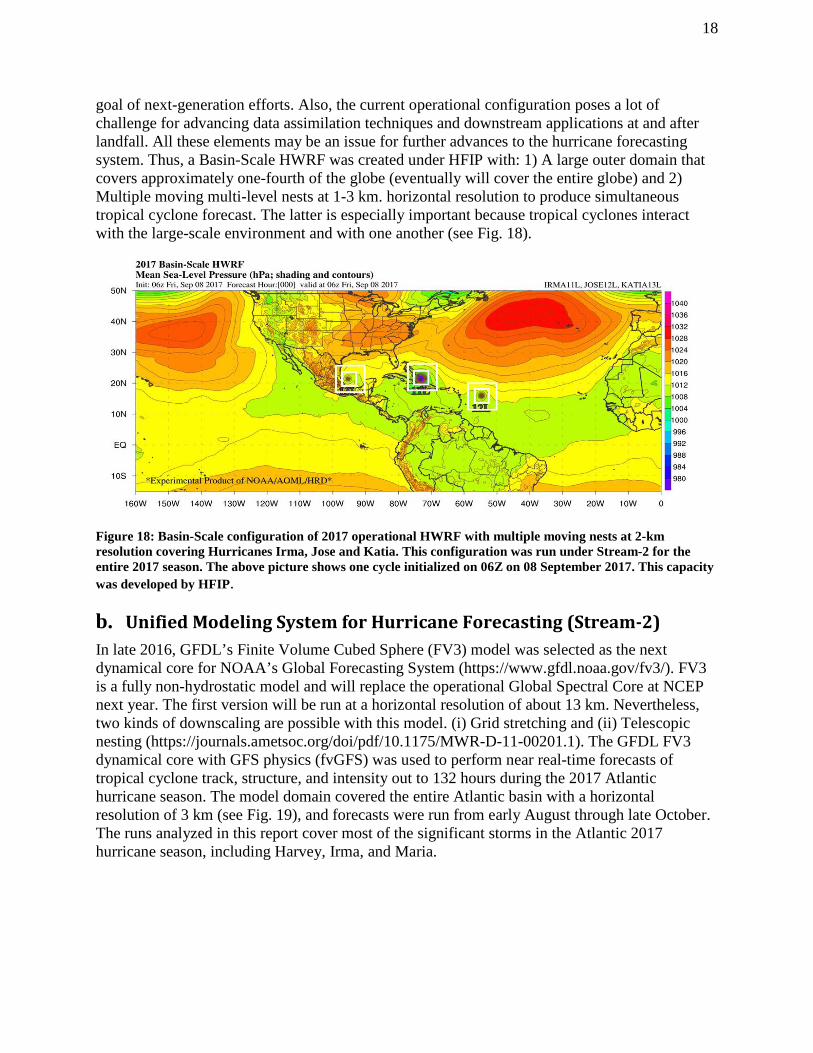
goal of next-generation efforts. Also, the current operational configuration poses a lot of challenge for advancing data assimilation techniques and downstream applications at and after landfall. All these elements may be an issue for further advances to the hurricane forecasting system. Thus, a Basin-Scale HWRF was created under HFIP with: 1) A large outer domain that covers approximately one-fourth of the globe (eventually will cover the entire globe) and 2) Multiple moving multi-level nests at 1-3 km. horizontal resolution to produce simultaneous tropical cyclone forecast. The latter is especially important because tropical cyclones interact with the large-scale environment and with one another (see Fig. 18).
Figure 18: Basin-Scale configuration of 2017 operational HWRF with multiple moving nests at 2-km resolution covering Hurricanes Irma, Jose and Katia. This configuration was run under Stream-2 for the entire 2017 season. The above picture shows one cycle initialized on 06Z on 08 September 2017. This capacity was developed by HFIP.
b. Unified Modeling System for Hurricane Forecasting (Stream-2) In late 2016, GFDL’s Finite Volume Cubed Sphere (FV3) model was selected as the next dynamical core for NOAA’s Global Forecasting System (https://www.gfdl.noaa.gov/fv3/). FV3 is a fully non-hydrostatic model and will replace the operational Global Spectral Core at NCEP next year. The first version will be run at a horizontal resolution of about 13 km. Nevertheless, two kinds of downscaling are possible with this model. (i) Grid stretching and (ii) Telescopic nesting (https://journals.ametsoc.org/doi/pdf/10.1175/MWR-D-11-00201.1). The GFDL FV3 dynamical core with GFS physics (fvGFS) was used to perform near real-time forecasts of tropical cyclone track, structure, and intensity out to 132 hours during the 2017 Atlantic hurricane season. The model domain covered the entire Atlantic basin with a horizontal resolution of 3 km (see Fig. 19), and forecasts were run from early August through late October. The runs analyzed in this report cover most of the significant storms in the Atlantic 2017 hurricane season, including Harvey, Irma, and Maria.
19
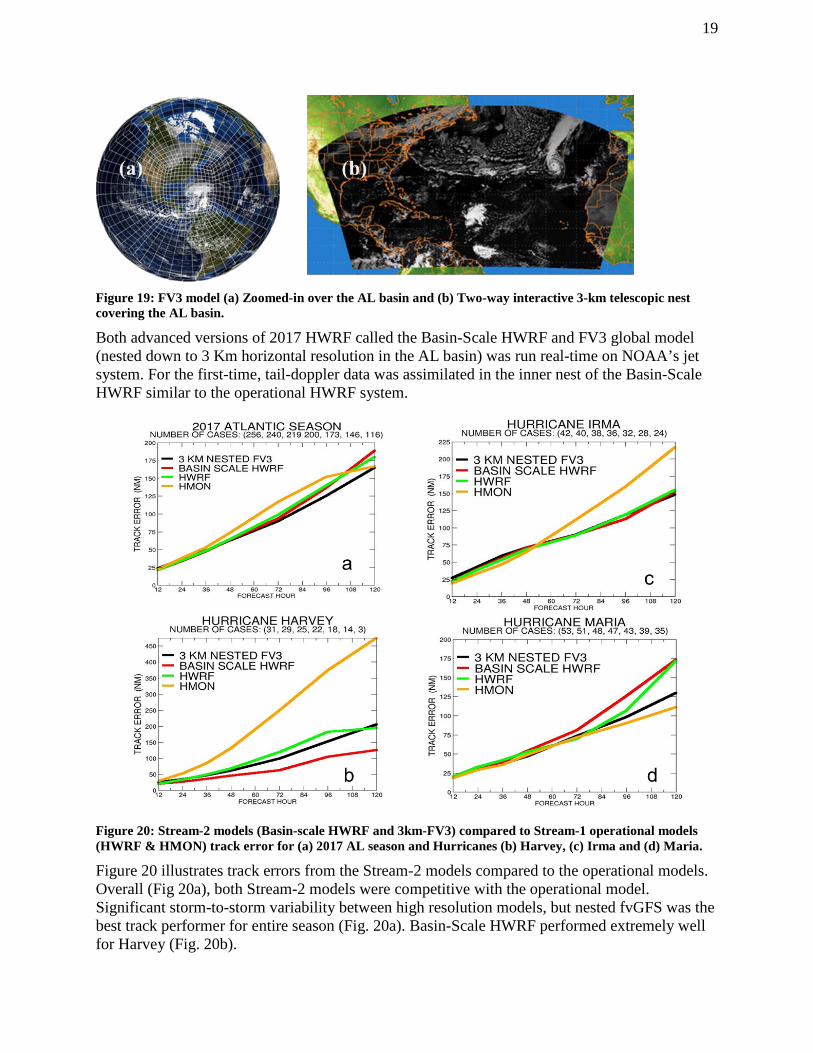
Figure 19: FV3 model (a) Zoomed-in over the AL basin and (b) Two-way interactive 3-km telescopic nest covering the AL basin.
Both advanced versions of 2017 HWRF called the Basin-Scale HWRF and FV3 global model (nested down to 3 Km horizontal resolution in the AL basin) was run real-time on NOAA’s jet system. For the first-time, tail-doppler data was assimilated in the inner nest of the Basin-Scale HWRF similar to the operational HWRF system.
Figure 20: Stream-2 models (Basin-scale HWRF and 3km-FV3) compared to Stream-1 operational models (HWRF & HMON) track error for (a) 2017 AL season and Hurricanes (b) Harvey, (c) Irma and (d) Maria.
Figure 20 illustrates track errors from the Stream-2 models compared to the operational models. Overall (Fig 20a), both Stream-2 models were competitive with the operational model. Significant storm-to-storm variability between high resolution models, but nested fvGFS was the best track performer for entire season (Fig. 20a). Basin-Scale HWRF performed extremely well for Harvey (Fig. 20b).
20
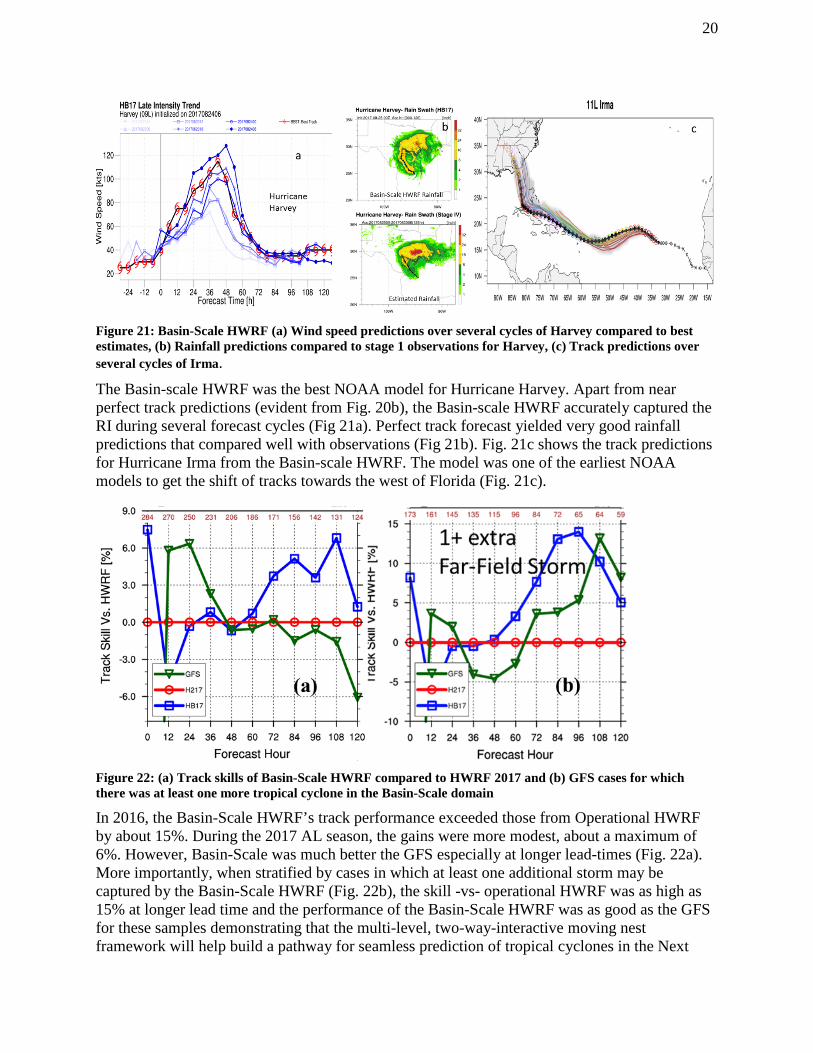
Figure 21: Basin-Scale HWRF (a) Wind speed predictions over several cycles of Harvey compared to best estimates, (b) Rainfall predictions compared to stage 1 observations for Harvey, (c) Track predictions over several cycles of Irma.
The Basin-scale HWRF was the best NOAA model for Hurricane Harvey. Apart from near perfect track predictions (evident from Fig. 20b), the Basin-scale HWRF accurately captured the RI during several forecast cycles (Fig 21a). Perfect track forecast yielded very good rainfall predictions that compared well with observations (Fig 21b). Fig. 21c shows the track predictions for Hurricane Irma from the Basin-scale HWRF. The model was one of the earliest NOAA models to get the shift of tracks towards the west of Florida (Fig. 21c).
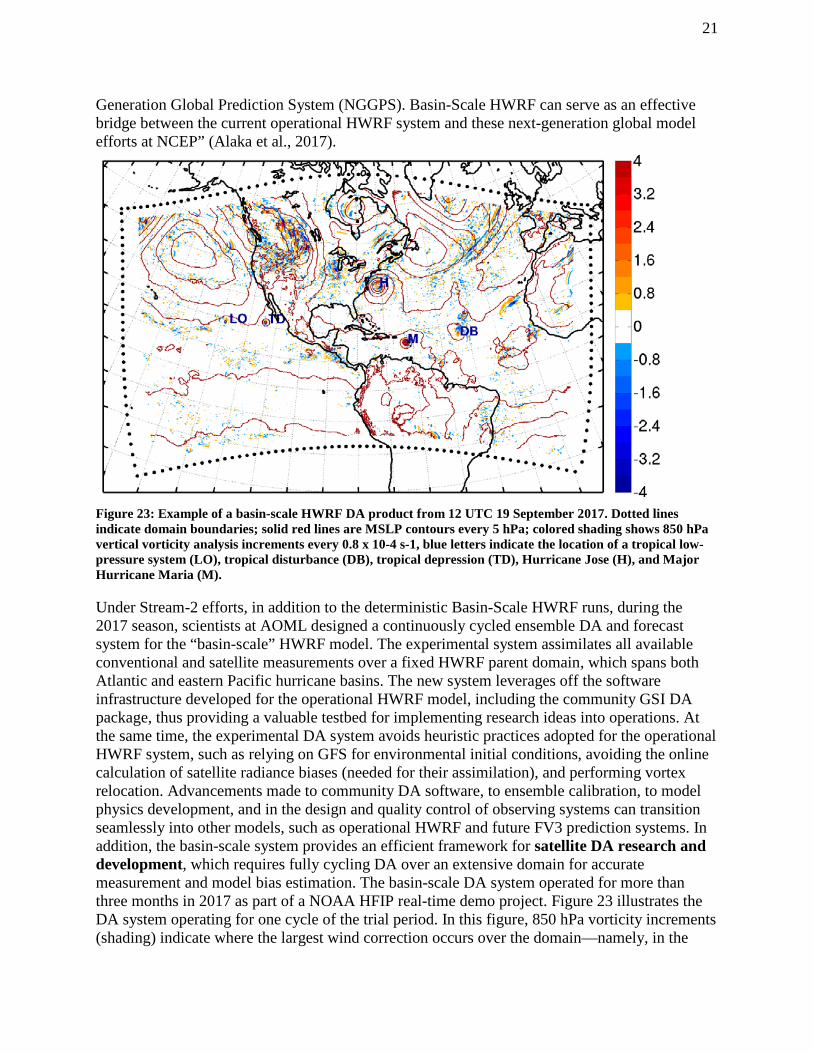
Figure 22: (a) Track skills of Basin-Scale HWRF compared to HWRF 2017 and (b) GFS cases for which there was at least one more tropical cyclone in the Basin-Scale domain In 2016, the Basin-Scale HWRF’s track performance exceeded those from Operational HWRF by about 15%. During the 2017 AL season, the gains were more modest, about a maximum of 6%. However, Basin-Scale was much better the GFS especially at longer lead-times (Fig. 22a). More importantly, when stratified by cases in which at least one additional storm may be captured by the Basin-Scale HWRF (Fig. 22b), the skill -vs- operational HWRF was as high as 15% at longer lead time and the performance of the Basin-Scale HWRF was as good as the GFS for these samples demonstrating that the multi-level, two-way-interactive moving nest framework will help build a pathway for seamless prediction of tropical cyclones in the Next
21
Generation Global Prediction System (NGGPS). Basin-Scale HWRF can serve as an effective bridge between the current operational HWRF system and these next-generation global model efforts at NCEP” (Alaka et al., 2017).
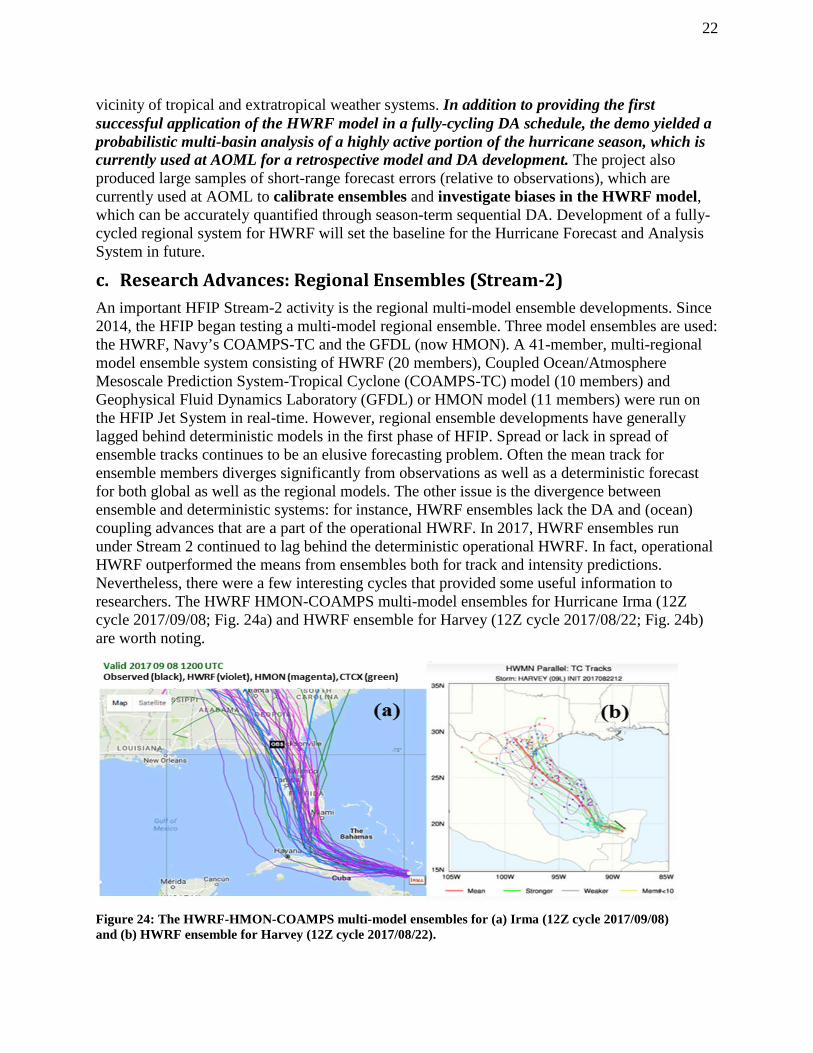
Figure 23: Example of a basin-scale HWRF DA product from 12 UTC 19 September 2017. Dotted lines indicate domain boundaries; solid red lines are MSLP contours every 5 hPa; colored shading shows 850 hPa vertical vorticity analysis increments every 0.8 x 10⁻⁴ s-1, blue letters indicate the location of a tropical low-pressure system (LO), tropical disturbance (DB), tropical depression (TD), Hurricane Jose (H), and Major Hurricane Maria (M).
Under Stream-2 efforts, in addition to the deterministic Basin-Scale HWRF runs, during the 2017 season, scientists at AOML designed a continuously cycled ensemble DA and forecast system for the “basin-scale” HWRF model. The experimental system assimilates all available conventional and satellite measurements over a fixed HWRF parent domain, which spans both Atlantic and eastern Pacific hurricane basins. The new system leverages off the software infrastructure developed for the operational HWRF model, including the community GSI DA package, thus providing a valuable testbed for implementing research ideas into operations. At the same time, the experimental DA system avoids heuristic practices adopted for the operational HWRF system, such as relying on GFS for environmental initial conditions, avoiding the online calculation of satellite radiance biases (needed for their assimilation), and performing vortex relocation. Advancements made to community DA software, to ensemble calibration, to model physics development, and in the design and quality control of observing systems can transition seamlessly into other models, such as operational HWRF and future FV3 prediction systems. In addition, the basin-scale system provides an efficient framework for satellite DA research and development, which requires fully cycling DA over an extensive domain for accurate measurement and model bias estimation. The basin-scale DA system operated for more than three months in 2017 as part of a NOAA HFIP real-time demo project. Figure 23 illustrates the DA system operating for one cycle of the trial period. In this figure, 850 hPa vorticity increments (shading) indicate where the largest wind correction occurs over the domain—namely, in the
22
vicinity of tropical and extratropical weather systems. In addition to providing the first successful application of the HWRF model in a fully-cycling DA schedule, the demo yielded a probabilistic multi-basin analysis of a highly active portion of the hurricane season, which is currently used at AOML for a retrospective model and DA development. The project also produced large samples of short-range forecast errors (relative to observations), which are currently used at AOML to calibrate ensembles and investigate biases in the HWRF model, which can be accurately quantified through season-term sequential DA. Development of a fully-cycled regional system for HWRF will set the baseline for the Hurricane Forecast and Analysis System in future.
c. Research Advances: Regional Ensembles (Stream-2) An important HFIP Stream-2 activity is the regional multi-model ensemble developments. Since 2014, the HFIP began testing a multi-model regional ensemble. Three model ensembles are used: the HWRF, Navy’s COAMPS-TC and the GFDL (now HMON). A 41-member, multi-regional model ensemble system consisting of HWRF (20 members), Coupled Ocean/Atmosphere Mesoscale Prediction System-Tropical Cyclone (COAMPS-TC) model (10 members) and Geophysical Fluid Dynamics Laboratory (GFDL) or HMON model (11 members) were run on the HFIP Jet System in real-time. However, regional ensemble developments have generally lagged behind deterministic models in the first phase of HFIP. Spread or lack in spread of ensemble tracks continues to be an elusive forecasting problem. Often the mean track for ensemble members diverges significantly from observations as well as a deterministic forecast for both global as well as the regional models. The other issue is the divergence between ensemble and deterministic systems: for instance, HWRF ensembles lack the DA and (ocean) coupling advances that are a part of the operational HWRF. In 2017, HWRF ensembles run under Stream 2 continued to lag behind the deterministic operational HWRF. In fact, operational HWRF outperformed the means from ensembles both for track and intensity predictions. Nevertheless, there were a few interesting cycles that provided some useful information to researchers. The HWRF HMON-COAMPS multi-model ensembles for Hurricane Irma (12Z cycle 2017/09/08; Fig. 24a) and HWRF ensemble for Harvey (12Z cycle 2017/08/22; Fig. 24b) are worth noting.
Figure 24: The HWRF-HMON-COAMPS multi-model ensembles for (a) Irma (12Z cycle 2017/09/08) and (b) HWRF ensemble for Harvey (12Z cycle 2017/08/22).
23
9. New Products, Tools, and Services at NHC
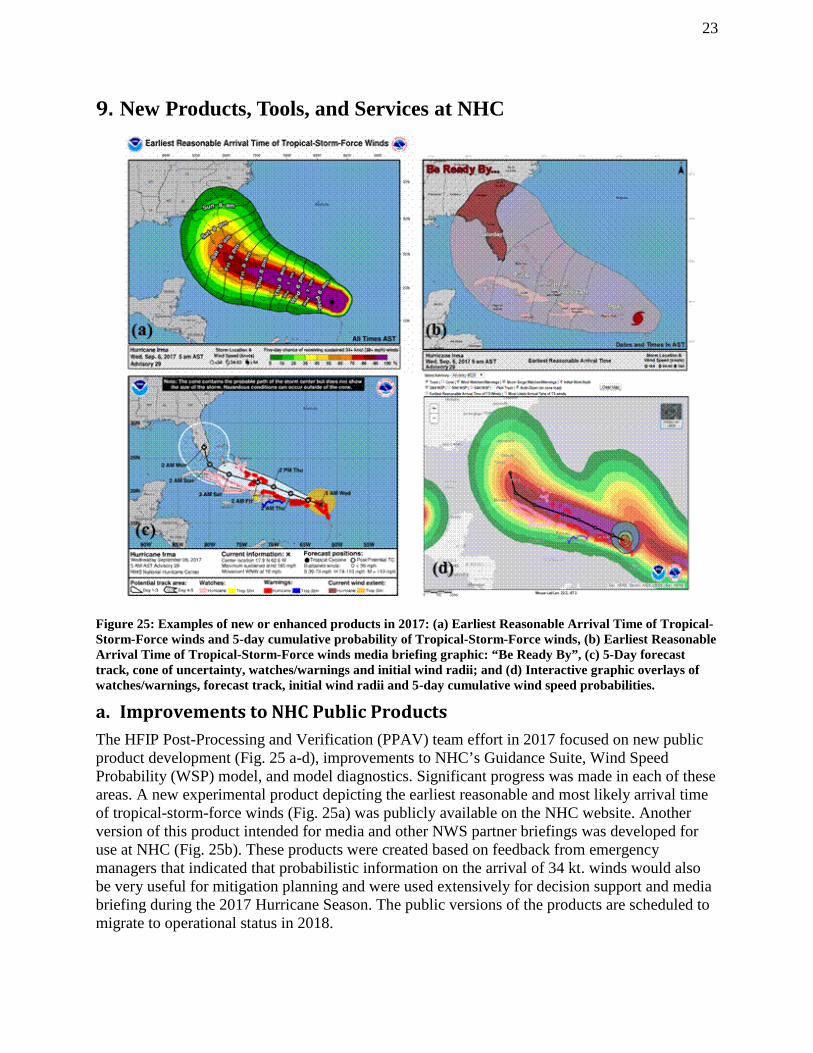
Figure 25: Examples of new or enhanced products in 2017: (a) Earliest Reasonable Arrival Time of Tropical- Storm-Force winds and 5-day cumulative probability of Tropical-Storm-Force winds, (b) Earliest Reasonable Arrival Time of Tropical-Storm-Force winds media briefing graphic: “Be Ready By”, (c) 5-Day forecast track, cone of uncertainty, watches/warnings and initial wind radii; and (d) Interactive graphic overlays of watches/warnings, forecast track, initial wind radii and 5-day cumulative wind speed probabilities.
a. Improvements to NHC Public Products The HFIP Post-Processing and Verification (PPAV) team effort in 2017 focused on new public product development (Fig. 25 a-d), improvements to NHC’s Guidance Suite, Wind Speed Probability (WSP) model, and model diagnostics. Significant progress was made in each of these areas. A new experimental product depicting the earliest reasonable and most likely arrival time of tropical-storm-force winds (Fig. 25a) was publicly available on the NHC website. Another version of this product intended for media and other NWS partner briefings was developed for use at NHC (Fig. 25b). These products were created based on feedback from emergency managers that indicated that probabilistic information on the arrival of 34 kt. winds would also be very useful for mitigation planning and were used extensively for decision support and media briefing during the 2017 Hurricane Season. The public versions of the products are scheduled to migrate to operational status in 2018.
24
Two further improvements to the wind speed probabilities were investigated in 2017. A method for computing tracks based on dynamical, rather than statistical, guidance was tested and found to be more skillful. In addition, the modification of the tropical cyclone wind field over land was improved, to better account for the decrease of winds over land areas. The new method for representing land interactions will result in a more realistic representation of the wind speed probabilities over land when implemented operationally in 2018.
The existing NHC graphical product suite was also upgraded, allowing NHC to produce all graphical products on a common map for the first time. This upgrade allowed NHC to overlay the initial wind radii over the cone of uncertainty to provide a visual indication of storm size (Fig. 25c). NHC’s GIS product suite was also updated and a number of new GIS products were available in 2017, including wind radii km files. The GIS upgrades also led to improvements in NHC’s interactive graphical products, allowing users to overlay information such as storm surge watches and warnings with the initial wind radii or wind speed probabilities (Fig. 25d).
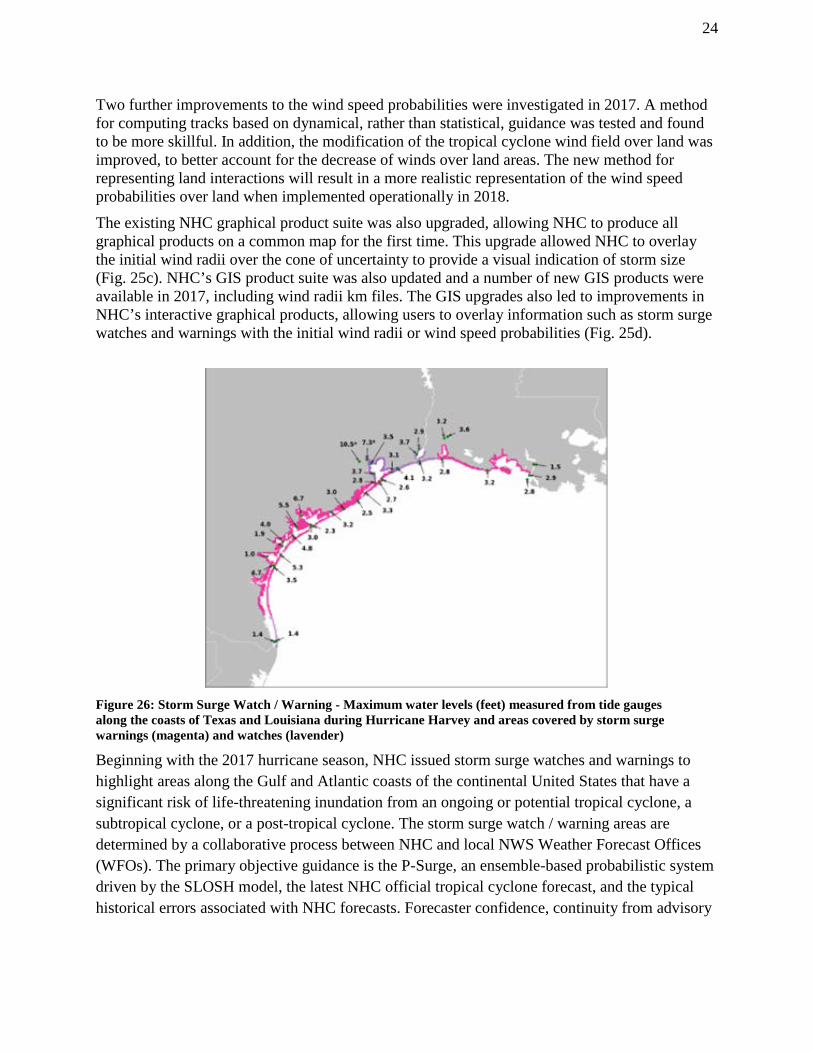
Figure 26: Storm Surge Watch / Warning - Maximum water levels (feet) measured from tide gauges along the coasts of Texas and Louisiana during Hurricane Harvey and areas covered by storm surge warnings (magenta) and watches (lavender) Beginning with the 2017 hurricane season, NHC issued storm surge watches and warnings to highlight areas along the Gulf and Atlantic coasts of the continental United States that have a significant risk of life-threatening inundation from an ongoing or potential tropical cyclone, a subtropical cyclone, or a post-tropical cyclone. The storm surge watch / warning areas are determined by a collaborative process between NHC and local NWS Weather Forecast Offices (WFOs). The primary objective guidance is the P-Surge, an ensemble-based probabilistic system driven by the SLOSH model, the latest NHC official tropical cyclone forecast, and the typical historical errors associated with NHC forecasts. Forecaster confidence, continuity from advisory
25
to advisory, and other subjective factors help determine the areas placed under a watch or warning (Fig. 26).
b. Improvements to Forecaster Guidance and Visualization Another major milestone in 2017 was the continued development of the HFIP Corrected Consensus Approach (HCCA) model. The HCCA technique creates an unequally weighted consensus forecast from many independent models based on historical performance and biases; and was among the best operational guidance available to NHC forecasters in 2017 (Fig’s. 8 and 9). Accomplishments in 2017 included conducting input model sensitivity experiments, identifying and correcting for input model outlier forecasts, and extending the track forecast to seven days on an experimental basis. In addition to the aforementioned improvements to the statistical rapid intensification guidance, improvements were also made to the statistical-dynamical models SHIPS (DSHP) and LGEM. Data from the new GOES-16 satellite was tested in preparation of that satellite becoming the operational GOES-East satellite in 2018. The developmental database was expanded to include 2016 for the Atlantic and eastern North Pacific; and expanded back for other global basins. Finally, several updates were applied to the Statistical Prediction of Intensity from a Consensus Ensemble (SPICE) model, including beginning ingest of the HMON model and experimenting with the COAMPS-TC and NAVGEM models. The PPAV team also developed and maintained several web-based tools for visualizing real-time and historical model forecasts. The real-time HFIP products web page (www.hfip.org/products) was available to the community throughout the 2017 hurricane season, and new guidance from the Rapid Intensification Tiger Team was added to that site. A new interface for displaying track, intensity, and size forecasts was also developed (www.hfip.org/nhc-display). This system allows users to see satellite or aircraft-based analyses of tropical cyclone location, strength, and size in real-time, in addition to NHC and model forecasts. A localized version of this tool is scheduled for implementation at NHC in 2018 that will be used for situational awareness and research purposes.
26
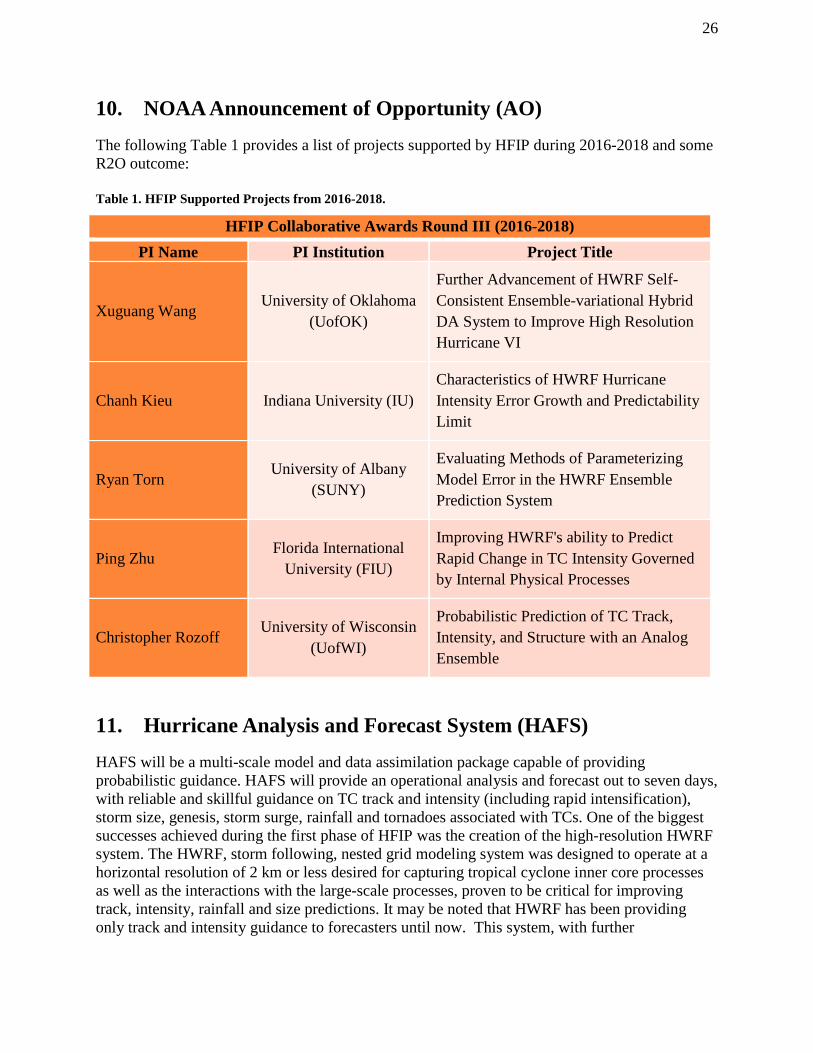
10. NOAA Announcement of Opportunity (AO) The following Table 1 provides a list of projects supported by HFIP during 2016-2018 and some R2O outcome: Table 1. HFIP Supported Projects from 2016-2018.
HFIP Collaborative Awards Round III (2016-2018) PI Name PI Institution Project Title
Xuguang Wang
University of Oklahoma
(UofOK)
Further Advancement of HWRF Self-Consistent Ensemble-variational Hybrid DA System to Improve High Resolution Hurricane VI
Chanh Kieu Indiana University (IU) Characteristics of HWRF Hurricane Intensity Error Growth and Predictability Limit
Ryan Torn University of Albany
(SUNY)
Evaluating Methods of Parameterizing Model Error in the HWRF Ensemble Prediction System
Ping Zhu Florida International
University (FIU)
Improving HWRF's ability to Predict Rapid Change in TC Intensity Governed by Internal Physical Processes
Christopher Rozoff University of Wisconsin
(UofWI)
Probabilistic Prediction of TC Track, Intensity, and Structure with an Analog Ensemble
11. Hurricane Analysis and Forecast System (HAFS) HAFS will be a multi-scale model and data assimilation package capable of providing probabilistic guidance. HAFS will provide an operational analysis and forecast out to seven days, with reliable and skillful guidance on TC track and intensity (including rapid intensification), storm size, genesis, storm surge, rainfall and tornadoes associated with TCs. One of the biggest successes achieved during the first phase of HFIP was the creation of the high-resolution HWRF system. The HWRF, storm following, nested grid modeling system was designed to operate at a horizontal resolution of 2 km or less desired for capturing tropical cyclone inner core processes as well as the interactions with the large-scale processes, proven to be critical for improving track, intensity, rainfall and size predictions. It may be noted that HWRF has been providing only track and intensity guidance to forecasters until now. This system, with further
27
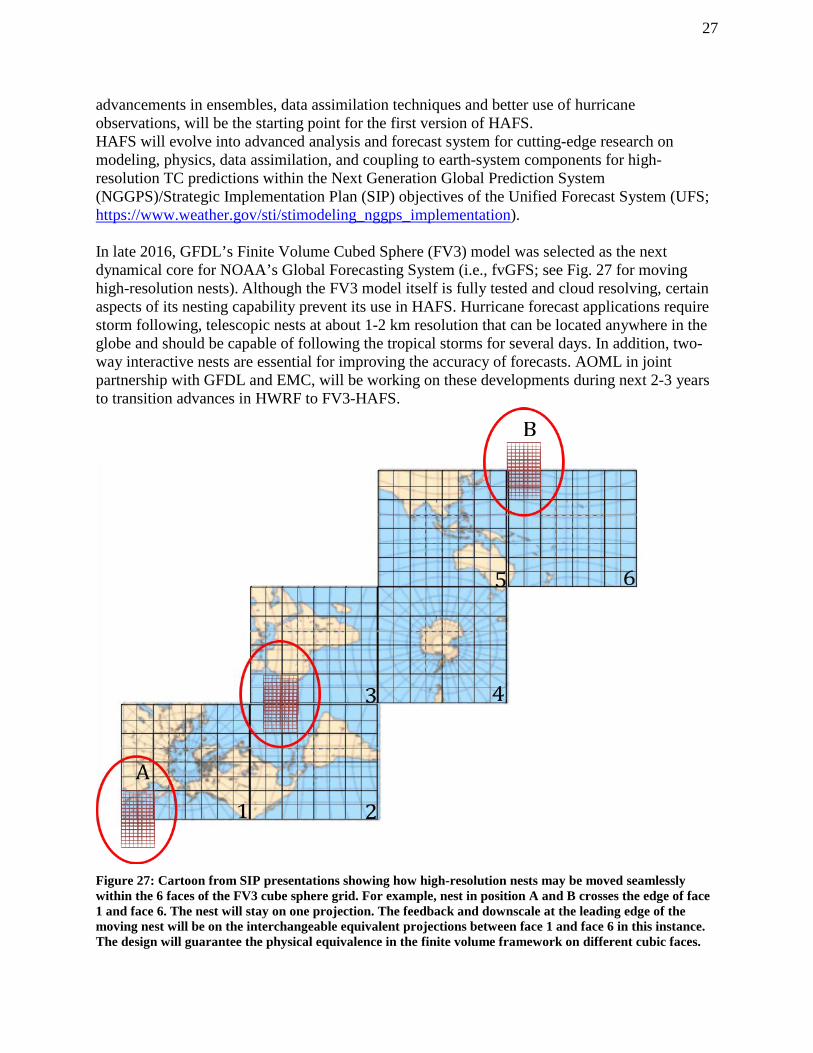
advancements in ensembles, data assimilation techniques and better use of hurricane observations, will be the starting point for the first version of HAFS. HAFS will evolve into advanced analysis and forecast system for cutting-edge research on modeling, physics, data assimilation, and coupling to earth-system components for high-resolution TC predictions within the Next Generation Global Prediction System (NGGPS)/Strategic Implementation Plan (SIP) objectives of the Unified Forecast System (UFS; https://www.weather.gov/sti/stimodeling_nggps_implementation). In late 2016, GFDL’s Finite Volume Cubed Sphere (FV3) model was selected as the next dynamical core for NOAA’s Global Forecasting System (i.e., fvGFS; see Fig. 27 for moving high-resolution nests). Although the FV3 model itself is fully tested and cloud resolving, certain aspects of its nesting capability prevent its use in HAFS. Hurricane forecast applications require storm following, telescopic nests at about 1-2 km resolution that can be located anywhere in the globe and should be capable of following the tropical storms for several days. In addition, two-way interactive nests are essential for improving the accuracy of forecasts. AOML in joint partnership with GFDL and EMC, will be working on these developments during next 2-3 years to transition advances in HWRF to FV3-HAFS.
Figure 27: Cartoon from SIP presentations showing how high-resolution nests may be moved seamlessly within the 6 faces of the FV3 cube sphere grid. For example, nest in position A and B crosses the edge of face 1 and face 6. The nest will stay on one projection. The feedback and downscale at the leading edge of the moving nest will be on the interchangeable equivalent projections between face 1 and face 6 in this instance. The design will guarantee the physical equivalence in the finite volume framework on different cubic faces.
28
12. Future direction of the HFIP program HFIP’s approach is designed to accelerate the implementation of promising technologies and techniques from the research community into operations. That approach has resulted in a 20% reduction in both storm track and intensity numerical guidance. Additionally, to better communicate risks to the public and emergency management community, HFIP invested in social science research contributed to the development and implementation of storm surge watch/warning products and services. Tracking the progress, and lack thereof, of numerical storm prediction guidance during HFIP shed light on the development areas that deliver the most significant results (e.g., data assimilation, improvements to physics parameterization schemes), areas into which HFIP focus should be extended (e.g., storm size, rainfall), and the need for more meaningful ways to measure progress for high-impact events (e.g., rapid intensity changes). Forecast challenges during the 2017 hurricane season underscored the address issues such as rapid intensity change, genesis, storm size, and rainfall, as demonstrated by Hurricane Harvey. Hurricane Irma highlighted a need for improvements in forecasting storm size and track. Hurricane Maria, which devastated Dominica and Puerto Rico, again pointed to a need to better predict rapid intensity change, as did Hurricanes Matthew (2016), Joaquin (2015), and Patricia (2015). To improve TC forecasting with the goal of developing and extending accurate TC forecasts and warnings in order to reduce loss of life, injury, and damage to the economy, the next generation of HFIP will focus on:
1. improving the prediction of rapid intensification and track of TCs; 2. improving the forecast and communication of surges from TCs; and 3. incorporating risk communication research to create more effective watch and warning
products. A new strategic plan details the specific research, development, and technology transfer activities associated with HFIP’s next generation of science and R2O challenges. Some key challenges include: reducing HWRF forecast guidance errors associated with rapid intensification; reducing global modeling guidance errors to extend forecasts to 7 days with accuracy; improving utilization of high-resolution ensembles for model initialization and in product generation; better utilization of satellite observations in cloudy regions surrounding tropical cyclones; and identifying observations required to improve intensity forecasts. In order to address the three primary focus areas outlined above, HFIP has developed a set of specific goals and metrics to improve the accuracy and reliability of TC forecasts and warnings and increase the confidence in those forecasts to enhance mitigation and preparedness decisions by emergency management officials at all levels of government and by individuals. Improved model guidance for TC formation, track, intensity and size will be essential to address all three areas. Basic TC forecast parameters will be improved, including the formation time and location, position, maximum wind (i.e., intensity), and storm size. Estimates of the uncertainty of those parameters will also be enhanced, enabling better risk communication to end users through accurate probabilistic information (i.e., information that considers the likelihood, or probability, that an event will occur). Rapid intensification remains an especially important and challenging
29
forecast problem. Specific goals and metrics are defined for the prediction of the basic TC forecast parameters, new extended range forecasts, rapid intensification, and TC formation. The next generation of HFIP will build upon the original goals of the project through the following specific goals and metrics:
1. Reduce forecast guidance errors, including during rapid intensification, by 50 percent from 2017;
2. Produce 7-day forecast guidance as good as the 2017 5-day forecast guidance; 3. Improve guidance on pre-formation disturbances, including genesis timing, and track and
intensity forecasts, by 20 percent from 2017; and 4. Improve hazard guidance and risk communication, based on social and behavioral
science, to modernize the TC product suite (products, information, and services) for actionable lead-times for storm surge and all other threats.
Improved hazard guidance will derive from development of a hurricane analysis and forecast system producing ensemble guidance enabling probabilistic hazard products and improved track, intensity, and storm size predictions before formation and throughout the storm’s life cycle. Using social and behavioral science research, HFIP will design a more effective TC product suite to better communicate risk and apply it to all current TC hazards products. Success will depend on availability of sufficient resources for development, R2O, and infrastructure (including high-performance computing), continuing engagement with the larger academic community in addressing the challenges and goals.
30
References
Alaka, G. J., X. Zhang, S. G. Gopalakrishnan, S. B. Goldenberg, and F. D. Marks, 2017: Performance of basin-scale HWRF tropical cyclone track forecasts. Wea. Forecast., 32(3):1253-1271, doi:10.1175/WAF-D-16-0150.1.
Alaka, G. J., X. Zhang, S. G. Gopalakrishnan, F. D. Marks, M.-C. Ko, and R. St. Fleur, 2017: Basin-scale HWRF: Evaluation of 2017 real-time forecasts. The 9th HFIP Annual Rev. Conf., 10, presentation, 08 November 2017, NHC, Miami, FL. [Available online at http://www.hfip.org/documents/presentations_publications.php].
Brennan, M. J., M. DeMaria, E. S. Blake, R. J. Pasch, and A. Penny, 2017: Forecast challenges of the 2017 hurricane season and NHC priorities for 2018. The 9th HFIP Annual Rev. Conf., 29, presentation, 08 November 2017, National Hurricane Center, Miami, FL. [Available online at http://www.hfip.org/documents/presentations_publications.php].
Cangialosi, J., C. Landsee, 2017: National hurricane center 2017 forecast verification
(preliminary). The 9th HFIP Annual Rev. Conf., 28, presentation, 08 November 2017, National Hurricane Center, Miami, FL. [Available online at http://www.hfip.org/documents/presentations_publications.php].
Cangialosi, J. P., and J. L. Franklin, 2011: 2010 National hurricane center forecast verification
report. NOAA/NWS/NCEP/National Hurricane Center, 77, report [Available online http://www.nhc.noaa.gov/verification/pdfs/Verfification_2010.pdf].
DeMaria, M., J. Kaplan, 1994: A statistical hurricane intensity prediction scheme (SHIPS) for
the Atlantic basin. Wea. Forecasting, 9(2):209-220, doi: 10.1175/1520-0434(1994)009<0209:ASHIPS>2.0.CO;2.
Doyle, J. D., J. Moskaitis, R. Hodur, S. Chen, H. Jin, Y. Jin, W. Komaromi, A. Reinecke, D.
Ryglicki, D. Stern, and S. Wang, 2017: Recent COAMPS-TC development and future plans. The 9th HFIP Annual Rev. Conf., 17, presentation, 08 November 2017, National Hurricane Center, Miami, FL. [Available online at http://www.hfip.org/documents/minutes/2017_05_31_HFIP-Brief_COAMPS-TC_Doyle.pdf].
DTC, 2012: Community grid point statistical interpolation GSI documents and publications.
Developmental Testbed Center, Boulder, CO. [Available online at http://www.dtcenter.org/com-GSI/users/docs/index.php].
Franklin, J. L., 2009, May 5; 2010, April 27: A proposal for HFIP performance baselines.
Modified Apr. 27, 2010 to include the Eastern North Pacific baseline. Unpublished manuscript, National Hurricane Center, Miami, FL.
Goldenberg, S., S. Gopalakrishnan, V. Tallapragada, T. Quirino, F. Marks, S. Trahan, X. Zhang,
and R. Atlas, 2015: The 2012 triply-nested, high-resolution operational version of the
31
hurricane weather research and forecasting system (HWRF): Track and intensity forecast verifications. Wea. Forecast., doi: 10.1175/WAF-D-14-00098.1.
Liu, B., A. Mehra, Z. Zhang, S. Abarca, J. Dong, D. Iredell, H.-S. Kim, Q. Liu, Z. Ma., D.
Sheinin, J. Sippel, B. Thomas, M. Tong, W. Wang, H. Winterbottom, K. Wu, B. Zhang, L. Zhu, and V. Tallapragada, 2017: NCEP operational hurricane systems: Verification of 2017 HWRF and HMON performances. The 9th HFIP Annual Rev. Conf., 31, presentation, 08 November 2017, National Hurricane Center, Miami, FL. [Available online at http://www.hfip.org/documents/presentations_publications.php].
Marks, F. D., M. DeMaria, G. S. Gopalakrishnan, V. Tallapragada, F. D. marks, M. Bender, N.
Lett, E. Mifflin, M. Brennan, R. Rogers, A. Mehra, T. Marchok, N. Kurkowski, J. Rhome, J. Sippel, J. Sprague, and A. Gerard, 2017: What, why, who and when? The 9th HFIP Annual Rev. Conf., 10, presentation, 08 November 2017, NHC, Miami, FL. [Available online at http://www.hfip.org/documents/presentations_publications.php].
Mehra, A., and the EMC Hurricane Team, 2017: Plans for Operational Hurricane Modeling in
FY18. The 9th HFIP Annual Rev. Conf., 18, presentation, 08 November 2017, National Hurricane Center, Miami, FL. [Available online at http://www.hfip.org/documents/presentations_publications.php].
Moskaitis, J. R., W.A. Komaromi, A. Reinecke, and J. D. Doyle, 2017: 2017 Real-time
COAMPS-TC EPS. The 9th HFIP Annual Rev. Conf., 10, presentation, 08 November 2017, National Hurricane Center, Miami, FL. [Available online at http://www.hfip.org/documents/presentations_publications.php].
Newman, K. M., E. Kalina, L. Nance, and Y. H. Kuo, 2017: Developmental testbed center: Core activities for HFIP. 2017 The 9th HFIP Annual Rev. Conf., 15, presentation, 08 November 2017, Miami, FL.
NHC, 2009: NHC Track and intensity models. [Available at http://www.nhc.noaa.gov/modelsummary.shtml].
NOAA SAB, 2006: Majority report: National oceanic and atmospheric administration science
advisory board hurricane intensity research working group. NOAA SAB HIRWG, 05 July, 2006. [Available at http://www.sab.noaa.gov/Reports/HIRWG_final73.pdf]
Paulik, L., and G. L. Alaka, 2017: NOAA Storm surge modeling gaps and priorities. The 9th
HFIP Annual Rev. Conf., 15, presentation, 09 November 2017, National Hurricane Center, Miami, FL. [Available online at http://www.hfip.org/documents/presentations_publications.php].
Sippel, J., H. Winterbottom, Z. Zhang, B. Zhang, and A. Mehra, 2017: 2017-2018 HWRF DA
testing and plans. The 9th HFIP Annual Rev. Conf.,15, presentation, 08 November 2017, National Hurricane Center, Miami, FL. [Available online at http://www.hfip.org/documents/presentations_publications.php].
32
Sprague, J., 2017: HFIP Socio-economic working group update. The 9th HFIP Annual Rev.
Conf., 43, presentation, 08 November 2017, National Hurricane Center, Miami, FL. [Available online at http://www.hfip.org/documents/minutes/2017_10_04_HFIP-Brief_Social%20Science_Sprague.pdf].
Tallapragada, V., 2017: NOAA’s FV3 based unified modeling system development strategies. The 9th HFIP Annual Rev. Conf., 20, presentation, 09 November 2017, National Hurricane Center, Miami, FL. [Available online at http://www.hfip.org/documents/presentations_publications.php].
Tallapragada, V., 2017: NCEP unified forecast system: High-resolution global, regional and hurricane modeling capabilities using FV3 dynamic core. The 9th HFIP Annual Rev. Conf., 22, presentation, 08 November 2017, NHC, Miami, FL. [Available online at http://www.hfip.org/documents/presentations_publications.php].
Toepfer, F., 2017: HFIP: After 10 years … What’s next? The 9th HFIP Annual Rev. Conf., 21, presentation, 09 November 2017, National Hurricane Center, Miami, FL. [Available online at http://www.hfip.org/documents/presentations_publications.php].
Tyner, B., P. Zhu, J. A. Zhang, S. Gopalakrishnan, F. Marks, and V. Tallapragada, 2017:
Sensitivity of tropical cyclone secondary eyewall formation in the HWRF system to snow fall speed. J. Geophys. Res., submitted.
Wang, X., 2017: DA/Initialization team milestones and priorities. The 9th HFIP Annual Rev.
Conf., 26, presentation, 08 November 2017, National Hurricane Center, Miami, FL. [Available online at http://www.hfip.org/documents/presentations_publications.php].
Zelinski, D., and M. DeMaria, 2017: 2017 HFIP annual review PPAV team report. The 9th HFIP
Annual Rev. Conf., 48, presentation, 08 November 2017, National Hurricane Center, Miami, FL. [Available online at http://www.hfip.org/documents/presentations_publications.php].
Zhang, X., and W. Wang, 2017: Performance and Verification of [the] HWRF/HMON ensemble
prediction system in [the] 2017 real time parallel experiment. The 9th HFIP Annual Rev. Conf., 14, presentation, 08 November 2017, National Hurricane Center, Miami, FL. [Available online at http://www.hfip.org/documents/presentations_publications.php].
Zhang, X. and Z. Zhang, 2017: Model developments and priorities. The 9th HFIP Annual Rev.
Conf., 13, presentation, 08 November 2017, National Hurricane Center, Miami, FL. [Available online at http://www.hfip.org/documents/presentations_publications.php].
Zhu, L., S. Abarca, EMC hurricane team, R. Fovell, J. Zhan, P. Zhu, S. Bao, L. Bernadet, K.
Newman, E. Kalina, M. Biswas, A. Mehra, and V. Tallapragada, 2017: High-Res physics tiger team report. The 9th HFIP Annual Rev. Conf., 08 November 2017, 15, presentation, National Hurricane Center, Miami, FL. [Available online at http://www.hfip.org/documents/presentations_publications.php].
33
Appendix A: Model Acronyms The following is a list of acronyms used to identify models in this document. Many of the acronyms follow the four-character naming convention in the Automated Tropical Cyclone Forecasting (ATCF) system. For example, 6 hour “early” (aka “interpolated”) forecasts from “late” models (see Section 4a) are adjusted so that the previous 6 hour forecast matches the conditions at the beginning of the current forecast. Forecasts of those future conditions are denoted with an “I” at the end (12 hour interpolations are denoted with a “2”). Other conventions occasionally used in the model naming include the acronym “A” to denote advanced version, “D” to denote the addition of inland decay, “E” to denote ensemble, “H” to denote hurricane, “R” to denote research, “S” to denote statistical, “T” to denote track, “V” to denote Variable (ensemble of at least 2, for example), and beginning with an “I” to denote intensity. Table 2. Meteorology and Model Acronyms
ACRONYM: DESCRIPTION: AEMI: GEFS with 6 hour interpolation (AEMI) AHW: National Center for Atmospheric Research Advanced Hurricane WRF. AOML: Atlantic Oceanographic and Meteorology Laboratory (AOML) AVNI: GFS with 6 hour interpolation (AVNI). CLIPER: Climate and Persistence model (CLIPER) CMC: Canadian Meteorological Centre model. CMCI: CMC with 6 hour interpolation. COAMPS-TC: Coupled Ocean/Atmosphere Mesoscale Prediction System-Tropical Cyclone
(COAMPS-TC) at FNMOC Decay-SHIFOR5: Decay Statistical Hurricane Intensity Forecast model (Decay-SHIFOR5) DSHP: Decay SHIPS (DSHP) DTC: Developmental Testbed Center (DTC) ECMWF: European Centre for Medium-range Weather Forecasts model (ECMWF) EGRI: UKMO model, subjective tracker, with 6 hour interpolation (EGRI) EM: Equally-weighted Ensemble Mean for models used in MMSE. EMXI: ECMWF with 6 hour interpolation. EnKF: Ensemble Kalman Filter (EnKF). EFS: Experimental Forecast System (HFIP Stream-2, demonstration project) FAR: False Alarm Rate (FAR) Far-Field: Tropical cyclones that are more than 3,500 km apart (Far-Field) FSSE: Florida State University Super-Ensemble (FSSE) FV3: NOAA’s Finite Volume Cubed-Sphere Dynamical Core (FV3) GEFS: NCEP’s Global Ensemble Forecast System (GEFS) GFDI: GFDL with 6 hour interpolation (GFDI). GFS: Global Forecast System (GFS) GFSI: Early GFS with 6 hour interpolation (GFSI) GHMI: GFDL adjusted using a variable intensity offset correction that is a function of
forecast time, with 6 hour interpolation (GHMI). GSI: Grid-point Statistical Interpolation (GSI) H3WI: Hurricane Research Division’s regional, dynamic and deterministic ensemble
(H3WI) HCCA: HFIP Corrected Consensus Approach (HCCA) HDOBS: High Density Observations (HDOBS) from aircraft HFIP: Hurricane Forecast Improvement Project (HFIP)
34
ACRONYM: DESCRIPTION: HMON: Hurricanes in a Multi-scale Ocean coupled Non-hydrostatic (HMON) model or
Hurricane Non-hydrostatic Multi-scale Model on B-grid (NMMB) HNMMB: Hurricane Non-hydrostatic Multi-scale Model on B-grid (HNMMB) HWHI: Basin-scale HWRF with 6 hour interpolation (HWHI) HWMI: HWRF Ensemble Mean Forecast Interpolated Ahead 6 hour. (HWMI) HWFI: Hurricane Weather Research & Forecasting (HWRF) with 6 hour interpolation
(HWFI) HWRF: Hurricane WRF (HWRF) IV15: Intensity forecast ensemble including 2012 Stream-1.5 forecasts. LGEM: Logistics Growth Equation Model (LGEM) MAE: Mean Absolute Error MMSE: FSU Multi-Model Ensemble (variably weighted mean). NAVGEM: Fleet Numerical Meteorology and Oceanography Center Navy Global
Environmental Model (NAVGEM), replaced NOGAPS February 2013. NEMS: NGGPS:
NOAA Environmental Modeling System (NEMS) Next Generation Global Prediction System (NGGPS), for more information about the model see https://www.weather.gov/sti/stimodeling_nggps
NGPI: NOGAPS with 6 hour interpolation (NGPI) NGXI: Experimental NOGAPS with 6 hour interpolation (NGXI) NMM: Environmental Modeling Center Non-hydrostatic Mesoscale Model. NMMB: NMM on the B-grid (NMMB) NOGAPS: Fleet Numerical Meteorology and Oceanography Center Navy Operational
Global Atmospheric Prediction System (replaced by NAVGEM February 2013) OFCL: Official National Hurricane Center Forecast (OFCL) RI: Rapid Intensification RI), An increase in 30 Knots/24 hours RW: Rapid weakening (a decrease of 25 knots in 24 hours). SHIPS: Statistical Hurricane Intensity Prediction System (SHIPS) SPC3: Six-member weighted SPICE ensemble using output from GFS, HWRF, and
GFDL as input for DSHP and LGEM. The ensemble weights vary with forecast lead time
SPICE: Statistical Prediction of Intensity from a Consensus Ensemble (SPICE) SPIN-UP: Slang terminology for vortex acceleration and/or initialization SPIN-DOWN: Slang terminology for vortex deceleration and/or termination TAB: Trajectory And Beta (TAB) model for trajectory track using GFS input TVCA: Track Variable Consensus of at least two of AVNI, EGRI, EMXI, NGPI, GHMI,
HWFI forecasts TVCE: Variable Consensus (TVCE) of AVNI, EGRI, EMXI, NGPI, GHMI, GFNI,
HWFI Model Track Forecasts TVCI: Variable Consensus (TVCE) of AVNI, EGRI, EMXI, NGPI, GHMI, GFNI,
HWFI Model Track Forecasts (6 hour interpolation) TVCN: National Hurricane Center Track Variable Consensus (TVCN) UKMI: United Kingdom Meteorological Office model, automated tracker, with 6 hour
interpolation (UKMI) UW4I: University of Wisconsin’s Non-hydrostatic Modeling System (4 km) UWNI: UW-NMS with 6 hour interpolation (UWNI) UW-NMS: University of Wisconsin Non-hydrostatic Modeling System. WRF: Weather Research & Forecasting (WRF) regional model w/options for the
dynamic core, physics, initialization, post processing and verification. Variations: Hurricane WRF (HWRF), PSU Advanced Research WRF (ARW) and NCAR Advanced Hurricane WRF (AHW)