evaluation of shear-relative hurricane structure from the - hfip
TRANSCRIPT
Evaluation of Shear-relative Hurricane Structure from the 2012 HWRF Baseline Model
Paul Reasor, HRD/AOML/NOAA
April 24th, 2013
Background Zhang and Tao (2013, JAS) found that with increased vertical
wind shear comes increased uncertainty in the intensity forecast.
Reasor et al. (2013, MWR) recently documented the shear-relative structure of hurricanes using airborne Doppler-radar composites from NOAA P-3 flights into 18 storms.
As an initial step towards understanding the HWRF model’s challenges in predicting sheared hurricane intensity, a shear-relative analysis of structure, similar to that in Reasor et al., is performed using the 2012 Baseline model.
Methodology
Following Reasor et al. (2013):
Map storm-relative winds to a cylindrical coord. system centered on the low-level vortex (here, HWRF surface pressure centroid)
Normalize radial coord. by the 2-km symmetric RMW Rotate fields such that the large-scale 850-200-hPa
shear vector points due east Construct shear-relative structure composites
Focus here only on the domain represented by the radar analyses

Database of Cases
HWRF (6-hourly sampling) Radar-based

Environment and Vortex Properties
HWRF database Radar database
S850-200 = SHIPS deep-layer shear SST = Sea surface temperature Us = Storm motion Vmax = Peak 10-m wind V2km = Max. 2-km symm. tang. wind RMW2km = Radius of V2km
More low SST cases in HWRF database (higher latitude) HWRF-simulated hurricanes have larger eyewalls Does this enhance resilience?
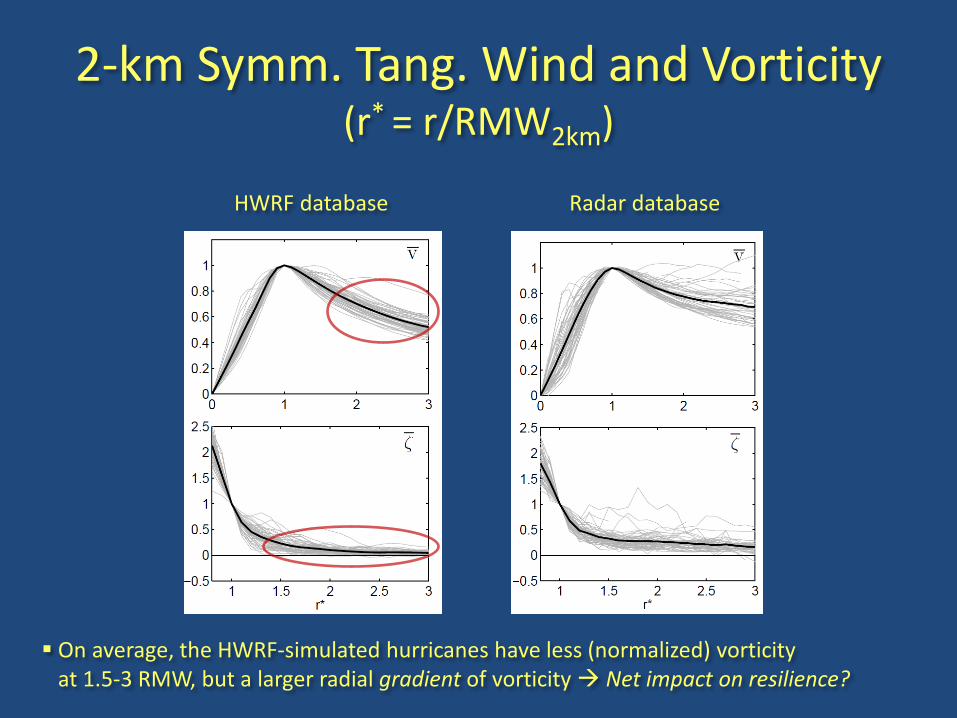
2-km Symm. Tang. Wind and Vorticity (r* = r/RMW2km)
HWRF database Radar database
On average, the HWRF-simulated hurricanes have less (normalized) vorticity at 1.5-3 RMW, but a larger radial gradient of vorticity Net impact on resilience?
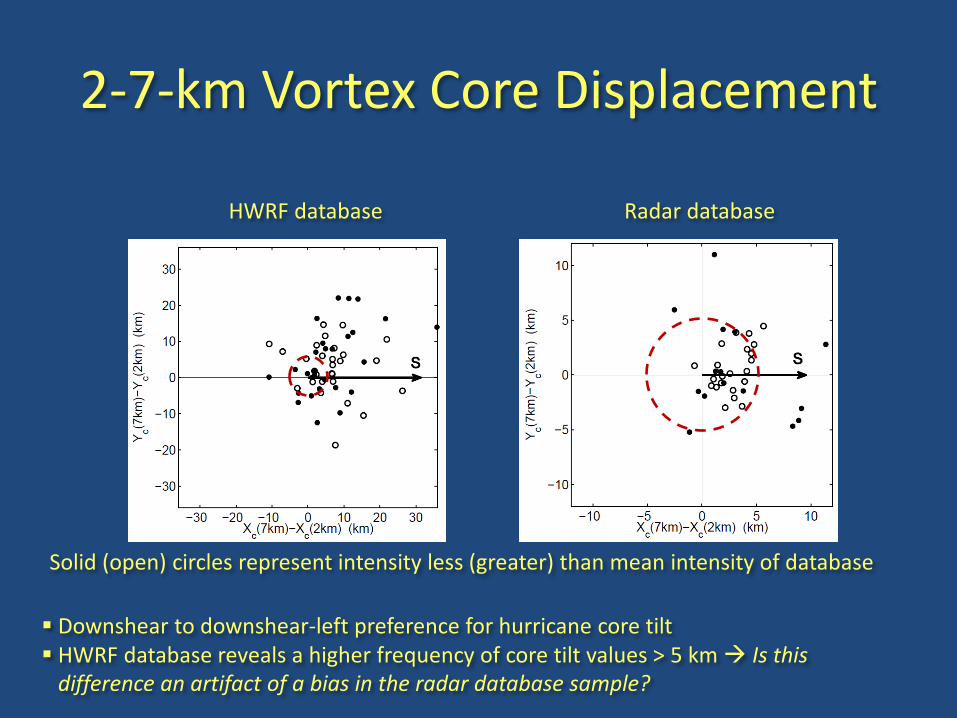
2-7-km Vortex Core Displacement
HWRF database Radar database
Downshear to downshear-left preference for hurricane core tilt HWRF database reveals a higher frequency of core tilt values > 5 km Is this difference an artifact of a bias in the radar database sample?
Solid (open) circles represent intensity less (greater) than mean intensity of database
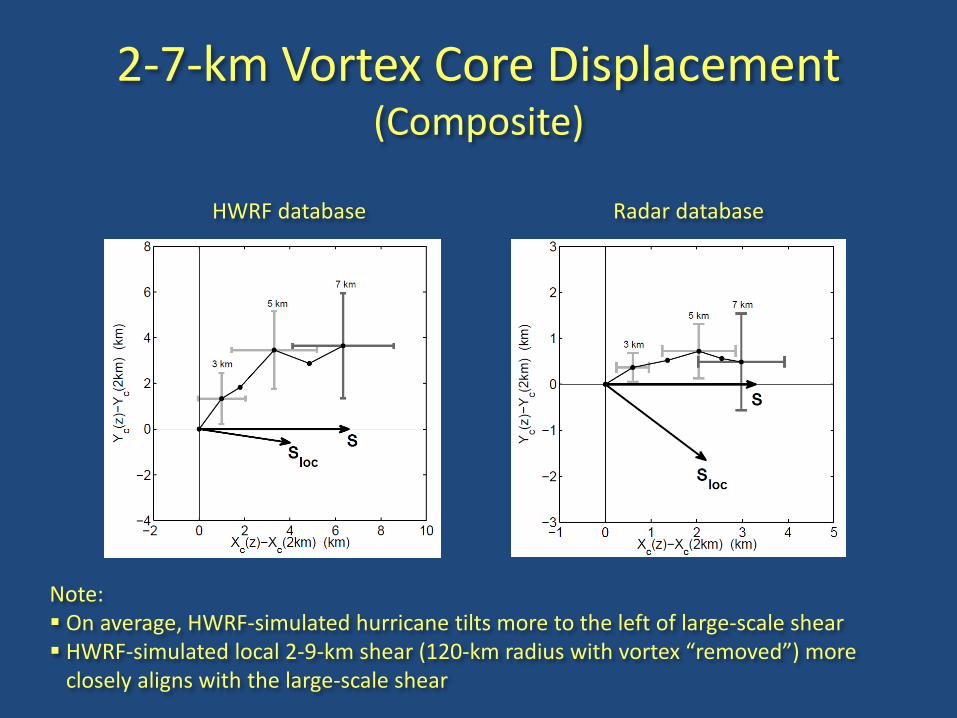
2-7-km Vortex Core Displacement (Composite)
HWRF database Radar database
Note: On average, HWRF-simulated hurricane tilts more to the left of large-scale shear HWRF-simulated local 2-9-km shear (120-km radius with vortex “removed”) more closely aligns with the large-scale shear
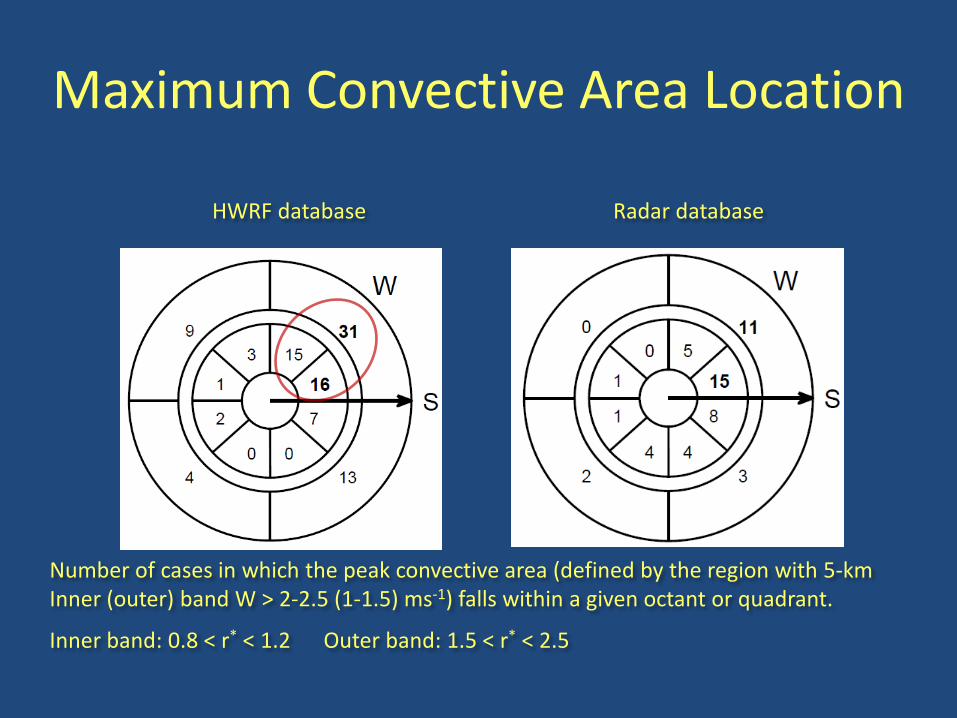
Maximum Convective Area Location
HWRF database Radar database
Number of cases in which the peak convective area (defined by the region with 5-km Inner (outer) band W > 2-2.5 (1-1.5) ms-1) falls within a given octant or quadrant.
Inner band: 0.8 < r* < 1.2 Outer band: 1.5 < r* < 2.5
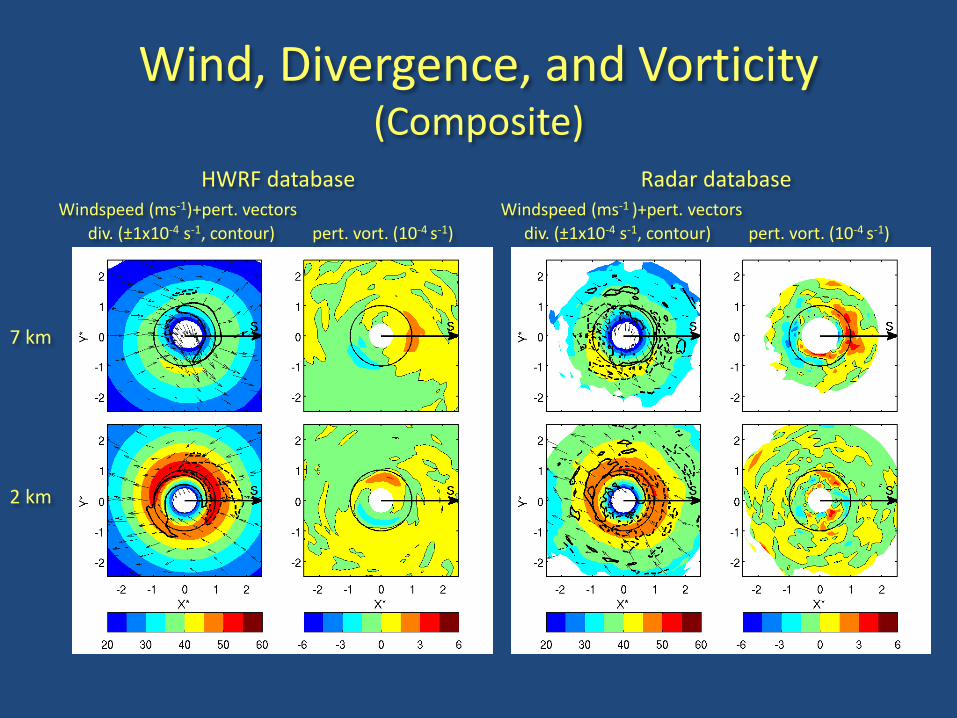
Wind, Divergence, and Vorticity (Composite)
HWRF database Radar database Windspeed (ms-1)+pert. vectors Windspeed (ms-1 )+pert. vectors div. (±1x10⁻⁴ s-1, contour) pert. vort. (10-4 s-1) div. (±1x10⁻⁴ s-1, contour) pert. vort. (10-4 s-1)
7 km
2 km
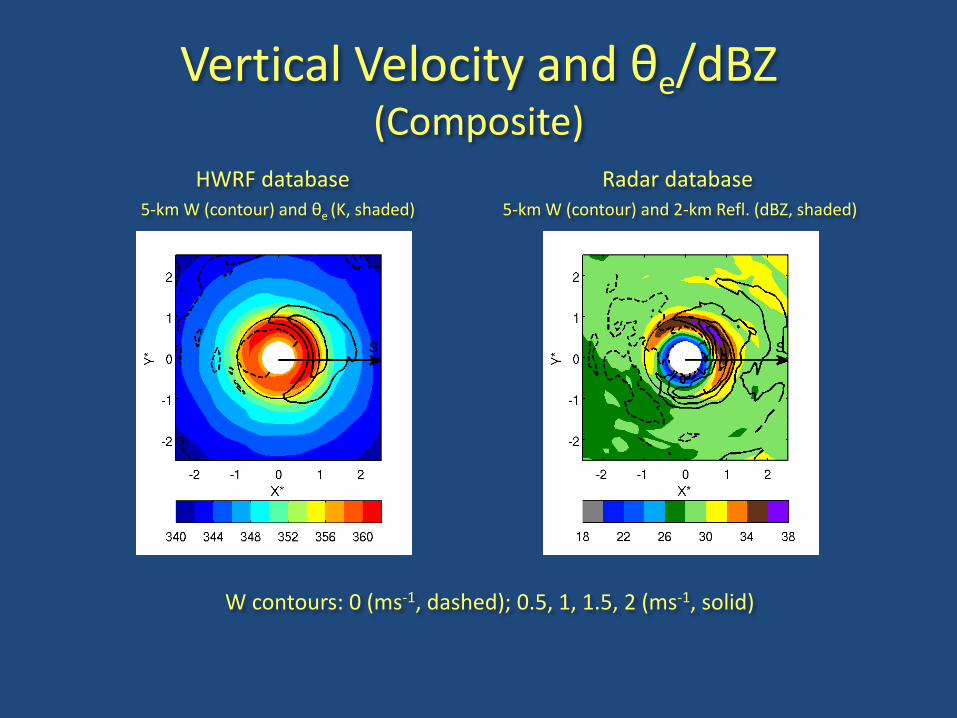
Vertical Velocity and θe/dBZ (Composite)
HWRF database Radar database 5-km W (contour) and θe (K, shaded) 5-km W (contour) and 2-km Refl. (dBZ, shaded)
W contours: 0 (ms-1, dashed); 0.5, 1, 1.5, 2 (ms-1, solid)
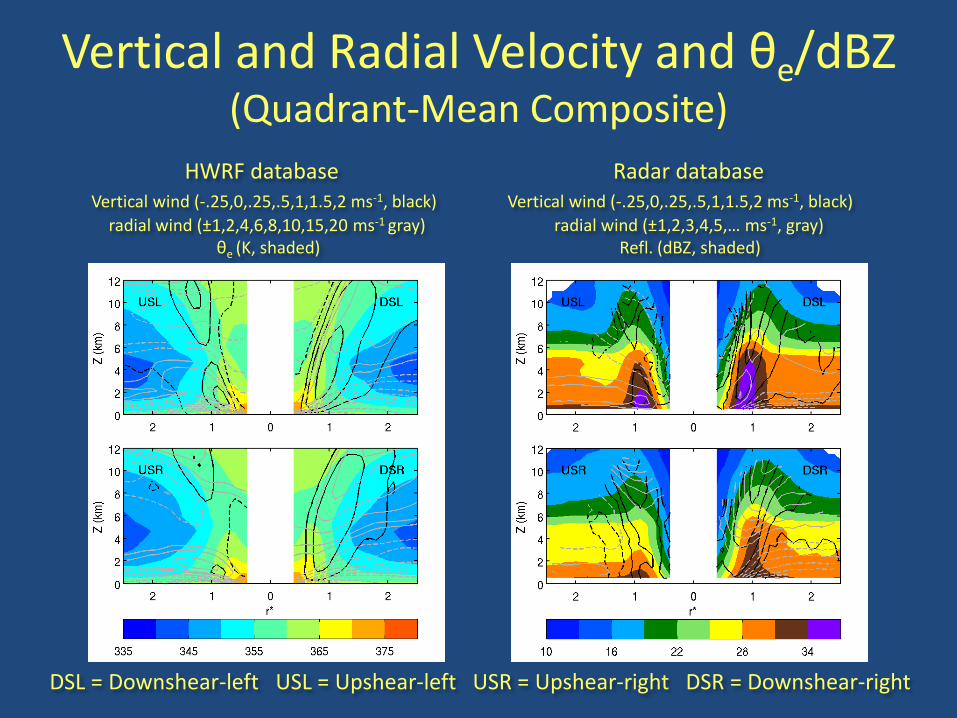
Vertical and Radial Velocity and θe/dBZ (Quadrant-Mean Composite)
HWRF database Radar database Vertical wind (-.25,0,.25,.5,1,1.5,2 ms-1, black) Vertical wind (-.25,0,.25,.5,1,1.5,2 ms-1, black) radial wind (±1,2,4,6,8,10,15,20 ms-1 gray) radial wind (±1,2,3,4,5,… ms-1, gray) θe (K, shaded) Refl. (dBZ, shaded)
DSL = Downshear-left USL = Upshear-left USR = Upshear-right DSR = Downshear-right
Summary Relative to the radar-based study of Reasor et al. (2013), the composite analysis of shear-relative hurricane structure from the 2012 HWRF baseline model reveals:
Lower (normalized) vorticity outside the RMW, but a greater radial gradient of vorticity there
Greater tilt of the core, on average, but still a preference for a downshear-left orientation
Composite eyewall ascent that is more sloped than from observations
A core-region kinematic asymmetry that is broadly consistent with observations. The pattern of core-region descent and the low-level flow/thermo. structure require further investigation.

Future Work
Include a greater number of storm cases to increase the diversity of the sample.
Extend HWRF diagnostic analyses to a larger domain, and focus more on processes involved in shear-induced intensity change (e.g., transport of low-θe air into HBL).
Recommendations: 1) Test existing and future configurations of the HWRF
model within this shear-relative diagnostic framework to ensure consistency with observations.
2) Use the extended HWRF diagnostic analyses to guide future sampling of observed sheared hurricanes.