northern virginia market forecast - naiop va young naiop 2015... · northern virginia market...
TRANSCRIPT
Northern Virginia Market Forecast
Margaret Donkerbrook Vice President, U.S. Research Dave Millard Principal

2014 Highlights

2014 Highlights
– Opening of Silver Line
– High End (Macerich/Lerner) Spec Development
– Reston Town Center 100% Leased
– Patriots Park and CNA Building Sales
– Corporate Executive Board Lease
– Multi-Family: New and Conversion from Office
– Marymount Redevelopment
– Crystal City Repositioning
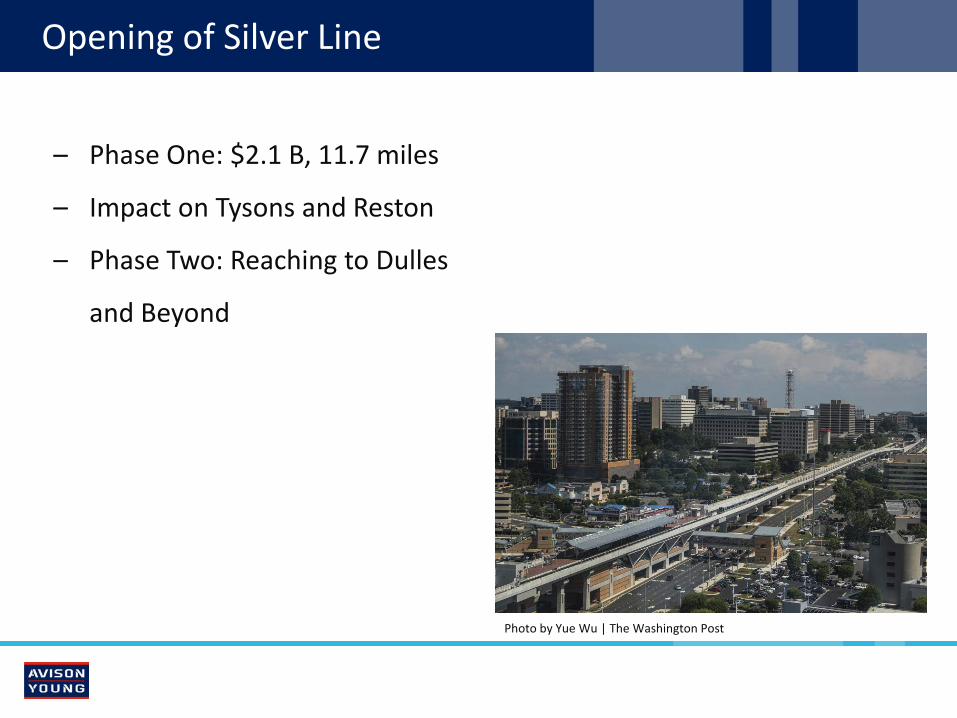
Opening of Silver Line
Photo by Yue Wu | The Washington Post
– Phase One: $2.1 B, 11.7 miles
– Impact on Tysons and Reston
– Phase Two: Reaching to Dulles
and Beyond
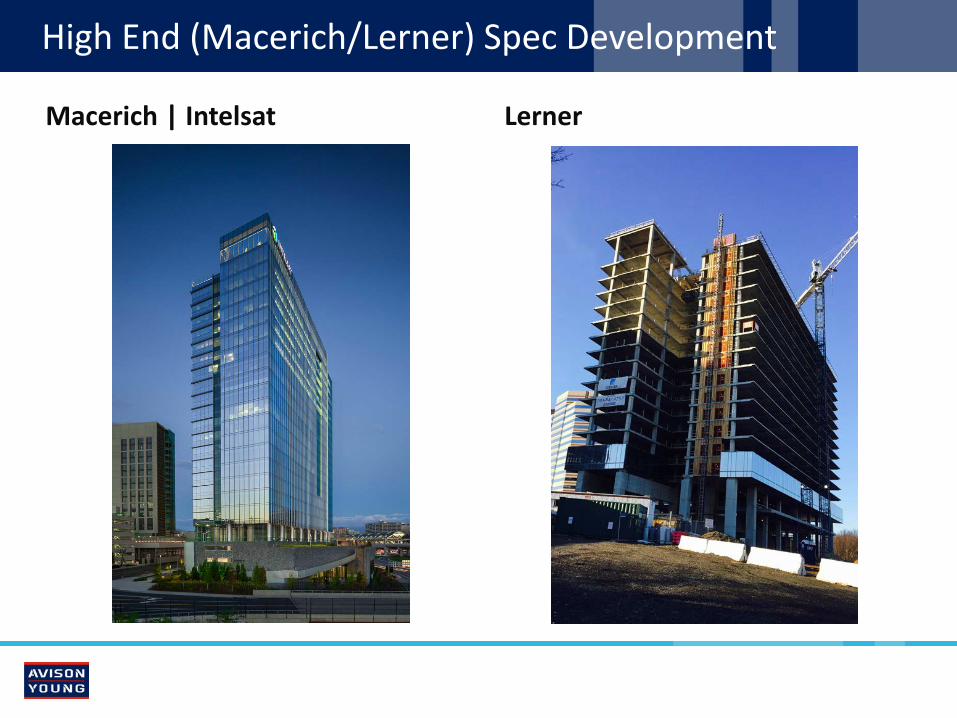
High End (Macerich/Lerner) Spec Development
Macerich | Intelsat Lerner
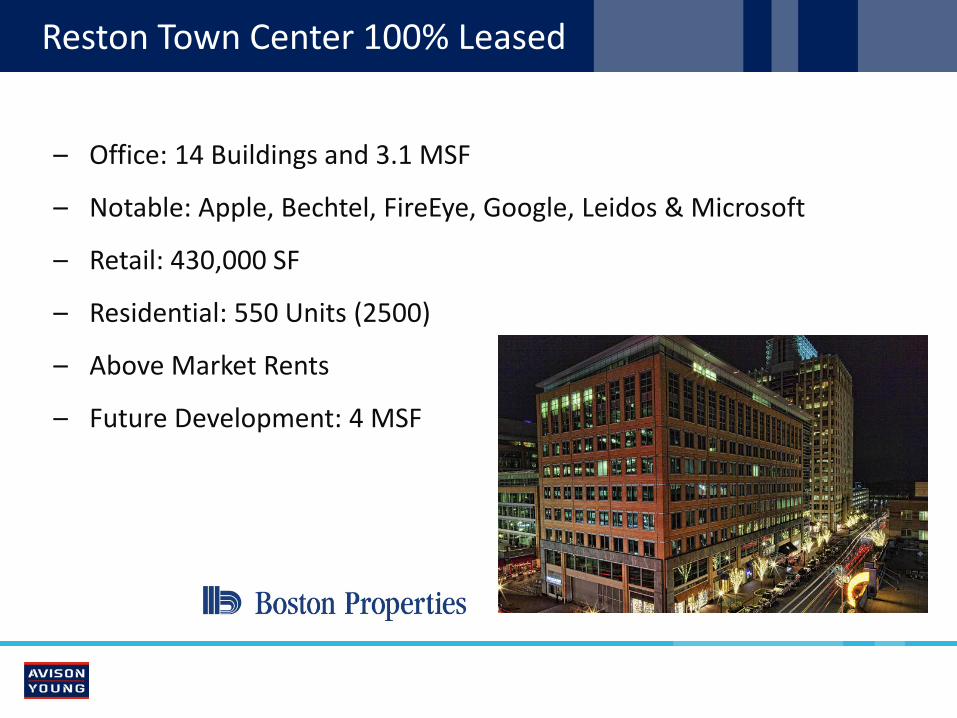
Reston Town Center 100% Leased
– Office: 14 Buildings and 3.1 MSF
– Notable: Apple, Bechtel, FireEye, Google, Leidos & Microsoft
– Retail: 430,000 SF
– Residential: 550 Units (2500)
– Above Market Rents
– Future Development: 4 MSF
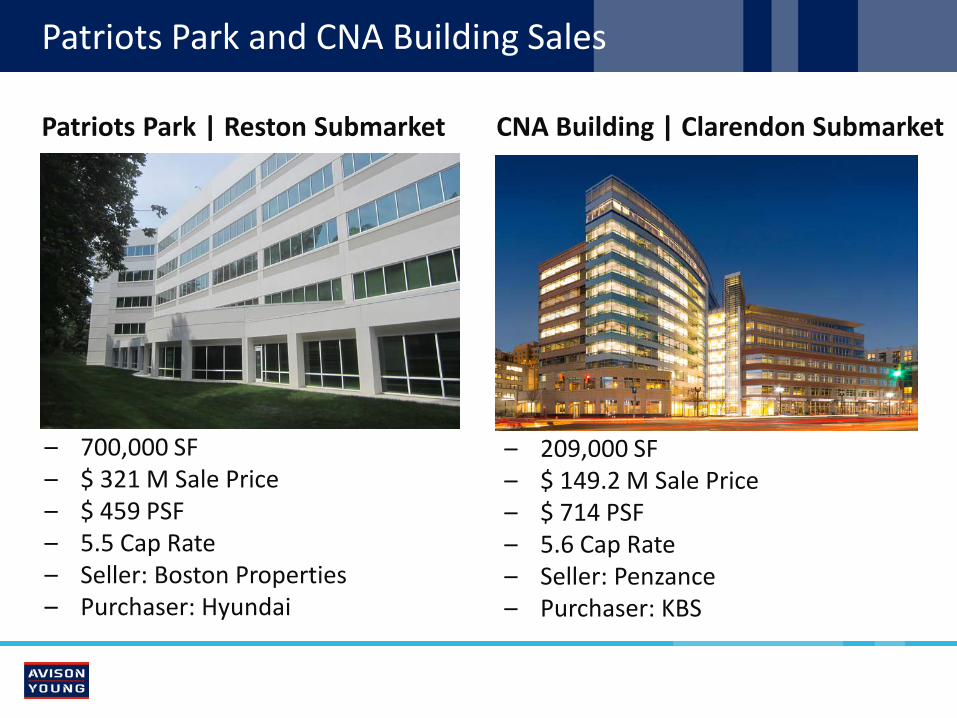
Patriots Park and CNA Building Sales
– 209,000 SF – $ 149.2 M Sale Price – $ 714 PSF – 5.6 Cap Rate – Seller: Penzance – Purchaser: KBS
– 700,000 SF – $ 321 M Sale Price – $ 459 PSF – 5.5 Cap Rate – Seller: Boston Properties – Purchaser: Hyundai
Patriots Park | Reston Submarket CNA Building | Clarendon Submarket
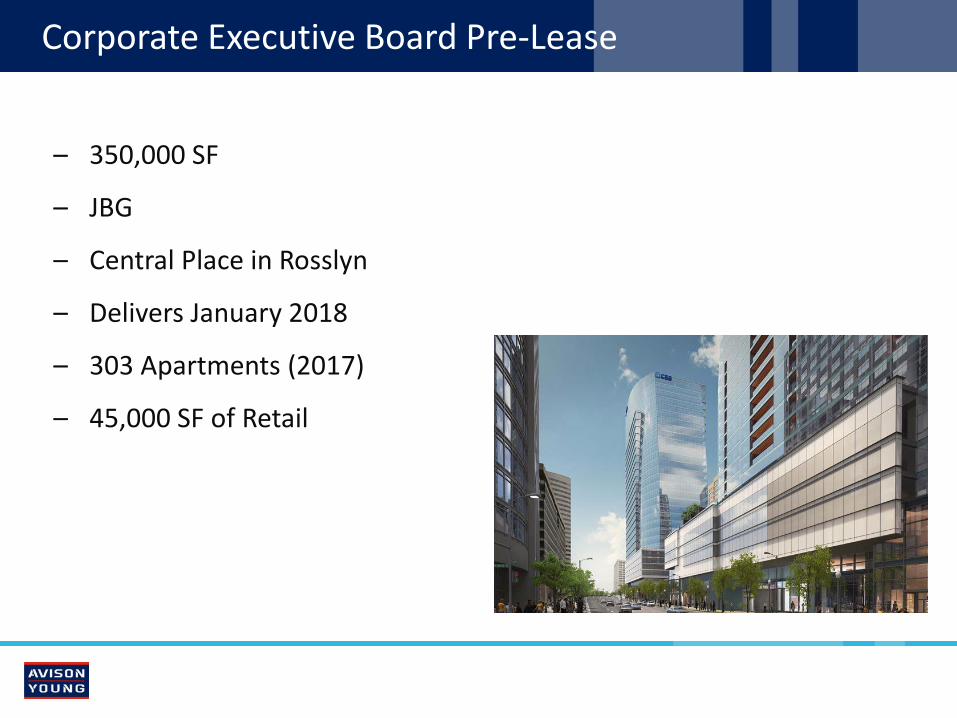
Corporate Executive Board Pre-Lease
– 350,000 SF
– JBG
– Central Place in Rosslyn
– Delivers January 2018
– 303 Apartments (2017)
– 45,000 SF of Retail

Multi-Family
New | Tysons Corner
– 1,700 Units Under Construction
– Another 7,000 Units Approved
– Across Northern Virginia > 1 MSF Removed from Office Inventory
Source: Delta, REIS, Costar, Avison Young
Class A Apartment Absorption
11,237 Units (Metro Wide) | 4,250 Units (Northern Virginia)
Reposition
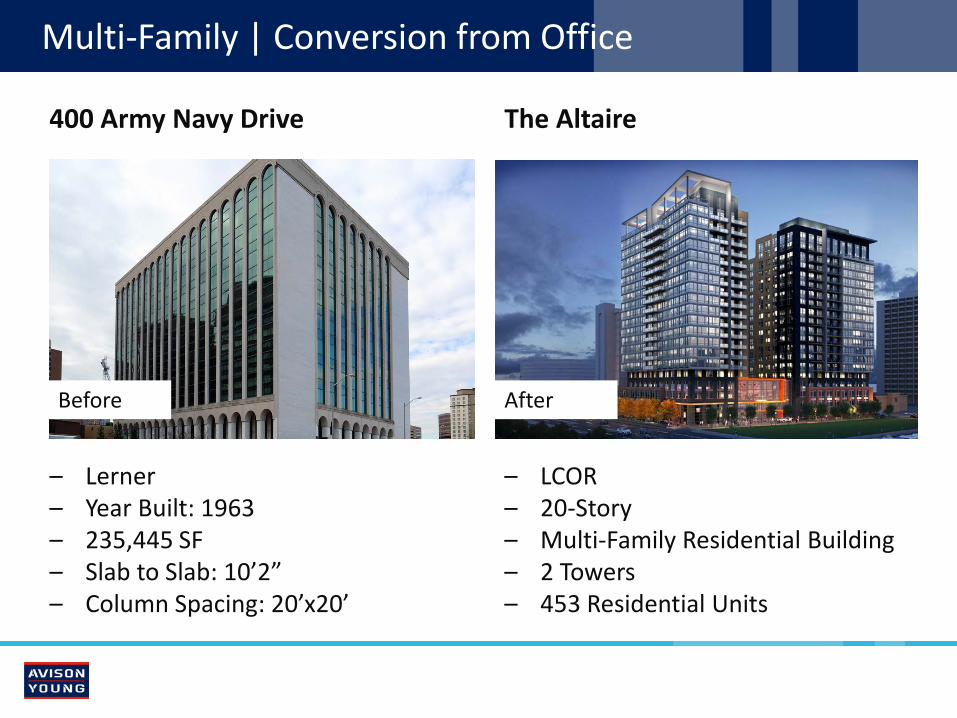
Multi-Family | Conversion from Office
400 Army Navy Drive
Before
– Lerner – Year Built: 1963 – 235,445 SF – Slab to Slab: 10’2” – Column Spacing: 20’x20’
After
– LCOR – 20-Story – Multi-Family Residential Building – 2 Towers – 453 Residential Units
The Altaire

Conversion from Office
6245 Leesburg Pike | Falls Church
– 99,000 SF
– Purchase Price $9.3 M
– Purchased by Fairfax County Public Schools
– New Bailey’s Elementary School
– $10.6 M Renovation
– 700 Students

Marymount Redevelopment
Before
– Built 1965 – 115,000 SF – Purchased by Marymount (1992)
After
– Academic | Office Building – 165,000 SF – Residential: 267 Units – Retail: 8,200 SF
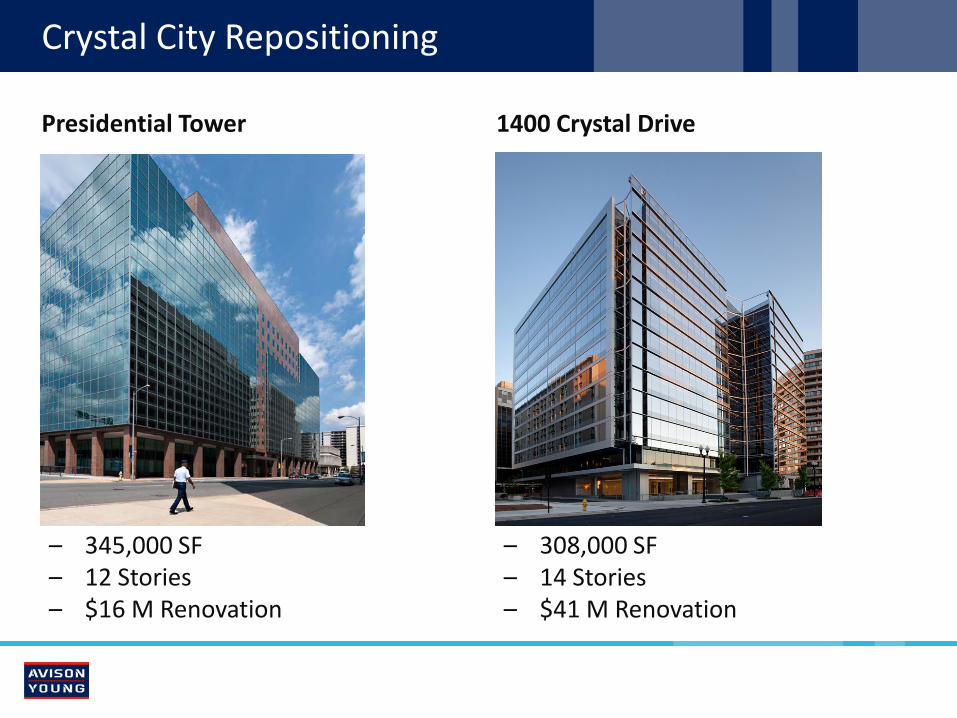
Crystal City Repositioning
– 345,000 SF – 12 Stories – $16 M Renovation
Presidential Tower
– 308,000 SF – 14 Stories – $41 M Renovation
1400 Crystal Drive
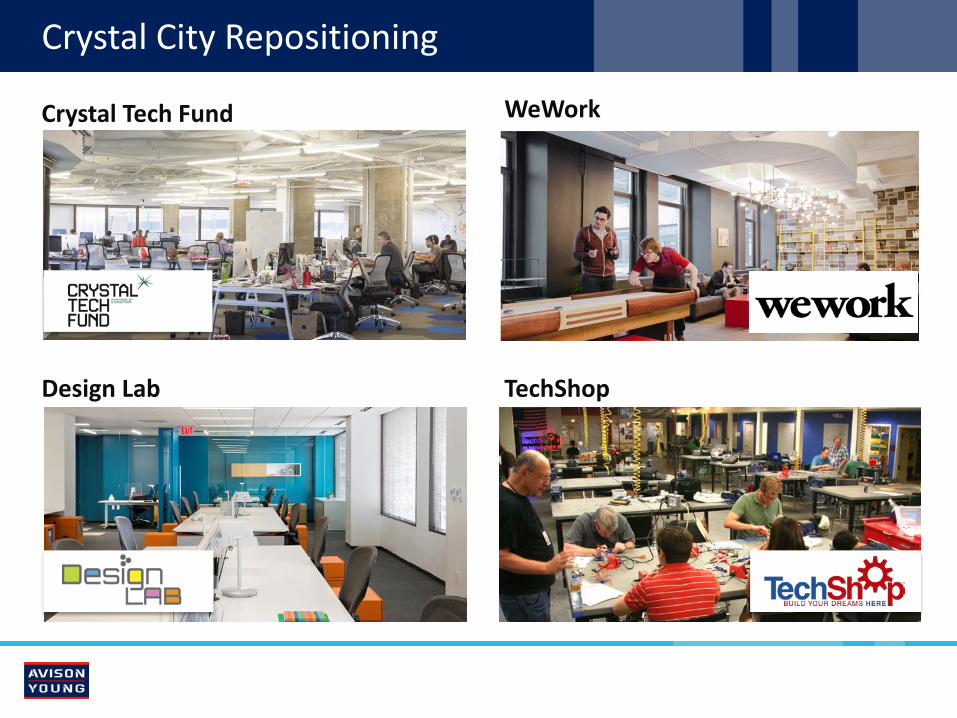
Crystal City Repositioning
Crystal Tech Fund WeWork
TechShop Design Lab

Market Overview
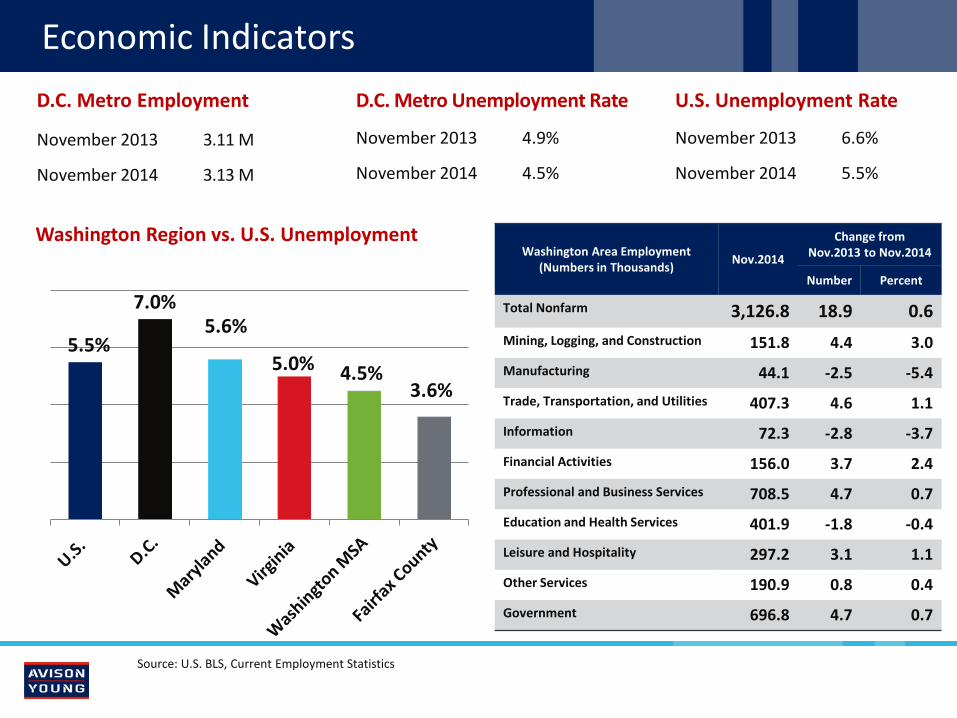
Economic Indicators
Washington Region vs. U.S. Unemployment
D.C. Metro Employment
November 2013 3.11 M
November 2014 3.13 M
5.5%
7.0% 5.6%
5.0% 4.5% 3.6%
Washington Area Employment (Numbers in Thousands) Nov.2014
Change from Nov.2013 to Nov.2014
Number Percent
Total Nonfarm 3,126.8 18.9 0.6 Mining, Logging, and Construction 151.8 4.4 3.0 Manufacturing 44.1 -2.5 -5.4 Trade, Transportation, and Utilities 407.3 4.6 1.1 Information 72.3 -2.8 -3.7 Financial Activities 156.0 3.7 2.4 Professional and Business Services 708.5 4.7 0.7 Education and Health Services 401.9 -1.8 -0.4 Leisure and Hospitality 297.2 3.1 1.1 Other Services 190.9 0.8 0.4 Government 696.8 4.7 0.7
D.C. Metro Unemployment Rate
November 2013 4.9%
November 2014 4.5%
U.S. Unemployment Rate
November 2013 6.6%
November 2014 5.5%
Source: U.S. BLS, Current Employment Statistics

Employment
Source: U.S. Bureau of Labor Statistics
Total Nonfarm Employment; YoY% Change U.S. and 12 Largest Metros | November 2014
4.4
3.5 3.4 3.2
2.4 2.1 2.0
1.6 1.2
0.7 0.7 0.6
- 0.2
-1.0
0.0
1.0
2.0
3.0
4.0
5.0
Percent Change
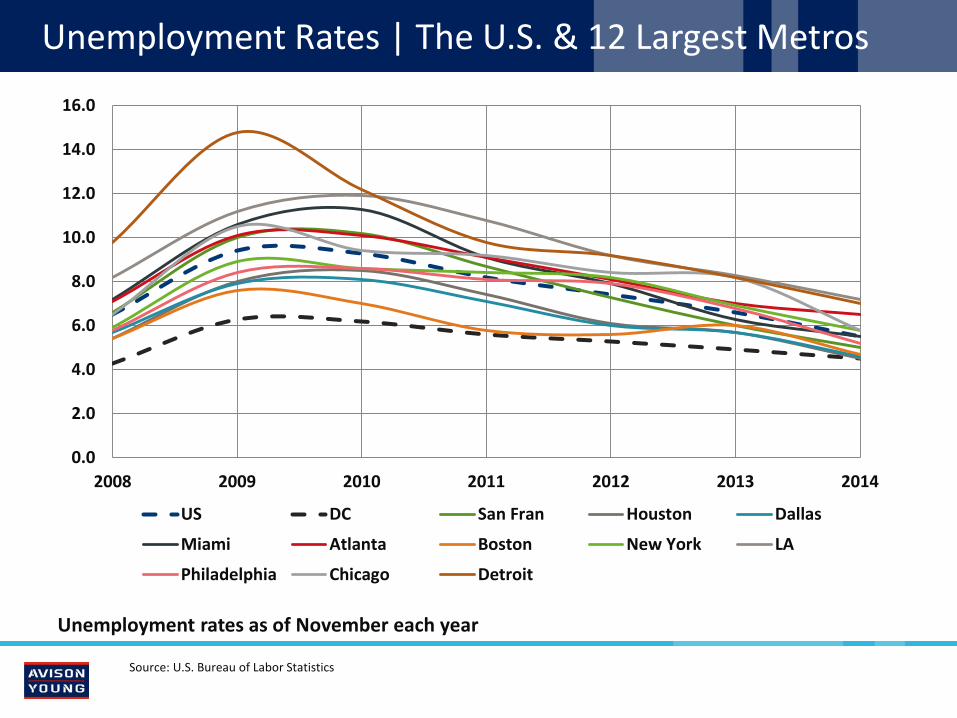
Unemployment Rates | The U.S. & 12 Largest Metros
Source: U.S. Bureau of Labor Statistics
0.0
2.0
4.0
6.0
8.0
10.0
12.0
14.0
16.0
2008 2009 2010 2011 2012 2013 2014
US DC San Fran Houston Dallas
Miami Atlanta Boston New York LA
Philadelphia Chicago Detroit
Unemployment rates as of November each year
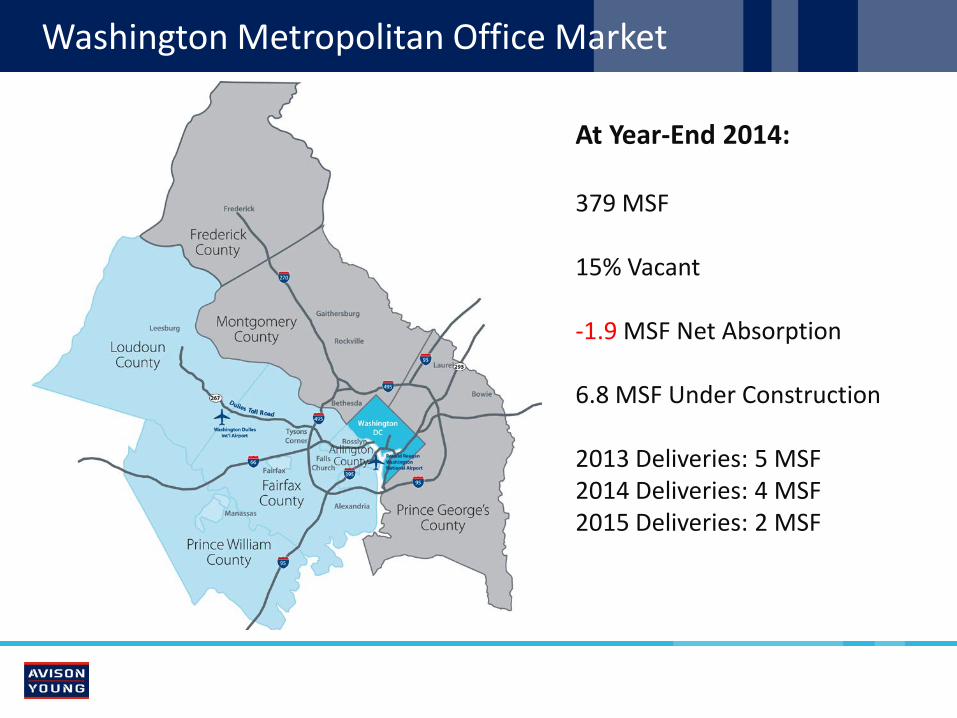
Washington Metropolitan Office Market
At Year-End 2014: 379 MSF 15% Vacant -1.9 MSF Net Absorption 6.8 MSF Under Construction 2013 Deliveries: 5 MSF 2014 Deliveries: 4 MSF 2015 Deliveries: 2 MSF
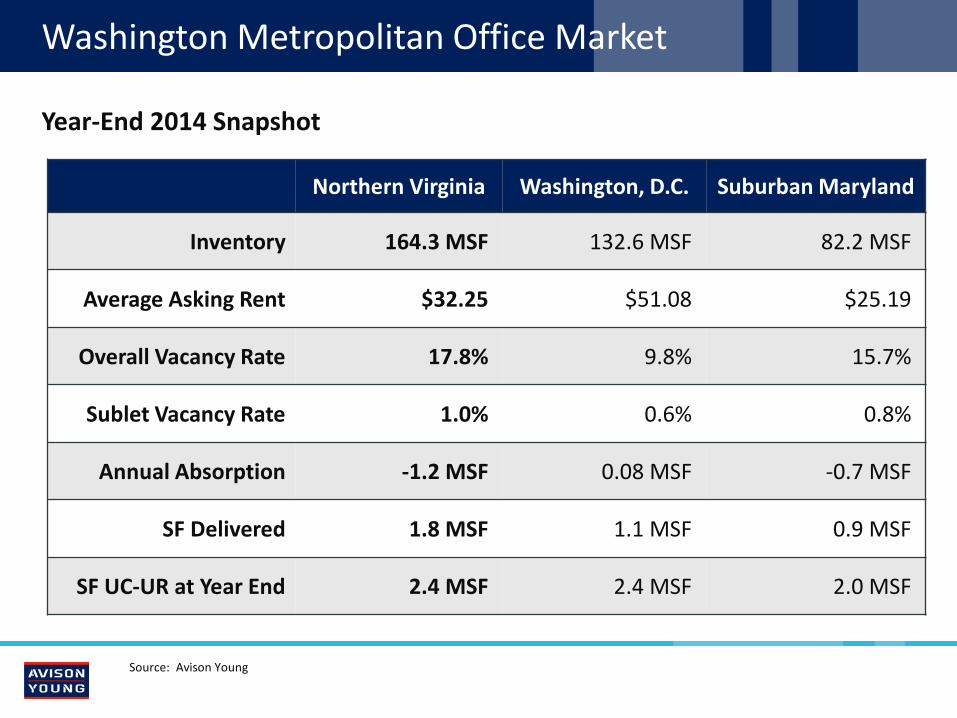
Washington Metropolitan Office Market
Year-End 2014 Snapshot
Northern Virginia Washington, D.C. Suburban Maryland
Inventory 164.3 MSF 132.6 MSF 82.2 MSF
Average Asking Rent $32.25 $51.08 $25.19
Overall Vacancy Rate 17.8% 9.8% 15.7%
Sublet Vacancy Rate 1.0% 0.6% 0.8%
Annual Absorption -1.2 MSF 0.08 MSF -0.7 MSF
SF Delivered 1.8 MSF 1.1 MSF 0.9 MSF
SF UC-UR at Year End 2.4 MSF 2.4 MSF 2.0 MSF
Source: Avison Young
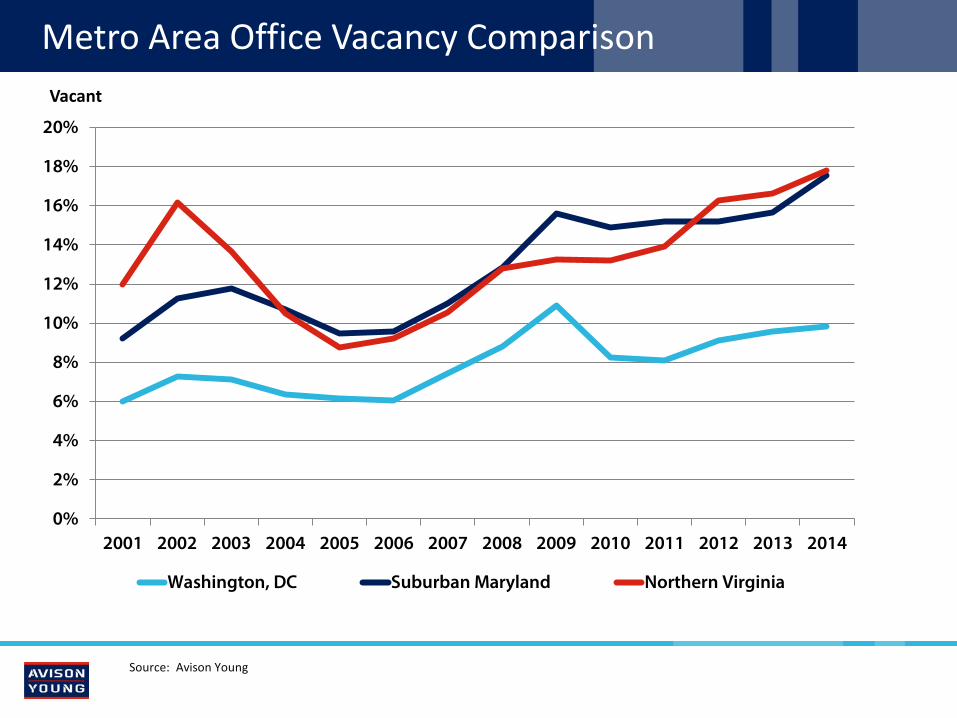
Metro Area Office Vacancy Comparison
0%
2%
4%
6%
8%
10%
12%
14%
16%
18%
20%
2001 2002 2003 2004 2005 2006 2007 2008 2009 2010 2011 2012 2013 2014
Washington, DC Suburban Maryland Northern Virginia
Vacant
Source: Avison Young

$15.00
$17.00
$19.00
$21.00
$23.00
$25.00
$27.00
$29.00
$31.00
$33.00
$35.00
-5 MSF
-3 MSF
-1 MSF
1 MSF
3 MSF
5 MSF
7 MSF
9 MSF
SF Delivered Net Absorption Rent%Vacancy
16% 12% 10% 7% 5% 4% 5% 4% 12% 16% 14% 11% 9% 9% 11% 13% 13% 13% 14% 16% 17% 18%
Northern Virginia Office
Vacancy-Deliveries-Absorption-Rent
FS Rent
Source: Avison Young
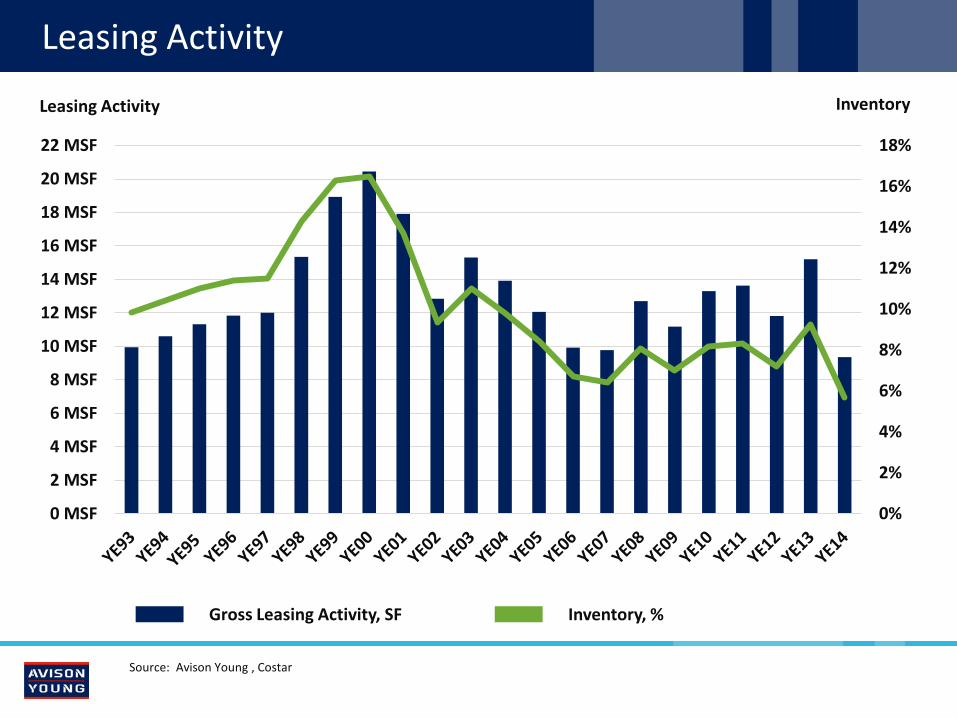
Leasing Activity
Leasing Activity
0%
2%
4%
6%
8%
10%
12%
14%
16%
18%
0 MSF
2 MSF
4 MSF
6 MSF
8 MSF
10 MSF
12 MSF
14 MSF
16 MSF
18 MSF
20 MSF
22 MSF
Source: Avison Young , Costar
Gross Leasing Activity, SF Inventory, %
Inventory
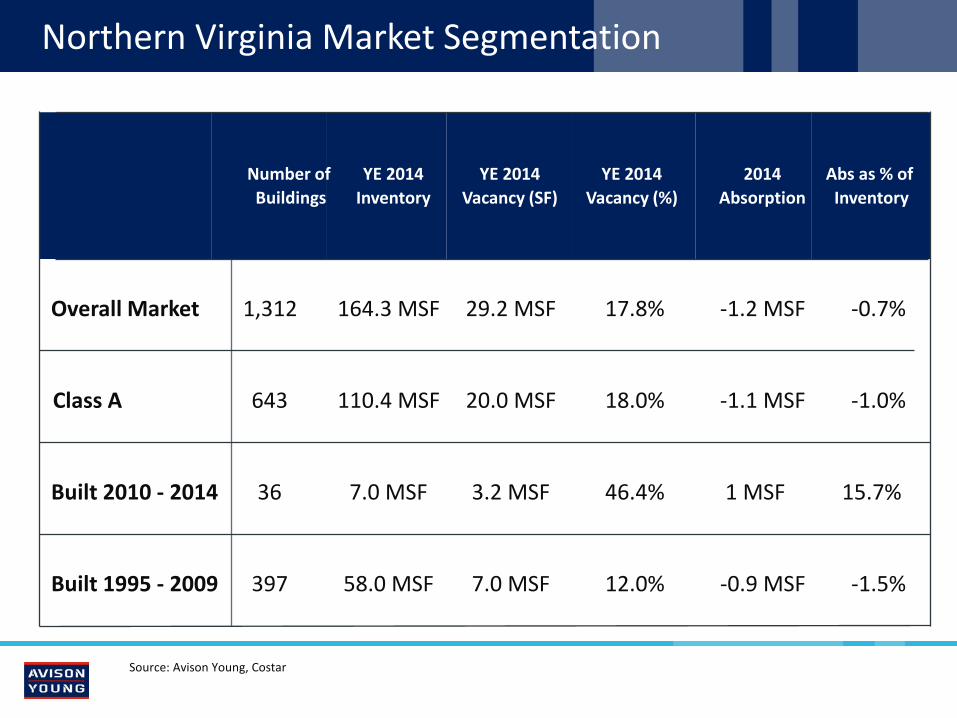
Northern Virginia Market Segmentation
Source: Avison Young, Costar
Number of Buildings
YE 2014 Inventory
YE 2014 Vacancy (SF)
YE 2014 Vacancy (%)
2014 Absorption
Abs as % of Inventory
Overall Market 1,312 164.3 MSF 29.2 MSF 17.8% -1.2 MSF -0.7%
Class A 643 110.4 MSF 20.0 MSF 18.0% -1.1 MSF -1.0%
Built 2010 - 2014 36 7.0 MSF 3.2 MSF 46.4% 1 MSF 15.7%
Built 1995 - 2009 397 58.0 MSF 7.0 MSF 12.0% -0.9 MSF -1.5%
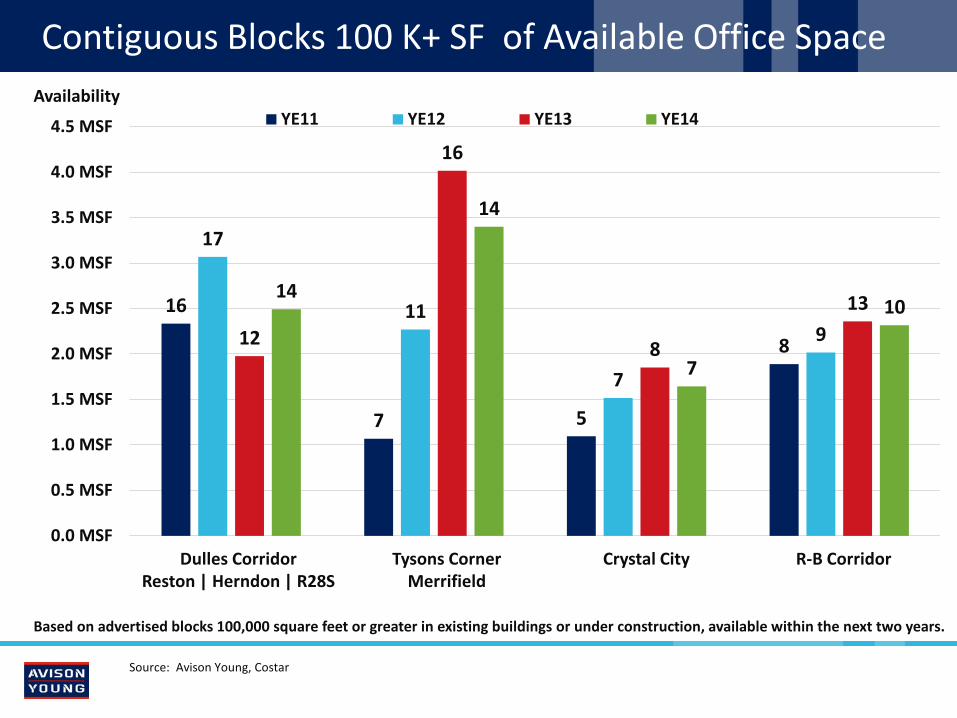
Contiguous Blocks 100 K+ SF of Available Office Space
16
7 5
8
17
11
7
9 12
16
8
13 14
14
7
10
0.0 MSF
0.5 MSF
1.0 MSF
1.5 MSF
2.0 MSF
2.5 MSF
3.0 MSF
3.5 MSF
4.0 MSF
4.5 MSF YE11 YE12 YE13 YE14
Based on advertised blocks 100,000 square feet or greater in existing buildings or under construction, available within the next two years.
Source: Avison Young, Costar
Availability
Dulles Corridor Reston | Herndon | R28S
R-B Corridor Crystal City Tysons Corner Merrifield
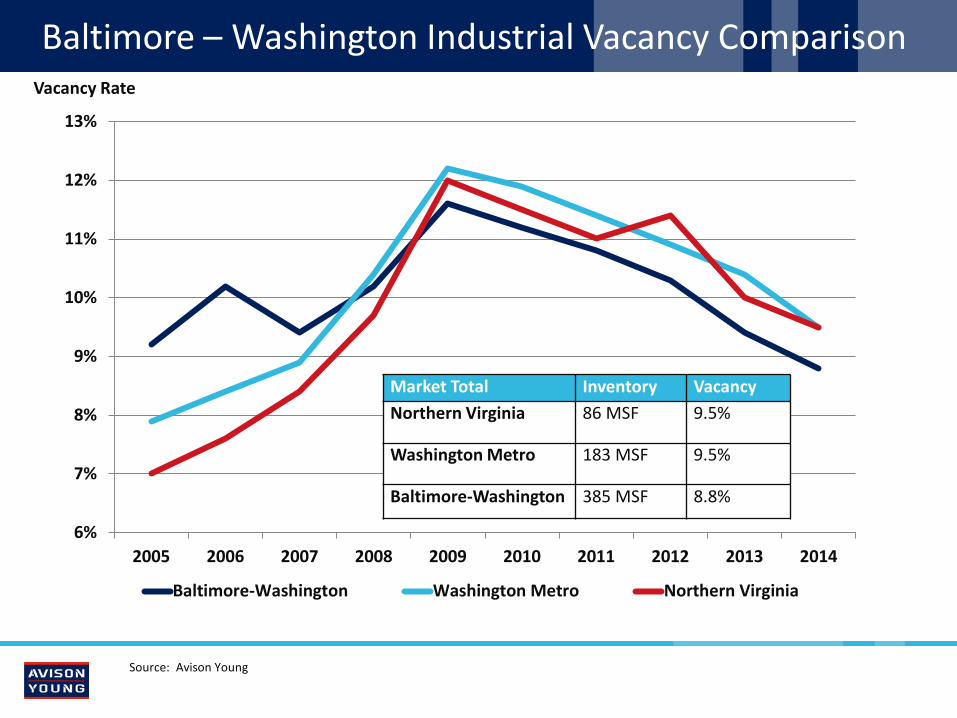
Baltimore – Washington Industrial Vacancy Comparison
6%
7%
8%
9%
10%
11%
12%
13%
2005 2006 2007 2008 2009 2010 2011 2012 2013 2014
Baltimore-Washington Washington Metro Northern Virginia
Source: Avison Young
Vacancy Rate
Market Total Inventory Vacancy Northern Virginia 86 MSF 9.5%
Washington Metro 183 MSF 9.5%
Baltimore-Washington 385 MSF 8.8%
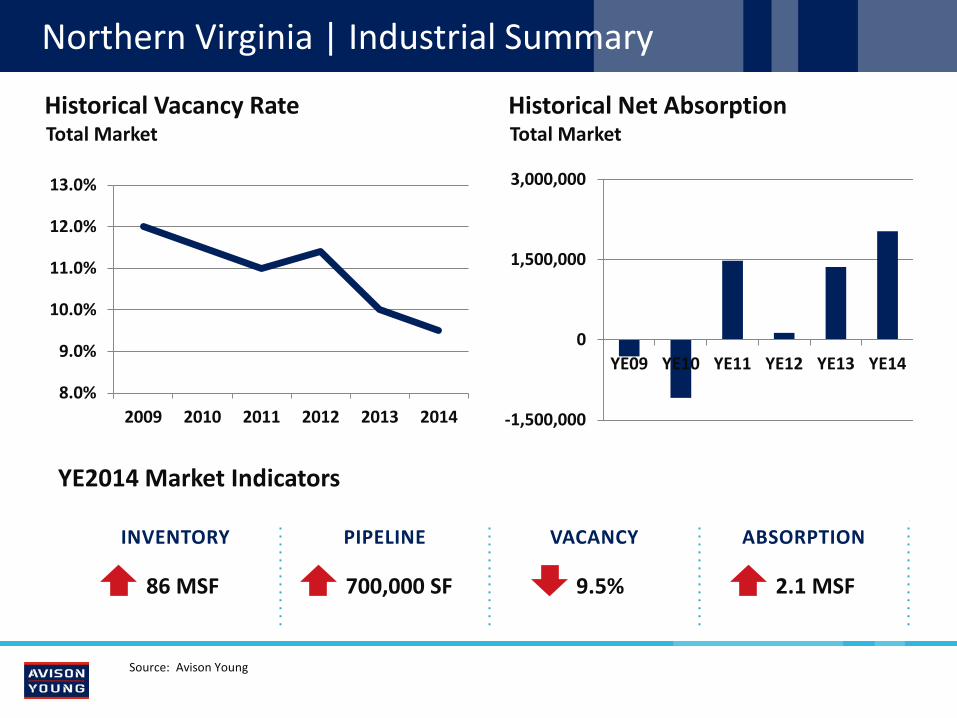
Northern Virginia | Industrial Summary
YE2014 Market Indicators
INVENTORY PIPELINE VACANCY
ABSORPTION
Historical Vacancy Rate Total Market
8.0%
9.0%
10.0%
11.0%
12.0%
13.0%
2009 2010 2011 2012 2013 2014 -1,500,000
0
1,500,000
3,000,000
YE09 YE10 YE11 YE12 YE13 YE14
Source: Avison Young
Historical Net Absorption Total Market
86 MSF 700,000 SF 2.1 MSF 9.5%

Trends & Takeaways
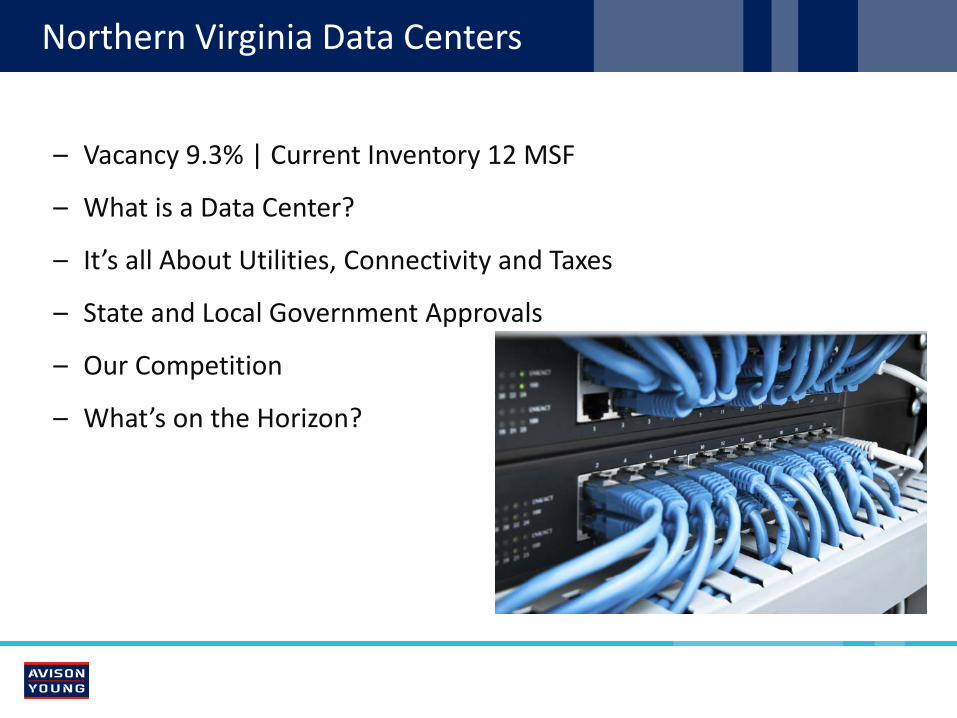
Northern Virginia Data Centers
– Vacancy 9.3% | Current Inventory 12 MSF
– What is a Data Center?
– It’s all About Utilities, Connectivity and Taxes
– State and Local Government Approvals
– Our Competition
– What’s on the Horizon?
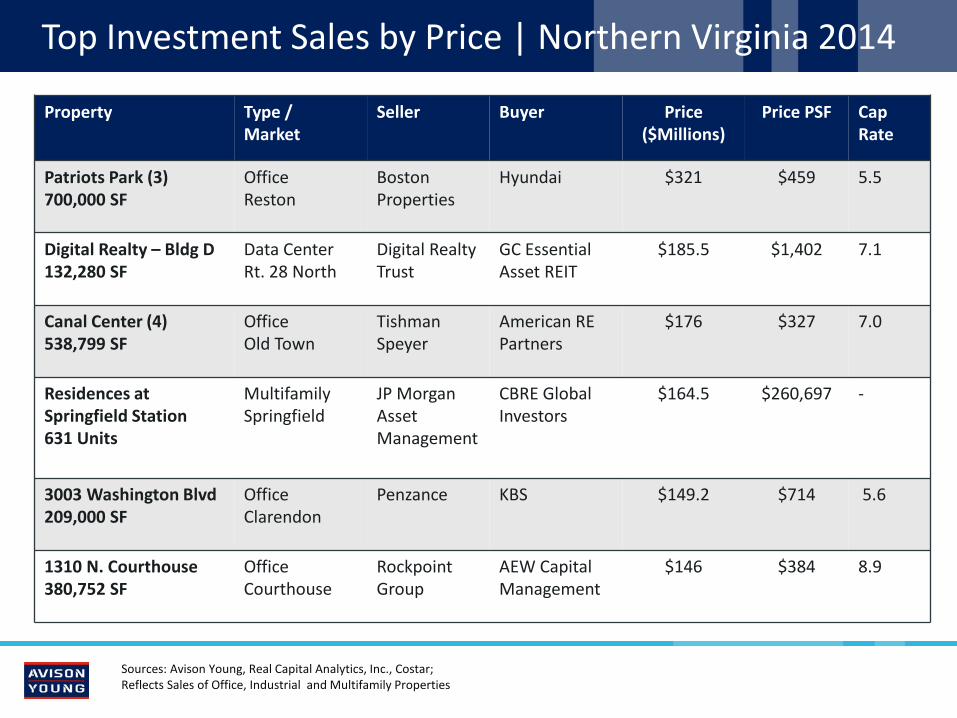
Top Investment Sales by Price | Northern Virginia 2014
Sources: Avison Young, Real Capital Analytics, Inc., Costar; Reflects Sales of Office, Industrial and Multifamily Properties
Property Type / Market
Seller Buyer Price ($Millions)
Price PSF Cap Rate
Patriots Park (3) 700,000 SF
Office Reston
Boston Properties
Hyundai $321 $459 5.5
Digital Realty – Bldg D 132,280 SF
Data Center Rt. 28 North
Digital Realty Trust
GC Essential Asset REIT
$185.5 $1,402 7.1
Canal Center (4) 538,799 SF
Office Old Town
Tishman Speyer
American RE Partners
$176 $327 7.0
Residences at Springfield Station 631 Units
Multifamily Springfield
JP Morgan Asset Management
CBRE Global Investors
$164.5 $260,697 -
3003 Washington Blvd 209,000 SF
Office Clarendon
Penzance KBS $149.2 $714 5.6
1310 N. Courthouse 380,752 SF
Office Courthouse
Rockpoint Group
AEW Capital Management
$146 $384 8.9

Metro Area Sales Volume | By Property Type
$0 B
$5 B
$10 B
$15 B
$20 B
$25 B
$30 B
$35 B
2007 2008 2009 2010 2011 2012 2013 2014
Office Industrial Retail Multi-Family
Source: Real Capital Analytics, Inc.
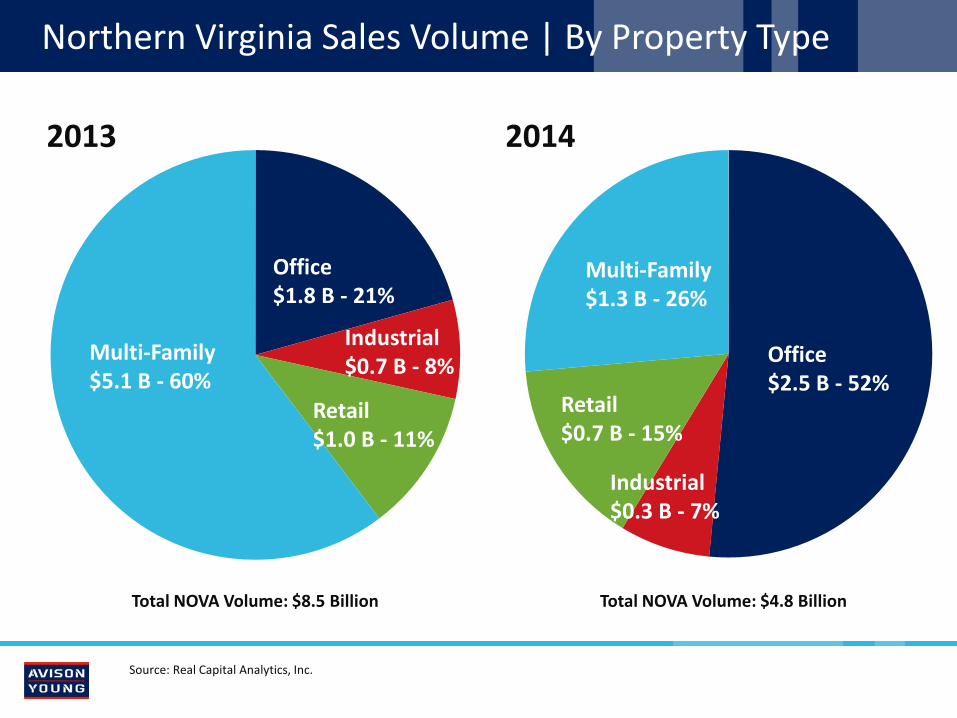
Northern Virginia Sales Volume | By Property Type
Total NOVA Volume: $8.5 Billion
Source: Real Capital Analytics, Inc.
Multi-Family $5.1 B - 60%
Retail $1.0 B - 11%
Industrial $0.7 B - 8%
Office $1.8 B - 21%
2013
Total NOVA Volume: $4.8 Billion
Multi-Family $1.3 B - 26%
Retail $0.7 B - 15%
Industrial $0.3 B - 7%
Office $2.5 B - 52%
2014
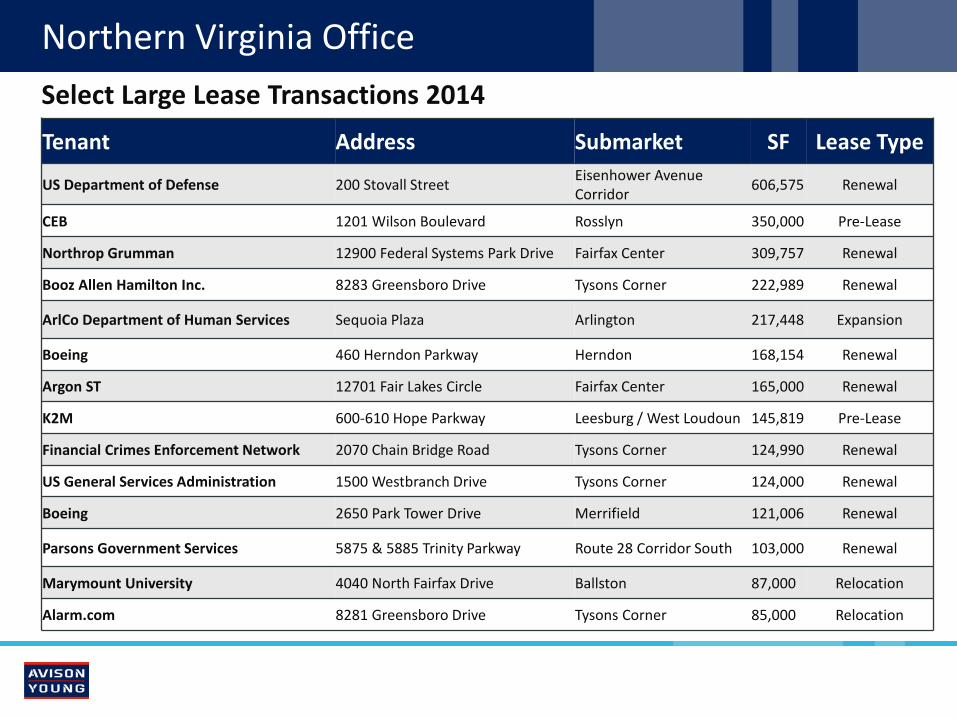
Northern Virginia Office
Tenant Address Submarket SF Lease Type
US Department of Defense 200 Stovall Street Eisenhower Avenue Corridor 606,575 Renewal
CEB 1201 Wilson Boulevard Rosslyn 350,000 Pre-Lease
Northrop Grumman 12900 Federal Systems Park Drive Fairfax Center 309,757 Renewal
Booz Allen Hamilton Inc. 8283 Greensboro Drive Tysons Corner 222,989 Renewal
ArlCo Department of Human Services Sequoia Plaza Arlington 217,448 Expansion
Boeing 460 Herndon Parkway Herndon 168,154 Renewal
Argon ST 12701 Fair Lakes Circle Fairfax Center 165,000 Renewal
K2M 600-610 Hope Parkway Leesburg / West Loudoun 145,819 Pre-Lease
Financial Crimes Enforcement Network 2070 Chain Bridge Road Tysons Corner 124,990 Renewal
US General Services Administration 1500 Westbranch Drive Tysons Corner 124,000 Renewal
Boeing 2650 Park Tower Drive Merrifield 121,006 Renewal
Parsons Government Services 5875 & 5885 Trinity Parkway Route 28 Corridor South 103,000 Renewal
Marymount University 4040 North Fairfax Drive Ballston 87,000 Relocation
Alarm.com 8281 Greensboro Drive Tysons Corner 85,000 Relocation
Select Large Lease Transactions 2014

Notable Office Tenant Rightsizing
Tenant Submarket New SF Old SF Net SF Change
Intelsat Tysons Corner 211,000 525,000 (314,000)
U.S. Fish and Wildlife Service
Skyline 188,000 270,000 (82,000)
FinCEN Tysons Corner 125,000 162,000 (37,000)
AES Corporation Ballston 71,000 114,000 (43,000)
Government Contracting Environment
– Budget War or Truce?
– Growth: Cyber, ISR, UAS, Special Ops and Medical
– Impact of 2016 Election
– Downward Pressure on Bids
– Consolidation and Acquisition
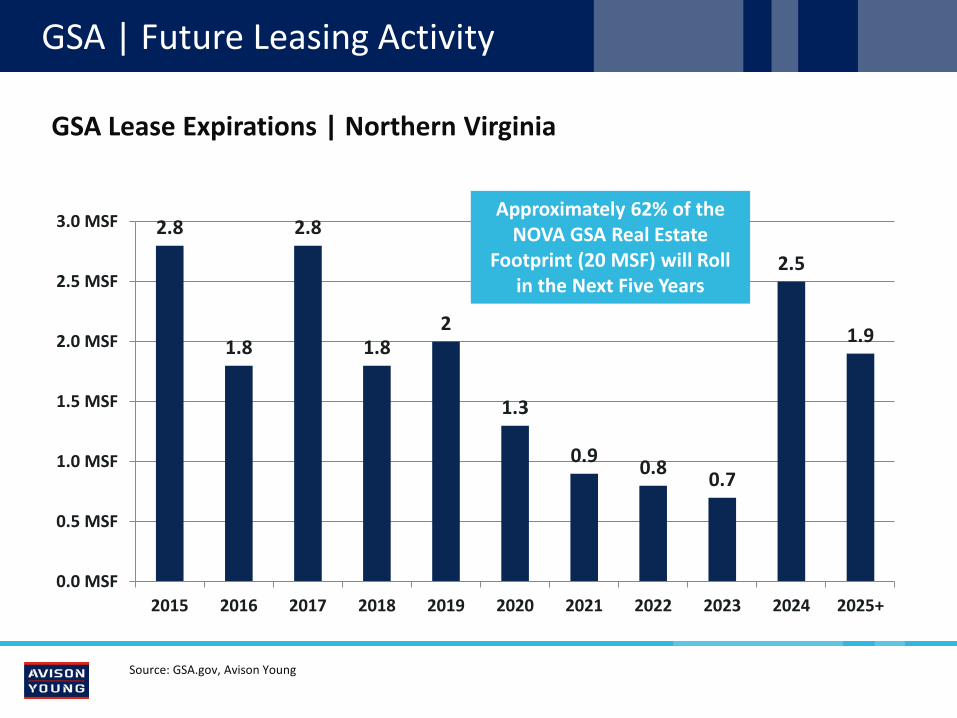
2.8
1.8
2.8
1.8 2
1.3
0.9 0.8 0.7
2.5
1.9
0.0 MSF
0.5 MSF
1.0 MSF
1.5 MSF
2.0 MSF
2.5 MSF
3.0 MSF
2015 2016 2017 2018 2019 2020 2021 2022 2023 2024 2025+
GSA | Future Leasing Activity
GSA Lease Expirations | Northern Virginia
Source: GSA.gov, Avison Young
Approximately 62% of the NOVA GSA Real Estate
Footprint (20 MSF) will Roll in the Next Five Years

GSA
– Freeze the Footprint
– Prospectus – Level Procurements
– Targeting Efficiency
– AAAP
– The Big Prize : FBI

FBI Procurement
– Finalist sites: Landover, Greenbelt and Springfield
– Swap of the J. Edgar Hoover Building (D.C.)
– 2.1 MSF
– 11,000 Personnel
– New Headquarters to Include: – Main Office Building – A Visitors Center – Parking Garage(s) – Remote Delivery & Screening Facility – Central Utility Plant
The Requirement

FBI Procurement
February 10, 2015: Initial Offers to RFP Phase I
May 2015: Selection of Up to 5 Developers to Proceed to Phase II
May 2015: Phase II RFP Issued
May 2016: AWARD
July 2016: GSA Land Options Expire
December 2022: Final Occupancy
The Schedule
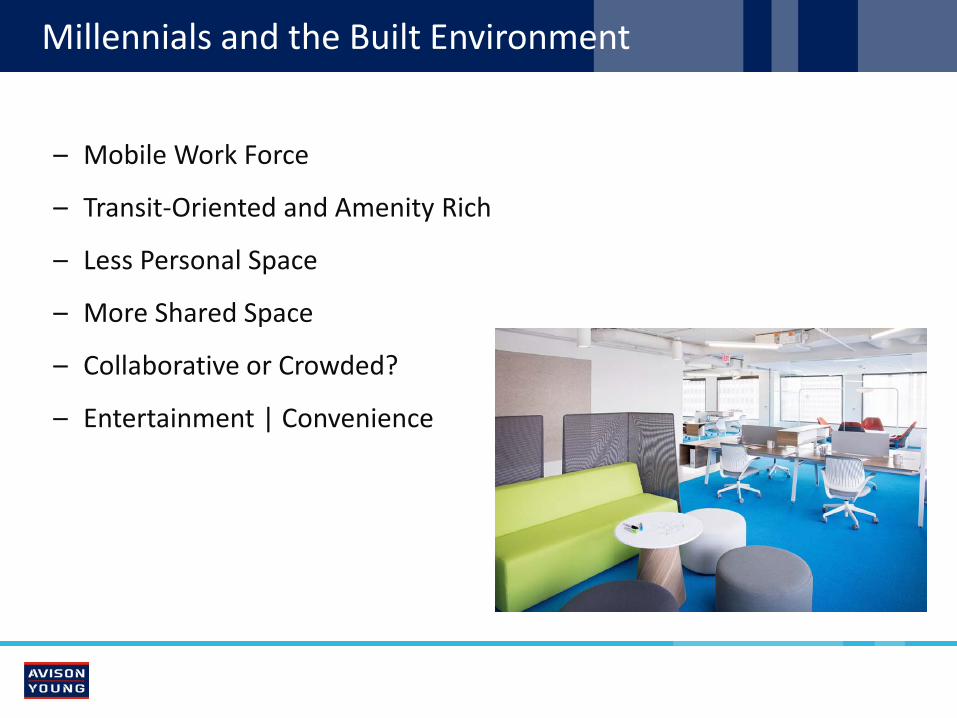
Millennials and the Built Environment
– Mobile Work Force
– Transit-Oriented and Amenity Rich
– Less Personal Space
– More Shared Space
– Collaborative or Crowded?
– Entertainment | Convenience
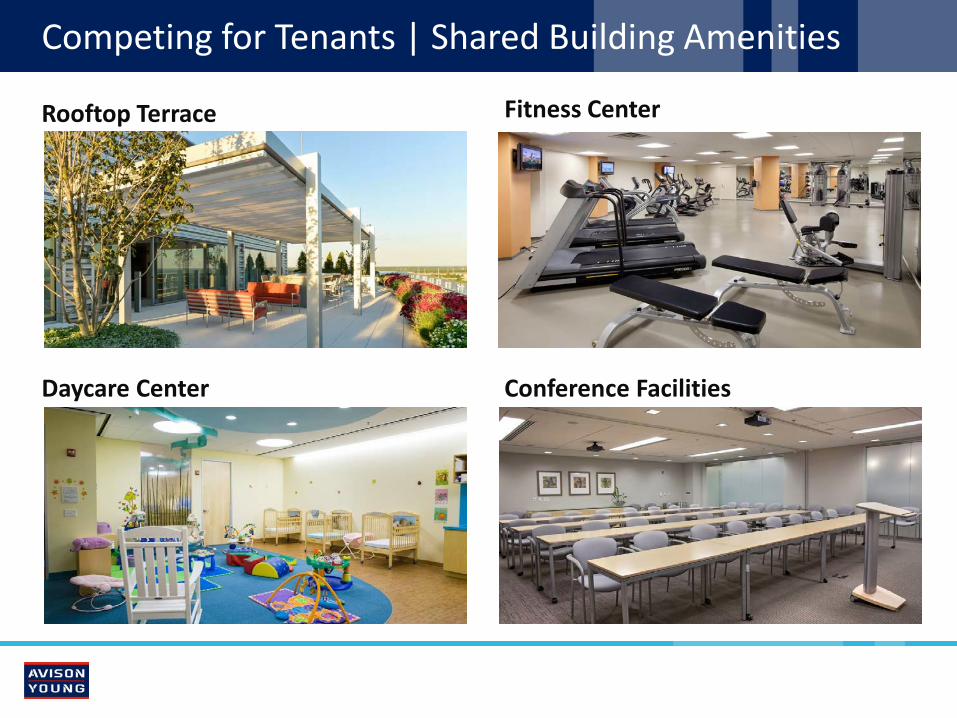
Competing for Tenants | Shared Building Amenities
Rooftop Terrace Fitness Center
Conference Facilities Daycare Center
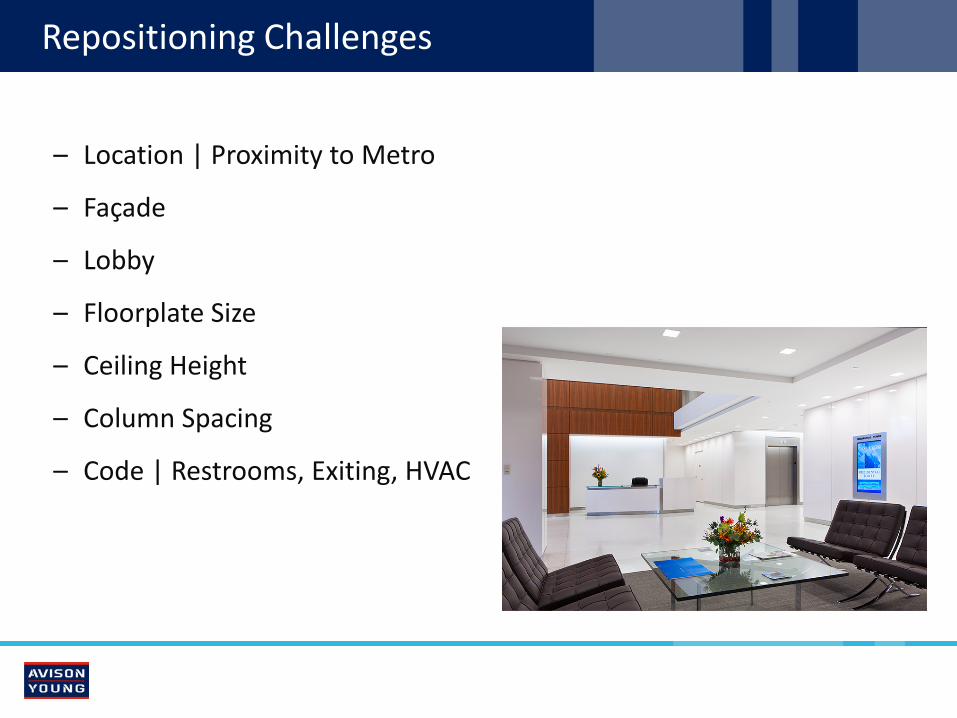
Repositioning Challenges
– Location | Proximity to Metro
– Façade
– Lobby
– Floorplate Size
– Ceiling Height
– Column Spacing
– Code | Restrooms, Exiting, HVAC
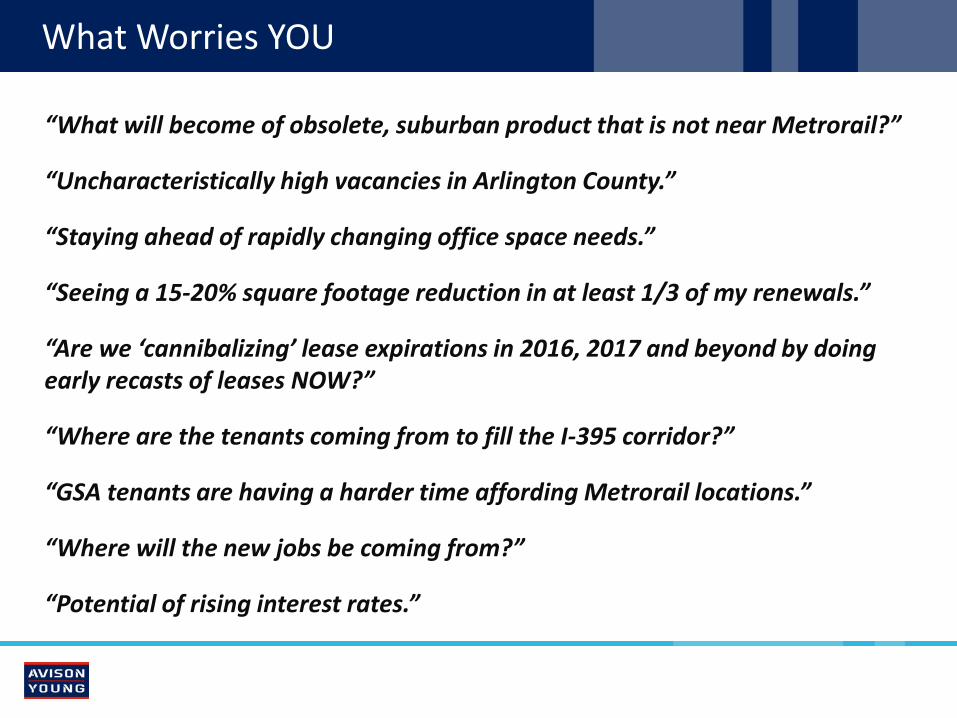
What Worries YOU
“What will become of obsolete, suburban product that is not near Metrorail?”
“Uncharacteristically high vacancies in Arlington County.”
“Staying ahead of rapidly changing office space needs.”
“Seeing a 15-20% square footage reduction in at least 1/3 of my renewals.”
“Are we ‘cannibalizing’ lease expirations in 2016, 2017 and beyond by doing early recasts of leases NOW?”
“Where are the tenants coming from to fill the I-395 corridor?”
“GSA tenants are having a harder time affording Metrorail locations.”
“Where will the new jobs be coming from?”
“Potential of rising interest rates.”
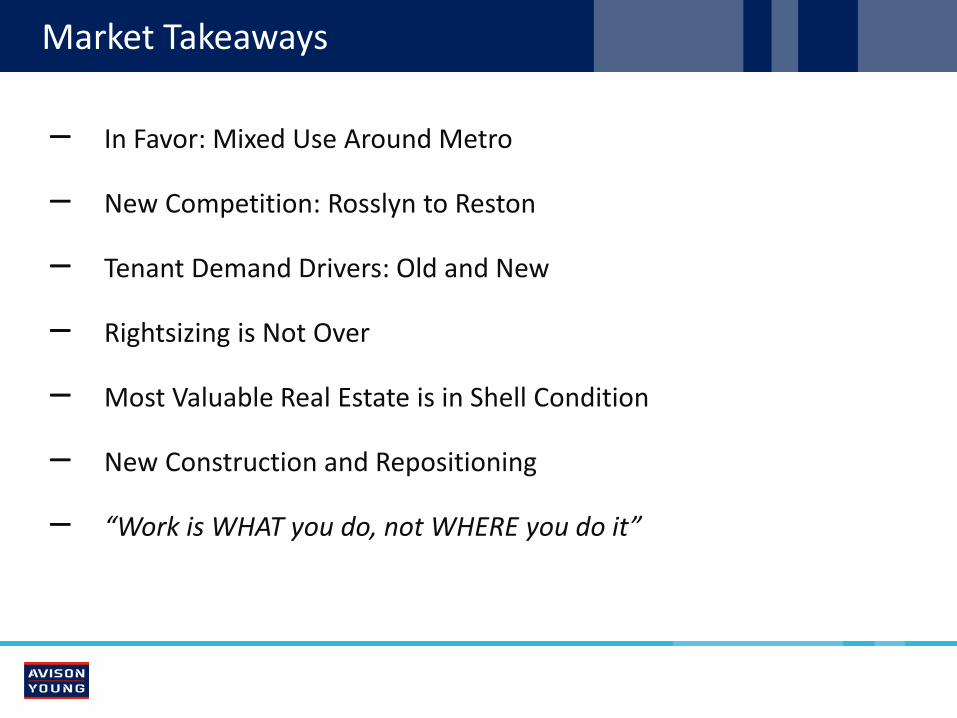
Market Takeaways
– In Favor: Mixed Use Around Metro
– New Competition: Rosslyn to Reston
– Tenant Demand Drivers: Old and New
– Rightsizing is Not Over
– Most Valuable Real Estate is in Shell Condition
– New Construction and Repositioning
– “Work is WHAT you do, not WHERE you do it”
avisonyoung.com
©2015 Avison Young Washington DC LLC. All rights reserved.
Thank You!
Sam Abramson Paul Adkins Jason Alexander Marty Almquist Brian Benninghoff Peter Berk David Birtwistle Anthony Chang Mike Cooper Jim Creedon Andy Czekaj Janet Davis Brian Fitzgerald Barry Gosnell Jill Goubeaux Elaine Gray Nick Gregorios
Bill Hard Bert Harrell Lauryn Harris Peter Johnston Michael Jones Michael Klein Brian Kriz Peter Lunt Duncan Lyons Martha Marks Michelle Melvern Barbara McDuffie Doug McLearn Laurey Millspaugh Jessica Mistrik Mara Olguin David Orr
Pete Otteni Ulyana Radisavljevic Tom Regnell Joe Ritchey Ray Ritchey Kara Schab Peter Scholz Brian Scull John Shooshan Benita Stocks Harmar Thompson Andrew Van Horn Rob Walters Larry Welsh Ed Zaptin
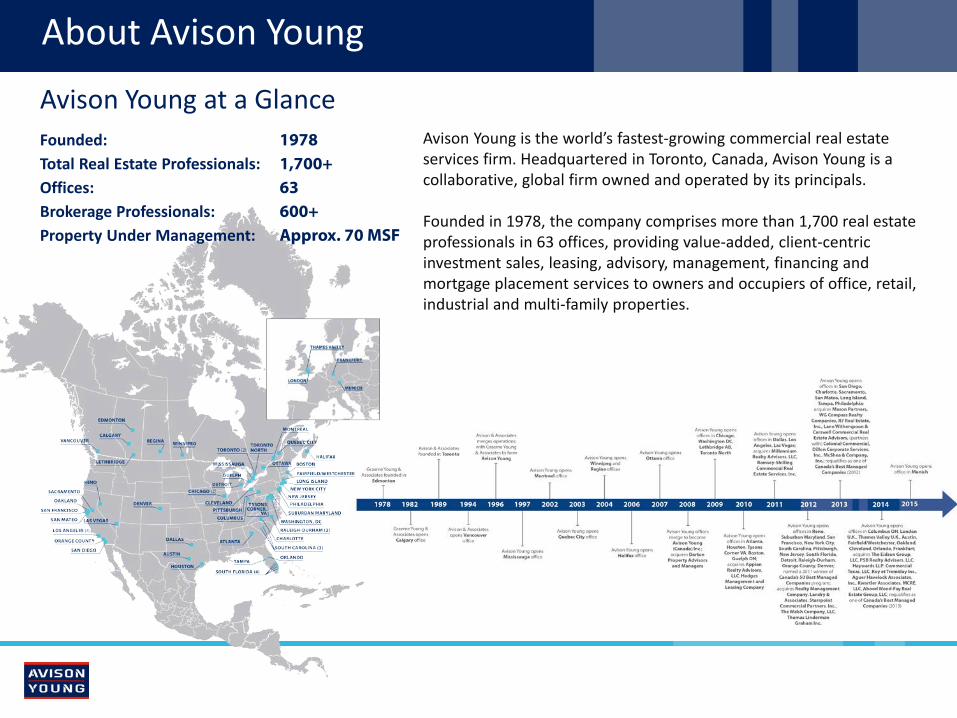
About Avison Young
Avison Young is the world’s fastest-growing commercial real estate services firm. Headquartered in Toronto, Canada, Avison Young is a collaborative, global firm owned and operated by its principals. Founded in 1978, the company comprises more than 1,700 real estate professionals in 63 offices, providing value-added, client-centric investment sales, leasing, advisory, management, financing and mortgage placement services to owners and occupiers of office, retail, industrial and multi-family properties.
Avison Young at a Glance Founded: 1978 Total Real Estate Professionals: 1,700+ Offices: 63 Brokerage Professionals: 600+ Property Under Management: Approx. 70 MSF
avisonyoung.com
©2015 Avison Young Washington DC LLC. All rights reserved.
The information contained herein was obtained from sources deemed reliable and is believed to be true; it has not been verified and as such, cannot be warranted nor form any part of any future contract.
Margaret Donkerbrook Vice President, U.S. Research O 202.644.8700 D 202.644.8677 [email protected] Dave Millard Principal O 703.288.2700 D 703.752.4921 [email protected]
Avison Young | Contact Information