oklahoma regional demographic profiles
DESCRIPTION
Oklahoma Regional Demographic Profiles. Southern Region. Created from the U.S. Census Bureau’s American Community Survey (2005-07 Public Use Microdata Sample) June 2009. Created by the National Center for Higher Education Management Systems. Oklahoma Regions for “Making Place Matter” Data. - PowerPoint PPT PresentationTRANSCRIPT

Oklahoma Regional Demographic Profiles
Created from the U.S. Census Bureau’s American Community Survey (2005-07 Public Use Microdata Sample)
June 2009
Created by the National Center for Higher Education Management Systems
Southern Region

1
2
3
4
5
76
8
9
10 1112
13
14
15
1. Northwest/Panhandle2. Southwest3. South Central/Lawton4. El Reno/Chickasha5. Enid/Ponca City6. Oklahoma City Metro7. Guthrie/Shawnee8. Norman/Moore9. Southern10.Osage/Stillwater/Seminole11. Tulsa County12. Rogers/Wagoner13. Northeast14. Eastern15. Southeast
Oklahoma Regions for “Making Place Matter” Data
U.S. Census Bureau’s Public UseMicrodata Samples
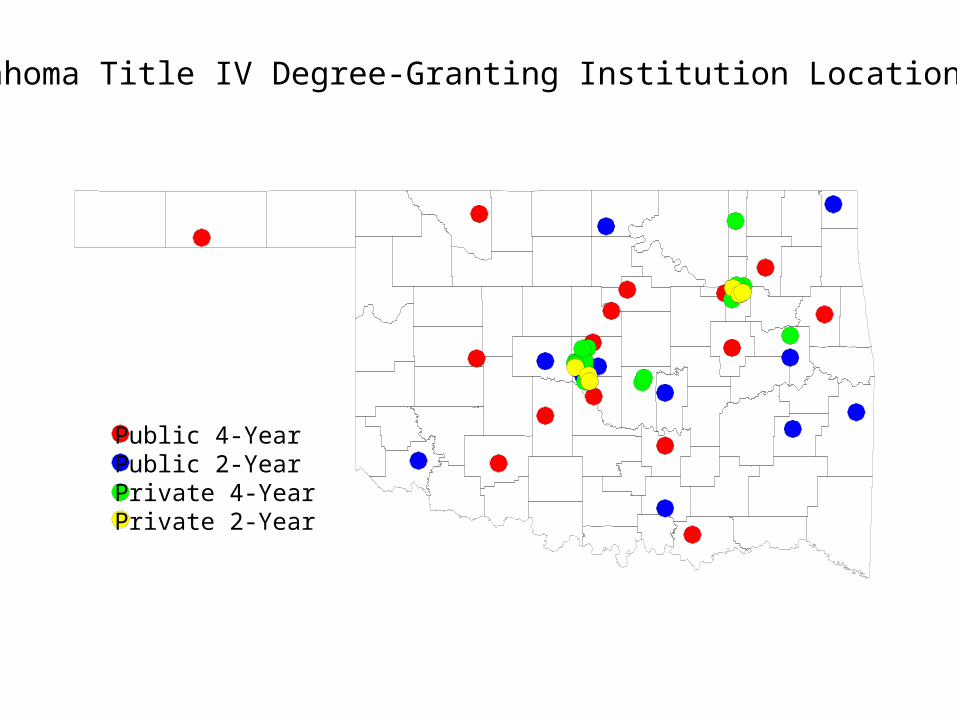
Oklahoma Title IV Degree-Granting Institution Locations
Public 4-YearPublic 2-YearPrivate 4-YearPrivate 2-Year
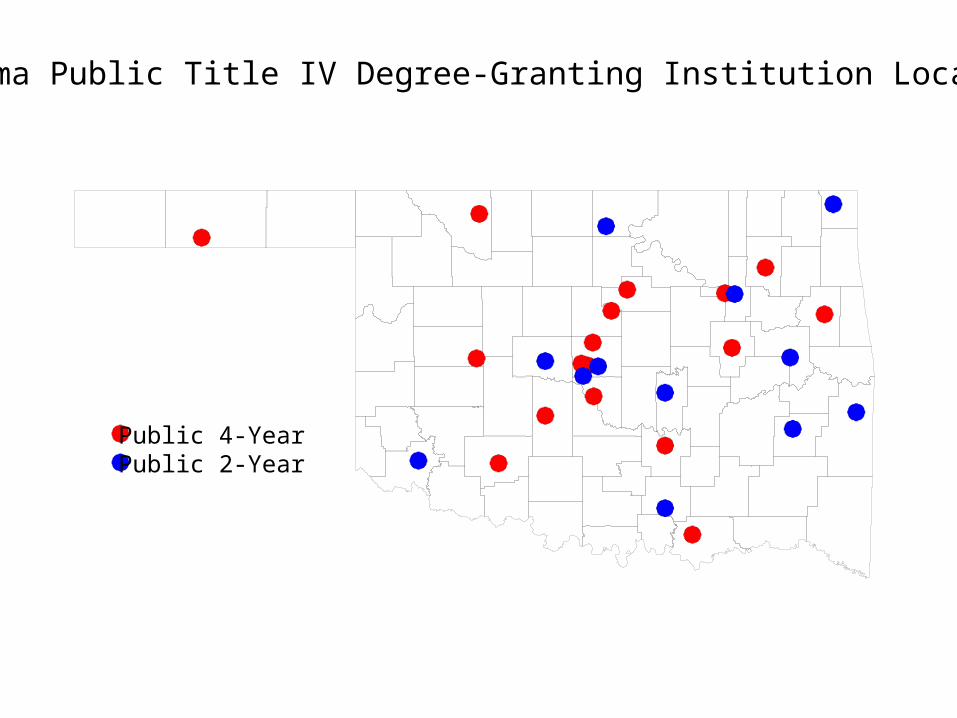
Oklahoma Public Title IV Degree-Granting Institution Locations
Public 4-YearPublic 2-Year
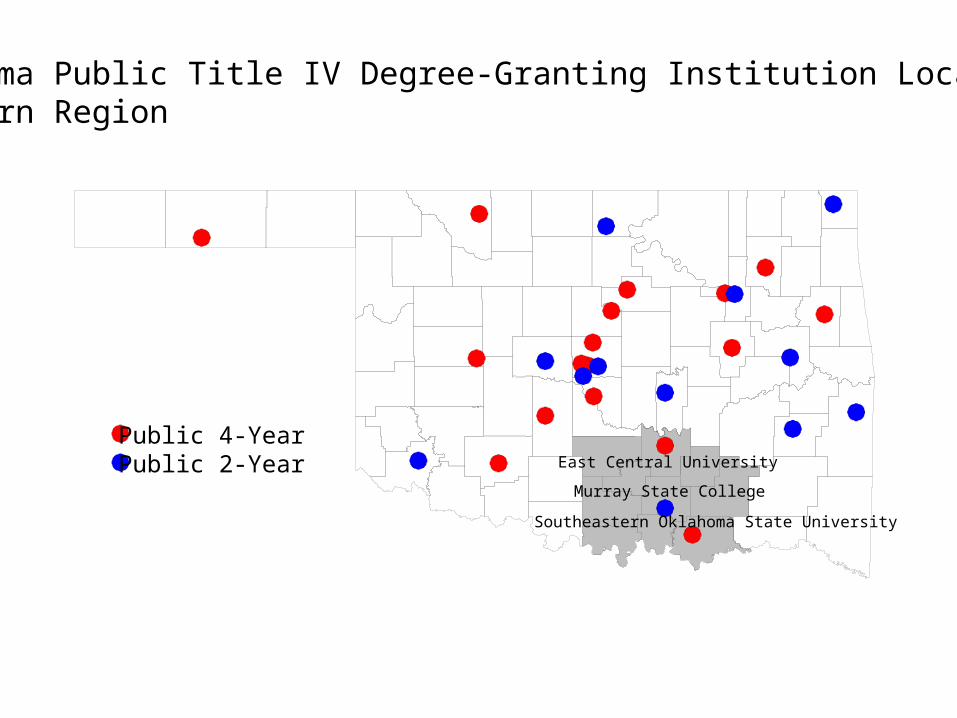
Oklahoma Public Title IV Degree-Granting Institution LocationsSouthern Region
Public 4-YearPublic 2-Year East Central University
Murray State College
Southeastern Oklahoma State University
Logan
Cleveland
Pottawatomie
Atoka
PittsburgHughes
Seminole
Okfuskee
Okmulgee
Greer
Roger Mills
Ellis
Woodward
Major
Mcclain
JeffersonCarter
Murray
Love
Le Flore
Haskell
Sequoyah
Muskogee
CherokeeAdairWagoner
Tulsa
Rogers
WoodsAlfalfaBeaver
Beckham
Blaine
Bryan
Caddo
Canadian
Choctaw
Cimarron
CoalComanche
Cotton
Craig
Creek
Custer
Delaware
Dewey
Garfield
Garvin
Grady
Grant
Harmon
Harper
Jackson
Johnston
Kay
Kingfisher
Kiowa Latimer
Lincoln
Marshall
Mayes
Mccurtain
Mcintosh
Noble
Nowata
Oklahoma
Osage
Ottawa
Pawnee
Payne
Pontotoc
PushmatahaStephens
Texas
Tillman
Washington
Washita
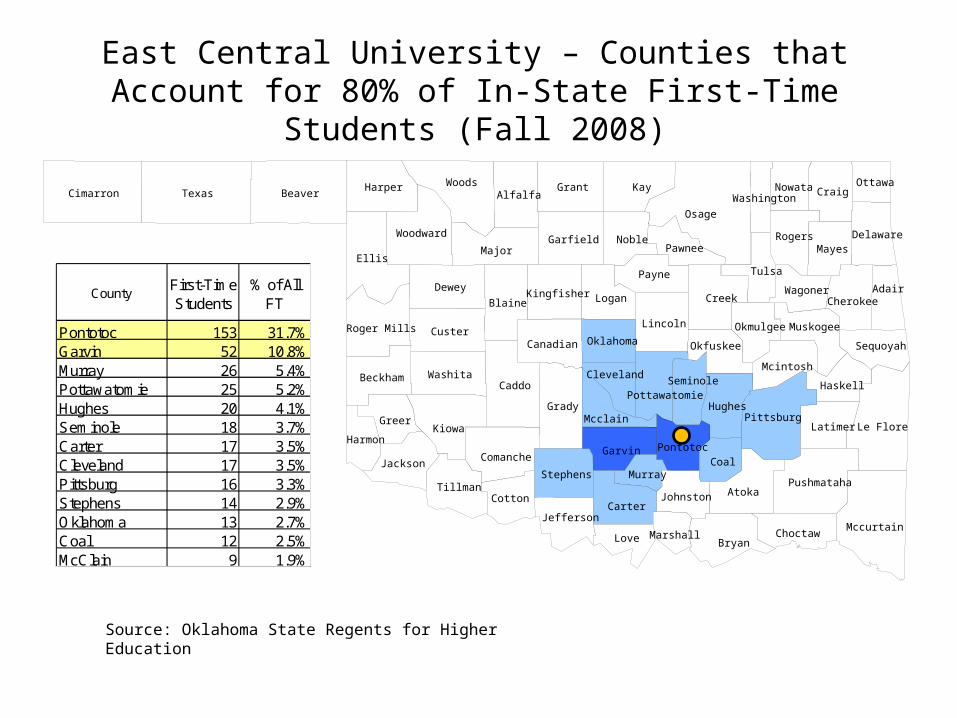
East Central University – Counties that Account for 80% of In-State First-Time Students (Fall 2008)
Source: Oklahoma State Regents for Higher Education
CountyFirst-Time Students
% of All FT
Pontotoc 153 31.7%Garvin 52 10.8%Murray 26 5.4%Pottawatomie 25 5.2%Hughes 20 4.1%Seminole 18 3.7%Carter 17 3.5%Cleveland 17 3.5%Pittsburg 16 3.3%Stephens 14 2.9%Oklahoma 13 2.7%Coal 12 2.5%McClain 9 1.9%
Logan
Cleveland
Pottawatomie
Atoka
PittsburgHughes
Seminole
Okfuskee
Okmulgee
Greer
Roger Mills
Ellis
Woodward
Major
Mcclain
JeffersonCarter
Murray
Love
Le Flore
Haskell
Sequoyah
Muskogee
CherokeeAdairWagoner
Tulsa
Rogers
WoodsAlfalfaBeaver
Beckham
Blaine
Bryan
Caddo
Canadian
Choctaw
Cimarron
CoalComanche
Cotton
Craig
Creek
Custer
Delaware
Dewey
Garfield
Garvin
Grady
Grant
Harmon
Harper
Jackson
Johnston
Kay
Kingfisher
Kiowa Latimer
Lincoln
Marshall
Mayes
Mccurtain
Mcintosh
Noble
Nowata
Oklahoma
Osage
Ottawa
Pawnee
Payne
Pontotoc
PushmatahaStephens
Texas
Tillman
Washington
Washita
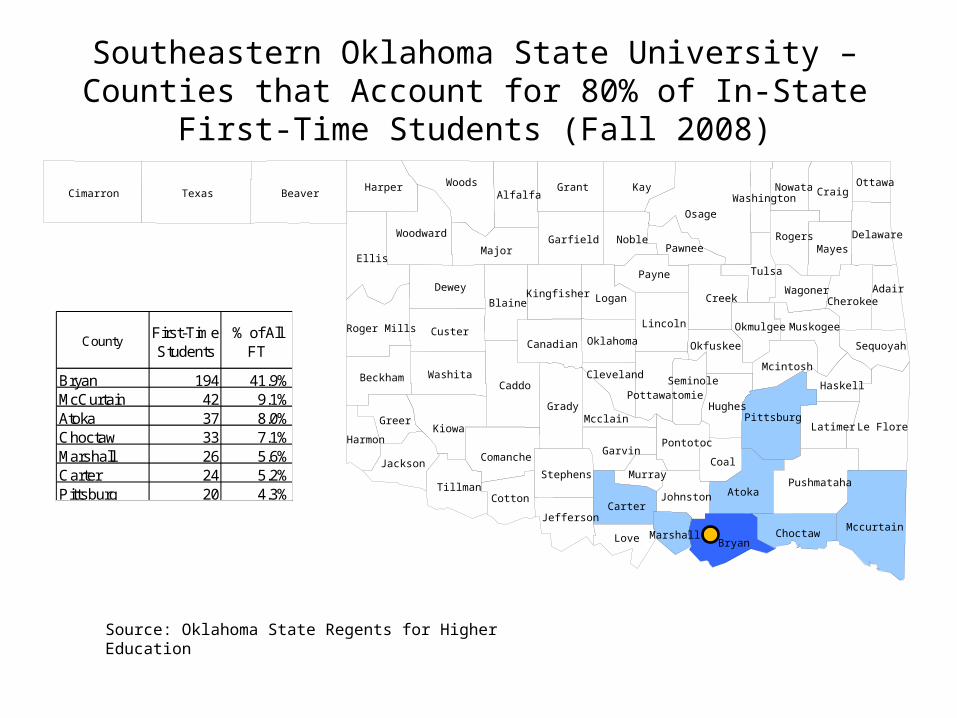
Southeastern Oklahoma State University – Counties that Account for 80% of In-State First-Time Students (Fall 2008)
Source: Oklahoma State Regents for Higher Education
CountyFirst-Time Students
% of All FT
Bryan 194 41.9%McCurtain 42 9.1%Atoka 37 8.0%Choctaw 33 7.1%Marshall 26 5.6%Carter 24 5.2%Pittsburg 20 4.3%
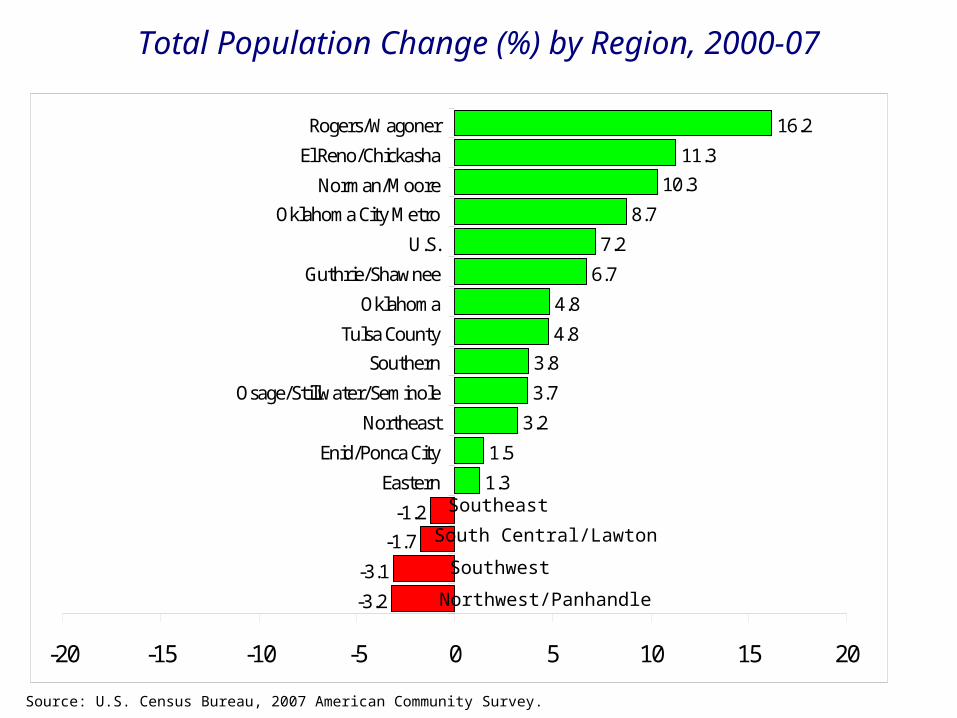
-3.2
-3.1
-1.7-1.2
1.3
1.5
3.2
3.7
3.84.8
4.8
6.7
7.2
8.7
10.311.3
16.2
-20 -15 -10 -5 0 5 10 15 20
Eastern
Enid/Ponca City
Northeast
Osage/Stillwater/Seminole
SouthernTulsa County
Oklahoma
Guthrie/Shawnee
U.S.
Oklahoma City MetroNorman/Moore
El Reno/Chickasha
Rogers/Wagoner
Total Population Change (%) by Region, 2000-07
Source: U.S. Census Bureau, 2007 American Community Survey.
Southeast
South Central/Lawton
Southwest
Northwest/Panhandle
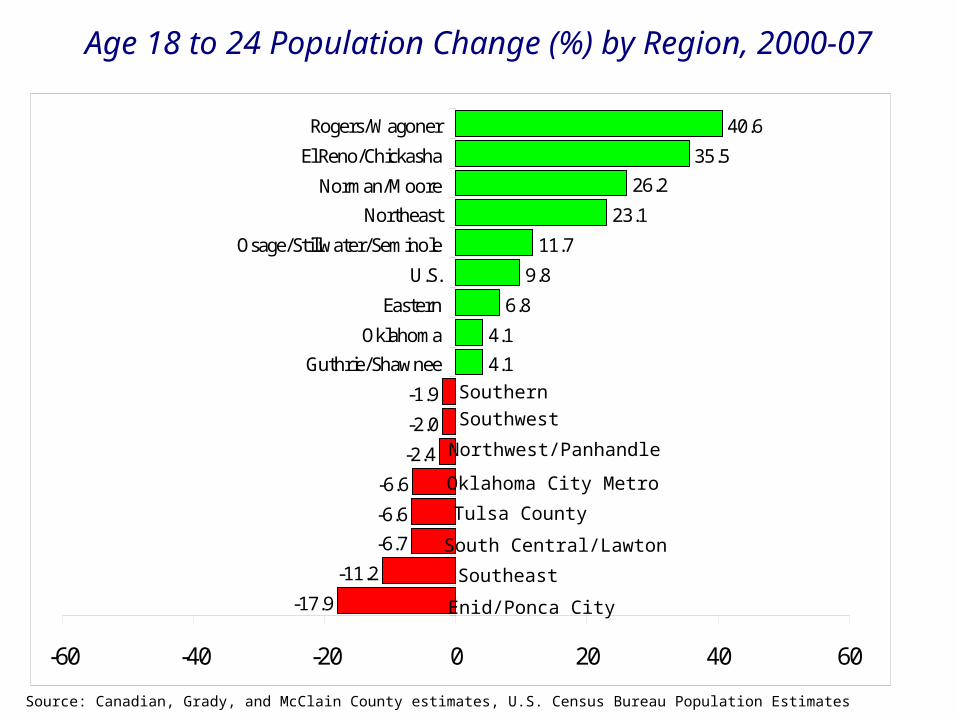
-17.9
-11.2
-6.7
-6.6
-6.6
-2.4
-2.0
-1.9
4.1
4.1
6.8
9.8
11.7
23.1
26.2
35.5
40.6
-60 -40 -20 0 20 40 60
Guthrie/Shawnee
Oklahoma
Eastern
U.S.
Osage/Stillwater/Seminole
Northeast
Norman/Moore
El Reno/Chickasha
Rogers/Wagoner
Age 18 to 24 Population Change (%) by Region, 2000-07
Source: Canadian, Grady, and McClain County estimates, U.S. Census Bureau Population Estimates
Southeast
South Central/Lawton
Southern
Northwest/Panhandle
Enid/Ponca City
Tulsa County
Southwest
Oklahoma City Metro
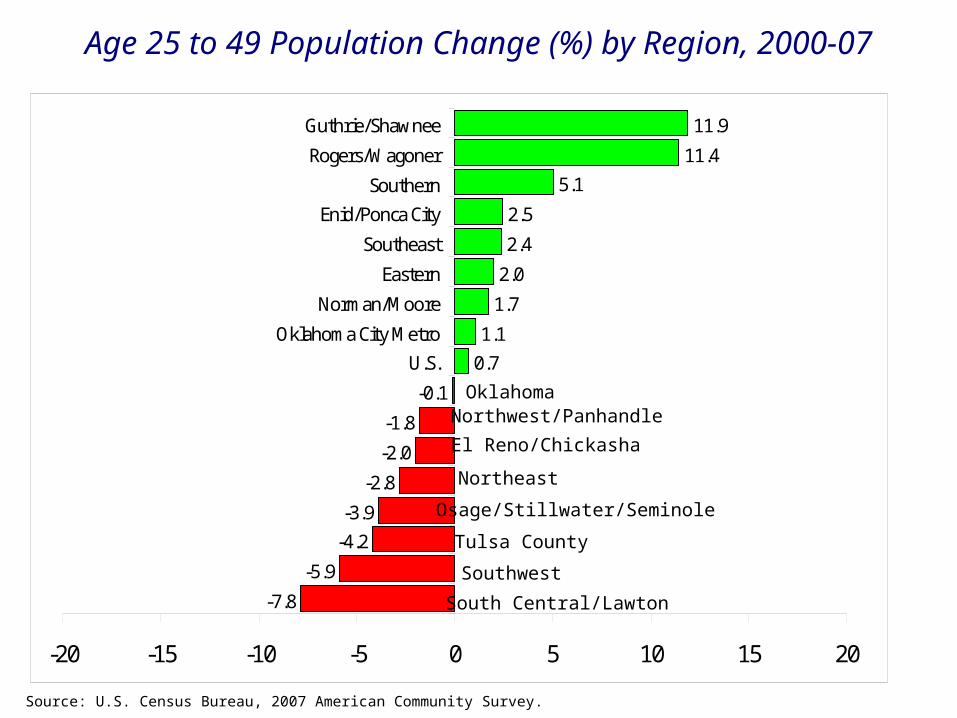
-7.8
-5.9
-4.2-3.9
-2.8
-2.0
-1.8
-0.1
0.71.1
1.7
2.0
2.4
2.5
5.111.4
11.9
-20 -15 -10 -5 0 5 10 15 20
U.S.Oklahoma City Metro
Norman/Moore
Eastern
Southeast
Enid/Ponca CitySouthern
Rogers/Wagoner
Guthrie/Shawnee
Age 25 to 49 Population Change (%) by Region, 2000-07
Source: U.S. Census Bureau, 2007 American Community Survey.
Northeast
South Central/Lawton
Oklahoma
El Reno/Chickasha
Northwest/Panhandle
Tulsa County
Southwest
Osage/Stillwater/Seminole
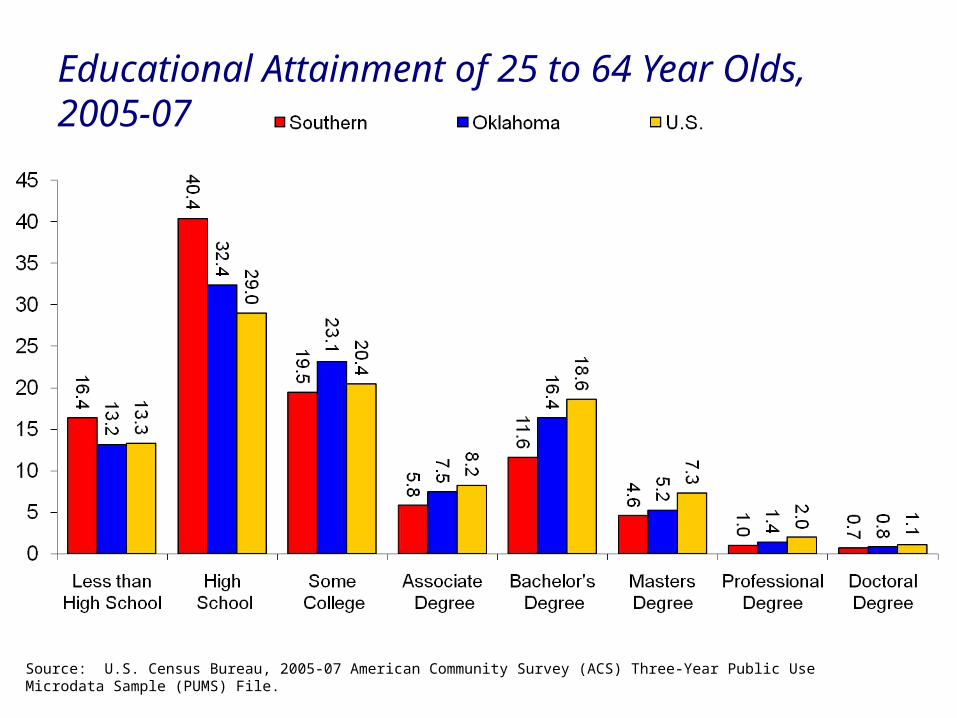
Educational Attainment of 25 to 64 Year Olds, 2005-07
Source: U.S. Census Bureau, 2005-07 American Community Survey (ACS) Three-Year Public Use Microdata Sample (PUMS) File.

Educational Attainment of 18 to 24 Year Olds, 2005-07
Source: U.S. Census Bureau, 2005-07 American Community Survey (ACS) Three-Year Public Use Microdata Sample (PUMS) File.

Educational Attainment (%) of 25 to 64 Year Olds by Race/Ethnicity, 2005-07 (Southern Region)
Source: U.S. Census Bureau, 2005-07 American Community Survey (ACS) Three-Year Public Use Microdata Sample (PUMS) File.

Percent of 25 to 64 Year Olds with at Least a High School Diploma, 2005-07
Source: U.S. Census Bureau, 2005-07 American Community Survey (ACS) Three-Year Public Use Microdata Sample (PUMS) File.
81.7
82.7
83.683.9
83.9
85.8
86.7
86.7
86.886.9
87.1
87.5
87.8
87.8
90.691.1
91.4
76 78 80 82 84 86 88 90 92 94
Southeast
Northwest/Panhandle
SouthernEastern
Southwest
Osage/Stillwater/Seminole
Guthrie/Shawnee
U.S.
OklahomaNortheast
South Central/Lawton
Oklahoma City Metro
Enid/Ponca City
Tulsa CountyEl Reno/Chickasha
Rogers/Wagoner
Norman/Moore
24.5
25.1
25.729.0
32.4
35.1
36.0
36.1
36.236.2
36.7
36.9
38.4
38.9
40.440.9
41.2
0 5 10 15 20 25 30 35 40 45
Norman/Moore
Oklahoma City Metro
Tulsa CountyU.S.
Oklahoma
El Reno/Chickasha
Guthrie/Shawnee
Northwest/Panhandle
Rogers/WagonerOsage/Stillwater/Seminole
Southwest
Enid/Ponca City
Eastern
South Central/LawtonSouthern
Southeast
Northeast
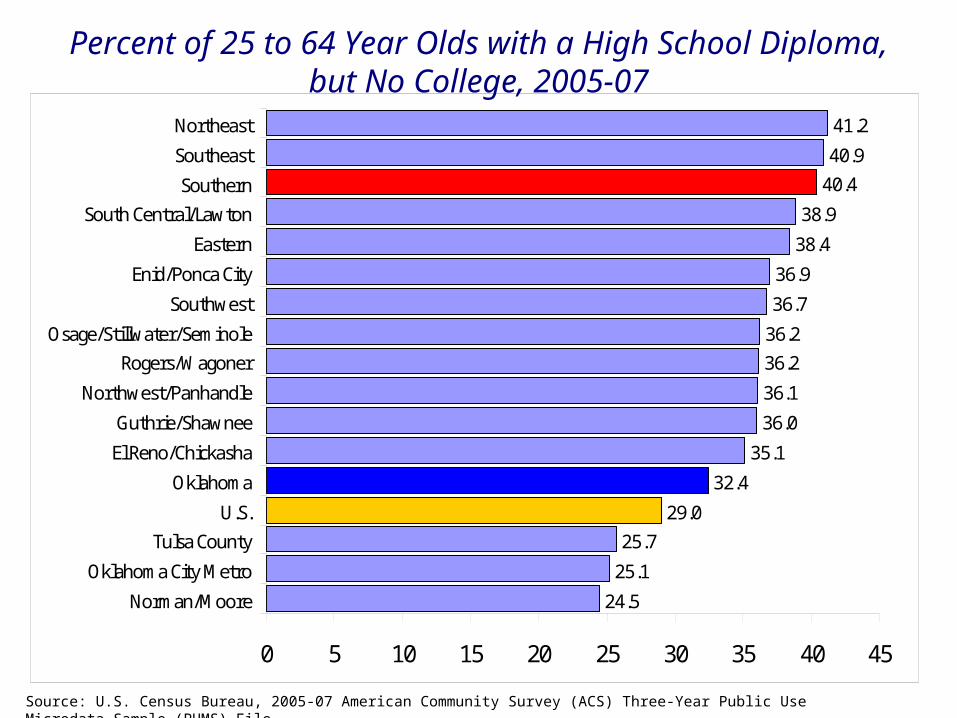
Percent of 25 to 64 Year Olds with a High School Diploma, but No College, 2005-07
Source: U.S. Census Bureau, 2005-07 American Community Survey (ACS) Three-Year Public Use Microdata Sample (PUMS) File.
22.6
23.5
23.723.7
24.2
25.2
25.7
26.0
27.328.7
30.4
31.0
31.3
36.6
37.239.7
42.0
0 5 10 15 20 25 30 35 40 45
Southeast
Northeast
South Central/LawtonSouthern
Northwest/Panhandle
Eastern
Southwest
Guthrie/Shawnee
Osage/Stillwater/SeminoleEl Reno/Chickasha
Rogers/Wagoner
Enid/Ponca City
Oklahoma
Oklahoma City MetroU.S.
Tulsa County
Norman/Moore
Percent of 25 to 64 Year Olds with an Associates Degree or Higher, 2005-07
Source: U.S. Census Bureau, 2005-07 American Community Survey (ACS) Three-Year Public Use Microdata Sample (PUMS) File.
14.4
15.9
16.217.7
17.9
18.7
19.2
19.3
20.621.2
21.3
21.3
23.8
29.0
30.030.7
33.7
0 5 10 15 20 25 30 35 40
Southeast
Eastern
NortheastSouth Central/Lawton
Southern
Southwest
Guthrie/Shawnee
Northwest/Panhandle
Osage/Stillwater/SeminoleEnid/Ponca City
Rogers/Wagoner
El Reno/Chickasha
Oklahoma
U.S.Oklahoma City Metro
Tulsa County
Norman/Moore
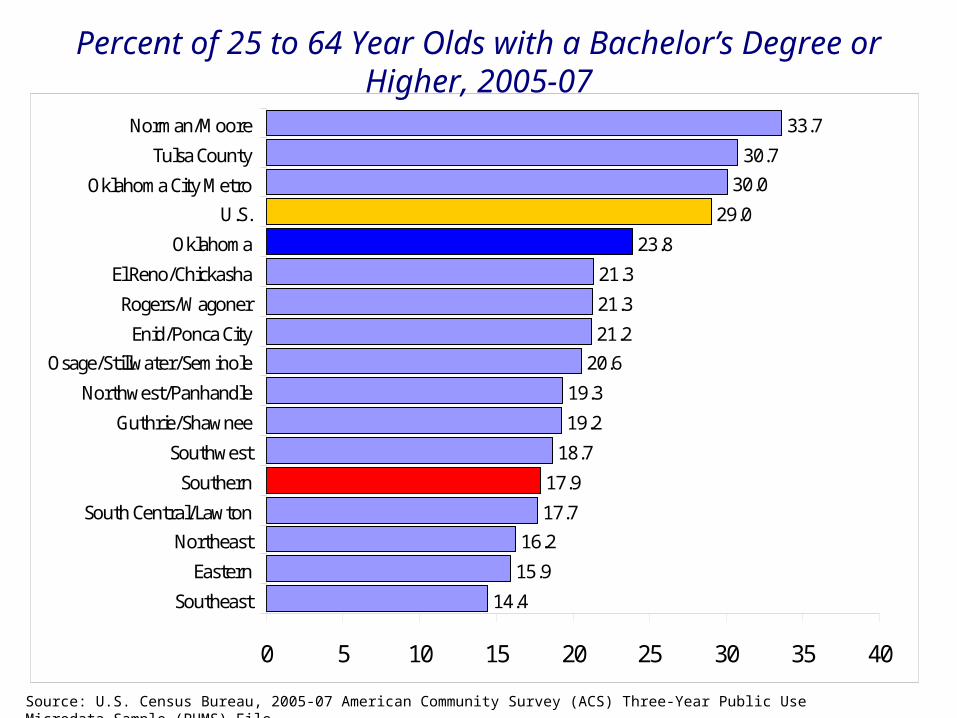
Percent of 25 to 64 Year Olds with a Bachelor’s Degree or Higher, 2005-07
Source: U.S. Census Bureau, 2005-07 American Community Survey (ACS) Three-Year Public Use Microdata Sample (PUMS) File.
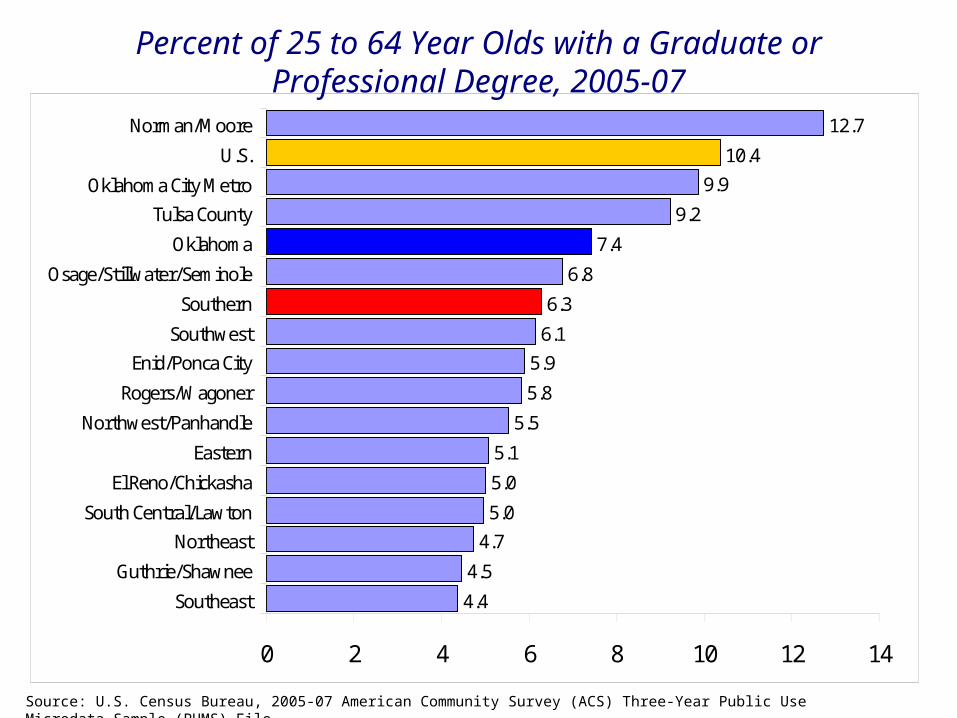
4.4
4.5
4.75.0
5.0
5.1
5.5
5.8
5.96.1
6.3
6.8
7.4
9.2
9.910.4
12.7
0 2 4 6 8 10 12 14
Southeast
Guthrie/Shawnee
NortheastSouth Central/Lawton
El Reno/Chickasha
Eastern
Northwest/Panhandle
Rogers/Wagoner
Enid/Ponca CitySouthwest
Southern
Osage/Stillwater/Seminole
Oklahoma
Tulsa CountyOklahoma City Metro
U.S.
Norman/Moore
Percent of 25 to 64 Year Olds with a Graduate or Professional Degree, 2005-07
Source: U.S. Census Bureau, 2005-07 American Community Survey (ACS) Three-Year Public Use Microdata Sample (PUMS) File.
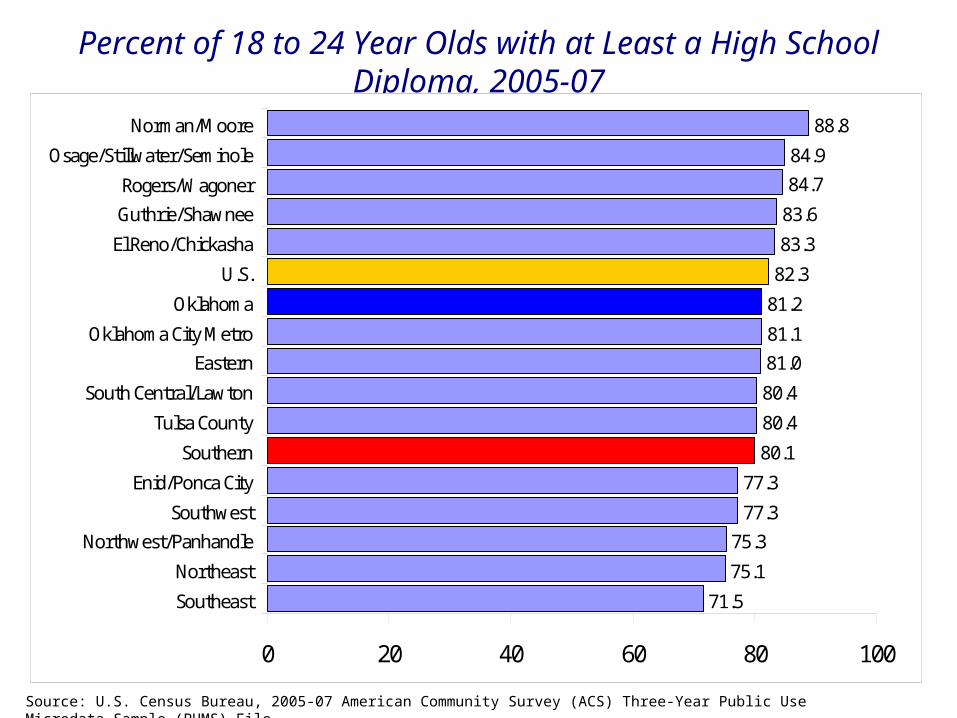
Percent of 18 to 24 Year Olds with at Least a High School Diploma, 2005-07
Source: U.S. Census Bureau, 2005-07 American Community Survey (ACS) Three-Year Public Use Microdata Sample (PUMS) File.
71.5
75.1
75.377.3
77.3
80.1
80.4
80.4
81.081.1
81.2
82.3
83.3
83.6
84.784.9
88.8
0 20 40 60 80 100
Southeast
Northeast
Northwest/PanhandleSouthwest
Enid/Ponca City
Southern
Tulsa County
South Central/Lawton
EasternOklahoma City Metro
Oklahoma
U.S.
El Reno/Chickasha
Guthrie/ShawneeRogers/Wagoner
Osage/Stillwater/Seminole
Norman/Moore

26.2
29.6
32.933.2
33.5
34.6
35.7
36.3
38.140.0
40.7
41.1
41.5
41.7
43.445.2
49.8
0 10 20 30 40 50 60
Norman/Moore
Osage/Stillwater/Seminole
Oklahoma City MetroTulsa County
U.S.
Southwest
Northwest/Panhandle
Oklahoma
SouthernEnid/Ponca City
El Reno/Chickasha
Rogers/Wagoner
Northeast
EasternSoutheast
Guthrie/Shawnee
South Central/Lawton
Percent of 18 to 24 Year Olds with a High School Diploma, But No College, 2005-07
Source: U.S. Census Bureau, 2005-07 American Community Survey (ACS) Three-Year Public Use Microdata Sample (PUMS) File.
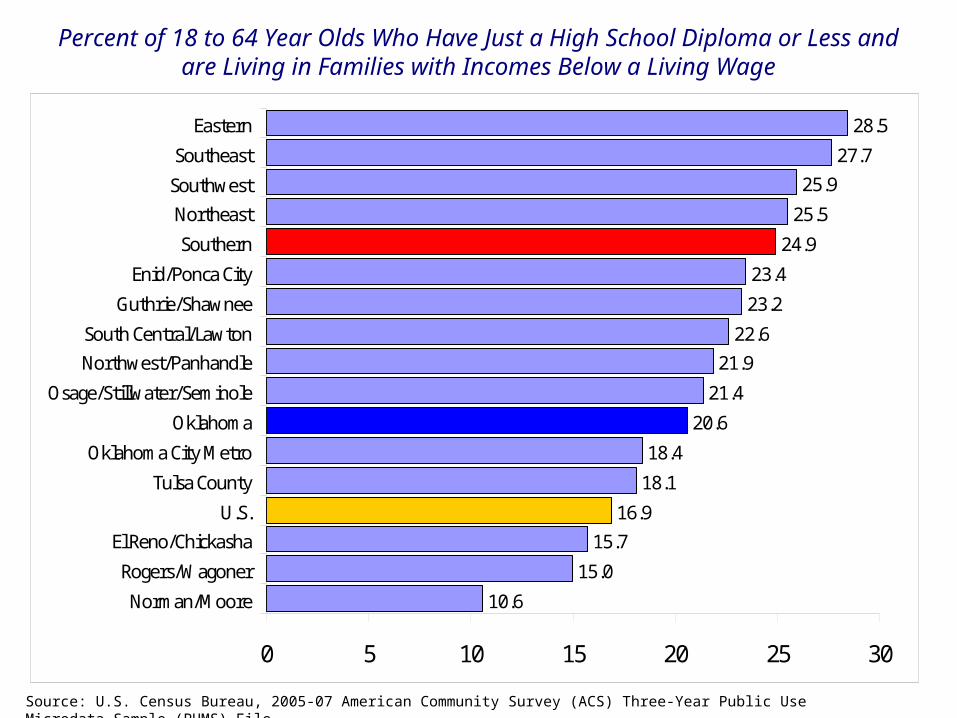
10.6
15.0
15.716.9
18.1
18.4
20.6
21.4
21.922.6
23.2
23.4
24.9
25.5
25.927.7
28.5
0 5 10 15 20 25 30
Norman/Moore
Rogers/Wagoner
El Reno/ChickashaU.S.
Tulsa County
Oklahoma City Metro
Oklahoma
Osage/Stillwater/Seminole
Northwest/PanhandleSouth Central/Lawton
Guthrie/Shawnee
Enid/Ponca City
Southern
NortheastSouthwest
Southeast
Eastern
Percent of 18 to 64 Year Olds Who Have Just a High School Diploma or Less and are Living in Families with Incomes Below a Living Wage
Source: U.S. Census Bureau, 2005-07 American Community Survey (ACS) Three-Year Public Use Microdata Sample (PUMS) File.
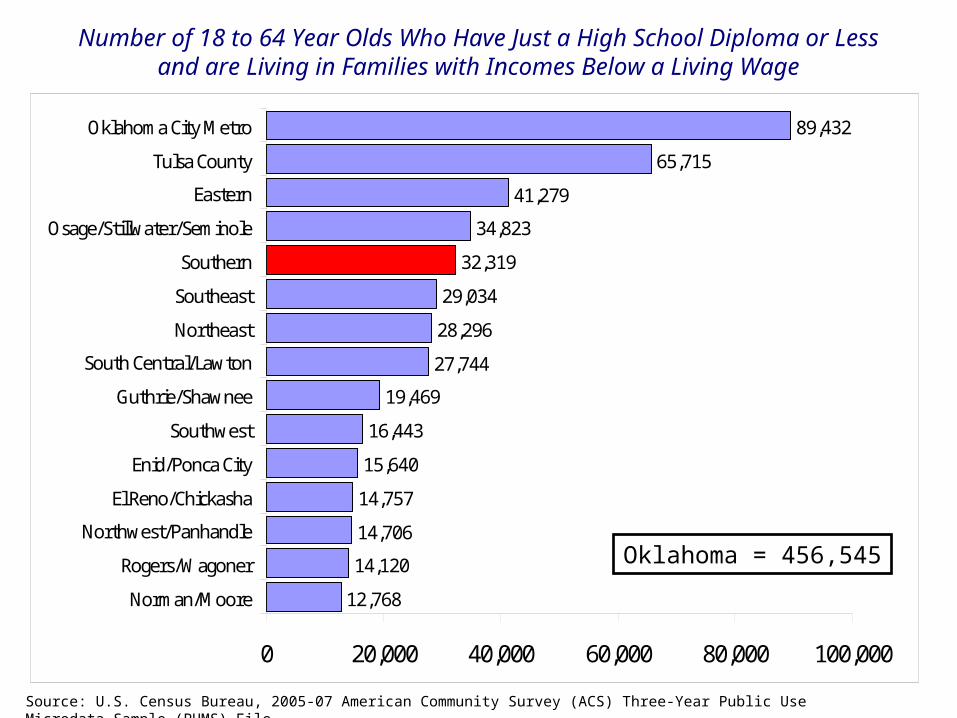
12,768
14,120
14,706
14,757
15,640
16,443
19,469
27,744
28,296
29,034
32,319
34,823
41,279
65,715
89,432
0 20,000 40,000 60,000 80,000 100,000
Norman/Moore
Rogers/Wagoner
Northwest/Panhandle
El Reno/Chickasha
Enid/Ponca City
Southwest
Guthrie/Shawnee
South Central/Lawton
Northeast
Southeast
Southern
Osage/Stillwater/Seminole
Eastern
Tulsa County
Oklahoma City Metro
Number of 18 to 64 Year Olds Who Have Just a High School Diploma or Less and are Living in Families with Incomes Below a Living Wage
Source: U.S. Census Bureau, 2005-07 American Community Survey (ACS) Three-Year Public Use Microdata Sample (PUMS) File.
Oklahoma = 456,545
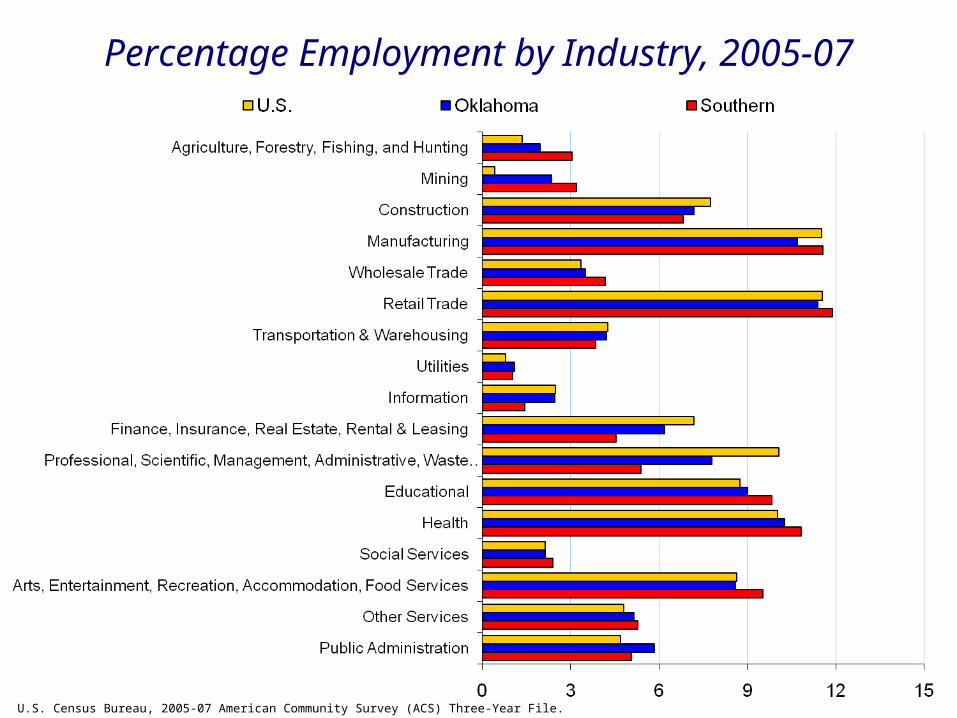
Source: U.S. Census Bureau, 2005-07 American Community Survey (ACS) Three-Year File.
Percentage Employment by Industry, 2005-07
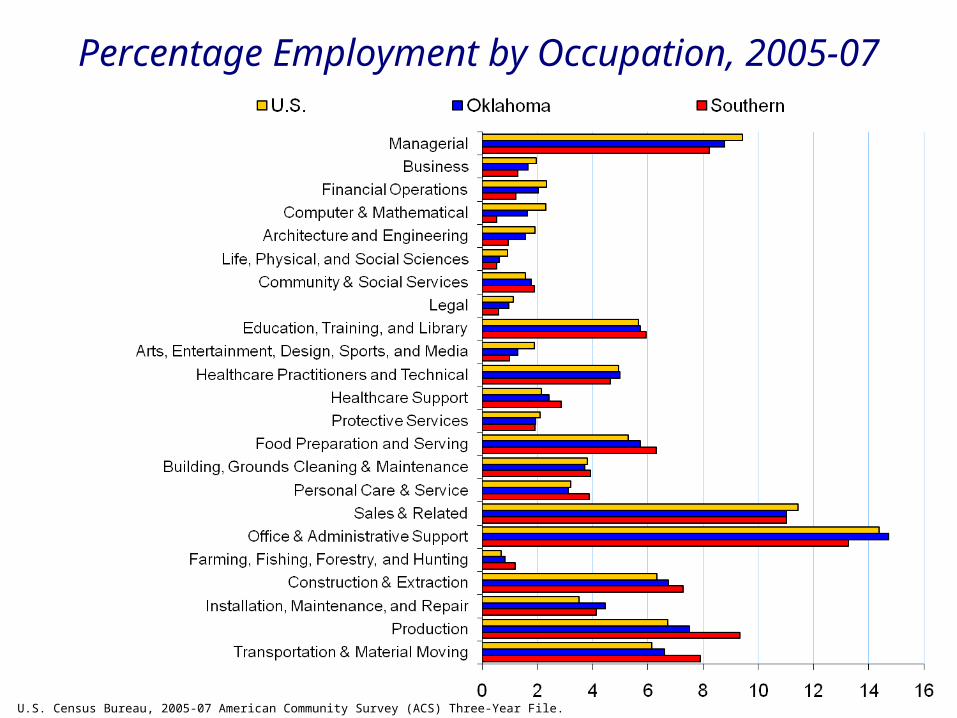
Percentage Employment by Occupation, 2005-07
Source: U.S. Census Bureau, 2005-07 American Community Survey (ACS) Three-Year File.
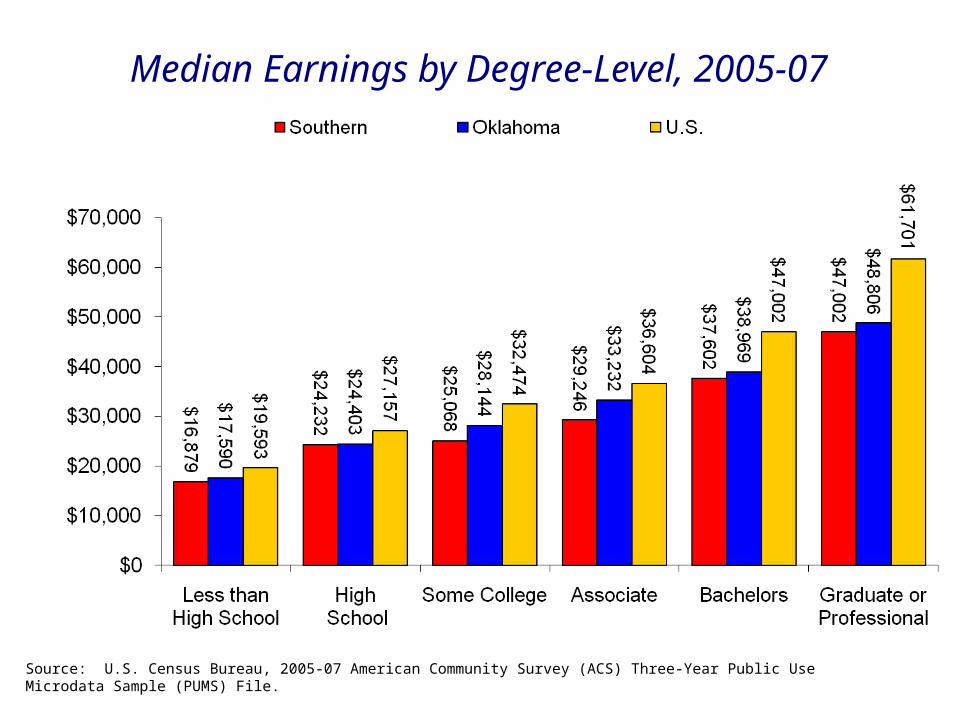
Median Earnings by Degree-Level, 2005-07
Source: U.S. Census Bureau, 2005-07 American Community Survey (ACS) Three-Year Public Use Microdata Sample (PUMS) File.

Increase in Earnings from a High School Diploma to a College Degree, 2005-07
Source: U.S. Census Bureau, 2005-07 American Community Survey (ACS) Three-Year Public Use Microdata Sample (PUMS) File.
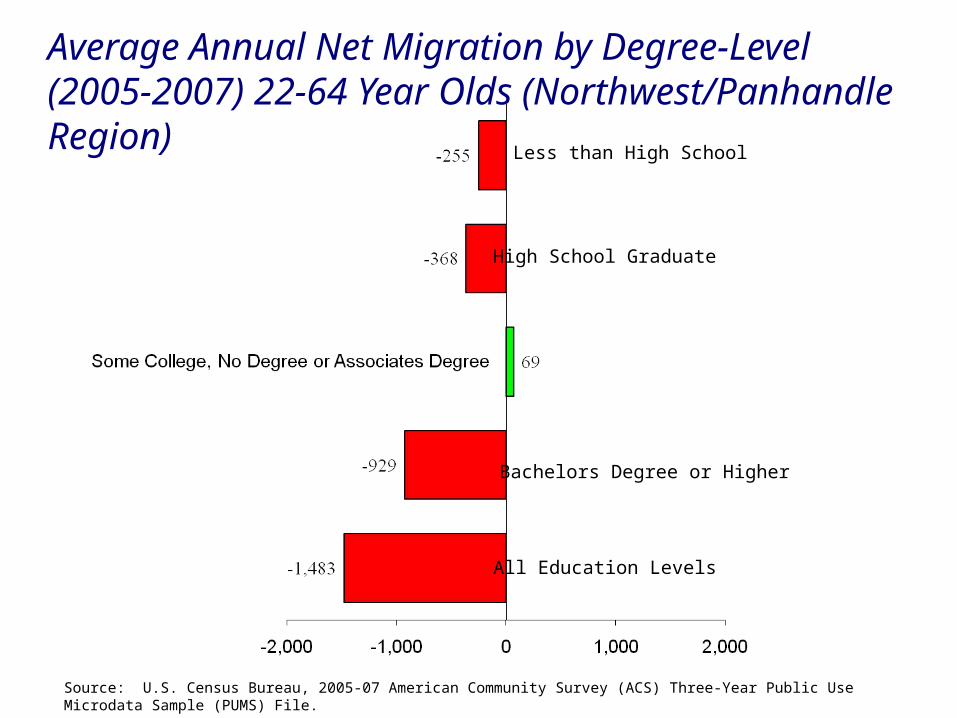
Average Annual Net Migration by Degree-Level (2005-2007) 22-64 Year Olds (Northwest/Panhandle Region)
Source: U.S. Census Bureau, 2005-07 American Community Survey (ACS) Three-Year Public Use Microdata Sample (PUMS) File.
High School Graduate
Less than High School
Bachelors Degree or Higher
All Education Levels
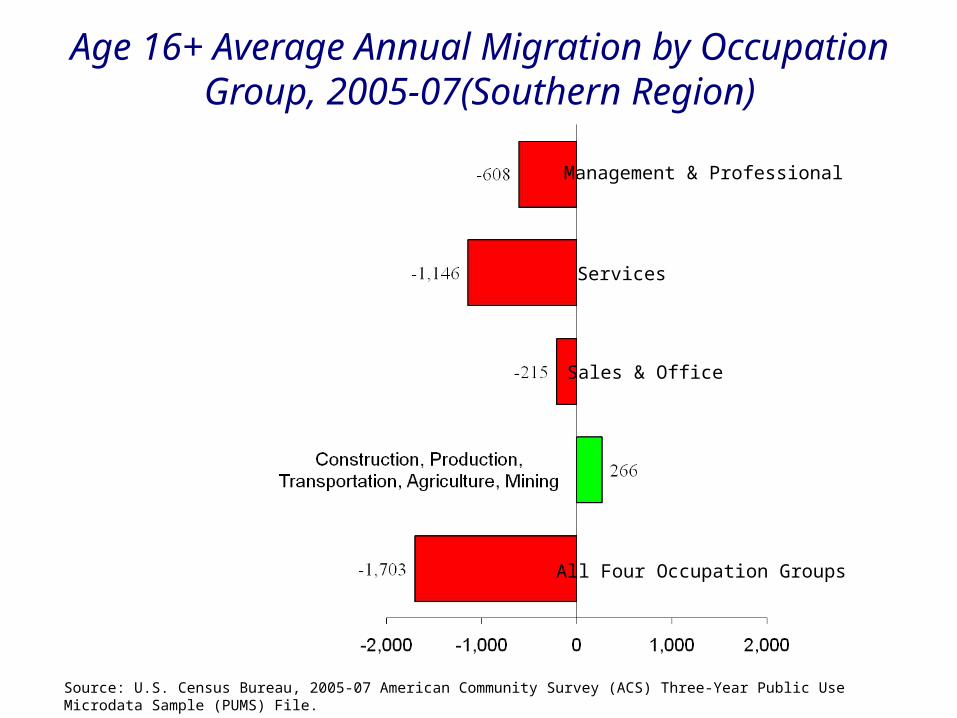
Age 16+ Average Annual Migration by Occupation Group, 2005-07(Southern Region)
Source: U.S. Census Bureau, 2005-07 American Community Survey (ACS) Three-Year Public Use Microdata Sample (PUMS) File.
Management & Professional
Services
Sales & Office
All Four Occupation Groups