open innovation and strategy - welcome to ti · pdf fileopen innovation and strategy ......
TRANSCRIPT

Chesbrough received support from the Center for Open Innovation at the Haas School of Businessand the Alfred P. Sloan Foundation. Appleyard received support from the National Science Foundationunder Grant No. 0438736. Jon Perr and Patrick Sullivan ably assisted with the interviews of OpenSource Software leaders. Any opinions, findings, and conclusions or recommendations expressed inthis material are those of the authors and do not necessarily reflect the views of the above fundingsources or any other individuals or organizations.
Open Innovation andStrategy
Henry W. ChesbroughMelissa M. Appleyard
57CALIFORNIA MANAGEMENT REVIEW VOL. 50, NO. 1 FALL 2007
A new breed of innovation—open innovation—is forcing firms toreassess their leadership positions, which reflect the performanceoutcomes of their business strategies. It is timely to juxtaposesome new phenomena in innovation with the traditional acade-
mic view of business strategy. More specifically, we wish to examine the increas-ing adoption of more open approaches to innovation, and see how well thisadoption can be explained with theories of business strategy. In our view, openinnovation is creating new empirical phenomena that exist uneasily with well-established theories of business strategy. Traditional business strategy has guidedfirms to develop defensible positions against the forces of competition and powerin the value chain, implying the importance of constructing barriers to competi-tion, rather than promoting openness. Recently, however, firms and even wholeindustries, such as the software industry, are experimenting with novel businessmodels based on harnessing collective creativity through open innovation. Theapparent success of some of these experiments challenges prevailing views ofstrategy.
At the same time, recent developments indicate that many of these exper-imenters now are grappling with issues related to value capture and sustainabil-ity of their business models, as well as issues of corporate influence and thepotential co-option of open initiatives. In our view, the implications of theseissues bring us back to traditional business strategy, which can inform the quest

for sustainable business models. If we are to make strategic sense of innovationcommunities, ecosystems, networks, and their implications for competitiveadvantage, we need a new approach to strategy—what we call “open strategy.”
Open strategy balances the tenets of traditional business strategy with thepromise of open innovation. It embraces the benefits of openness as a means ofexpanding value creation for organizations. It places certain limits on traditionalbusiness models when those limits are necessary to foster greater adoption of aninnovation approach. Open strategy also introduces new business models basedon invention and coordination undertaken within a community of innovators.At the same time, though, open strategy is realistic about the need to sustainopen innovation approaches over time. Sustaining a business model requires ameans to capture a portion of the value created from innovation. Effective openstrategy will balance value capture and value creation, instead of losing sight ofvalue capture during the pursuit of innovation. Open strategy is an importantapproach for those who wish to lead through innovation.
The Insights and Limits of Traditional Business Strategy
Business strategy is a wide and diverse field. The origins of the concepthearken back to Alfred Chandler’s seminal Strategy and Structure, where he pre-sented the first systematic and comparative account of growth and change in the modern industrial corporation.1 He showed how the challenges of diversityimplicit in a strategy of growth called for imaginative responses in administra-tion of the enterprise. In his subsequent work, Chandler showed how scale andscope economies provided new growth opportunities for the corporation duringthe second industrial revolution.2
Igor Ansoff built upon ideas from Strategy and Structure and applied themto emerging concepts of corporate strategy.3 Strategy came to be seen as a con-scious plan to align the firm with opportunities and threats posed by its environ-
ment. Kenneth R. Andrews was one of thefirst theorists to differentiate between abusiness strategy and a corporate strategy.He held the former to be “the product-market choices made by division or productline management in a diversified com-pany.”4 Corporate strategy was a supersetof business strategy. “Like business strategy,[corporate strategy] defines products and
markets—and determines the company’s course into the almost indefinitefuture. . . . A company will have only one corporate strategy but may incorpo-rate into its concept of itself several business strategies.”5 Thus, a firm’s currentbusinesses influenced its choice of likely future businesses as well, an importantinsight for understanding corporate innovation.
The subsequent analysis of competitive strategy owes a great deal to theseminal work of Michael Porter. In his first book on the topic,6 Porter articulated
Open Innovation and Strategy
UNIVERSITY OF CALIFORNIA, BERKELEY VOL. 50, NO. 1 FALL 200758
Henry Chesbrough is the Executive Director of theCenter for Open Innovation at the Haas School ofBusiness, University of California, Berkeley.<[email protected]>
Melissa M. Appleyard is an Ames Professor in theManagement of Innovation and Technology at theSchool of Business Administration at PortlandState University. <[email protected]>

a conception of strategy that was rooted in the economics of industrial organ-ization, particularly the model of “structure, conduct, and performance.”7
Essentially, Porter cleverly turned Joe S. Bain’s economic welfare analysis ofmonopoly and oligopoly on its head. Instead of maximizing consumer surplus(the usual economic objective), Porter focused attention upon those actions thatwould maximize producer surplus. The Porterian model of the Five Forces thatshape a firm’s competitive strategy—namely, rivalry, buyer power, supplierpower, substitutes, and barriers to entry—provided a handy way to identifyactions that could enhance a producer’s surplus. Items that were previouslyassociated with anti-competitive social welfare outcomes in traditional economicindustrial organization theory, such as high barriers to entry, were transformedby Porter’s analysis into managerial actions that could enhance a firm’s competi-tive strategy.
In his second volume on strategy, Porter extended the Five Forces conceptby linking it to the value chain of a firm, defined as those activities from rawmaterials through to the final consumer in which a firm’s products were devel-oped and marketed.8 Positions within the value chain in which there were fewcompetitors or other advantageous characteristics (as defined by the above FiveForces model) could create competitive advantage by profiting from other partsof the value chain in which greater competition could be found.
These seminal contributions made an enormous impact upon both thetheory and the practice of strategy. With regard to the latter, consulting firmssuch as McKinsey, Booz Allen, BCG, and Bain soon developed practices andtools that adapted the Porterian notions of strategy for their clients. Porter evenlaunched his own strategy consulting practice, Monitor Company, to apply hisstrategy concepts for a variety of clients. Monitor continues to enjoy a thrivingpractice to this day.
Academics also responded to this new approach to strategy in at least fourimportant ways.9 First, scholars such as Anita McGahan extended Porter’s con-cepts through extensive empirical research that broadly supported Porter’s con-cepts.10 Second, a former student of Porter’s, Richard Rumelt, focused strategyaway from industry characteristics toward the characteristics of individual firms.He found that the industry-level differences highlighted in the five forces modelwere actually less predictive of firm profitability than were differences betweenfirms within a single industry.11 Third, a related stream of scholarship called theresource-based view of the firm looked within firms to identify the sources ofsuperior firm profitability, and it isolated ownership of certain key resources asthe locus of competitive advantage, rather than the Porterian view of a firm’sposition in its market and its value chain.12 Finally, a fourth stream examinedthe role of economic complements to the firm’s own assets. Controlling keycomplementary assets afforded firms a comparative advantage, which facilitatedentry into new industries.13
Each of these directions has proven to be fruitful for understandingbusiness strategy. None, however, in our judgment, can adequately account forsome of the new empirical phenomena emerging in many technology-based
Open Innovation and Strategy
CALIFORNIA MANAGEMENT REVIEW VOL. 50, NO. 1 FALL 2007 59

industries. All of the traditional views are based upon ownership and control as the key levers in achieving strategic success. All focus largely within the firm,or within the value chain in which the firm is embedded. None take muchnotice of the potential value of external resources that are not owned by thefirm in question, but may nonetheless create value for the firm. These externalresources, such as volunteer contributors, innovation communities and ecosys-tems, and surrounding networks represent growing sources of value creation.
Emerging Anomalies that Challenge Traditional Business Strategy
As Donald Stokes observed, science often progresses first from a practicalknowledge of how to do something, to a deeper knowledge of why that some-thing works the way it does.14 In Thomas Kuhn’s notion of paradigm develop-ment, empirical anomalies accumulate that (sooner or later) challenge theprevailing conception and trigger the search for an alternative conception thatcan incorporate the previously inexplicable anomalies.15 In strategy, we believethat a number of new and anomalous developments have emerged that requirea substantive revision to Porter’s conceptions, and to the four branches ofresearch that Porter’s work has spawned.
While it is difficult to precisely define the scope of these new develop-ments, we believe that the concept of open source development and similarlyinspired ideas such as open innovation, the intellectual commons, peer produc-tion, and earlier notions of collective invention represent phenomena thatrequire a rethinking of strategy.16
Shifting the focus from ownership to the concept of openness requires areconsideration of the processes that underlie value creation and value capture.Our notion of openness is defined as the pooling of knowledge for innovativepurposes where the contributors have access to the inputs of others and cannotexert exclusive rights over the resultant innovation. In its purest form, the value created through an open process would approach that of a public good.17
It would be “non-rival” in that when someone “consumed” it, it would notdegrade the experience of a subsequent user.18 It also would be “non-exclud-able” so all comers could gain access.
Typically public goods have been the purview of governments—nationaldefense and education being two widely deployed examples. Recent private-sector phenomena ranging from social networking web sites such as MySpace to open source software such as the Linux operating system have created valuealong the lines of a public good in that multiple people can use them and no oneis excluded from using them.
The value of openness is actually enhanced with every user in two ways.First, users directly contribute ideas and content to improve the quality and vari-ety of the product. MySpace relies on individual contributors, Wikipedia relieson individuals for both data entry and editing, and Linux relies on a global inno-vation community. Raymond popularized this notion through “Linus’s Law,”
Open Innovation and Strategy
UNIVERSITY OF CALIFORNIA, BERKELEY VOL. 50, NO. 1 FALL 200760

which states, “Given enough eyeballs, all bugs are shallow” (i.e., easy to fix).Second, the more users, the more momentum behind the product such thatother companies producing complementary goods or services would be attractedto the mass of users. This dynamic, where more users beget more users, hasbeen labeled a “network effect.”19 In the case of MySpace, Rupert Murdoch’sNews Corporation found value in the web site’s ability to outpace other socialnetworking sites in terms of membership whose demographics—in addition tonumbers—are coveted by advertisers.20 News Corp.’s $580 million acquisition of MySpace’s parent company in 2005 put a dollar figure on the value created.The value of Linux’s contributions to global computing is reflected in the valueof its ecosystem (including software and servers), which was estimated to reachroughly $18 billion in 2006.21
These types of open innovation products challenge some of the basictenets of traditional business strategy. The first tenet called into question is the need to have ownership over the resources that are creating the value.MySpace, YouTube, Wikipedia, and Linux have relied primarily on external,volunteer contributors. The second tenet is the ability to exclude others fromcopying the product. While ownership of the posted content in the case ofMySpace and YouTube certainly is central to their valuations, the users canaccess the sites and view the content without a charge. Like Linux, Wikipediarelies on its user base to continually refine the product. To guarantee trans-parency of the open innovation process, Wikipedia has a formalized paper trailwhereby the Wikipedia Foundation maintains a log of all of the data entries andthe editors of those entries, so that the community can see the origins of entriesand the history of subsequent edits to those entries.22 In the case of Linux, itsrules governing the software ensure that the source code will be open for all tosee and that the open source code ensures that the kernel will be open for all tosee, and that any accepted revisions and improvements will also be open.
When considering the tenets of Porter’s Five Forces as the basis of anadvantageous competitive position, additional empirical anomalies haveemerged. Google and YouTube came into existence without the benefit of sig-nificant entry barriers. When considering switching costs on the Web, peoplecan shift to alternative technologies with the click of a mouse. In Porter’s view,rivalry reduces industry profits, yet the search industry has many competingtechnologies with highly profitable companies such as Google and Yahoo!Indeed, Microsoft’s masterful cultivation of the Five Forces of Porter has donelittle to slow Google’s meteoric rise in market capitalization. YouTube’s acquisi-tion by Google in 2006 for $1.65 billion in stock similarly attests to the fact thatentry, even when entry barriers are low, can lead to a formidable value creation.
Towards a More Open Approach to Strategy
Individually, these examples might seem to be mere curiosities. Takentogether, though, they imply that something new is going on; something thatcannot adequately be explained through the classic conceptions of business
Open Innovation and Strategy
CALIFORNIA MANAGEMENT REVIEW VOL. 50, NO. 1 FALL 2007 61

strategy. Items that were of central importance in earlier strategy treatments,such as ownership, entry barriers, switching costs, and intra-industry rivalry areof secondary importance in the genesis of the above phenomena. Forces thatwere either peripheral to the earlier treatment or ignored entirely, such asattracting the participation of individual volunteers, the role of community par-ticipation, the construction of innovation networks, and the notion of innova-tion ecosystems all lay beyond the explanatory power of current notions ofstrategy.
To further understand value creation and capture in this context, we con-sider two primary manifestations of openness—open invention and open coordi-nation.
Knowledge Creation through Open Invention
As alluded to above, the power of openness in terms of value creationresets largely with the inherent characteristic of knowledge—it can be reusedand can lead to increasing returns.23 Furthermore, both the breadth and depth of the pooled knowledge can outstrip the knowledge endowment of an individ-ual contributor. One strategic issue for a firm or organization is how to cover thecosts of knowledge creation to get this virtual cycle going.
What has proven astounding is that, without direct monetary compensa-tion, a vast number of resources have been committed to open invention, whichapplies our notion of openness (defined above) to the creation of a new productor service. The poster child for open invention is Linux. Countless person-hoursaround the globe have been committed to the development, testing, and adop-tion of this operating system. Skilled programmers rallied around the initial codesupplied by Linus Torvalds, and these lead users drove the Linux movement.24
The enthusiasts that triggered the movement gave rise to an innovation commu-nity. The resultant OS has been lauded for its superiority over competing“closed” operating systems along the lines of security, configurability, and relia-bility.25 The created value is reflected in the extensive adoption of Linux, wherethe Linux OS constituted over 13 percent of worldwide server revenue by200726 and has surpassed the Mac OS as the second most widely deployed per-sonal computer OS.27
Ecosystem Creation through Open Coordination
In addition to open invention, open coordination has led to consensusbuilding around issues such as technology standards that have permitted wholebusiness ecosystems to flourish. A business ecosystem represents the interplaybetween multiple industries,28 so a decision to open up a segment of one indus-try can have widespread reverberations. As Moore observers, an example fromthe 1980s is IBM’s decision to open up its personal computer (PC) architecture.29
This led to the rise of the “clones” as companies such as Compaq emulated theIBM specifications. IBM’s architecture couple with Microsoft’s operating systemand Intel’s microprocessors became the de facto technology standards in the PCindustry.
Open Innovation and Strategy
UNIVERSITY OF CALIFORNIA, BERKELEY VOL. 50, NO. 1 FALL 200762

The widespread adoption of this triad contributed to the health of thesurrounding ecosystem, which includes application software vendors, videocontent developers, Internet services providers, and so on. Because PC userswant to interact through file sharing and through using numerous softwareprograms, they gravitate to the architecture with the largest footprint. Thismeans that a healthy ecosystem can further perpetuate the adoption of the openarchitecture through network effects,30 where the value of the user network isheightened with each additional adopter. Advancing the ecosystem similarlyrequires community investment in creating new knowledge and exploring alter-native architectures to connect the disparate elements of that knowledgetogether in cohesive ways.31
The lingering questions for the business strategist are: Who actually iscapturing the value created by open invention and coordination? How are theydoing it? The matrix in Figure 1 arrays open initiatives and closed initiatives toillustrate the range of outcomes on both dimensions. On the value creationdimension, initiatives can differ in whether value is created in-house or via acommunity. On the value capture dimension, an initiative might see its valuerealized by a company, or by the larger community.
A particular company involved in the innovation process might be able to capture the bulk of the value by closing off the innovation and protecting itwith intellectual property (IP) rights—for example, Microsoft’s source code forits operating system. Similarly in Google’s case, while it captures value from
Open Innovation and Strategy
CALIFORNIA MANAGEMENT REVIEW VOL. 50, NO. 1 FALL 2007 63
FIGURE 1. Open and Closed Innovation
Microsoft’s OS
GoogleMySpaceYouTube
IBM Linux code
Pirated MusicComplementors
Linux Kernel
Wikipedia
In-House
Co
mpa
nyE
cosy
stem
Community-Driven
Value Creation
Val
ue C
aptu
re

advertisers rather that its user-base, it has been able to distinguish itself throughproprietary search algorithms and auction-bidding systems for advertisers. Whilesignificant value has accrued to these individual companies, they also have cre-ated value that has been captured by their surrounding ecosystems, hence theyare placed in the lower portion of the top left quadrant. For example, through its association with Microsoft’s operating system, Intel has garnered the lead-ing position in the semiconductor industry, and the personal computer ecosys-tem has revolved around the “Wintel” de facto standard. By placing paid ads tothe right of search results on Google, eBay has bolstered its leadership positionin online auctions in the e-commerce ecosystem.
In contrast, in the lower right quadrant, community-driven initiatives can result in products more akin to a public good, leading to value capture thatis diffused across an ecosystem. The Linux kernel and Wikipedia are examples.They represent instances of collective invention and coordination. MySpace andYouTube reside in the upper right quadrant, because they rely on community-contributed content, but the IP controls permit the owners of the content, NewsCorp. and Google, respectively, to “monetize” the content through vehicles suchas targeted advertising.32 The final quadrant, the lower left, reflects innovationinitiatives that are fueled by resources within a particular company, but thebroader ecosystem captures most of the value, relative to the originator. Twoexamples populate this quadrant—pirated music and IBM’s Linux code. Whilethe proceeds of legitimate music sales accrue to the record labels and their artistsand bolster the sales of complementary products in their ecosystem, piratedmusic only benefits the complementors such as Apple and others, which sellmusic players. The contribution of code to the Linux kernel by IBM comes from software developers on the payroll of IBM. While IBM can capture valueby supplying other goods and services in the value chain, the members of thebroader computing ecosystem are free to use the resultant operating system.
A critical element to coordinating the value created through open inven-tion is some underlying architecture that connects the different pieces of knowl-edge together. This systems-level knowledge may reside in a single company(e.g., IBM in PCs), a collection of firms (e.g., Intel and Microsoft in PCs), a con-sortium (e.g., SEMATECH in semiconductor equipment), or a nonprofit body(e.g., the Linux Foundation). Without some sense of how the system must oper-ate, open knowledge will not accumulate into useful solutions to real problems.
Open Business Models in Open Source Software
By pooling intellect in a system architecture, open invention and opencoordination can produce superior products and services relative to those pro-duced by a smaller number of minds huddled together in a single company. Thestrategic issue becomes how to capture and then sustain the created value with-out alienating the individuals, communities, or ecosystem members responsiblefor the continued development of the good, service, or standard.
While open initiatives often arise from highly motivated individuals orcreative communities, a number of approaches have emerged from firms
Open Innovation and Strategy
UNIVERSITY OF CALIFORNIA, BERKELEY VOL. 50, NO. 1 FALL 200764

engaged in open innovation to foster value capture and sustainability. Perr, Sulli-van, and Appleyard have identified seven “open business models” in the contextof open source software (OSS): support, subscription, professional services, pro-prietary extensions, dual license, device, and community source.33 In that sup-port, subscription, and professional services are business models found in theproprietary side of the software industry as well, they have not raised manyeyebrows. Examples of companies pursuing these models in the open sourcesetting are JBoss (support for application servers),34 Red Hat (subscriptions forenterprise-versions of Linux), and IBM (a range of professional services forinstallation and optimization).
Business models novel to the open source software arena include thedevelopment of proprietary extensions or add-ons. Companies pursuing thistype of model generally have claim to the primary intellectual property coveringthe application, but they choose an open source software license to help prolifer-ate the product and then offer “enterprise” versions to paying customers, andthese versions are generally more stable or have increased functionality. In cus-tomer relationship management applications, SugarCRM follows a businessmodel of this sort. The dual license approach is similar to the proprietary exten-sions model, but it focuses on the type of license under which the software isbeing distributed. Companies such as MySQL, known for its database products,follows this model by licensing their products under different licenses dependingon the intent of the end-user.
The final two business models also are specific to the OSS world. Thedevice model leads companies such as Mazu Networks to offer devices thatinteract with open source software. In the case of Mazu Networks, the devicesare related to network security. The community source model entails havingusers with almost identical needs pool their resources to address the particularneed. The Sakai project pursues collaboration tools for learning environments,and numerous universities are actively involved.
These models can be further grouped in to four categories: deployment,hybridization, complements, and self-service (as reflected in Table 1). In the firstcategory, deployment (which spans support, subscription, and professional ser-vices), innovation activities heighten the user experience, and users are willingto pay for it even if the initial technology is free.
The second is hybridization, in which proprietary innovation investmentsare made that rely on intellectual property ownership for add-ons (proprietaryextensions). A separate instance of this is “versioning,”35 where multiple ver-sions of a technology such as a public free version and a private commercialversion are offered. In open source software, this is called a dual licenseprovision.
The third category is complements, where a vendor may sell a PDA, cellphone, or other device at a profit that runs an open source application softwaresuite or operating system. In this category, the value of the complement is actu-ally enhanced by the free nature of the open technology. As the price of theopen technology declines, the price to the consumer of the bundled solution
Open Innovation and Strategy
CALIFORNIA MANAGEMENT REVIEW VOL. 50, NO. 1 FALL 2007 65

(open technology plus the complementary device) also falls, thus increasingdemand for the device without the manufacturer lowering the price of thedevice.
The fourth category is a self-service model, where a user community cre-ates a software application for its own needs.36 The first three categories clearlyincorporate an element of value capture. Only the last category omits an explicitvalue capture mechanism. This raises the question of whether this last model issustainable over time.
These four types of open business models are not mutually exclusive,they may evolve over time, and companies frequently pursue more than onesimultaneously. Even firms that have followed the prescriptions of traditional
Open Innovation and Strategy
UNIVERSITY OF CALIFORNIA, BERKELEY VOL. 50, NO. 1 FALL 200766
TABLE 1. Open Source Software Business Models
Source:Adapted from Jon Perr, Patrick Sullivan, and Melissa M.Appleyard,“Open for Business: Emerging Business Models for Open SourceSoftware Companies,” working paper, Lab2Market, Portland State University, 2006.
Category Model Description Example
Deployment Support Revenue derived from sale of customersupport contracts.
JBoss
Subscription Revenue derived from annual serviceagreements bundling open sourcesoftware, customer support andcertified software updates delivered via Internet.
Red Hat EnterpriseLinux
Professional Services/Consulting
Revenue derived from professionalservices, training, consulting, orcustomization of open source software.
IBM
Hybridization ProprietaryExtensions
Firms broadly proliferate open sourceapplication and monetize through saleof proprietary versions or product lineextensions.Variants include mixed opensource/proprietary technologies orservices with free trial or “community”versions.
SugarCRM
Dual License Vendor licenses software underdifferent licenses (free “Public”or “Community” license vs. paid“Commercial” license) based oncustomer intent to redistribute.
MySQL
Complements Device Vendor sells and supports hardwaredevice or appliance incorporating open source software.
Mazu Networks
Self-Service Community Source Consortia of end user organizations orinstitutions jointly develops applicationto be used by all.
The Sakai project

business strategy by placing IP ownership in the center of their business modelsmay wish to consider these approaches to value capture. While a growing num-ber of open invention examples like Linux provide legitimate paths to knowl-edge creation through volunteerism, an illegal path also exists—piracy. Greatlyfacilitated by technological change, pirated music and video downloads andknock-off goods (ranging from handbags to pharmaceuticals) have entered themarketplace against the wishes of the original inventors. The enforcement of IPrights can curb the pirates’ ability to profit form this “forced” openness, but suchlegal actions are costly. Because of the difficulty policing and punishing suchactivity, inventors who thought their business model would rely on patents orcopyrights also may wish to consider these alternative approaches to value cap-ture beyond IP enforcement.
Open Innovation beyond IT
The emerging anomalies are by no means confined to the informationtechnology sector. There are a number of new developments in the life sciences,such as the Public Library of Science, where open initiatives are powerfullyshaping the face of drug development. This is particularly true for developingnew drugs in areas that have not attracted significant commercial interest, suchas anti-malarial drugs as well as vaccines. Other recent scholarship has docu-mented the role of innovation communities in the emergence of the snowboard,windsurfing, and skateboarding industries.37 While we do not wish to suggestthat this open approach will migrate to every industry, its emergence is morebroad than might be initially realized. As communication costs continue toplummet, facilitating open invention and coordination, it is likely that furtheropen initiatives will take root in more industries around the world.
Issues Confronting the Sustainability of Open Source and Related Initiatives
There are many issues and challenges that the practitioners of increasedopenness face as they seek to sustain their businesses. While the many successesof open source and related initiatives are rightly acknowledged by their enthusi-asts, there are signs that these new approaches to innovation face significantchallenges as well. In particular, it is not yet obvious whether and how theseinitiatives will be able to sustain the ideals and institutions that were used toconstruct them at the outset. Unless these initiatives demonstrate the ability toprosper and endure, they could become flashes in the pan that, while interest-ing, ultimately make little impact on technology and society.
Let us start here by examining the single best known and perhaps mostsuccessful instance of an open approach: Linux. This open source operatingsystem software was first developed in 1991 by Linus Torvalds. Starting at a code base of roughly 10,000 lines, by 2003, nearly 6 million lines made up theheart of the Linux OS—the Linux kernel. Its support by an extended commu-nity is impressive, with more than 130,000 people actively contributing to its
Open Innovation and Strategy
CALIFORNIA MANAGEMENT REVIEW VOL. 50, NO. 1 FALL 2007 67

development.38 Linux’s market share in network server market is substantial,with a share of 33% in 2007, along with a more modest 3 percent of users in thepersonal computer segment.39
Linux development has been institutionalized through the creation of the Open Source Development Labs (OSDL), located in Portland, Oregon. OSDLwas funded largely by the contributions of corporations such as IBM, Intel, HP,and Oracle, who have embraced Linux as part of their own business models.Recently, OSDL merged with the Free Standards Group to form the Linux Foun-dation, and in our view this merger reflects the success of open source on onehand and its shortcomings on the other.
In terms of success, the merger has been viewed as a testament to thematurity of Linux where consolidation of Linux efforts to assist with issues suchas version compatibility was an appropriate next step.40 Linux has become sosuccessful and so widely adopted that questions of version compatibility havebecome important. On the side of shortcomings, it was apparent that if OSDLhad tried to migrate to a self-funding model by “monetizing” open source oppor-tunities that complemented Linux, its sponsoring corporations might haveresisted. This suggests that openness may have a limit if adjacent areas of busi-ness are viewed as areas of competition rather than cooperation by corporatesponsors. On the board of the Linux Foundation are again IBM, Intel, HP, andOracle. Board seats reportedly involve a contribution to the Linux Foundation of $500,000, an amount obviously well beyond an individual’s wherewithal that effectively skews the governance of the Linux Foundation towardscorporations.41
While it is premature to judge the final impact of this restructuring, one can already observe a significant retreat from the initial ideals of the Linuxmovement, as individuals play a diminished role in the ongoing governance ofLinux and corporations play an increasingly important and visible role. One alsocan infer that a significant risk now exists, where the future development ofLinux may be co-opted by the agendas of its corporate governors, rather thanthe ideals of a community-based meritocracy (in which the best code alwayswins). One can further infer that the risk is not simply that the Linux agendamay be hijacked; all that is required is that a substantial portion of the commu-nity begins to believe that the agenda is being hijacked. Once they perceive that to betrue, these contributors will take their ideas and contributions elsewhere. Thiscould trigger a collapse within the community, and indeed at that point the cor-porations would be forced to either support it themselves (thus fulfilling theprophecy) or to abandon it and search for greener pastures.
Thus, the first important issue that open-oriented organizations must face is how to attract the participation of a broad community of contributors, and thenhow to sustain their participation over time. These contributors do not work for theorganization and have many other alternative ways to spend their time andtalent. If and when a substantial portion of the contributor community perceivesthat their initiative no longer is driven by the goals that attracted them to the
Open Innovation and Strategy
UNIVERSITY OF CALIFORNIA, BERKELEY VOL. 50, NO. 1 FALL 200768

community in the first place, there is a real possibility of collapse of thatcommunity.42
Linux, we hasten to note, is arguably the most successful example ofopen source software development. More pedestrian initiatives face considerablymore daunting prospects for sustainability. On SourceForge.net, for example,one can find tens of thousands of projects that intend to use an open sourcemethod for software development. A casual visit to the site, however, revealsthat a few dozen at most have received any significant support from individualsoftware contributors. This reveals a second important issue: the supply of suchcontributors is not infinite, and the vast majority of projects suffer from a lack of contributors. So open-oriented projects must compete for contributors—and most donot succeed in this competition.
One way to compete for contributors is to look for large groups of con-tributors who can engage with the community. Many such groups can be foundinside corporations. In many open source projects, much of the development is done by programmers on the payroll of large corporations.43 The communitycontributes to a point and may help with quality control, but company employ-ees contribute the vast majority of the code. This additional participation bene-fits the open initiative, but raises risks.
A third important issue is how the open invention or coordination project is led,and how its agenda evolves. Every community has insiders and outsiders, whetherliteral or virtual. The insiders typically lead the community and control thedirection of its agenda. Most open innovation communities conceive of them-selves operating as a meritocracy, where contributors—who often are users ofthe output as well44—provide their inputs for the betterment of the project, asmeasured by the achievement of the goals and ideals of the project that causedthe contributors to join the project initially. If the community becomes domi-nated by individual contributors who are working for corporations, the percep-tion of a meritocracy rapidly erodes. A sustainable approach to utilizing aninnovation community of contributors must identify ways to recruit contribu-tors, keep them engaged, and avoid the perception (let alone the reality) ofbeing co-opted by agendas at odds with the values of that community. In someof the other open examples proffered by enthusiasts such as von Hippel45 andShah46 (such as skateboarding, snowboarding, windsurfing, and the electric gui-tar industry), innovation started out in open communities but later migrated tobecome for-profit industries as the number of users grew and a commercial mar-ket developed.
A final strategic concern comes from looking at open initiatives from theperspective of the corporation. How can a company engage in an open sourcecommunity (so as to obtain the benefits of the depth, variety, and quality oftechnology found in open initiatives) and still profit from that technology,which, by the terms of the intellectual property that governs the community,cannot be owned by the company? If companies cannot find ways to profit from theirinnovation activities in open initiatives—through deployment, hybridization, comple-ments, or self-service, they cannot sustain their participation in those initiatives over time.
Open Innovation and Strategy
CALIFORNIA MANAGEMENT REVIEW VOL. 50, NO. 1 FALL 2007 69

While many open source software companies have actively sought communityinput, over time, the majority of code comes to be written by programmers onstaff. This migration from the pure form of open invention to a more hybridizedform of open and owned invention is one way that open-oriented firms can con-trol their own destiny. The challenge is managing the mix to avoid alienation ofthe community, which could precipitate a product war where an open alterna-tive is created to displace the portion that is protected by IP. Well aware of thethreat of backlash, open source software companies have been known to focuson developing proprietary code protected by IP only for add-ons that lay outsidethe areas of interest of the coders in their open innovation community.47 Clearcommunication with the open innovation community, confirming that a partic-ular add-on would not be a priority of the community, becomes a managerialimperative.
How Traditional Business Strategy Can Inform Open Initiatives
Ironically, we believe that the best chance for open initiatives to sustainthemselves will come from returning to the perspectives of traditional businessstrategy. If we must compete for contributors to build effective innovation com-munities, how can we position ourselves to win in that competition? How do we differentiate ourselves to these contributors? If companies must find ways toprofit from their participation in open source initiatives, how can they differenti-ate their products and services in the eyes of customers? Are there places in thevalue chain or in the surrounding ecosystem where we should be more closed,even as we strive to be open in other places? Are there new business modelsthat combine the prospect of the value creation that derives from openness, withthe mechanisms for some degree of value capture necessary for sustainability?
For starters, traditional business strategy has spotlighted settings in whichcooperation would likely break down. Fierce rivalry may lead to opportunisticbehavior during either open invention or coordination. Alliance partners havebeen found to engage in “learning races” where the relationship dissolves afterone partner aggressively extracts knowledge from the other partner.48 As dic-tated by the resource-based view of the firm, employees who are intellectualpowerhouses may be jealously guarded, such that their employers would onlysend “second-stringers” to open invention or coordination initiatives.49 Thiscould lead to an inferior outcome from the open process. These issues are partic-ularly salient in “one-shot” open initiatives where reputation effects cannot berelied on to deter bad behavior. Mindful of these types of scenarios, leaders ofopen initiatives can work to establish norms and rules governing the contribu-tors to avoid sub-optimal outcomes for the community.
Traditional strategy also provides two guideposts for value capture. Thefirst points to IP ownership and the second points to creative management of the value chain. As noted above, open source software companies that follow a hybridized business model participate in open invention but also offer either
Open Innovation and Strategy
UNIVERSITY OF CALIFORNIA, BERKELEY VOL. 50, NO. 1 FALL 200770

proprietary extensions or a commercial version of their software. At times, thismix between open and closed requires managerial finesse vis-à-vis the commu-nity, but in general it has been accepted as a path to profitability. In the case ofsocial networking sites such as MySpace, access may be open, but News Corp.’sownership of the posted content facilitates additional business opportunitiessuch as a data-mining capability to help with targeted advertising. With addi-tional opt-in features that users are invited to provide for some personal benefit,social networking sites can deliver highly qualified targets for a variety of busi-ness purposes.
Even the Porterian notion of the value chain can unleash openness. Forexample, Intel and IBM have been avid supporters of Linux. Opening up thesoftware link in the electronics value chain has brought down the cost of com-puting leading to market growth, which means more chip sales for Intel andmore hardware sales and service engagements for IBM.50 Mirroring some OSScompanies’ sale of devices (as noted above), Intel and IBM sell goods and ser-vices that complement the open link in their value chain. Open coordinationsimilarly has “opened up the stack” whereby coordination around interfacestandards has dismantled monolithic “vertical” value chains like in the telecom-munications industry in favor of a bunch of “horizontal” firms specializing inone link of the chain.
Finally, open initiatives may allow for the creation of whole new comple-mentary links in a value chain. As an example, Tim O’Reilly through O’ReillyMedia has established a publishing empire in concert with the rise of opensource software. The international conferences sponsored by O’Reilly Media are well attended by the OSS faithful, and because he has been so successful in convening intellect, the attendees do not appear to begrudge him his success.
Another strategic perspective that needs to be confronted is whether and when the costs of openness exceed the benefits of openness. Can there besuch a thing as too much openness? While more openness is always better in the enthusiasts’ accounts of open initiatives, other academic research has foundcosts, as well as benefits, to developing and maintaining communities and net-works. Hansen’s analysis of internal networks inside a large firm found that itwas costly to maintain ties within the network past a certain size.51 Laursen andSalter’s analysis of data from the British government’s Survey of Manufacturersfound that respondents’ innovation outcomes were positively associated withgreater openness (as measured by utilizing a greater number of innovationsources).52 This association, however, had its limits. Past a certain number ofinnovation sources, respondents’ outcomes became negatively associated withfurther innovation sources. So more openness and a larger innovation commu-nity are valuable, but perhaps only up to a point.
Open Strategy: Illustrative Examples
As we ponder the implications of business strategy for open initiatives, a number of emerging business models attempt to balance the benefits of open-ness with the need for some value capture for greater sustainability. In addition
Open Innovation and Strategy
CALIFORNIA MANAGEMENT REVIEW VOL. 50, NO. 1 FALL 2007 71

to the OSS business models noted above, another recent example of an openstrategy was the decision of pharmaceutical manufacturer Merck to create theMerck Gene Index. This was an initiative in which Merck funded extensiveextramural research activity in universities around the world to produce geneticmarkers that could serve as targets for later drug development. Once thesemarkers were found, they were compiled and published in Merck’s Gene Index.This created a public domain of knowledge that functioned as an intellectualcommons for Merck.
While Merck did not have any exclusivity in accessing the markers in itspublished Index, that was not its objective. Instead, Merck sought to pre-emptthe prospect of small biotech firms patenting these markers, thus inhibitingMerck’s ability to develop compounds that might turn into new drugs.53 Merckexpected to capture value in its downstream drug development activities andwanted to create a more open source of inputs in the upstream process of identi-fying potential areas to investigate. So it was balancing value creation upstreamin its value chain, while capturing value downstream. This is an instance of whatwe mean by open strategy.
As noted above, another example of an open strategy that balances valuecreation and value capture comes from IBM’s own involvement with Linux.Readers of a certain age will recall that IBM practiced a distinctly proprietarybusiness model in software for decades, a model that launched products thatincluded Fortran, COBOL, DB2, and AIX, to name but a few of the most salientproducts. By the late 1990s, however, IBM’s software business began to embraceLinux and to construct its own business model around the Linux code. This wasa model that was distinctly different from those earlier proprietary softwaremodels. As Joel Cawley of IBM explained:
“I have long observed that it takes $500M to create and sustain a commerciallyviable OS [operating system]. Today we spend about $100M on Linux develop-ment each year. About $50M of that is spent on basic improvements to Linux,how to make it more reliable. The other $50M is spent on things that IBM needs,like special drivers for particular hardware or software to connect with it. Weasked the Open Source Development Lab to estimate how much other commer-cial development spending was being done on Linux. This didn’t count any uni-versity or individual work, just other companies like us. They told us the numberwas $800-900M a year, and that the mix of basic vs. specific needs was close to50/50. So that $500 million investment [required for an operating system] is alsothere now for Linux as well (counting only the basic portion, not the specificportion). And we only pay $100M toward that. So you can see even from a verynarrow accounting view that this is a good business investment for us.”54
And the specific portion of IBM’s funding of Linux allows its internalprogrammers to optimize the code base to run very effectively with IBM’s otherhardware and software products. IBM makes good money on these complemen-tary hardware and software items (a variation on the device category notedabove), so participating in a community at one level of value creation leads to greater value capture higher up the stack of value added activities for IBM.
Open Innovation and Strategy
UNIVERSITY OF CALIFORNIA, BERKELEY VOL. 50, NO. 1 FALL 200772

Executing this new, open strategy required some major internal changeswithin IBM, and also required IBM to change the opinions of many outsiderswho were skeptical about working with IBM. It wasn’t easy. Outside Linux par-ticipants, for example, were afraid that IBM would destroy the values of theLinux community, either intentionally or unintentionally. As Jerry Stallings,IBM’s VP of IP and Strategy described it, “IBM’s reputation was a big sometimesarrogant company that takes over whatever it gets involved in. We had to learnhow to collaborate.”
Conclusion: Open Strategy Balances Value Creation with Value Capture
Open strategy balances the powerful value creation forces that can befound in creative individuals, innovation communities, and collaborative initia-tives with the need to capture value in order to sustain continued participationand support of those initiatives. Traditional concepts of business strategy eitherunderestimate the value of open invention and open coordination, or theyignore them outright. As the concept of openness spreads from software toscience and other industries, we will need to update our concepts of strategy.Open strategy is an attempt to supply this update.
In open-dominated industry segments, such as open source software, new business models have been established. The models often blend elements of open and closed innovation. The OSS business models fall under four primarycategories: deployment, hybridization, complements, and self-service. Thesemodels may apply to other industries as openness spreads.
At the same time, open initiatives must confront real and serious chal-lenges to their ability to sustain themselves over time. While building broadcommunities of motivated individuals can unleash creative contributions, theseare difficult to sustain over time. Attracting and retaining contributors, prevent-ing co-option of the innovation agenda, and covering the fixed costs of innova-tion all represent non-trivial managerial headaches. As noted, even the mostcelebrated example of openness, the Linux kernel, now confronts significantchanges that may threaten its ability to remain open.
These issues of sustainability bring us back to traditional business strategy,which can make important contributions to mitigating them. If we are to makestrategic sense of innovation communities, ecosystems, networks, and theirimplications for competitive advantage, we propose that a new approach tostrategy—open strategy—is needed. Open strategy balances the tenets of tradi-tional business strategy with the promise of open innovation. Certain companiesappear to be constructing open strategies. These examples are worth studying,and may point the way forward for both openness and for strategy in leadingthrough innovation.
Open Innovation and Strategy
CALIFORNIA MANAGEMENT REVIEW VOL. 50, NO. 1 FALL 2007 73

Notes
1. Alfred Chandler, Strategy and Structure (Cambridge, MA: MIT Press, 1962).2. Alfred Chandler, “The Enduring Logic of Industrial Success,” Harvard Business Review, 68/2
(March/April 1990): 130-140.3. Igor Ansoff, Corporate Strategy (New York, NY: McGraw-Hill. 1965)4. Kenneth R. Andrews, The Concept of Corporate Strategy (Homewood, IL: Irwin, 1987).5. Ibid., p. xi.6. Michael Porter, Competitive Strategy (New York, NY: Free Press, 1980).7. Joe S. Bain, 1956. Barriers to New Competition (Cambridge, MA: Harvard University Press,
1956).8. Michael Porter, Competitive Advantage (New York, NY: Free Press, 1985).9. It is perhaps inevitable that our account of strategy is selective, and omits certain areas
of academic inquiry. Among the branches that we have excluded from this account areapproaches such as game theoretic views of strategy (Shapiro), sociologically informedapproaches to strategy (Baum and Dutton), and chaos-based views of strategy (Brown andEisenhart). Carl Shapiro, “The Theory of Business Strategy,” The RAND Journal of Economics,20/1 (Spring 1989): 125-137; Joel A.C. Baum and J.E. Dutton, eds., Advances in StrategicManagement: The Embeddedness of Strategy (Greenwich, CT: JAI Press, 1996); Shona L. Brownand Kathleen M. Eisenhardt, Competing on the Edge : Strategy as Structured Chaos (Cambridge,MA: Harvard University Press, 1998.
10. Anita M. McGahan and Michael E. Porter, “How Much Does Industry Matter, Really?”Strategic Management Journal, 18/6 (Summer Special Issue 1997): 15-30; Anita M. McGahanand Michael E. Porter, “What Do We Know About Variance in Accounting Profitability?”Management Science, 48/7 (July 2002): 834-851.
11. Richard Rumelt, “Diversification Strategy and Profitability,” Strategic Management Journal, 3/4(October-December 1982): 359-369; Richard P. Rumelt, “How Much Does Industry Matter?”Strategic Management Journal, 12/3 (March 1991): 167-185.
12. Birger Wernerfelt, “A Resource-Based View of the Firm,” Strategic Management Journal, 5/2(April/June 1984): 171-180; Jay B. Barney, “Strategic Factor Markets: Expectations, Luck,and Business Strategy,” Management Science, 32/10 (October 1986): 1231-1241; Jay B. Bar-ney, “Firm Resources and Sustained Competitive Advantage,” Journal of Management, 17/1(March 1991): 99-120; Ingemar Dierickx and Karel Cool, “Asset Stock Accumulation andthe Sustainability of Competitive Advantage,” Management Science, 35/12 (December 1989):1504-1511; Ingemar Dierickx and Karel Cool, “Asset Stock Accumulation and the Sustain-ability of Competitive Advantage: Reply,” Management Science, 35/12 (December 1989):1514-1514; Joseph Mahoney and J. Rajendran Pandian, “The Resource-Based View withinthe Conversation of Strategic Management,” Strategic Management Journal, 13/5 (June 1992):363-380; M.A. Peteraf, “The Cornerstones of Competitive Advantage: A Resource-BasedView,” Strategic Management Journal, 14/3 (March 1993): 179-191.
13. David Teece, “Profiting from Technological Innovation,” Research Policy, 15/6 (1986): 285-305.
14. Donald Stokes, Pasteur’s Quadrant: Basic Science and Technological Innovation (Washington, D.C.:Brookings Institution Press, 1997).
15. Thomas Kuhn, The Structure of Scientific Revolutions (Chicago, IL: University of Chicago Press,1962).
16. For open source development, see Eric Raymond, The Cathedral and the Bazaar (Beijing:O’Reilly, 1999); Bruce Perens, The Emerging Economic Paradigm of Open Source <http://perens.com/Articles/Economic.html>, February 16, 2005; Eric von Hippel, Democratizing Innovation(Cambridge, MA: MIT Press, 2005). For open innovation, see Henry Chesbrough, OpenInnovation: the New Imperative for Creating and Profiting from Technology (Boston, MA: HarvardBusiness School Press, 2003). For the intellectual commons, see Lawrence Lessig, The Futureof Ideas: The Fate of the Commons in a Connected World (New York, NY: Random House, 2001).For peer production, see Josh Lerner and Jean Tirole, “Some Simple Economics of OpenSource,” Journal of Industrial Economics, 50/2 (June 2002): 197-234; Yochai Benkler, “Coase’sPenguin, or, Linux and the Nature of the Firm,” Yale Law Journal, 112/3 (December 2002):369. For collective invention, see R.C. Allen, “Collective Invention,” Journal of EconomicBehavior and Organization, 4/1 (March 1983): 1-24.
17. Benkler, op. cit.
Open Innovation and Strategy
UNIVERSITY OF CALIFORNIA, BERKELEY VOL. 50, NO. 1 FALL 200774

18. Paul M. Romer, “Increasing Returns and Long-Run Growth,” Journal of Political Economy,94/5 (October 1986): 1002-1037.
19. Brian Arthur, Increasing Returns and Path Dependence in the Economy (Ann Arbor, MI: TheUniversity of Michigan Press, 1994).
20. Patricia Sellers, “MySpace Cowboys,”<http://money.cnn.com/magazines/fortune/fortune_archive/2006/09/04/8384727/index.htm>, August 29 2006.
21. Sean Michael Kerner, “IDC: Linux Ecosystem Worth $40 Billion by 2010,”<http://www.internetnews.com/dev-news/article.php/3659961>, February 14, 2007.
22. Don Tapscott and Anthony D. William, Wikinomics: How Mass Collaboration Changes Everything(New York, NY: Portfolio, 2006).
23. W. Brian Arthur, “Increasing Returns and the New World of Business,” Harvard BusinessReview, 74/4 (July/August 1996): 100-110; Paul M. Romer, “Endogenous TechnologicalChange,” Journal of Political Economy, 98/5 (October 1990): S71-S102.
24. von Hippel, op. cit.; Sonali Shah, “Motivation, Governance, and the Viability of HybridForms in Open Source Software Development,” Management Science, 52/7 (July 2006): 1000-1014.
25. Michelle Delio, “Linux: Fewer Bugs Than Rivals,”<www.wired.com/software/coolapps/news/2004/12/66022>, December 14, 2004; MarkBrunelli, “Users Tackle Question of Linux vs. Windows on the Server,” <http://searchenter-priselinux.techtarget.com/originalContent/0,289142,sid39_gci1123175,00.html?topic=300780>, September 8, 2005.
26. IDC, “Server Market Accelerates as New Workloads and a Strong Refresh Cycle Drive ServerDemand in the Enterprise,”<www.idc.com/getdoc.jsp;jsessionid=CHZBXSXEQGMI2CQJAFDCFFAKBEAVAIWD?con-tainerId=prUS20840807>, August 23, 2007.
27. Robert McMillan, “Analysis: The Business Case for Desktop Linux,”<www.computerworld.com.au/index.php/id;1048043952;fp;16;fpid;0>, December 24, 2004.
28. James Moore, The Death of Competition (Boston, MA: Harvard Business School Press, 1993)29. Ibid.30. Carl Shapiro and Hal Varian, Information Rules: A Strategic Guide to the Network Economy
(Boston, MA: Harvard Business School Press, 1998).31. Annabelle Gawer and Michael Cusumano, Platform Leadership (Boston, MA: Harvard Busi-
ness School Press, 2002); Marco Iansiti and Roy Levien, The Keystone Advantage (Boston, MA:Harvard Business School Press, 2004).
32. Ownership also makes these sites potential targets for legal actions by copyright owners who feel that the site is monetizing value without paying appropriate compensation for the copyrighted content hosted on the site, such as the recent Viacom suit against YouTube.That is a subject for another paper, however.
33. Jon Perr, Patrick Sullivan, and Melissa M. Appleyard, “Open for Business: Emerging Busi-ness Models for Open Source Software Companies,” working paper, Lab2Market, PortlandState University, 2006; Henry Chesbrough, Open Business Models: How to Thrive in the NewInnovation Landscape (Boston, MA: Harvard Business School Press, 2006).
34. JBoss was acquired by Red Hat in 2006.35. Shapiro and Varian, op. cit.36. von Hippel, op. cit.37. Shah, op. cit.38. <http://counter.li.org/>.39. <http://blogs.zdnet.com/ITFacts/?p=6932>.40. Mike Rogoway, “Merger Marks Open-Source Milestone,” The Oregonian, January 23, 2007,
pp. C1-C2.41. Neil McAllister, “Questioning the Linux Foundation’s credentials: How noble are its motiva-
tions?” CNET News, February 12, 2007.42. Jared Diamond, Collapse: How Societies Choose to Fail or Succeed (New York, NY: Viking, 2005).43. Linus Dahlander and Martin W. Wallin, “A Man on the Inside: Unlocking Communities as
Complementary Assets,” Research Policy, 35/8 (October 2006): 1243-1259.44. von Hippel, op. cit.45. Ibid.46. Shah, op. cit.47. Perr et al., op. cit.
Open Innovation and Strategy
CALIFORNIA MANAGEMENT REVIEW VOL. 50, NO. 1 FALL 2007 75

48. Gary Hamel, “Competition for Competence and Inter-Partner Learning within InternationalStrategic Alliances,” Strategic Management Journal, 12/4 (Summer 1991): 83-103.
49. Peter Grindley, David C. Mowery, and Brian Silverman, “SEMATECH and CollaborativeResearch: Lessons in the Design of High-Technology Consortia,” Journal of Policy Analysis andManagement, 13/4 (Autumn 1994): 723-758.
50. Chesbrough (2006), op. cit.51. Morten Hansen, “The Search-Transfer Problem: The Role of Weak Ties in Sharing Knowl-
edge across Organization Subunits,” Administrative Science Quarterly, 44/1 (March 1999): 82.52. Keld Laursen and Ammon Salter, “Open for Innovation: The Role of Openness in Explaining
Innovation Performance among U.K. Manufacturing Firms,” Strategic Management Journal,27/2 (February 2006): 131-150.
53. Robert P. Merges, “A New Dynamism in the Public Domain,” University of Chicago Law Review,71 (2004): 183-203; Gary Pisano, Science Business: The Promise, the Reality, and the Future ofBiotech (Boston, MA: Harvard Business School Press, 2006).
54. Cawley’s quote is taken from Chesbrough (2006), op. cit., pp. 193-194.
Open Innovation and Strategy
UNIVERSITY OF CALIFORNIA, BERKELEY VOL. 50, NO. 1 FALL 200776


P
58 harvard business review
rocter & Gamble launched
a new line of Pringles potato crisps in
2004 with pictures and words – trivia
questions, animal facts, jokes – printed
on each crisp. They were an immediate
hit. In the old days, it might have taken
us two years to bring this product to
market, and we would have shouldered
all of the investment and risk inter-
nally. But by applying a fundamentally
new approach to innovation, we were
able to accelerate Pringles Prints from
concept to launch in less than a year
and at a fraction of what it would have
otherwise cost. Here’s how we did it.
Back in 2002, as we were brain-
storming about ways to make snacks
more novel and fun,someone suggested
that we print pop culture images on NIC
K L
OW
ND
ES
Procter & Gamble’s radical strategy
of open innovation now produces more than 35% of
the company’s innovations and billions of dollars in revenue.
by Larry Huston and Nabil Sakkab
INSIDE PROCTER & GAMBLE’S NEWMODEL FOR INNOVATION
CONNECTAND DEVELOP

YYEE
LLMM
AAGG
CCYY
AANN
BBLLAA
CCKK
Inside Procter & Gamble’s New Model for Innovation
Pringles. It was a great idea, but how would we do it?
One of our researchers thought we should try ink-jetting
pictures onto the potato dough, and she used the printer
in her office for a test run. (You can imagine her call to
our computer help desk.) We quickly realized that every
crisp would have to be printed as it came out of frying,
when it was still at a high humidity and temperature. And
somehow, we’d have to produce sharp images, in multi-
ple colors, even as we printed thousands upon thousands
of crisps each minute. Moreover, creating edible dyes
that could meet these needs would require tremendous
development.
Traditionally, we would have spent the bulk of our in-
vestment just on developing a workable process. An inter-
nal team would have hooked up with an ink-jet printer
company that could devise the process, and then we
would have entered into complex negotiations over the
rights to use it.
Instead, we created a technology brief that defined
the problems we needed to solve, and we circulated it
throughout our global networks of individuals and insti-
tutions to discover if anyone in the world had a ready-
made solution. It was through our European network that
we discovered a small bakery in Bologna, Italy, run by
a university professor who also manufactured baking
equipment. He had invented an ink-jet method for print-
ing edible images on cakes and cookies that we rapidly
adapted to solve our problem. This innovation has helped
the North America Pringles business achieve double-digit
growth over the past two years.
From R&D to C&DMost companies are still clinging to what we call the in-
vention model, centered on a bricks-and-mortar R&D
infrastructure and the idea that their innovation must
principally reside within their own four walls. To be
sure, these companies are increasingly trying to buttress
their laboring R&D departments with acquisitions, alli-
ances, licensing, and selective innovation outsourcing.
And they’re launching Skunk Works, improving collab-
oration between marketing and R&D, tightening go-
to-market criteria, and strengthening product portfolio
management.
But these are incremental changes, bandages on a bro-
ken model. Strong words, perhaps, but consider the facts:
Most mature companies have to create organic growth of
4% to 6% year in, year out. How are they going to do it? For
P&G, that’s the equivalent of building a $4 billion busi-
ness this year alone. Not long ago, when companies were
smaller and the world was less competitive, firms could
rely on internal R&D to drive that kind of growth. For
generations, in fact, P&G created most of its phenomenal
growth by innovating from within – building global re-
search facilities and hiring and holding on to the best
talent in the world. That worked well when we were a
$25 billion company; today, we’re an almost $70 billion
company.
By 2000, it was clear to us that our invent-it-ourselves
model was not capable of sustaining high levels of top-
line growth. The explosion of new technologies was put-
ting ever more pressure on our innovation budgets. Our
R&D productivity had leveled off, and our innovation
success rate–the percentage of new products that met fi-
nancial objectives–had stagnated at about 35%. Squeezed
by nimble competitors, flattening sales, lackluster new
launches, and a quarterly earnings miss, we lost more
than half our market cap when our stock slid from $118
to $52 a share. Talk about a wake-up call.
The world’s innovation landscape had changed, yet we
hadn’t changed our own innovation model since the late
1980s, when we moved from a centralized approach to
a globally networked internal model – what Christopher
Bartlett and Sumantra Ghoshal call the transnational
model in Managing Across Borders.
We discovered that important innovation was increas-
ingly being done at small and midsize entrepreneurial
companies. Even individuals were eager to license and
sell their intellectual property. University and govern-
ment labs had become more interested in forming indus-
try partnerships, and they were hungry for ways to mon-
etize their research. The Internet had opened up access to
talent markets throughout the world. And a few forward-
looking companies like IBM and Eli Lilly were beginning
to experiment with the new concept of open innovation,
leveraging one another’s (even competitors’) innovation
assets – products, intellectual property, and people.
As was the case for P&G in 2000, R&D productivity at
most mature, innovation-based companies today is flat
while innovation costs are climbing faster than top-line
growth. (Not many CEOs are going to their CTOs and say-
ing, “Here, have some more money for innovation.”)
Meanwhile, these companies are facing a growth man-
date that their existing innovation models can’t possibly
support. In 2000, realizing that P&G couldn’t meet its
growth objectives by spending more and more on R&D
for less and less payoff, our newly appointed CEO, A.G.
Lafley, challenged us to reinvent the company’s innova-
tion business model.
We knew that most of P&G’s best innovations had
come from connecting ideas across internal businesses.
And after studying the performance of a small number of
products we’d acquired beyond our own labs, we knew
that external connections could produce highly profitable
innovations, too. Betting that these connections were the
60 harvard business review
Larry Huston ([email protected]) is the vice president for
innovation and knowledge and Nabil Sakkab (sakkab.ny
@pg.com) is the senior vice president for corporate research
and development at Procter & Gamble in Cincinnati.

YYEE
LLMM
AAGG
CCYY
AANN
BBLLAA
CCKK
Inside Procter & Gamble’s New Model for Innovation
key to future growth, Lafley made it our goal to acquire
50% of our innovations outside the company. The strategy
wasn’t to replace the capabilities of our 7,500 researchers
and support staff, but to better leverage them. Half of our
new products, Lafley said, would come from our own labs,
and half would come through them.
It was, and still is, a radical idea. As we studied outside
sources of innovation, we estimated that for every P&G
researcher there were 200 scientists or engineers else-
where in the world who were just as good–a total of per-
haps 1.5 million people whose talents we could potentially
use. But tapping into the creative thinking of inventors
and others on the outside would require massive opera-
tional changes. We needed to move the company’s atti-
tude from resistance to innovations “not invented here”to
enthusiasm for those “proudly found elsewhere.” And we
needed to change how we defined, and perceived, our
R&D organization–from 7,500 people inside to 7,500 plus
1.5 million outside, with a permeable
boundary between them.
It was against this backdrop that
we created our connect and develop
innovation model. With a clear sense
of consumers’ needs, we could iden-
tify promising ideas throughout the
world and apply our own R&D, man-
ufacturing, marketing, and purchas-
ing capabilities to them to create bet-
ter and cheaper products, faster.
The model works. Today, more
than 35% of our new products in mar-
ket have elements that originated
from outside P&G, up from about
15% in 2000. And 45% of the initia-
tives in our product development
portfolio have key elements that
were discovered externally. Through
connect and develop – along with
improvements in other aspects of in-
novation related to product cost, de-
sign, and marketing – our R&D pro-
ductivity has increased by nearly
60%. Our innovation success rate has
more than doubled, while the cost of
innovation has fallen. R&D invest-
ment as a percentage of sales is down
from 4.8% in 2000 to 3.4% today.
And, in the last two years, we’ve
launched more than 100 new prod-
ucts for which some aspect of execu-
tion came from outside the com-
pany. Five years after the company’s
stock collapse in 2000, we have dou-
bled our share price and have a port-
folio of 22 billion-dollar brands.
march 2006 61
According to a recent Conference Board survey of CEOs
and board chairs, executives’ number one concern is “sus-
tained and steady top-line growth.” CEOs understand the
importance of innovation to growth, yet how many have
overhauled their basic approach to innovation? Until
companies realize that the innovation landscape has
changed and acknowledge that their current model is un-
sustainable, most will find that the top-line growth they
require will elude them.
Where to PlayWhen people first hear about connect and develop, they
often think it’s the same as outsourcing innovation –
contracting with outsiders to develop innovations for
P&G. But it’s not. Outsourcing strategies typically just
transfer work to lower-cost providers. Connect and
develop, by contrast, is about finding good ideas and

bringing them in to enhance and capitalize on internal
capabilities.
To do this, we collaborate with organizations and indi-
viduals around the world, systematically searching for
proven technologies, packages, and products that we can
improve, scale up, and market, either on our own or in
partnership with other companies. Among the most suc-
cessful products we’ve brought to market through con-
nect and develop are Olay Regenerist, Swiffer Dusters,
and the Crest SpinBrush.
For connect and develop to work, we realized, it was
crucial to know exactly what we were looking for, or
where to play. If we’d set out without carefully defined
targets, we’d have found loads of ideas but perhaps none
that were useful to us. So we established from the start
that we would seek ideas that had some degree of success
already; we needed to see, at least, working products,
prototypes, or technologies, and (for products) evidence
of consumer interest. And we would focus on ideas and
products that would benefit specifically from the applica-
tion of P&G technology, marketing, distribution, or other
capabilities.
Then we determined the areas in which we would look
for these proven ideas. P&G is perhaps best known for its
personal hygiene and household-cleaning products –
brands like Crest, Charmin, Pampers, Tide, and Downy.
Yet we produce more than 300 brands that span, in addi-
tion to hygiene and cleaning, snacks and beverages, pet
nutrition, prescription drugs, fragrances, cosmetics, and
many other categories. And we spend almost $2 billion
a year on R&D across 150 science areas, including materi-
als, biotechnology, imaging, nutrition, veterinary medi-
cine, and even robotics.
To focus our idea search, we directed our surveillance
to three environments:
Top ten consumer needs. Once a year, we ask our
businesses what consumer needs, when addressed, will
drive the growth of their brands. This may seem like an
obvious question, but in most companies, researchers
are working on the problems that they find interesting
rather than those that might contribute to brand growth.
This inquiry produces a top-ten-needs list for each busi-
ness and one for the company overall. The company list,
for example, includes needs such as “reduce wrinkles, im-
prove skin texture and tone,” “improve soil repellency
and restoration of hard surfaces,” “create softer paper
products with lower lint and higher wet strength,” and
“prevent or minimize the severity and duration of cold
symptoms.”
These needs lists are then developed into science prob-
lems to be solved. The problems are often spelled out in
technology briefs, like the one we sent out to find an ink-
jet process for Pringles Prints. To take another example,
a major laundry need is for products that clean effectively
using cold water. So, in our search for relevant innova-
tions, we’re looking for chemistry and biotechnology so-
lutions that allow products to work well at low temper-
atures. Maybe the answer to our cold-water-cleaning
problem is in a lab that’s studying enzymatic reactions in
microbes that thrive under polar ice caps, and we need
only to find the lab.
Adjacencies. We also identify adjacencies–that is, new
products or concepts that can help us take advantage of
existing brand equity. We might, for instance, ask which
baby care items – such as wipes and changing pads – are
adjacent to our Pampers disposable diapers, and then
seek out innovative emerging products or relevant tech-
nologies in those categories. By targeting adjacencies in
oral care, we’ve expanded the Crest brand beyond tooth-
paste to include whitening strips, power toothbrushes,
and flosses.
Technology game boards. Finally, in some areas, we
use what we call technology game boards to evaluate how
technology acquisition moves in one area might affect
products in other categories. Conceptually, working with
these planning tools is like playing a multilevel game of
chess. They help us explore questions such as “Which of
our key technologies do we want to strengthen?”“Which
technologies do we want to acquire to help us better com-
pete with rivals?” and “Of those that we already own,
which do we want to license, sell, or codevelop further?”
The answers provide an array of broad targets for our in-
novation searches and, as important, tell us where we
shouldn’t be looking.
How to NetworkOur global networks are the platform for the activities
that, together, constitute the connect-and-develop strat-
egy. But networks themselves don’t provide competitive
Inside Procter & Gamble’s New Model for Innovation
62 harvard business review
Most companies are still clinging to a bricks-and-mortar R&D infrastructure and the idea that their innovation
must principally reside within their own four walls.

YYEE
LLMM
AAGG
CCYY
AANN
BBLLAA
CCKK
Inside Procter & Gamble’s New Model for Innovation
advantage any more than the phone system does. It’s how
you build and use them that matters.
Within the boundaries defined by our needs lists, adja-
cency maps, and technology game boards, no source of
ideas is off-limits. We tap closed proprietary networks and
open networks of individuals and organizations available
to any company. Using these networks, we look for ideas
in government and private labs, as well as academic and
other research institutions; we tap suppliers, retailers,
competitors, development and trade partners, VC firms,
and individual entrepreneurs.
Here are several core networks that we use to seek out
new ideas. This is not an exhaustive list; rather, it is a snap-
shot of the networking capabilities that we’ve found most
useful.
Proprietary networks. We rely on several proprietary
networks developed specifically to facilitate connect-and-
develop activities. Here are two of the largest ones.
Technology entrepreneurs. Much of the operation and
momentum of connect and develop depends on our net-
work of 70 technology entrepreneurs based around the
world. These senior P&G people lead the development of
our needs lists, create adjacency maps and technology
game boards, and write the technology briefs that define
the problems we are trying to solve. They create external
connections by, for example, meeting with university and
industry researchers and forming supplier networks,
and they actively promote these connections to decision
makers in P&G’s business units.
The technology entrepreneurs combine aggressive
mining of the scientific literature, patent databases, and
other data sources with physical prospecting for ideas –
say, surveying the shelves of a store in Rome or combing
product and technology fairs. Although it’s effective and
necessary to scout for ideas electronically, it’s not suffi-
cient. It was a technology entrepreneur who, exploring
a local market in Japan, discovered what ultimately be-
came the Mr. Clean Magic Eraser. We surely wouldn’t
have found it otherwise. (See the exhibit “The Osaka
Connection.”)
The technology entrepreneurs work out of six connect-
and-develop hubs, in China, India, Japan, Western Europe,
Latin America, and the United States. Each hub focuses
on finding products and technologies that, in a sense, are
specialties of its region: The China hub, for example, looks
in particular for new high-quality materials and cost inno-
vations (products that exploit China’s unique ability to
make things at low cost). The India hub seeks out local tal-
ent in the sciences to solve problems–in our manufactur-
ing processes, for instance – using tools like computer
modeling.
Thus far, our technology entrepreneurs have identified
more than 10,000 products, product ideas, and promising
technologies. Each of these discoveries has undergone a
formal evaluation, as we’ll describe further on.
march 2006 63
Leading Connect andDevelopThe connect-and-develop strategy requires that a se-
nior executive have day-to-day accountability for its
vision, operations, and performance. At P&G, the
vice president for innovation and knowledge has this
responsibility. Connect-and-develop leaders from
each of the business units at P&G have dotted-line
reporting relationships with the VP. The managers
for our virtual R&D networks (such as NineSigma
and our supplier network), the technology entrepre-
neur and hub network, our connect-and-develop legal
resources, and our training resources report directly.
The VP oversees the development of networks and
new programs,manages a corporate budget,and mon-
itors the productivity of networks and activities. This
includes tracking the performance of talent markets
like NineSigma and InnoCentive as well as measur-
ing connect-and-develop productivity by region –
evaluating, for example, the costs and output (as
measured by products in market) of foreign hubs. Pro-
ductivity measurements for the entire program are
reported annually.
Suppliers. Our top 15 suppliers have an estimated com-
bined R&D staff of 50,000. As we built connect and de-
velop, it didn’t take us long to realize that they repre-
sented a huge potential source of innovation. So we
created a secure IT platform that would allow us to share
technology briefs with our suppliers. If we’re trying to
find ways to make detergent perfume last longer after
clothes come out of the dryer, for instance, one of our
chemical suppliers may well have the solution. (Suppliers
can’t see others’ responses, of course.) Since creating our
supplier network, we’ve seen a 30% increase in innovation
projects jointly staffed with P&G’s and suppliers’ re-
searchers. In some cases, suppliers’ researchers come to
work in our labs, and in others, we work in theirs – an ex-
ample of what we call “cocreation,”a type of collaboration
that goes well beyond typical joint development.
We also hold top-to-top meetings with suppliers so our
senior leaders can interact with theirs. These meetings,
along with our shared-staff arrangements, improve rela-
tionships, increase the flow of ideas, and strengthen each
company’s understanding of the other’s capabilities – all
of which helps us innovate.
Open networks. A complement to our proprietary net-
works are open networks. The following four are particu-
larly fruitful connect-and-develop resources.

Inside Procter & Gamble’s New Model for Innovation
NineSigma. P&G helped create NineSigma, one of sev-
eral firms connecting companies that have science and
technology problems with companies, universities, gov-
ernment and private labs, and consultants that can de-
velop solutions. Say you have a technical problem you
want to crack–for P&G, as you’ll recall, one such problem
is cold-temperature washing. NineSigma creates a tech-
nology brief that describes the problem, and sends this to
its network of thousands of possible solution providers
worldwide. Any solver can submit a nonconfidential pro-
posal back to NineSigma, which is transmitted to the
contracting company. If the company likes the proposal,
NineSigma connects the company and solver, and the
project proceeds from there. We’ve distributed technol-
ogy briefs to more than 700,000 people through Nine-
Sigma and have as a result completed over 100 projects,
with 45% of them leading to agreements for further
collaboration.
InnoCentive. Founded by Eli Lilly, InnoCentive is simi-
lar to NineSigma – but rather than connect companies
with contract partners to solve broad problems across
many disciplines, InnoCentive brokers solutions to more
narrowly defined scientific problems. For example, we
might have an industrial chemical reaction that takes five
steps to accomplish and want to know if it can be done in
three. We’ll put the question to InnoCentive’s 75,000 con-
tract scientists and see what we get back. We’ve had prob-
lems solved by a graduate student in Spain, a chemist in
India, a freelance chemistry consultant in the United
States, and an agricultural chemist in Italy. About a third
of the problems we’ve posted through InnoCentive have
been solved.
YourEncore. In 2003, we laid the groundwork for a busi-
ness called YourEncore. Now operated independently, it
connects about 800 high-performing retired scientists
and engineers from 150 companies with client businesses.
By using YourEncore, companies can bring people with
deep experience and new ways of thinking from other or-
ganizations and industries into their own.
Through YourEncore, you can contract with a retiree
who has relevant experience for a specific, short-term
assignment (compensation is based on the person’s pre-
retirement salary, adjusted for inflation). For example, we
might tap a former Boeing engineer with expertise in vir-
tual aircraft design to apply his or her skills in virtual
product prototyping and manufacturing design at P&G,
even though our projects have nothing to do with avia-
tion. What makes this model so powerful is that client
companies can experiment at low cost and with little risk
on cross-disciplinary approaches to problem solving. At
any point, we might have 20 retirees from YourEncore
working on P&G problems.
Yet2.com. Six years ago, P&G joined a group of Fortune
100 companies as an initial investor in Yet2.com, an on-
line marketplace for intellectual property exchange. Un-
like NineSigma and InnoCentive, which focus on helping
companies find solutions to technology problems, Yet2
.com brokers technology transfer both into and out of
companies, universities, and government labs. Yet2.com
works with clients to write briefs describing the technol-
ogy that they’re seeking or making available for license or
purchase, and distributes these briefs throughout a global
network of businesses, labs, and institutions. Network
members interested in posted briefs contact Yet2.com
and request an introduction to the relevant client. Once
introduced, the parties negotiate directly with each other.
Through Yet2.com, P&G was able to license its low-cost
microneedle technology to a company specializing in
drug delivery. As a result of this relationship, we have our-
selves licensed technology that has applications in some
of our core businesses.
When to EngageOnce products and ideas are identified by our networks
around the world, we need to screen them internally. All
the screening methods are driven by a core understand-
ing, pushed down through the entire organization, of
what we’re looking for. It’s beyond the scope of this arti-
cle to describe all of the processes we use to evaluate ideas
from outside. But a look at how we might screen a new
product found by a technology entrepreneur illustrates
one common approach.
When our technology entrepreneurs are meeting with
lab heads, scanning patents, or selecting products off store
shelves, they’re conducting an initial screening in real
time: Which products, technologies, or ideas meet P&G’s
where-to-play criteria? Let’s assume a technology entre-
preneur finds a promising product on a store shelf that
passes this initial screening. His or her next step will be
to log the product into our online “eureka catalog,” using
a template that helps organize certain facts about the
product: What is it? How does it meet our business needs?
Are its patents available? What are its current sales? The
catalog’s descriptions and pictures (which have a kind of
Sharper Image feel) are distributed to general manag-
ers, brand managers, R&D teams, and others throughout
the company worldwide, according to their interests, for
evaluation.
Meanwhile, the technology entrepreneur may actively
promote the product to specific managers in relevant
lines of business. If an item captures the attention of, say,
the director of the baby care business, she will assess its
alignment with the goals of the business and subject it to
a battery of practical questions–such as whether P&G has
the technical infrastructure needed to develop the prod-
uct – meant to identify any showstopping impediments
to development. The director will also gauge the prod-
uct’s business potential. If the item continues to look
promising, it may be tested in consumer panels and, if the
64 harvard business review

YYEE
LLMM
AAGG
CCYY
AANN
BBLLAA
CCKK
The Osaka ConnectionIn the connect-and-develop world, chance favors the prepared mind. When one of P&G’s tech-
nology entrepreneurs discovered a stain-removing sponge in a market in Osaka, Japan, he sent
it to the company for evaluation. The resulting product, the Mr. Clean Magic Eraser, is now in
third-generation development and has achieved double its projected revenues.
German chemical com-pany BASF manufacturesa melamine resin foamcalled Basotect for sound-proofing and insulation inthe construction and auto-motive industries.
LEC, a Tokyo-basedconsumer-productscompany, markets Basotect foam in Japanas a household spongecalled Cleenpro.
Basotect is packagedas-is and launched nationally as Mr. CleanMagic Eraser.
The first cocreated Basotect product, the Magic Eraser Duo, islaunched nationally inthe United States.
The cocreated MagicEraser Wheel & Tire islaunched nationally in theUnited States.
BASF and P&G con-tinue to collaborate onnext-generation MagicEraser products.
Mr. Clean Magic Eraser islaunched in Europe.
BASF and P&G researcherscollaborate in shared labsto improve Basotect’scleaning properties, dura-bility, and versatility.
Market research confirmsenthusiasm for the prod-uct. The product is movedinto portfolio for develop-ment; P&G negotiates pur-chase of Basotect fromBASF and terms for furthercollaboration.
A Japan-based technology en-trepreneur with P&G discoversthe product in an Osaka gro-cery store, evaluates its mar-ket performance in Japan, andestablishes its fit with the P&Ghome-care product develop-ment and marketing criteria.
The technology entrepreneursends samples to R&D productresearchers in Cincinnati forperformance evaluation andposts a product description andevaluation of market potentialon P&G’s internal “eureka catalog” network.
2001DISCOVER
2002EVALUATE
2003LAUNCH
2004COCREATE

Inside Procter & Gamble’s New Model for Innovation
response is positive, moved into our product development
portfolio. Then we’ll engage our external business devel-
opment (EBD) group to contact the product’s manufac-
turer and begin negotiating licensing, collaboration, or
other deal structures. (The EBD group is also responsible
for licensing P&G’s intellectual property to third parties.
Often, we find that the most profitable arrangements are
ones where we both license to and license from the same
company.) At this point, the product found on the outside
has entered a development pipeline similar in many ways
to that for any product developed in-house.
The process, of course, is more complex and rigorous
than this thumbnail sketch suggests. In the end, for every
100 ideas found on the outside, only one ends up in the
market.
Push the CultureNo amount of idea hunting on the outside will pay off
if, internally, the organization isn’t behind the program.
Once an idea gets into the development pipeline, it needs
R&D, manufacturing, market research, marketing, and
other functions pulling for it. But, as you know, until very
recently, P&G was deeply centralized and internally fo-
cused. For connect and develop to work, we’ve had to
nurture an internal culture change while developing sys-
tems for making connections. And that has involved not
only opening the company’s floodgates to ideas from the
outside but actively promoting internal idea exchanges
as well.
For any product development program, we tell R&D
staff that they should start by finding out whether related
work is being done elsewhere in the company; then they
should see if an external source–a partner or supplier, for
instance – has a solution. Only if those two avenues yield
nothing should we consider inventing a solution from
scratch. Wherever the solution comes from (inside or
out), if the end product succeeds in the marketplace, the
rewards for employees involved in its development are
the same. In fact, to the extent that employees get recog-
nition for the speed of product development, our reward
systems actually favor innovations developed from out-
side ideas since, like Pringles Prints, these often move
more quickly from concept to market.
We have two broad goals for this reward structure. One
is to make sure that the best ideas, wherever they come
from, rise to the surface. The other is to exert steady pres-
sure on the culture, to continue to shift mind-sets away
from resistance to “not invented here.” Early on, employ-
ees were anxious that connect and develop might elimi-
nate jobs or that P&G would lose capabilities. That stands
to reason, since as you increase the ideas coming in from
the outside you might expect an equivalent decrease in the
need for internal ideas. But with our growth objectives,
there is no limit to our need for solid business-building
ideas. Connect and develop has not eliminated R&D jobs,
and it has actually required the company to develop new
skills. There are still pockets within P&G that have not
embraced connect and develop, but the trend has been to-
ward accepting the approach, even championing it, as its
benefits have accrued and people have seen that it rein-
forces their own work.
Adapt or Die We believe that connect and develop will become the
dominant innovation model in the twenty-first century.
For most companies, as we’ve argued, the alternative
invent-it-ourselves model is a sure path to diminishing
returns.
To succeed, connect and develop must be driven by the
top leaders in the organization. It is destined to fail if it is
seen as solely an R&D strategy or isolated as an experi-
ment in some other corner of the company. As Lafley did
at P&G, the CEO of any organization must make it an ex-
plicit company strategy and priority to capture a certain
amount of innovation externally. In our case, the target is
a demanding – even radical – 50%, but we’re well on our
way to achieving it.
Don’t postpone crafting a connect-and-develop strat-
egy, and don’t approach the process incrementally. Com-
panies that fail to adapt to this model won’t survive the
competition.
Reprint R0603C; HBR OnPoint 351X
To order, see page 151.
66 harvard business review
Words of WarningProcter & Gamble’s development and implementation
of connect and develop has unfolded over many years.
There have been some hiccups along the way, but
largely it has been a methodical process of learning by
doing, abandoning what doesn’t work and expanding
what does. Over five years in, we’ve identified three core
requirements for a successful connect-and-develop
strategy.
• Never assume that “ready to go” ideas found out-
side are truly ready to go. There will always be develop-
ment work to do, including risky scale-up.
• Don’t underestimate the internal resources re-
quired. You’ll need a full-time, senior executive to run
any connect-and-develop initiative.
• Never launch without a mandate from the CEO.
Connect and develop cannot succeed if it’s cordoned off
in R&D. It must be a top-down, companywide strategy.

MANAGEMENT SCIENCEVol. 53, No. 7, July 2007, pp. 1113–1126issn 0025-1909 �eissn 1526-5501 �07 �5307 �1113
informs ®
doi 10.1287/mnsc.1060.0624©2007 INFORMS
Interfirm Collaboration Networks: The Impact ofLarge-Scale Network Structure on Firm Innovation
Melissa A. SchillingStern School of Business, New York University, 40 West Fourth Street, New York, New York 10012,
Corey C. PhelpsDepartment of Management and Organization, University of Washington, Box 353200,
Seattle, Washington 98195, [email protected]
The structure of alliance networks influences their potential for knowledge creation. Dense local clusteringprovides information transmission capacity in the network by fostering communication and cooperation.
Nonredundant connections contract the distance between firms and give the network greater reach by tappinga wider range of knowledge resources. We propose that firms embedded in alliance networks that exhibit bothhigh clustering and high reach (short average path lengths to a wide range of firms) will have greater innovativeoutput than firms in networks that do not exhibit these characteristics. We find support for this proposition ina longitudinal study of the patent performance of 1,106 firms in 11 industry-level alliance networks.
Key words : alliances; networks; innovation; patentsHistory : Accepted by Brian Uzzi and Luis Amaral, special issue editors; received June 16, 2004. This paperwas with the authors 5 months for 2 revisions.
IntroductionAlthough research has long recognized the impor-tance of interfirm networks in firm innovation (seeFreeman 1991 for a review), much of this work hastreated the network concept as a metaphor. Onlyrecently have researchers begun to assess the formalstructural properties of alliance networks and theirimpact on firm innovation. This research has focusedon a firm’s position within a broader network ofrelationships or the structure of its immediate net-work neighborhood rather than the structure of theoverall network. Studies have examined a firm’s cen-trality (Smith-Doerr et al. 1999), number of alliances(Shan et al. 1994), and local network structure (Ahuja2000, Baum et al. 2000). To our knowledge, empir-ical research has not yet examined the impact ofthe structure of industry-level1 alliance networks onmember firm innovation. In a related study, how-ever, Uzzi and Spiro (2005) examined the networkstructure of the creative artists who made broadwaymusicals from 1945 to 1989, and concluded that thelarge-scale structure of the artists’ collaboration net-work significantly influenced their creativity, and thefinancial and artistic performance of their musicals.This raises the following questions: Does the structure
1 An industry-level network is a specific type of whole or “large-scale” network. Wellman (1988, p. 26) defined a whole network asthe relationships that exist among members of a population.
of an industry-level interfirm network influence therate of knowledge creation among firms in the net-work? If so, what structural properties will enhancefirm innovation?To address these questions, we examine the impact
of two key large-scale network properties, clusteringand reach, on the innovative output of members ofthe network. The dense connectivity of clusters cre-ates transmission capacity in a network (Burt 2001),enabling large amounts of information to rapidlydiffuse, while reach (i.e., short path lengths to awide range of firms) ensures that diverse informationsources can be tapped. We argue that networks withboth high clustering and high reach will significantlyenhance the creative output of member firms. We testthis hypothesis using longitudinal data on the inno-vative performance of a large panel of firms operatingin 11 industry-level alliance networks.This research offers several important contributions
for understanding knowledge creation in interfirmnetworks. First, we find empirical support for ourargument that the combination of clustering andreach increases member firm innovation. To ourknowledge, no other study has attempted to assessthe effect of industry-level interfirm networks on theinnovation performance of member firms. Althoughrecent studies have examined the structure of large-scale interfirm networks and the possible causes ofthese structures (Baum et al. 2003, Kogut and Walker
1113

Schilling and Phelps: Interfirm Collaboration Networks1114 Management Science 53(7), pp. 1113–1126, © 2007 INFORMS
2001), little research has examined the consequences oflarge-scale network structure in an industrial setting(Uzzi and Spiro 2005 is a recent exception). Second,while most studies of network structure have exam-ined a single industry, our study uses longitudinaldata on 11 industries, which strengthens the general-izability of our findings.We begin by describing two key structural char-
acteristics of interfirm networks and their effect oninformation diffusion in the network. From this wedevelop a hypothesis about how the structure of inter-firm networks will influence the innovative outputof member firms. We test the hypothesis on a large,unbalanced panel of firms embedded in 11 industry-level alliance networks.
Large-Scale Interfirm Networks andFirm Knowledge CreationWe adopt a recombinatory search perspective inexplaining the process of innovation (Fleming 2001).Innovation is characterized as a problem-solving pro-cess in which solutions to problems are discovered viasearch (Dosi 1988). Prior research suggests that searchprocesses that lead to the creation of new knowl-edge, embodied in artifacts such as patents and newproducts, most often involve the novel recombinationof known elements of knowledge, problems, or solu-tions (Fleming 2001, Nelson and Winter 1982) or thereconfiguration of the ways in which knowledge ele-ments are linked (Henderson and Clark 1990). Crit-ical inputs into this process include access to andfamiliarity with a variety of knowledge elements (e.g.,different technological components and the scien-tific and engineering know-how embedded in them),novel problems and insights into their resolution,failed recombination efforts, and successful solutions(Hargadon and Fanelli 2002). Firms that have greateraccess to and understanding of these recombinatoryresources should be advantaged in their innovationefforts.As firms form and maintain alliances with each
other, they weave a network of direct and indirectrelationships. As a result, firms embedded in thesenetworks gain access to information and know-how of direct partners and that of others in thenetwork to which they are indirectly connected(Ahuja 2000, Gulati and Gargiulo 1999). The net-work of alliance relationships constitutes a conduitthat channels the flow of information and know-how among firms in the network (Ahuja 2000, Owen-Smith and Powell 2004), with each member firmacting as both a recipient and transmitter of infor-mation (Ahuja 2000). The structure of these networksgreatly influences the dynamics of information dif-fusion within the networks. Large-sample studies
have found that direct alliance relationships facilitateknowledge flows between partners (Gomes-Cassereset al. 2006, Mowery et al. 1996) and enhance theinnovative performance of firms (e.g., Deeds and Hill1996, Stuart 2000). Research also shows that the extentto which a firm is indirectly connected to other firmsin an alliance network enhances its innovativeness(Ahuja 2000, Owen-Smith and Powell 2004, Soh 2003).Given the role of direct and indirect ties as channels
for the flow of information and know-how, we arguethat the structure of the interfirm network will signifi-cantly influence the recombination process. Two struc-tural characteristics that have a particularly importantrole in diffusion are clustering and reach.
ClusteringAlliance networks tend to be highly clustered: Somegroups of firms will have more links connecting themto each other than to the other firms in the net-work. A firm’s clustering coefficient can be calculatedas the proportion of its partners that are themselvesdirectly linked to each other. The clustering coefficientof the overall network is the average of this measureacross all firms in the network. Several mechanismslead to clustering in interfirm knowledge networks,but two of the most common are linking based onsimilarity or complementarity. Firms tend to interactmore intensely or frequently with other firms withwhich they share some type of proximity or similarity,such as geography or technology (Baum et al. 2003,Rosenkopf and Almeida 2003). This tends to result ina high degree of clustering.Clustering increases the information transmission
capacity of a network. First, the dense connectivityof individual clusters ensures that information intro-duced into a cluster will quickly reach other firmsin the cluster. The multiple pathways between firmsalso enhance the fidelity of the information received.Firms can compare the information received frommultiple partners, helping them to identify ways inwhich it has been distorted or is incomplete. Second,clusters within networks are important structures formaking information exchange meaningful and use-ful. The internal density of a cluster can increase thedissemination of alternative interpretations of prob-lems and their potential solutions, deepening thecollective’s understanding and stimulating collectiveproblem solving (Powell and Smith-Doerr 1994). Thedevelopment of a shared understanding of problemsand solutions greatly facilitates communication andfurther learning (Brown and Duguid 1991, Powellet al. 1996). Third, dense clustering can make firmsmore willing and able to exchange information (Ahuja2000). Sociologists (e.g., Coleman 1988, Granovetter1992) have suggested that densely clustered networksgive rise to trust, reciprocity norms, and a shared
Schilling and Phelps: Interfirm Collaboration NetworksManagement Science 53(7), pp. 1113–1126, © 2007 INFORMS 1115
identity, all of which lead to a high level of coop-eration and can facilitate collaboration by provid-ing self-enforcing informal governance mechanisms(Dyer and Singh 1998). In addition to stimulatinggreater transparency, trust and reciprocity exchangesfacilitate intense interaction among personnel frompartnered firms (Uzzi 1997), improving the transferof tacit, embedded knowledge (Hansen 1999, Zanderand Kogut 1995). Thus, clustering enables richer andgreater amounts of information and knowledge to beexchanged and integrated more readily.When dense clusters are sparsely connected to each
other, they become important structures for creatingand preserving the requisite variety of knowledge inthe broader network that enables knowledge creation.The internal cohesion of a cluster can cause muchof the information and knowledge shared withina cluster to become homogeneous and redundant(Burt 1992, Granovetter 1973). The dense links pro-vide many redundant paths to the same actors, andthus the same sources of information and knowledge.Cohesion can also lead to norms of adhering to estab-lished standards and conventions, which can poten-tially stifle experimentation and creativity (Uzzi andSpiro 2005). This limits innovation. Clusters of firmswill, however, tend to be heterogeneous across a net-work in the knowledge they possess and producedue to the different initial conditions and causes foreach cluster to form. The diversity of knowledge dis-tributed across clusters in the network provides therequisite variety for recombination.Clustering thus offers both local and global advan-
tages. Firms benefit from having redundant connec-tivity among their immediate neighbors because itenhances the speed and likelihood of informationaccess, and the depth of information interpretation.Firms also benefit from being embedded within alarger network that is clustered because the informa-tion a firm receives from partners that are embed-ded in other clusters is likely to be more completeand richly understood than information received frompartners not embedded in clusters, and because infor-mation received from different clusters is likely to bediverse, enabling a wider range of recombinatorialpossibilities.
ReachThe size of a network and its average path length(i.e., the average number of links that separates eachpair of firms in the network) also impacts informa-tion diffusion and novel recombination. The morefirms that can be reached by any path from a givenfirm, the more knowledge that firm can potentiallyaccess. However, the likelihood, speed, and integrityof knowledge transfer between two firms are directlyrelated to the path length separating those two firms.
The diffusion of information and knowledge occursmore rapidly and with more integrity in networkswith short average path lengths than in networkswith longer paths (Watts 1999). A firm that is con-nected to a large number of firms by a short aver-age path can reach more information, and can do soquickly and with less risk of information distortionthan a firm that is connected to fewer firms or bylonger paths. To capture this we use distance-weightedreach.A firm’s distance-weighted reach is the sum of the
reciprocal distances to every firm that is reachablefrom a given firm, i.e.,
∑j 1/dij , where dij is defined
as the minimum distance (geodesic), d, from a focalfirm i to partner j , where i �= j . A network’s averagedistance-weighted reach is this measure averaged acrossall firms in the network, (
∑n
∑j 1/dij �/n, where n is
the number of firms in the network. Other thingsbeing equal, a very large connected network with avery short average path length (e.g., a completely con-nected network where there are many firms and everyfirm is directly connected to every other firm, or astar graph with many firms all connected to the samecentral “hub” firm) will have the greatest averagedistance-weighted reach. Longer path lengths, smallernetwork size, or disconnects that fragment the net-work into multiple components all decrease averagedistance-weighted reach.The preceding reveals one of the key benefits of
using distance-weighted reach: It provides a mean-ingful measure of the overall size and connectivityof a network, even when that network has multiplecomponents, and/or component structure is changingover time. It avoids the infinite path length problemtypically associated with disconnected networks bymeasuring only the path length between connectedpairs of nodes, and it provides a more meaningfulmeasure than the simple average path length betweenconnected pairs by factoring in the size of connectedcomponents.2
Because forming alliances is costly and constrained,there appears to be a trade-off between forming denseclusters to facilitate rapid exchange and integration ofknowledge, versus forging links to create short pathsto a wider range of firms. However, recent researchhas shown that even sparse, highly clustered net-works can have high reach if there are a few linkscreating bridges between clusters (Watts 1999, Hansen2002, Hargadon 1998). Bridges between clusters offirms provide member firms access to diverse infor-mation that exists beyond their local cluster, enabling
2 The authors are grateful to Steve Borgatti for pointing this out.They are also grateful to Mark Newman for numerous discussionsabout how to handle the infinite path length consideration in ournetworks.

Schilling and Phelps: Interfirm Collaboration Networks1116 Management Science 53(7), pp. 1113–1126, © 2007 INFORMS
new combinations with their existing knowledge sets,while preserving the information transmission advan-tages of clusters. As Uzzi and Spiro (2005) note,bridges between clusters increase the likelihood thatdifferent ideas and routines will come into contact,enabling recombinations that incorporate both previ-ous conventions and novel approaches. The combi-nation of clustering and reach thus enables a widerange of information to be exchanged and integratedrapidly, leading to greater knowledge creation. Insum, we predict a multiplicative interaction betweenclustering and reach in their effect on firm knowledgecreation. Consistent with the symmetrical nature ofsuch interactions (Jaccard and Turrisi 2003), we haveargued and expect that the effect of clustering on firmknowledge creation will be increasingly positive asreach increases, while the effect of reach on knowl-edge creation will be increasingly positive as cluster-ing increases.
Hypothesis. Firms participating in alliance networksthat combine a high degree of clustering and reach willexhibit more knowledge creation than firms in networksthat do not exhibit these characteristics.
MethodsTo test our hypothesis, we constructed a large, unbal-anced panel of U.S. firms for the period 1990–2000.The panel includes all U.S. firms that were part ofthe alliance networks of 11 high-technology man-ufacturing industries: aerospace equipment (stan-dard industrial classifications (SICs)): 3721, 3724,3728, 3761, 3764, 3769; automotive bodies and parts(3711, 3713, 3714); chemicals (281-, 282-, 285-, 286-,287-, 288-, 289-); computer and office equipment(3571, 3572, 3575, 3577); household audiovisual equip-ment (3651); medical equipment (3841, 3842, 3843,3844, 3845); petroleum refining and products (2911,2951, 2952, 2992, 2999); pharmaceuticals (2833, 2834,2835, 2836); semiconductors (3674); telecommunica-tions equipment (366-), and measuring and control-ling devices (382-).The choice of industries was particularly important
for this study. The 11 industries selected have beendesignated as high technology in numerous Bureauof Labor Statistics studies (e.g., Hecker 1999).3 Theseindustries provide an excellent context for our studyfor three reasons. First, knowledge creation is fun-damental to the pursuit of competitive advantagein high-technology industries. Second, firms in theseindustries actively use alliances in pursuit of their
3 We omitted high-tech manufacturing industries that rarely usealliances: special industry machinery (355), electrical industrialapparatus (362), search and navigation equipment (381), and pho-tographic equipment and supplies (386).
innovation activities (Vonortas 1997). Third, becausewe use patent data for our dependent variable, it isimportant to select industries that use patents. Thereis evidence that firms in these industries activelypatent their inventions (Levin et al. 1987).
Alliance NetworksWe chose to measure the network structure createdby publicly reported strategic alliances for two rea-sons. First, there is a rich history of research onthe importance of strategic alliances as a mechanismfor knowledge sharing among firms (Freeman 1991,Gulati 1998, Powell et al. 1996). Second, alliances areused by a wide range of firms (both public and pri-vate) in a wide range of industries, and are oftenused explicitly for the exchange and joint creation ofknowledge.Social network research has identified three proce-
dural tactics for establishing network boundaries forempirical research: attributes of actors that rely onmembership criteria, such as membership in an indus-try; types of relations between actors, such as partici-pation in strategic alliances; and participation in a setof common events (Laumann et al. 1983). Accordingly,we employed two rules to guide our construction ofthe 11 industry networks used in this study. First, eachalliance included at least one firm that was a memberof the target industry (indicated by its primary four-digit SIC). Second, each alliance had to operate in thetarget industry, as indicated by its primary four-digitSIC of activity.Alliance data were gathered using Thomson Corp.’s
SDC Platinum database. The SDC data have beenused in a number of empirical studies on strategicalliances (e.g., Anand and Khanna 2000, Sampson2004). For each industry, alliances were collected thatwere announced between 1990 and 1997. We chose1990 as the initial year for our sample because infor-mation on alliances formed prior to 1990 is verysparse in the SDC database (Anand and Khanna 2000,p. 300). Separate alliance networks were created foreach industry according to the alliance’s primary SIC.Both public and private firms were included. We usedata on only U.S. firms because the SDC alliance dataare much more complete for U.S. firms than for non-U.S. firms (Phelps 2003). All alliances were aggre-gated to the parent corporation.The resulting data set includes 1,106 firms involved
in 3,663 alliances. Many of the alliances included morethan two participating firms, so the number of dyadsis greater, totaling 5,306. Because any type of alliancemay provide a path for knowledge diffusion, andbecause prior studies indicate that the breadth of analliance’s true activity is often much greater than whatis formally reported (Powell et al. 1996), we includeall alliance types in our analysis. We do, however,

Schilling and Phelps: Interfirm Collaboration NetworksManagement Science 53(7), pp. 1113–1126, © 2007 INFORMS 1117
control for the proportion of alliances in each net-work formed for the explicit purpose of technologyexchange or development.Alliances typically last for more than one year,
but alliance termination dates are rarely reported.This required us to make an assumption about alli-ance duration. We took a conservative approach andassumed that alliance relationships last for threeyears, consistent with recent empirical work on aver-age alliance duration (Phelps 2003). Other researchhas taken a similar approach, using windows rang-ing from one to five years (e.g., Gulati and Gargiulo1999, Stuart 2000). We created alliance networksbased on three-year windows (i.e., 1990–1992�1991–1993� � � �1995–1997), resulting in six snapshots of net-work structure for each industry, for a total of66 alliance network snapshots. Each network snap-shot was constructed as an undirected binary adja-cency matrix (Wasserman and Faust 1994).4 Multiplealliances between the same pair of firms in a timewindow were treated as one link. UCINET 6 was usedto obtain measures on these networks, as describedbelow (Borgatti et al. 2002).As we focus on publicly reported contractual alli-
ance agreements, we do not observe the numer-ous informal collaborative arrangements that existbetween firms in our sample. Such informal arrange-ments often lead to the types of formal agreementsthat we observe (Powell et al. 1996, Rosenkopf et al.2001). Thus, our analysis represents a conservativetest of our diffusion argument because our datado not include informal relationships that promoteknowledge transfer.
Dependent Variable: PatentsOne way that knowledge creation is instantiated isin the form of inventions (Schmookler 1966). Knowl-edge embedded in artifacts such as inventions rep-resents the “empirical knowledge” of organizations(Hargadon and Fanelli 2002). Inventions thus pro-vide a trace of an organization’s knowledge creation.Patents provide a measure of novel invention that isexternally validated through the patent examination
4 Each matrix reflects the alliances maintained within the networkas of the end of the focal year. Because alliances often endurelonger than one year, constructing adjacency matrices using onlyalliances announced in the focal year would bias the connectivity ofthe observed networks downward. Consider the initial year of thepanel for the network variables (1992): Using only alliances formedin 1992 would not capture the alliance relationships formed priorto, yet maintained through, 1992. Data on both presample allianceformation and alliance duration is needed to accurately assess net-work structure in each of the sample years. Moving three-year win-dows more accurately reflects the structure of an alliance networkin the annual adjacency matrices. Robinson and Stuart (2007) use asimilar approach in assessing alliance networks in the biotechnol-ogy industry.
process (Griliches 1990). Patent counts have beenshown to correlate well with new product introduc-tions and invention counts (Basberg 1987). Trajtenberg(1987) concluded that patents are valid and robustindicators of knowledge creation. One of the chal-lenges with using patents to measure innovation isthat the propensity to patent may vary with indus-try, resulting in a potential source of bias (Levinet al. 1987). We addressed this potential bias in threeways. First, we sample only high-tech manufacturingindustries, which helps to ensure a degree of com-monality in the industries’ emphasis on innovation.To further capture differences in emphasis on inno-vation, we control for industry-level R&D intensity.Third, to control for unobserved factors that influ-ence the propensity to patent that are likely to be sta-ble within industries, we control for industry fixedeffects. The propensity to patent may also differ dueto firm characteristics (Griliches 1990). We attemptto control for such sources of heterogeneity usingcovariate, Presample Patents (described below), andfirm fixed and random effects in our estimations.We measure the dependent variable, Patentsit , as
the number of successful patent applications for firm iin year t. We used the Delphion database to collectyearly patent counts for each of the firms, aggregat-ing subsidiary patents up to the ultimate parent level.Granted patents were counted in their year of applica-tion. Yearly patent counts were created for each firmfor the period of 1993 to 2000, enabling us to assessdifferent lag specifications between alliance networkstructure and patent output.
Independent Variables
Clustering Coefficient. To measure the clusteringin each network for each time period, we usedthe weighted overall clustering coefficient measure(Borgatti et al. 2002, Newman et al. 2002):
Clusteringw = 3× �number of triangles in the graph��number of connected triples�
�
where a triangle is a set of three nodes (e.g., i, j , k),each of which is connected to both of the others, and aconnected triple is a set of three nodes in which at leastone is connected to both the others (e.g., i is connectedto j and k, but j and k need not be connected). Thismeasure indicates the proportion of triples for whichtransitivity holds (i.e., if i is connected to j and k, thenby transitivity, j and k are connected). The factor ofthree in the numerator ensures that the measure liesstrictly in the range of zero and one because each tri-angle implies three connected triples. The weightedoverall clustering coefficient represents the percentageof a firm’s alliance partners that are also partneredwith each other, weighted by the number of each

Schilling and Phelps: Interfirm Collaboration Networks1118 Management Science 53(7), pp. 1113–1126, © 2007 INFORMS
firm’s partners, averaged across all firms in the net-work. This variable can range from zero to one, withlarger values indicating increasing clustering. Whilenetwork density captures the density of the entire net-work, the clustering coefficient captures the degree towhich the overall network contains localized pock-ets of dense connectivity. A network can be globallysparse and still have a high clustering coefficient.
Reach. To capture the reach of each network foreach time period, we use a measure of averagedistance-weighted reach (Borgatti et al. 2002). This isa compound measure that takes into account both thenumber of firms that can be reached by any path froma given firm, and the path length it takes to reachthem. This measure is calculated as
Average distance weighted reach=⌈∑
n
∑j
1/dij
⌉/n�
where n is the number of nodes in the network, anddij is defined as the minimum distance (geodesic), d,from a focal node i to partner j , where i �= j . Aver-age distance-weighted reach can range from 0–n, withlarger values indicating higher reach.
Clustering × Reach. We predict that the combi-nation of clustering and reach will have a positiveimpact on member firm innovation, and thus includethe interaction term, Clustering×Reach.Firm-Level Control Variables
Presample Patents. To control for unobserved het-erogeneity in firm patenting, we follow the presam-ple information approach of Blundell et al. (1995) andcalculate the variable Presample Patents as the sum ofpatents obtained by a firm in the five years prior toits entry into the sample.
Betweenness Centrality. We control for the possi-bility that firms that occupy more central positionsin alliance networks may generate more innovationsthan more peripheral firms (e.g., Owen-Smith andPowell 2004, Soh 2003). We operationalize Central-ity using Freeman’s (1979) measure of “betweennesscentrality,” which captures the extent to which afirm is located on the shortest path (i.e., geodesic)between any two actors in its alliance network. For-mally, betweenness centrality for firm i in year t iscalculated as
Betweenness Centralityit =∑j<k
gjk�ni�/gjk�
where gjk�ni� refers to the number (n� of geodesics(i.e., shortest paths) linking firms j and k that containfocal firm i. The term gjk�ni�/gjk captures the probabil-ity that firm i is involved in the shortest path betweenj and k. Betweenness centrality is the sum of these
estimated probabilities over all pairs of firms (exclud-ing the ith firm) in the network. We use normalizedbetweenness centrality (i.e., betweenness divided bymaximum possible betweenness, expressed as a per-centage) to make the measure comparable across timeand industry networks.
Local Efficiency. While studies have found that theextent to which a firm’s partners are nonredundantenhances its knowledge creation (Baum et al. 2000),other research shows that redundant links improveinnovation (Ahuja 2000). Although the empirical evi-dence is mixed, controlling for the effect of local struc-tural holes is important if we wish to demonstratethat the global structure of the alliance network inwhich a firm is embedded has an independent andsignificant influence on its subsequent patenting. Wecontrol for the influence of a firm’s local networkstructure using Burt’s (1992) measure of efficiency.Efficiency captures the extent to which a firm’s part-ners are nonredundant, indicating the presence ofstructural holes. Local efficiency for firm i in year t iscomputed as
Local Efficiencyit =⌊∑
j
⌊1−∑
q
piqmiq
⌋⌋/Ni� j �= q�
where piq is the proportion of i’s relations invested inthe relationship with q, mjq represents the marginalstrength of the relationship between alter j and alter q(as we use binary data, values of mjq are set to oneif the relationship is present and zero otherwise), andNi represents the number of unique alliance partnersconnected to firm i. This measure can range fromzero to one, with higher values indicating greaterefficiency.
Industry (Network) Control Variables
Network Density. We control for the overall den-sity of the network with the variable Network Density,calculated for each industry network and time period.We do so because the rate and extent to which infor-mation diffuses increases with density (Yamaguchi1994). This variable measures the ratio of existinglinks in the network to the number of possible pair-wise combinations of firms, and may range fromzero to one, with larger values indicating increasingdensity.
Centralization. The extent to which a network iscentralized can also influence its diffusion properties.A highly centralized network is one in which all tiesrun through one or a few nodes, thus decreasing thedistance between any pair of nodes (Wasserman andFaust 1994). To control for network centralization, weemploy Freeman’s (1979) index of group betweennesscentralization, calculated for each industry network
Schilling and Phelps: Interfirm Collaboration NetworksManagement Science 53(7), pp. 1113–1126, © 2007 INFORMS 1119
and time period. Group betweenness centralizationfor network j in year t is
Betweenness Centralizationjt
= 100×{ g∑i=1�C ′
B�n∗�−C ′
B�ni��/�g− 1�}�
where C ′B�n
∗) is the largest realized normalized be-tweenness centrality for the set of firms in network jin year t, C ′
B�ni� is the normalized betweenness cen-trality for firm i (in industry network j for year t), andg is the number of firms. This variable is expressed asa percentage and can range from zero, where all firmshave the same individual betweenness centrality, to100, where one firm connects all other firms.
Industry R&D Intensity. To control for differencesin the emphasis on and costliness of innovationacross industries, we employ a time-varying mea-sure of industry-level R&D intensity (R&D expendi-tures/sales). We collected annual R&D expendituresand sales of firms in each industry from Compustat.We would have preferred to control for R&D inten-sity at the firm level; however, nearly 42% of oursample firms were privately owned during some por-tion of the sample, and R&D expenditures are notavailable for private firms. In investigating the robust-ness of our results, we utilize a control variable (stockof patents obtained in the past four years) that hasbeen shown to be highly correlated with annual firm-level R&D expenses. Our results are unchanged whenincluding this variable in our models.
Proportion of Alliances for R&D, Cross-Technol-ogy Transfer, or Licensing. Alliances that are estab-lished for the purpose of technology exchange ordevelopment may be more directly related to firmpatenting. To examine this possibility, we include atime-varying measure of the percentage of allianceagreements in each network that were establishedexplicitly for the purpose of joint research anddevelopment, cross-technology transfer, or technologylicensing.
Model SpecificationThe dependent variable in this study, Patents, is acount variable and takes on only nonnegative integervalues. The linear regression model is inadequatefor modeling such variables because the distribu-tion of residuals will be heteroscedastic nonnormal.A Poisson regression approach is appropriate tomodel count data (Hausman et al. 1984). However,the Poisson distribution contains the strong assump-tion that the mean and variance are equal. Patentdata often exhibit overdispersion, where the vari-ance exceeds the mean (Hausman et al. 1984). Inthe presence of overdispersion, coefficients will be
estimated consistently, but their standard errors willgenerally be underestimated, leading to spuriouslyhigh levels of significance (Cameron and Trivedi1986). Each model that we report, when estimatedusing the Poisson specification, exhibited significantoverdispersion.A commonly used alternative to the Poisson regres-
sion model is the negative binomial model. Thenegative binomial model is a generalization of thePoisson model and allows for overdispersion byincorporating an individual, unobserved effect intothe conditional mean (Hausman et al. 1984). Thepanel data implementation of the negative binomialmodel accommodates explicit control of persistentindividual unobserved effects through both fixed andrandom effects. In the present study, unobserved het-erogeneity refers to the possibility that unmeasured(or unmeasurable) differences among observationallyequivalent firms affects their patenting. Unobservedheterogeneity may also stem from unmeasured, sys-tematic time period and industry effects. Failing tocontrol for such unobserved heterogeneity, if present,can result in specification error (Heckman 1979).We employ a number of strategies to control for
these sources of unobserved heterogeneity. First, weinclude year fixed effects to control for system-atic period effects such as differences in macroeco-nomic conditions that may affect all sampled firms’patent rates. Second, we employ individual firmeffects to control for unobserved, temporally sta-ble firm differences in patenting. We use both firmfixed and random effects in alternative estimationsof our model. We use the Hausman et al. (1984)implementation of fixed effects in the context ofa negative binomial model, which employs a con-ditional maximum-likelihood estimation procedure.5
5 Allison and Waterman (2002) recently criticized the Hausmanet al. (1984) conditional negative binomial fixed-effects model as notbeing a “true” fixed-effects method in that it does not control forall time-invariant covariates. Allison and Waterman (2002) devel-oped an unconditional negative binomial model that uses dummyvariables to represent fixed effects, which effectively controls for allstable individual effects. This procedure has been implemented inLimdep 8.0. However, estimates of � are inconsistent in negativebinomial models when using such a dummy variable approach inshort panels, due to the incidental parameters problem (Cameronand Trivedi 1998, p. 282). The number of unit-specific (e.g., firm)parameters (�i� increases with the sample size, while the numberof periods (T ) stays fixed, resulting in a limited number of obser-vations to estimate a large number of parameters. Contrary to lin-ear regression models, the maximum-likelihood estimates for �iand � are not independent for negative binomial models becausethe inconsistency of the estimates of �i are transmitted into themaximum likelihood estimate of �. Given that this method is atrue fixed-effects specification, it does not allow for time-invariantcovariates such as Presample Patents. Thus, we chose not to employAllison and Waterman’s (2002) unconditional estimator. We reportthe results using the Hausman et al. (1984) conditional fixed-effects

Schilling and Phelps: Interfirm Collaboration Networks1120 Management Science 53(7), pp. 1113–1126, © 2007 INFORMS
We also use Hausman et al.’s random effects spec-ification, which assumes that overdispersion due tounobserved heterogeneity is randomly distributedacross firms. Because the random effects specificationassumes that the unobserved firm-specific effect isuncorrelated with the regressors, we report the resultsfrom both fixed and random effects as a robustnesscheck.As an additional control for firm-level unobserved
heterogeneity, we adopt the presample informationapproach of Blundell et al. (1995). Blundell et al.(1995) argued that because the main source of unob-served heterogeneity in models of innovation lies inthe different knowledge stocks with which firms entera sample, a variable that approximates the build-upof firm knowledge at the time of entering the sam-ple is a particularly good control for unobserved het-erogeneity. The Presample Patents variable describedabove serves as a control for unobserved differencesin firm knowledge stocks upon their entry into thesample. Blundell et al. (1995) showed that the useof a presample patent entry stock measure virtuallyeliminated persistent serial correlation in their paneldata models. We also include industry dummies inour models to control for unobserved industry effectsthat are not captured by the firm effects.A final estimation issue concerns the appropri-
ate lag structure of the independent variables. Basedon prior research that investigates the relationshipbetween interfirm alliances and innovation (e.g.,Ahuja 2000, Sampson 2004, Stuart 2000), we employalternative lags of our independent variables relativeto our dependent variable. We estimate models usingone-year, two-year, and three-year lags. We do so toexplore the robustness of our findings across alter-native specifications. All models were estimated withLimdep 8.0. The model we estimate takes the gen-eral form provided below (aerospace is the omittedindustry and 1992 is the omitted year). Variables areindexed across firms (i), industry (j), and time (t):
Patentsit+1�2�3�
= f �Clusteringjt�Reachjt�Clustering ∗Reachjt�R&D Alliance %jt�R&D Intensityjt�Centralityit�
Local Efficiencyit�Centralizationjt�Densityjt�
Presample_Patentsit�Automotive�Chemicals�
Computers�Audiovisual�Medical�Petroleum�
Pharmaceuticals�Semiconductors�
approach. We point out that the results we obtained from bothfixed- and random effects specifications are highly consistent (seethe Results section). Studies that have employed both the Hausmanet al. (1984) negative binomial fixed-effects approach and that ofAllison and Waterman (2002) have found very similar results (e.g.,Dee et al. 2005).
Telecommunications�Measuring�1993�1994�1995�
1996�1997��
ResultsA summary of the network size and component struc-ture for each industry, averaged over time, is pro-vided in Table 1. As shown, there is substantialvariation across industries in the number of firmsthat participate in alliances. This is largely due todifferences in industry size. The average number ofalliances per firm within each industry exhibits muchless variation. The next column provides the aver-age number of firms in each network. This numberincludes firms from the industry and their partners,some of which are not in the target industry. The nextcolumn indicates the percentage of nodes in the net-work that are connected to the single largest (“main”)component. This number varies significantly bothacross industry and over time (not shown). Whileresearchers often study only the main component, inour study this would have yielded misleading results.Whereas in some industries there is a large main com-ponent that is relatively stable over time (e.g., phar-maceuticals), in other industries there are multiplelarge components, and those components merge andsplit apart over time. For example, between 1996 and1997 in the computer industry, a large componentbroke away from the main component (see Figure 1).If we had focused only on the single largest compo-nent, we would have both understated the amount of
Table 1 Network Size and Component Structure, Averages over1992–2000
Average number Average Percentof firms from number of Average in mainindustry in alliances network component
Industry alliancesa per firm size (nodes)b (%)
Aerospace 9 3�05 28 46Automotive 15�67 3�43 53�2 37Chemicals 45�17 2�97 199�8 11Computers and 79�67 4�48 347 45office equipment
Household 9 1�5 28�3 10audiovisualequipment
Measuring and 22�67 1�96 48�33 21controlling
Medical equipment 66�17 1�66 172�33 7Petroleum refining 5�3 2�65 24�83 18and products
Pharmaceuticals 218�33 2�54 510 64Semiconductors 58�67 3�51 204 55Telecommunication 44�83 6�53 266�33 54equipment
aThis number includes only those firms with the designated primary SICs;it does not include partners in the network that are not in those SICs.
bIncludes all U.S. firms in the network, including both those with the des-ignated primary SICs and their alters, regardless of SIC.
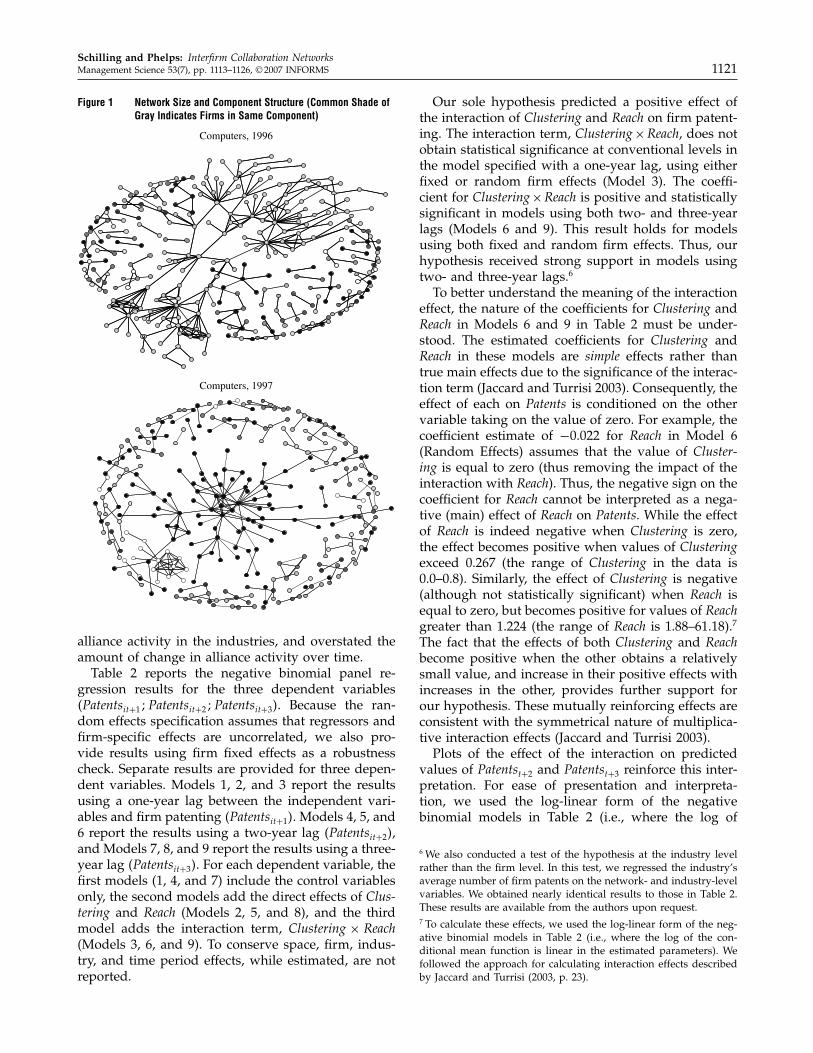
Schilling and Phelps: Interfirm Collaboration NetworksManagement Science 53(7), pp. 1113–1126, © 2007 INFORMS 1121
Figure 1 Network Size and Component Structure (Common Shade ofGray Indicates Firms in Same Component)
Computers, 1996
Computers, 1997
alliance activity in the industries, and overstated theamount of change in alliance activity over time.Table 2 reports the negative binomial panel re-
gression results for the three dependent variables�Patentsit+1!Patentsit+2!Patentsit+3�. Because the ran-dom effects specification assumes that regressors andfirm-specific effects are uncorrelated, we also pro-vide results using firm fixed effects as a robustnesscheck. Separate results are provided for three depen-dent variables. Models 1, 2, and 3 report the resultsusing a one-year lag between the independent vari-ables and firm patenting �Patentsit+1�. Models 4, 5, and6 report the results using a two-year lag �Patentsit+2�,and Models 7, 8, and 9 report the results using a three-year lag �Patentsit+3�. For each dependent variable, thefirst models (1, 4, and 7) include the control variablesonly, the second models add the direct effects of Clus-tering and Reach (Models 2, 5, and 8), and the thirdmodel adds the interaction term, Clustering × Reach(Models 3, 6, and 9). To conserve space, firm, indus-try, and time period effects, while estimated, are notreported.
Our sole hypothesis predicted a positive effect ofthe interaction of Clustering and Reach on firm patent-ing. The interaction term, Clustering×Reach, does notobtain statistical significance at conventional levels inthe model specified with a one-year lag, using eitherfixed or random firm effects (Model 3). The coeffi-cient for Clustering×Reach is positive and statisticallysignificant in models using both two- and three-yearlags (Models 6 and 9). This result holds for modelsusing both fixed and random firm effects. Thus, ourhypothesis received strong support in models usingtwo- and three-year lags.6
To better understand the meaning of the interactioneffect, the nature of the coefficients for Clustering andReach in Models 6 and 9 in Table 2 must be under-stood. The estimated coefficients for Clustering andReach in these models are simple effects rather thantrue main effects due to the significance of the interac-tion term (Jaccard and Turrisi 2003). Consequently, theeffect of each on Patents is conditioned on the othervariable taking on the value of zero. For example, thecoefficient estimate of −0.022 for Reach in Model 6(Random Effects) assumes that the value of Cluster-ing is equal to zero (thus removing the impact of theinteraction with Reach). Thus, the negative sign on thecoefficient for Reach cannot be interpreted as a nega-tive (main) effect of Reach on Patents. While the effectof Reach is indeed negative when Clustering is zero,the effect becomes positive when values of Clusteringexceed 0.267 (the range of Clustering in the data is0.0–0.8). Similarly, the effect of Clustering is negative(although not statistically significant) when Reach isequal to zero, but becomes positive for values of Reachgreater than 1.224 (the range of Reach is 1.88–61.18).7
The fact that the effects of both Clustering and Reachbecome positive when the other obtains a relativelysmall value, and increase in their positive effects withincreases in the other, provides further support forour hypothesis. These mutually reinforcing effects areconsistent with the symmetrical nature of multiplica-tive interaction effects (Jaccard and Turrisi 2003).Plots of the effect of the interaction on predicted
values of Patentst+2 and Patentst+3 reinforce this inter-pretation. For ease of presentation and interpreta-tion, we used the log-linear form of the negativebinomial models in Table 2 (i.e., where the log of
6 We also conducted a test of the hypothesis at the industry levelrather than the firm level. In this test, we regressed the industry’saverage number of firm patents on the network- and industry-levelvariables. We obtained nearly identical results to those in Table 2.These results are available from the authors upon request.7 To calculate these effects, we used the log-linear form of the neg-ative binomial models in Table 2 (i.e., where the log of the con-ditional mean function is linear in the estimated parameters). Wefollowed the approach for calculating interaction effects describedby Jaccard and Turrisi (2003, p. 23).

Schilling and Phelps: Interfirm Collaboration Networks1122 Management Science 53(7), pp. 1113–1126, © 2007 INFORMS
Table 2 Panel Negative Binomial Regression Models with Fixed and Random Effects �N = 1�106; Obs= 3�444�
Patents it+1 Patents it+2 Patents it+3
1 2 3 4 5 6 7 8 9
Fixed effectsConstant 1�136∗∗ �0�354� 0�582 �0�359� 0�604 �0�360� 1�257∗∗ �0�327� 1�663∗∗ �0�333� 1�614∗∗ �0�324� 1�433∗∗ �0�337� 1�859∗∗ �0�369� 1�825∗∗ �0�368�Presample Patents 0�001∗∗ �0�000� 0�001∗∗ �0�000� 0�001∗∗ �0�000� 0�001∗∗ �0�000� 0�001∗∗ �0�000� 0�001∗∗ �0�000� 0�001∗∗ �0�000� 0�001∗∗ �0�000� 0�001∗∗ �0�000�Density −0�248 �1�154� −0�624 �1�358� −0�527 �1�468� −0�411 �1�529� −2�220 �1�808� −2�637 �1�843� −2�012 �1�861� −1�598 �2�509� −1�674 �2�134�Centralization −0�014 �0�008� −0�014 �0�008� −0�012 �0�008� −0�018∗∗ �0�006� −0�016∗ �0�007� −0�035∗∗ �0�006� 0�019∗∗ �0�007� 0�019∗∗ �0�007� 0�019∗ �0�007�Ind. R&D Intensity 2�739 �2�668� 2�867 �2�522� 2�877 �2�581� 0�741 �2�366� −0�088 �2�373� −0�246 �2�327� −7�126∗∗ �2�478� −6�754∗∗ �2�504� −6�754∗∗ �2�504�R&D Alliance % −0�112 �0�275� 0�223 �0�275� 0�222 �0�289� 0�068 �0�217� −0�131 �0�223� −0�188 �0�191� −0�040 �0�248� −0�305 �0�264� −0�312 �0�304�Efficiency −0�199∗∗ �0�068� −0�189∗∗ �0�072� −0�190∗∗ �0�073� −0�303∗∗ �0�091� −0�321∗∗ �0�095� −0�327∗∗ �0�087� −0�267∗∗ �0�097� −0�272∗∗ �0�089� −0�270∗∗ �0�088�Betweenness 0�003 �0�006� 0�003 �0�005� 0�003 �0�005� 0�005 �0�006� 0�004 �0�007� 0�002 �0�006� −0�001 �0�009� −0�001 �0�010� −0�001 �0�010�Clustering 0�420∗∗ �0�136� 0�507∗ �0�235� 0�346∗∗ �0�127� −0�141 �0�196� 0�234 �0�183� −0�319 �0�279�Reach 0�010∗∗ �0�003� 0�011∗∗ �0�003� −0�012∗∗ �0�003� −0�020∗∗ �0�004� −0�007∗ �0�003� −0�009∗ �0�004�Clustering×Reach −0�015 �0�030� 0�081∗∗ �0�023� 0�014∗ �0�007�
Log Likelihood −4�646�65 −4�637�32 −4�637�12 −4�597�46 −4�586�78 −4�577�98 −4�468�75 −4�464�64 4,464.46
Random effectsConstant 1�118∗∗ �0�309� 0�542 �0�339� 0�541 �0�339� 0�984∗∗ �0�307� 1�342∗∗ �0�303� 1�256∗∗ �0�290� 0�920∗∗ �0�296� 1�333∗∗ �0�331� 1�214∗∗ �0�321�Presample Patents 0�001∗∗ �0�000� 0�001∗∗ �0�000� 0�001∗∗ �0�000� 0�001∗∗ �0�000� 0�001∗∗ �0�000� 0�001∗∗ �0�000� 0�001∗∗ �0�000� 0�001∗∗ �0�000� 0�001∗∗ �0�000�Density 1�444 �0�900� 0�250 �1�092� 0�243 �1�166� 0�527 �1�197� −1�872 �1�394� −2�451 �1�352� −1�454 �1�434� −1�286 �1�618� −1�538 �1�654�Centralization −0�021∗∗ �0�006� −0�020∗∗ �0�007� −0�021∗∗ �0�007� −0�021∗∗ �0�006� −0�020∗∗ �0�006� −0�027∗∗ �0�005� 0�016∗ �0�006� 0�017∗ �0�007� 0�013∗ �0�006�Ind. R&D Intensity 0�887 �2�429� 1�030 �2�408� 1�027 �2�424� −0�357 �2�231� −0�818 �2�151� −0�590 �2�135� −8�029∗∗ �2�278� −7�987∗∗ �2�343� −8�101∗∗ �2�460�R&D Alliance % 0�014 �0�230� 0�383 �0�214� 0�384 �0�222� 0�208 �0�215� −0�017 �0�187� −0�090 �0�158� 0�106 �0�220� −0�139 �0�233� −0�153 �0�274�Efficiency −0�342∗∗ �0�062� −0�336∗∗ �0�069� −0�336∗∗ �0�069� −0�396∗∗ �0�079� −0�436∗∗ �0�081� −0�435∗∗ �0�073� −0�297∗∗ �0�087� −0�307∗∗ �0�080� −0�312∗∗ �0�078�Betweenness 0�008 �0�005� 0�007 �0�004� 0�007 �0�005� 0�003 �0�005� 0�004 �0�005� 0�001 �0�005� −0�000 �0�008� −0�001 �0�008� −0�001 �0�008�Clustering 0�554∗∗ �0�106� 0�548∗∗ �0�212� 0�485∗∗ �0�116� −0�101 �0�186� 0�152 �0�159� −0�422 �0�344�Reach 0�008∗∗ �0�003� 0�008∗ �0�003� −0�013∗∗ �0�003� −0�022∗∗ �0�003� −0�008∗ �0�003� −0�011∗∗ �0�004�Clustering×Reach 0�001 �0�028� 0�082∗∗ �0�019� 0�043∗ �0�020�a 0�707∗∗ �0�047� 0�716∗∗ �0�047� 0�710∗∗ �0�048� 0�675∗∗ �0�047� 0�684∗∗ �0�048� 0�690∗∗ �0�480� 0�650∗∗ �0�046� 0�652∗∗ �0�046� 0�652∗∗ �0�046�b 0�358∗∗ �0�021� 0�360∗∗ �0�022� 0�360∗∗ �0�022� 0�321∗∗ �0�019� 0�328∗∗ �0�020� 0�334∗∗ �0�02� 0�291∗∗ �0�018� 0�290∗∗ �0�018� 0�293∗∗ �0�018�
Log likelihood −8�520�70 −8�509�78 −8�509�78 −8�425�33 −8�407�95 −8�392�95 −8�198�66 8,194.98 −8�193�03
Notes. All models include firm, time period, and industry effects. Standard errors are in parentheses.∗p < 0�05, ∗∗p < 0�01 (two-tailed tests for all variables).
the conditional mean function is linear in the esti-mated parameters) to calculate these effects. Figure 2presents the interaction plot of Clustering and Reachto illustrate the magnitude of the interaction effect.The “Low Clustering” line shows the slope of theeffect of Reach on Patents when the value of Cluster-ing is set to one standard deviation below its mean.The end points of the line are calculated at one stan-dard deviation below and above the mean of Reach.The “High Clustering” line represents the effect ofReach on Patents when the value of Clustering is setto one standard deviation above its mean. Consis-tent with the results in Models 6 and 9 of Table 2,increases in Reach increase the positive effect of Clus-tering on Patents. The symmetrical case of plotting lowand high Reach lines for low and high values of Clus-tering (not shown) provides similar results.To assess the magnitude of the interaction effect we
employed the estimated marginal effects �e�X��. Themagnitude of the interaction effect when both compo-nent variables increase one standard deviation abovetheir means for the model employing a two-year lagand random effects is 1.00 patents (or 2.3%). For themodel specified with a two-year lag and employingfirm fixed effects, this yielded an increase of 0.98patents (for the average firm), or 2.3%. The magni-tude of the interaction effect is smaller in the modelsusing a three-year lag. Thus, the size of the interactioneffect in absolute terms is fairly small in our data and
appears to realize its peak within two years. Basedon these results, we speculate that the effect of net-work structure as a medium of knowledge diffusiondecays over time. While a particular structure maypersist over time, the knowledge that diffuses throughit has limited benefit as actors absorb and apply theseknowledge flows to productive ends.The results related to the control variables also
merit discussion. The effect of betweenness centralityon subsequent firm patenting failed to achieve sta-tistical significance in any of the estimated models.In contrast, efficiency had a significant negative effecton firm patenting in all models. This result suggeststhat the presence of structural holes in a firm’s egonetwork of alliance relationships has a deleteriouseffect on its inventive output. This is consistent withresults obtained by Ahuja (2000) and Soh (2003). Toour knowledge, our study represents the largest paneldata investigation of this relationship.Among the other variables in the models, most
were not consistent in terms of sign and significance.This might be due, in part, to the moderate-to-largecorrelations among the network measures (i.e., Cen-tralization, Density, Reach, Clustering, and Clustering×Reach). This multicollinearity might influence therobustness of our main finding because parameterestimates are unstable to very small changes in thedata when substantial collinearity is present, some-times resulting in the signs on estimated coefficients

Schilling and Phelps: Interfirm Collaboration NetworksManagement Science 53(7), pp. 1113–1126, © 2007 INFORMS 1123
Figure 2 Graph of Interactions for Random Effects Models, Patentst+2
and Patentst+3
0
0.2
0.4
0.6
0.8
1.0
1.2
1.4
Low reach High reach
Low reach High reach
Log of conditional mean of Patentst + 2
Log of conditional mean of Patentst + 3
0
0.1
–0.1
0.2
–0.2
0.3
–0.3
High clusteringLow clustering
High clusteringLow clustering
to flip (known as the “wrong sign” problem) (Gujarati1995). To examine the influence of multicollinearityon our main result, we reran each of the models inTable 2 with Centralization removed and, alternatively,with Density removed (not reported here). The resultsfor Reach, Clustering, and Clustering×Reach remainedsubstantively unchanged across all models.Finally, the Presample Patents variable was positive
and significant in all models, indicating its importanceas a control for firm-level unobserved heterogeneity.Furthermore, several time period and industry dum-mies (not reported) were consistently significant in allmodels.
Robustness of ResultsOne concern regarding our results is that we were notable to control for differences in firm R&D becausenearly 42% of our sample firms were privately owned
during some portion of the sample. Prior research hasfound that patent stock measures and annual R&Dexpenditures are highly correlated (e.g., Trajtenberg1990). We measured a firm’s patent stock as the totalnumber of patents obtained by firm i in the four yearsprior to and including year t. Due to the extremelyhigh correlation between this variable and PresamplePatents �r = 0�94�, we reestimated all of our modelsusing the time-varying patent stock variable in placeof Presample Patents. As might be expected (due to thesubstantial correlation between the two variables) ourresults (not reported) did not substantively changefrom those reported in Table 2.For our second robustness check, we analyzed the
data using a Poisson fixed-effects estimation proce-dure. We did so to address the concern identifiedin Footnote 5. This approach controls for all unob-served time-invariant sources of heterogeneity. In thisanalysis, we excluded all time-invariant variables andobtained qualitatively similar results (not reported) tothose presented in Table 2.A third concern regarding our results is that they
may be influenced by the presence of persistent serialcorrelation in the residuals. This could result fromtemporally stable unobserved firm effects (Greene1997), or from reverse causality running from firminvention to industry-level network structure (e.g.,clustering or reach), manifesting in the lagged net-work variables. We explicitly address the first poten-tial source of serial correlation by including firm fixedeffects. Unreliable estimates may also result fromunobservables that vary systematically over time. Se-rial correlation in the errors would persist even aftercontrolling for stable firm effects. We examined thispossibility in two ways. First, we regressed our mea-sures of clustering and reach, and their interaction onannual firm patent counts using a linear panel datamodel. We did so using contemporaneously measuredfirm patents and one-, two-, and three-year lags offirm patents. We found no significant relationshipbetween firm patents and clustering, reach, or theirinteraction in any of these models. Next, we aggre-gated firm patents to the industry level using theaverage annual patent count across firms in the indus-try. The idea here is that as industry inventivenessincreases, so does the likelihood that firms in suchindustries form alliance networks with high cluster-ing and reach. We ran the same specifications as thoseusing firm patents and found no significant effects.
DiscussionWe argued that two key structural properties of large-scale networks, clustering and reach, play impor-tant roles in network diffusion and search. Clusteringenables even a globally sparse network to achieve high
Schilling and Phelps: Interfirm Collaboration Networks1124 Management Science 53(7), pp. 1113–1126, © 2007 INFORMS
information transmission capacity through locallydense pockets of closely connected firms. Reach in-creases the quantity and diversity of informationavailable to firms in the network by bringing theinformation resources of more firms within rela-tively close range. We thus argued that networks thathave both the high information transmission capac-ity enabled by clustering, and the high quantity anddiversity of information provided by reach, shouldfacilitate greater innovation by firms that are mem-bers of the network. We tested this argument usinglongitudinal data on the innovative performance ofa large panel of firms operating in 11 industry-level alliance networks. The results indicated sup-port for our argument: the combination of cluster-ing and reach was associated with significantly higherfirm patenting. The results were stronger for modelsemploying a two- and three-year lag versus a one-year lag, suggesting that firms do not quickly realizethe innovation benefits of collaboration (Stuart 2000).These results were robust to a number of controls andmodel specifications.Our results support much of the theory developed
in recent work on small-world networks (Cowan andJonard 2003, Uzzi and Spiro 2005). Our results areconsistent with Uzzi and Spiro’s argument that thecohesion and connectivity of a small-world networkenable the circulation of creative material that canbe recombined into new creative products. Our argu-ment that the heterogeneity of knowledge distributedacross clusters enhances innovation is similar to Uzziand Spiro’s argument that the different conventionsand styles used in different clusters are a valuablesource of diversity in the network.8
8 Uzzi and Spiro’s data and analysis are different from ours in someimportant ways. First, as they point out (2005, p. 470, Footnote 8),in a mature small-world network such as theirs, the path lengthchanges little over time, behaving like a fixed effect with a con-stant value near one. This means that that their principle findingis driven primarily by temporal variation in clustering. Our net-works, by contrast, exhibit significant cross-sectional and temporalvariation in path length and network size, leading to great vari-ation in our measure of reach. Second, our networks are far lessdense than their network. Their network becomes sufficiently denseand clustered that it leads to excessive cohesion and homogeniza-tion of material, and a decline in creative performance. In essence,such a globally dense network has the advantages and disadvan-tages we argued would exist within each cluster. To investigate thiseffect in our data, we reestimated each of our models, replacingour interaction term with the quadratic version of clustering (i.e.,clustering2�. This variable was not significant in any model; thus,we have no evidence of a parabolic effect of clustering in our data.We speculate that our networks never reach a high level of den-sity, and thus are at less risk of excessive cohesion. Finally, andperhaps most importantly, Uzzi and Spiro’s network is composedof individuals, whereas our networks are composed of firms. Someof the dynamics that lead to deleterious effects of cohesion (forexample, strong feelings of obligation between friends leading to
This research has a number of contributions. First,whereas previous alliance network research has exam-ined the impact of a firm’s network position orthe structure of its immediate network neighborhoodon firm innovation, our study is the first that weknow of to examine the influence of the structure ofindustry-level alliance networks on firm innovation.The results of this study also inform the debate overwhether innovation is enhanced by network densityor efficiency (see Ahuja 2000): Both local density andglobal efficiency can exist simultaneously, and it is thiscombination that enhances innovation.Finally, our results speak to the literature on knowl-
edge spillovers. Knowledge spillovers represent anexternality in which the knowledge produced by onefirm can be appropriated, at little cost, by otherfirms (Jaffe 1986). Empirical evidence indicates thatspillovers are important in explaining innovationand productivity growth (Griliches 1992). However,spillovers are not equally accessible to or appro-priable by all firms. Prior research has shown thatspillovers tend to be spatially bounded: Their effectis more pronounced for firms conducting research insimilar technological domains (Jaffe 1986) and geo-graphic locations (Feldman 1999). Our results addto this literature by suggesting that interfirm net-works may be an important mechanism of knowledgespillovers, and that the specific pattern these relation-ships exhibit can have important consequences for theinnovativeness of networked firms.We do not wish to overstate our results—this study
has a number of limitations. Our findings may beinfluenced by our assumption of average allianceduration. If alliances endure, on average, for morethan three years, then the connectivity of our ob-served networks will be biased downward. This biasmay influence our results. Unfortunately, due to datalimitations, we were unable to explore this possibil-ity.9 A limitation of our theoretical focus is that weignore the influence of network characteristics otherthan structure. We do not address the properties of thealliances themselves (e.g., strength, governance struc-ture, scope). Different types of relationships may bebetter or worse for searching for, versus transferring,knowledge (Hansen 1999). In addition, different typesof relationships will be more or less costly to main-tain, and thus affect the efficiency of network struc-ture for knowledge creation. We do not examine how
an “assistance club” for ineffectual members of the network) are farmore likely in the relationships between individuals than betweenfirms.9 We did not collect alliance formation data prior to 1990 becauseSDC data prior to that time is inconsistent. We chose to end obser-vations of patents in 2000 (implying our alliance observation endedin 1997) because the lag between patent application and grantdate is two to four years (which was toward the end of our datacollection).

Schilling and Phelps: Interfirm Collaboration NetworksManagement Science 53(7), pp. 1113–1126, © 2007 INFORMS 1125
the attributes of the firms shape the flow of knowl-edge (see Owen-Smith and Powell 2004). We havealso not addressed the potential impact of the natureof knowledge that is being accessed, transferred, andrecombined in the network. Different characteristicsof knowledge (e.g., tacit versus explicit, complex ver-sus simple, etc.) can influence the knowledge creationand innovation process (Zander and Kogut 1995).Network structure may also differentially interactwith different dimensions of knowledge. For example,the high density of clusters may facilitate the searchand transfer of tacit, complex knowledge, but the rel-atively few connections to other clusters may makesuch search and transfer problematic. These aspects ofrelationships and knowledge will likely be importantin fully understanding the relationship between inter-firm knowledge networks and knowledge creation,but are beyond the scope of our paper.Another limitation of our work is that the gen-
eralizability of our main result is likely to be lim-ited to industries that make frequent use of alliances.Networks characterized by extreme sparsity may nothave a sufficient degree of connectedness to observeclustering or meaningful reach. However, the impli-cations of our results are not necessarily limited toalliance relationships. Because firms are connectedvia other relationships, the global structure of suchrelationships may influence firm innovativeness. Forexample, firms are often connected by interpersonalcollaborative relationships among individual inven-tors. The extent to which the global structure of theserelationships is characterized by clustering and reachmay have implications for the inventiveness of indi-vidual inventors and their firms (Fleming et al. 2004).Furthermore, because knowledge can flow betweenfirms through other mechanisms such as individualmobility, geographic clustering, participation in tech-nical committees, or learning from information madepublic through patenting, it is possible that someof the knowledge creation advantages of a partic-ular alliance network structure might spill over toother industry (or nonindustry) participants. Each ofthese limitations represents an exciting area for futureresearch.
AcknowledgmentsThis research was supported by the National Science Foun-dation under Grant SES-0234075. The authors are gratefulfor the suggestions of Juan Alcácer, Laszlo Barabasi, JoelBaum, Bill Greene, Anne Marie Knott, Dan Levinthal, BillMcKelvey, Mark Newman, Joe Porac, Lori Rosenkopf, RobSalomon, Kevin Steensma, Kate Stovel, and Duncan Watts.
ReferencesAhuja, G. 2000. Collaboration networks, structural holes, and inno-
vation: A longitudinal study. Admin. Sci. Quart. 45 425–455.Allison, P. D., R. Waterman. 2002. Fixed-effects negative binomial
regression models. Soc. Methodology 32 247–265.
Anand, B. N., T. Khanna. 2000. Do firms learn to create value? Thecase of alliances. Strategic Management J. 21 295–315.
Basberg, B. L. 1987. Patents and the measurement of technologicalchange: A survey of the literature. Res. Policy 16 131–141.
Baum, J. A. C., T. Calabrese, B. S. Silverman. 2000. Don’t go it alone:Alliance network composition and startups’ performance inCanadian biotechnology. Strategic Management J. 21 267–294.
Baum, J. A. C., A. V. Shipilov, T. J. Rowley. 2003. Where do smallworlds come from? Indust. Corporate Change 12 697–725.
Blundell, R. R., R. Griffith, J. Van Reenen. 1995. Dynamic count datamodels of technological innovation. Econom. J. 105 333–344.
Borgatti, S. P., M. G. Everett, L. C. Freeman. 2002. Ucinet for Win-dows: Software for social network analysis. Harvard, AnalyticTechnologies.
Brown, J., P. Duguid. 1991. Organizational learning and communi-ties of practice: Towards a unified view of working, learningand innovation. Organ. Sci. 2 40–57.
Burt, R. S. 1992. Structural Holes. Harvard University Press,Cambridge, MA.
Burt, R. S. 2001. Bandwidth and echo: Trust, information, and gos-sip in social networks. A. Casella, J. E. Rauch, eds. Networksand Markets: Contributions from Economics and Sociology. RusselSage Foundation, New York, 30–74.
Cameron, A. C., P. K. Trivedi. 1986. Econometric models based oncount data: Comparisons and applications of some estimatorsand tests. J. Appl. Econometrics 1 29–53.
Cameron, A. C., P. K. Trivedi. 1998. Regression Analysis of CountData. Cambridge University Press, Cambridge, UK.
Coleman, J. S. 1988. Social capital in the creation of human capital.Amer. J. Sociol. 94 S95–S120.
Cowan, R., N. Jonard. 2003. The dynamics of collective invention.J. Econom. Behav. Organ. 52 513–532.
Dee, T. S., D. C. Grabowski, M. A. Morrisey. 2005. Graduated driverlicensing and teen traffic fatalities. J. Health Econom. 24 571–589.
Deeds, D. L., C. W. L. Hill. 1996. Strategic alliances and therate of new product development: An empirical study ofentrepreneurial firms. J. Bus. Venturing 11 41–55.
Dosi, G. 1988. Sources, procedures, and microeconomic effects ofinnovation. J. Econom. Literature 26 1120–1171.
Dyer, J. H., H. Singh. 1998. The relational view: Cooperative strat-egy and sources of interorganizational competitive advantage.Acad. Management Rev. 23 660–679.
Feldman, M. P. 1999. The new economics of innovation, spillovers,and agglomeration: A review of empirical studies. Econom.Innovation New Tech. 8 5–25.
Fleming, L. 2001. Recombinant uncertainty in technological search.Management Sci. 47 117–132.
Fleming, L., A. Juda, C. King, III. 2004. Small worlds and re-gional innovative advantage. Harvard Business School Work-ing Paper Series, 04-008, Harvard University, Cambridge, MA.
Freeman, C. 1991. Networks of innovators: A synthesis of researchissues. Res. Policy 20 499–514.
Freeman, L. 1979. A set of measures of centrality: I. Conceptualclarification. Soc. Networks 1 215–239.
Gomes-Casseres, B., J. Hagedoorn, A. Jaffe. 2006. Do alliances pro-mote knowledge flows? J. Financial Econom. 80 5–33.
Granovetter, M. S. 1973. The strength of weak ties. Amer. J. Sociol.78 1360–1380.
Granovetter, M. S. 1992. Problems of explanation in economic soci-ology. N. Nohria, R. Eccles, eds. Networks and Organizations:Structure, Form, and Action. Harvard Business School Press,Boston, MA, 25–56.
Greene, W. H. 1997. Econometric Analysis, 3rd ed. Prentice Hall,Upper Saddle River, NJ.

Schilling and Phelps: Interfirm Collaboration Networks1126 Management Science 53(7), pp. 1113–1126, © 2007 INFORMS
Griliches, Z. 1990. Patent statistics as economic indicators: A survey.J. Econom. Literature 28 1661–1707.
Griliches, Z. 1992. The search for R&D spillovers. Scandinavian J.Econom. 94(Suppl.) 29–47.
Gujarati, D. N. 1995. Basic Econometrics, 3rd ed. McGraw-Hill, NewYork.
Gulati, R. 1998. Alliances and networks. Strategic Management J. 19293–317.
Gulati, R., M. Gargiulo. 1999. Where do interorganizational net-works come from? Amer. J. Sociol. 104 1439–1493.
Hansen, M. T. 1999. The search-transfer problem: The role of weakties in sharing knowledge across organization subunits. Admin.Sci. Quart. 44 82–111.
Hansen, M. T. 2002. Knowledge networks: Explaining effectiveknowledge sharing in multiunit companies. Organ. Sci. 13232–250.
Hargadon, A. B. 1998. Firms as knowledge brokers: Lessons in pur-suing continuous innovation. California Management Rev. 40(3)209–227.
Hargadon, A. B., A. Fanelli. 2002. Action and possibility: Recon-ciling dual perspectives of knowledge in organizations. Organ.Sci. 13 290–302.
Hausman, J., B. Hall, Z. Griliches. 1984. Econometric models forcount data with an application to the patents-R&D relation-ship. Econometrica 52 909–938.
Hecker, D. 1999. High technology employment: A broader view.Monthly Labor Rev. 122(6) 18–28.
Heckman, J. J. 1979. Sample selection bias as a specification error.Econometrica 47(1) 153–161.
Henderson, R., K. Clark. 1990. Architectural innovation: The recon-figuration of existing product technologies and the failure ofestablished firms. Admin. Sci. Quart. 35 9–30.
Jaccard, J., R. Turrisi. 2003. Interaction Effects in Multiple Regression.Sage, Thousand Oaks, CA.
Jaffe, A. 1986. Technological opportunity and spillovers of R&D:Evidence from firms’ patents, profits and market value. Amer.Econom. Rev. 76 984–1001.
Kogut, B. 2000. The network as knowledge. Generative rules andthe emergence of structure. Strategic Management J. 21 405–425.
Kogut, B., G. Walker. 2001. The small world of Germany and thedurability of national networks. Amer. Sociol. Rev. 66 317–335.
Laumann, E. O, P. V. Marsden, D. Prensky. 1983. The boundaryspecification problem in network analysis. R. S. Burt, M. J.Minor, eds. Applied Network Analysis. Sage, Beverly Hills, CA,18–34.
Levin, R., A. Klevorick, R. Nelson, S. Winter. 1987. Appropriatingthe returns from industrial research and development. Brook-ings Papers Econom. Activity, Microeconomics 3 783–820.
Mowery, D. C., J. E. Oxley, B. S. Silverman. 1996. Strategic alliancesand interfirm knowledge transfer. Strategic Management J. 1777–91.
Nelson, R. R., S. Winter. 1982. An Evolutionary Theory of EconomicChange. Harvard University Press, Cambridge, MA.
Newman, M. E. J., S. H. Strogatz, D. J. Watts. 2002. Randomgraph models of social networks. Proc. Natl. Acad. Sci. USA 992566–2572.
Owen-Smith, J., W. W. Powell. 2004. Knowledge networks as chan-nels and conduits: The effects of spillovers in the Bostonbiotechnology community. Organ. Sci. 15 5–21.
Phelps, C. 2003. Technological exploration: A longitudinal studyof the role of recombinatory search and social capital in
alliance networks. Unpublished dissertation, New York Uni-versity, New York.
Powell, W. W., L. Smith-Doerr. 1994. Networks and economic life.N. J. Smelser, R. Swedberg, eds. The Handbook of Economic Soci-ology. Princeton University Press, Princeton, NJ, 368–402.
Powell, W. W., K. W. Koput, L. Smith-Doerr. 1996. Interorganiza-tional collaboration and the locus of innovation: Networks oflearning in biotechnology. Admin. Sci. Quart. 41 116–145.
Robinson, D. T., T. E. Stuart. 2007. Network effects in the gov-ernance of strategic alliances. J. Law, Econom., Organ. 23(1)242–273.
Rosenkopf, L., P. Almeida. 2003. Overcoming local search throughalliances and mobility. Management Sci. 49 751–766.
Rosenkopf, L., A. Metiu, V. P. George. 2001. From the bottom up?Technical committee activity and alliance formation. Admin.Sci. Quart. 46 748–772.
Sampson, R. 2004. The cost of misaligned governance in R&Dalliances. J. Law, Econom., Organ. 20 484–526.
Schmookler, J. 1966. Invention and Economic Growth. Harvard Uni-versity Press, Cambridge, MA.
Shan, W., G. Walker, B. Kogut. 1994. Interfirm cooperation andstartup innovation in the biotechnology industry. StrategicManagement J. 15 387–394.
Smith-Doerr, L., J. Owen-Smith, K. W. Koput, W. W. Powell. 1999.Networks and knowledge production: Collaboration and pat-enting in biotechnology. R. Leenders, S. Gabbay, eds. Corpo-rate Social Capital. Kluwer Academic Publishers, Norwell, MA,331–350.
Soh, P.-H. 2003. The role of networking alliances in informationacquisition and its implication for new product performance.J. Bus. Venturing 18 727–744.
Stuart, T. E. 2000. Interorganizational alliances and the performanceof firms: A study of growth and innovation rates in a hightechnology industry. Strategic Management J. 21 791–812.
Trajtenberg, M. 1987. Patents, citations, and innovations: Tracingthe links. Working Paper 2457, National Bureau of EconomicResearch, Cambridge, MA.
Trajtenberg, M. 1990. A penny for your quotes: Patent citations andthe value of innovations. RAND J. Econom. 21 172–187.
Uzzi, B. 1997. Social structure and competition in interfirm net-works: The paradox of embeddedness. Admin. Sci. Quart. 4235–67.
Uzzi, B., J. Spiro. 2005. Collaboration and creativity: The smallworld problem. Amer. J. Sociol. 111 447–504.
Vonortas, N. S. 1997. Research joint ventures in the US. Res. Policy26 577–595.
Wasserman, S., K. Faust. 1994. Social Network Analysis: Methods andApplications. Cambridge University Press, Cambridge, UK.
Watts, D. J. 1999. Networks, dynamics, and the small-world phe-nomenon. Amer. J. Sociol. 105 493–528.
Wellman, B. 1988. Structural analysis: From method and metaphorto theory and substance. B. Wellman, S. D. Berkowitz, eds.Social Structures: A Network Approach. Cambridge UniversityPress, Cambridge, UK, 19–61.
Yamaguchi, K. 1994. The flow of information through social net-works: Diagonal-free measures of inefficiency and the struc-tural determinants of inefficiency. Soc. Networks 16 57–86.
Zander, U., B. Kogut. 1995. Knowledge and the speed of the transferand imitation of organizational capabilities: An empirical test.Organ. Sci. 6 76–92.

PREFERENTIAL LINKAGE AND NETWORK EVOLUTION:A CONCEPTUAL MODEL AND EMPIRICAL TEST IN THE U.S.
VIDEO GAME SECTOR
N. VENKATRAMANCHI-HYON LEE
Boston University
We examined how network structure (density overlap and embeddedness) and tech-nology characteristics of a platform (dominance and newness) shaped interorganiza-tional coordination of product launches in the U.S. video game industry. We found thatthe developers’ choices to launch games for particular game consoles were signifi-cantly explained by these four factors using multiprobability regression on a primarydata set of 2,815 launches between 1995 and 2002. This analysis was complementedwith application of a network visualization technique.
During the last two decades, there has been amarked increase in research attention to interor-ganizational relationships that reflect organiza-tional economics and sociological perspectives.Empirical studies have focused on motives for theformation and governance of these relationships indifferent settings (e.g., Gulati, 1995) and on thebenefits of such relationships (e.g., Ahuja, 2000).These studies have led to strong calls for recogni-tion of a relational view of strategy in which “[a]firm’s critical resources may span firm boundariesand may be embedded in interfirm routines andprocesses” (Dyer & Singh, 1998: 681). Further,scholars have called for increased efforts to under-stand management choices and actions taking anetwork perspective that includes a focus on afirm’s set of relationships with suppliers, buyers,and “complementors,” or other firms providing co-ordinating products (Gulati, Nohria, & Zaheer,2000; Katz & Shapiro, 1994).
Most studies with a network perspective have
focused on vertical relationships involving buyersand/or suppliers along the value chain. Researchershave invoked transaction cost economics (William-son, 1991) to test predictions about the formationand governance of interorganizational vertical rela-tionships (e.g., Heide, 1994; Subramani & Venkatra-man, 2003). Few studies have, however, focused onrelationships involving two companies who func-tion as complementors by providing coordinatedproducts that jointly appeal to end customers(Baldwin & Clark, 2000; Garud, Kumaraswamy, &Langlois, 2003). This type of relationship is partic-ularly important in high-technology settings, wherea particular standard may fail to become dominantbecause support from a complementor network isinadequate (Katz & Shapiro, 1994; Schilling, 2003).IBM personal computers became dominant in the1980s via the support of third-party developers ofcompatible software, and the dominance of Mi-crosoft’s Windows platform is largely due to sup-port from complementary software developers(Bresnahan & Greenstein, 1999; McKenzie, 2000).
Understanding the network of complementor rela-tionships is important for several reasons. First, theserelationships confer resources critical to the successof many contemporary high-technology ecosystemscomprising coordinated products such as hardwareand software, video game consoles and games, mobilephones and applications, and so on (Frels, Shervani,& Shrivastava, 2003; Shapiro & Varian, 1998). Sec-ond, the relationships between complementors in-volve coordinated product launches and mutual de-pendency for success but no typical mechanisms oflong-term contracts or equity investments (Gawer &Cusumano, 2002). Three, these relationships provideinsights into the path-dependency of technologicalevolution (Arthur, Durlauf, & Lane, 1997).
We thank the Boston University School of Manage-ment’s Institute for Leading in a Dynamic Economy(BUILDE) for providing support for completion of thisstudy. Discussions with Bala Iyer helped sharpen someof the ideas presented here. Byunggon Yoo assisted indata collection. Early versions of this research were pre-sented at seminars at the New York University SternSchool of Management, the University of Minnesota Carl-son School of Management, the London Business School,an Academy of Management symposium, Seattle, and theMarshall School of Management at the University ofSouthern California. Joe Galaskiewicz, Akbar Zaheer,and the AMJ reviewers provided valuable suggestions forrestructuring and repositioning the paper. PersephoneDoliner provided invaluable editorial support in devel-oping the manuscript. All limitations are our own.
� Academy of Management Journal2004, Vol. 47, No. 6, 876–892.
876

Our study is distinctive in the following ways:we focused on the dynamic network of relation-ships between the manufacturers of video gameconsoles (also termed “video game platforms”) andvideo game developers over an eight-year period. Inparticular, we sought to explain video game devel-opers’ decisions to launch new games for specificplatforms on the basis of the characteristics, at thetime of each decision, of the network structure andspecific platform features. These decisions affectthe success of both the developers and theircomplementors, namely the platform manufactur-ers, since their success is interdependent. Our ap-proach to explaining developers’ decisions to linkto different platforms recognizes the time-varyingnature of network structure and platform character-istics. These decisions collectively drive the evolu-tion of the network (for an analogous approach inthe context of choices of friends over time, see Vande Bunt, Van Duijn & Snijders, 1999).
Our study is an effort to understand how “net-works evolve and change over time” (Nohria, 1992:15) in the U.S. video game sector. Thus, our work isin the spirit of recent attempts to discern logics ofnetwork evolution; for example, Baum, Shipilov,and Rowley (2003) focused on how “small worldstructures” emerge and evolve over time by testingscenarios for the formation of ties in investmentbank syndicate networks in Canada; and Powell,White, Koput, and Owen-Smith (2004) modeled theevolution of the biotechnology field in terms ofhow multiple actors—commercial entities, univer-sities, research institutes, venture capitalists, andsmall start-ups—interacted over time.
PREFERENTIAL LINKS IN NETWORKFORMATION
What explains a developer’s decision to launch anew game title for a particular platform at a giventime? We recognize the inherent competition for linksamong developers striving to dynamically balancetheir sets of links across their sets of platforms. Gamedevelopers reveal their relationship intent with everygame launch: they can magnify the importance of aplatform by making the game exclusive on it; they can“port” a game from one platform to another and re-duce the differentiation between them. Moreover,game developers constantly strive to have their gameson the most popular platform while seeking to avoidhighly competitive segments in which their gamesmay not be differentiated and platforms that may beat the declining stage of the technology life cycle.Thus, the launch of new titles reveals developer in-tentions that influence the nature of relationshipswith platform manufacturers.
We derive our hypotheses on preferential linksby integrating various theoretical strands from pop-ulation ecology, social network theory, and techno-logical evolution. Two hypotheses deal with macronetwork structure, namely, how a platform’s “den-sity overlap” and “embeddedness” with developersinfluence platform choice. The other two address aplatform’s intrinsic characteristics, namely, itsmarket dominance and newness. The strength ofour model is its integrated focus on a broader set ofcharacteristics as influences on a firm’s choiceabout network links.
Density Overlap between Platforms as anInfluence on Preferential Linkage
Within population ecology, the density depen-dence model focuses on the dynamics of competi-tion (organizations undermining each other’s fates)and mutualism (organizations enhancing each oth-er’s fates) to explain evolution (Baum & Singh,1994: 347). More specifically, density overlap—ordomain similarity, in the terminology of Van deVen (1976)—which refers to overlap in the resourcepositions of sets of organizations, recognizes thatcompetition exists within networks (Baker,Faulkner, & Fisher, 1998). Baum and Singh elabo-rated on this idea: “The potential competition ex-perienced by an organization in organizationalniche i due to the presence of an organization inorganization niche j, is measured by the . . . overlapbetween organizational niches i and j” (1994: 351).In other words, when organizations occupy thesame niche or overlapping niches, there is a highpotential for competition for the underlying re-sources. Consider Baum and Singh’s (1994) studyof day care centers. The key resource that thesebusinesses compete over is children of various agegroups or segments. One class of day care centersmay only enroll infants, while another class mayonly enroll toddlers. The niche of the former daycare center is infants, while the niche of the latter istoddlers. There is no overlap between these twoniches and hence no competition between the daycare centers—the intersection of the organizationalcapabilities is null. Now consider a third centerthat enrolls both toddlers and infants. The resultingniche of this business (toddlers and infants) over-laps with the niches of both of the aforementionedbusinesses and hence competes with both of them.
We consider density overlap as our first explana-tion because console manufacturers compete forvideo game developers to release titles for theirspecific platforms. A platform’s niche thus consists ofthe set of developers and the titles that they havereleased for the platform. This conceptualization of a
2004 877Venkatraman and Lee

niche is akin to that of Podolny and Stuart (1995),who defined technological niche at the level of theindividual innovation and included “the identities ofthe actors associated with the focal innovation andthe innovations to which the focal innovation is con-nected” (1995: 1226). In our conceptualization, gamesand platforms are the linked innovations. Game de-velopers, however, often do not exclusively releasetitles to a platform. In fact, a developer’s set of re-sources may be spread across multiple platforms.Two platform niches may overlap because a devel-oper may release titles for two or more consoles.
For example, consider the case of two platformsand three developers. The niche of platform A isthe set of values (1, 0.5, 0.75), and the niche ofplatform B is the set (0, 0.5, 0.25). Developer 1releases titles exclusively to platform A; developer2 releases half its titles to platform A and half to B;and developer 3 releases 75 percent of its titles toplatform A. The potential for competition betweenthe two platforms is manifest. Platform A is clearlymore crowded (that is, 1 � 0.5 � 0.75� 2.25) thanplatform B (0 � 0.5 � 0.25 �0.75). When viewedfrom the perspective of a game developer assessingalternative niches defined by different consoles(different platforms), niche crowding, which existswhen many other developers have launched titlesfor a console, is less favorable. More importantly, ahigh degree of overlap between two consoles sug-gests more developers that support both consoles. Ifone platform begins to attract more developers, theremaining developers can switch, shifting their ti-tle releases, further intensifying competition.
On the one hand, density overlap has been shownto influence organizational mortality at both popula-tion and segment or niche levels (Baum & Singh,1994). On the other hand, high levels of niche crowd-ing have been shown to increase competition and therate of innovation for organizations that choose toremain and compete (Stuart, 1999). Stuart found thatsuch organizations’ rates of research and develop-ment investments increase. However, Greve (2000)found strong empirical support for the influence ofdensity overlap on market entry choices in Tokyobanking. Our expectation was that density overlapwould be a significant explanatory variable for pref-erential linkage in the context of new network ties: ifa developer finds itself with considerable domainsimilarity to other developers vying for attention on agiven platform, the developer will most likely avoidlaunching another game title in this highly crowdedand competitive console niche. The developer willdo so because of a sense that its games will not beseen as special or differentiated in such cases by endconsumers.
We expected that developers selecting platforms
to link with at a given time will more likely selectthose with lower density overlap. A platformwhose position is structurally similar to anotherplatform’s position—in that they draw on overlap-ping sets of complementors as key resources—willbe at a disadvantage for attracting new game titles.Thus, we expected:
Hypothesis 1. Ceteris paribus, a video gamedeveloper is less likely to link with a techno-logical platform that has high network overlapdensity at the time of the developer’s linkingdecision.
Platform Embeddedness as a Driver ofPreferential Linkage
It is generally accepted that organizational actionsare embedded in networks of relationships(Granovetter, 1985, Gulati & Gargiulo, 1999; Powell etal., 2004). Detailed case studies and empirical re-search support this view. Elaborating on the generalconcept of embeddedness, Uzzi (1996) focused onstructural embeddedness. Using the profile of input-output between manufacturers and contractors invertical relationships to construct his index of sec-ond-order coupling, he showed that structural em-beddedness impacted mortality in the apparel indus-try. Designing and launching video games is based onformal and informal agreements between consolemanufacturers and game developers. The coordina-tion of product launches is a distinguishing charac-teristic of competition and success in high-tech set-tings (Arthur, 1989; Shapiro & Varian, 1999). Theseare not atomistic market-based transactions butrather, reflections of prior ties and patterns of embed-dedness (Arthur et al., 1997). Further, as Marsdennoted: “Embeddedness refers to the fact that ex-changes within a group . . . have an ongoing socialstructure [that operates] by constraining the set ofactions available to the individual actors and bychanging the dispositions of those actors toward theactions they may take” (1981: 1210).
In our setting, embeddedness is manifestedthrough the pattern of distribution of titles offeredby the different developers for the different plat-forms. Thus, in the terminology of Uzzi (1996), aplatform is tightly coupled when its set of videogames is offered by a small number of developers.This situation also implies that the platform is notwidely supported by the video game developercommunity. Uzzi (1997) further noted that highembeddedness could paradoxically reduce anorganization’s ability to adapt to new requirements.In an industry characterized by frequent technolog-ical changes (Brown & Eisenhardt, 1997), high plat-
878 DecemberAcademy of Management Journal

form embeddedness may be a liability, as both aconsole manufacturer and its set of developers maybe locked into their current offerings and may notrecognize the need for the consoles to adapt tochanging requirements. Thus, tightly coupled plat-forms appear unattractive to new developers, whomay seek more central positions with platformsthat are loosely coupled. Thus:
Hypothesis 2. Ceteris paribus, a video gamedeveloper is less likely to link with a techno-logical platform that has high platform embed-dedness at the time of the developer’s decision.
Platform Dominance as a Driver of Linkage
We now move from macro network attributes to afocus on characteristics of platforms. Our third ex-planation is based on the relative market positionsof platforms within the network of video game de-velopers and game console producers. Our expec-tation is that developers will be attracted to theplatform that is dominant at a given point in time.There is extensive support for the argument thatmarket dominance creates strong positive feedback,giving rise to increasing returns to scale (Arthur,1989). As Katz and Shapiro wrote, “Once a certainsystem is chosen, switching suppliers is costly be-cause new relation-specific investments have to bemade. In such a situation, systems that are expectedto be popular—and thus have widely availablecomponents—will be more popular for that veryreason” (1994: 94). Thus, the dominant platformattracts more complementors.
Organization theorists have also supported thenotion that companies are attracted to the domi-nant (or more central) actor in networks for reasonsof legitimacy and stability (Oliver, 1990), whichreduce market uncertainty. Such an attraction leadsto the creation of “hubs” in large networks (Albert& Barabasi, 2002), because new links appear to bedriven by the number of previous links to a node.This process gives credence to the concept of the“fit get rich,” whereby the fittest (most dominant)node “will inevitably grow to become the biggesthub” (Barabasi, 2002: 103). This concept is consis-tent with the view that positive feedback occurs innetworked settings (Arthur, 1989).
Platform dominance through positive feedbackeffects in networks is also at the center of the recentU.S. Department of Justice case against Microsoft.Most witnesses for the government argued that Mi-crosoft enjoyed an advantage owing to the strengthof complements available for the Windows plat-form. The testimony at the Microsoft trial by JohnSoyring, director of network computing of IBM, istypical of the arguments:
Microsoft. . . has benefited from a . . . cycle that alsotends to be self-perpetuating in the absence of someindustry advance that undermines it. The large in-stalled base of Windows has encouraged ISVs [inde-pendent software vendors] to develop a large num-ber of applications for Windows, which has led toincreased demand for Windows. This, in turn, hasfurther increased the incentive for ISVs to developapplications for Windows. In fact, users, ISVs, andPC suppliers—recognizing the opportunity offeredby Windows’ large installed base—know that themost popular applications will be written for Win-dows. In fact, given the relative size of the Windowsinstalled base, no PC application can achieve widedistribution—that is, be a “best seller”—that is notoffered on Windows.1
The preliminary legal “findings of fact” upheldthe view that Microsoft enjoyed high barriers to entry(McKenzie, 2000) because a given independent soft-ware developer would be disinclined to write appli-cations for any platform other than Windows.
Thus, the dominant platform at any given timewill preferentially attract new links with existingand new game developers. Developers are attractedto the dominant platform because it offers the big-gest potential market for their new games. More-over, by choosing to link with the dominant plat-form, the developers also minimize uncertaintyabout the future viability of other platforms, espe-cially under conditions in which the dominantplatform may enjoy increasing returns and positivefeedback effects (Shapiro & Varian, 1998). Thus:
Hypothesis 3. Ceteris paribus, a video gamedeveloper is more likely to link with a techno-logical platform that has a dominant marketposition.
Platform Age as a Driver of Linkage
Our fourth assertion, which concerns platformage, is a counterbalance to the platform dominanceargument made above. One way in which dominantplatforms with extensive network connections losetheir attractiveness is that their functionality de-clines relative to that of newer platforms. In high-velocity environments, rapid recognition and adap-tation to technological shifts is a key requirement(Brown & Eisenhardt, 1997). When new platformsare introduced to take advantage of significant im-provements in computer processing power, speed,and memory, every developer faces a new choice:to launch products on this new platform, or not do
1 http://www.usdoj.gov/atr/cases/f2000/2054.htm; ac-cessed July 2003.
2004 879Venkatraman and Lee

so. Platform innovations also challenge the en-trenched dominant position. If a platform’s domi-nance is perpetual and its supporting positive feed-back cycle cannot be broken, strategic innovationsand maneuvering have no role. But leadership posi-tions in high-velocity environments change rapidly,giving rise to serial monopoly, a situation of “winner-take-all, but only for a while” (Liebowitz & Margolis,2001: 137). Both console makers and game develop-ers need to adjust to new innovations, and patterns ofinterorganizational relationship are not static.
Platform evolution through technological devel-opment shapes network structure and the path ofits evolution. A summary of Richard Schmalansee’sJanuary 1999 testimony at the Microsoft trial con-tains these observations:
History shows that application software emergesquickly for promising software platforms. In theearly 1980s, for example, independent software ven-dors wrote applications for DOS despite the fact thatmany consumers were using CP/M, and they wrotefor Windows in the early 1990s even though mostconsumers were using DOS. Today software devel-opers are writing applications for Linux and thePalmPC platform, and developers have shown re-newed interest in the Apple Macintosh now thatApple has released a new range of computers that isproving popular with consumers.2
Technological innovations in video games haveintroduced new platforms, new competitors, andnew competitive moves (Gallagher & Park, 2002).Every new platform introduction potentially altersthe established network of links between develop-ers and console manufactures. A new design, theresult of significant improvements in the basicfunctionality of consoles, can destroy the compe-tencies of some developers while enhancing thecompetencies of others. The introduction of a newplatform thus poses a new challenge for all devel-opers: should they continue to offer new titles forexisting platforms or alter their positions to take thenew platform into consideration?
Video game developers are acutely aware thattheir network positions rely on staying at the cut-ting edge of technology and that they will be con-sidered unattractive if they fall behind. This logic isparticularly important in a networked market inwhich the platform leader may simply reallocatemarketing resources to those developers that havestayed up-to-date with technology developments.The introduction of a new video game platform alsooffers new and exciting ways for game developers
to showcase designs that capitalize on the newplatform’s faster speed, superior graphics, and en-hanced multimedia functionality. The developersalso may be drawn to ride the marketing blitz in-volved in launching a new platform with tie-inpromotions with lead game titles. Thus:
Hypothesis 4. Ceteris paribus, a video gamedeveloper is more likely to link with a newertechnological platform.
METHODS
Research Setting: The Programmable VideoGame Network
As noted above, the setting we chose for ourexamination of patterns of linkage formation in net-works is the complex and dynamic video gamesector. It is a nexus of U.S. organizations that offervideo game consoles and video games (Schilling,2003; Shankar & Bayus, 2003). Each launch of anew game for a given console represents a networklink. The console choices that developers makeover time differentiate network positions and influ-ence customer preferences. Programmable homevideo game consoles (hardware) and games, orgame titles (software), are complements, since oneis of little value without the other (Brandenberger &Nalebuff, 1996). The dynamism of this settingcomes from the frequency with which manufactur-ers launch new generations of consoles with en-hanced capabilities (for instance, faster processors,better graphics, and more memory) that offer gamedevelopers additional capabilities to exploit (Gal-lagher & Park, 2002). Thus, this setting provides arich context in which to examine questions of pref-erential linkage driving network evolution.
Data
We assembled a primary data set of unique de-veloper-title-console combinations in monthly in-tervals to capture our network. We first identified671 developers and 8 platforms. Then, our intentwas to consider every title released by every devel-oper for every console during the time frame of ourstudy, in the spirit of Salancik’s (1995) call forattention to the “organization of individual ac-tions.” This level of detail was required becauseevery video game title represents new content. Con-sider the Madden NFL series of titles developed byElectronic Arts. A new Madden NFL title is re-leased every year but with different football playersand updated athlete statistics. Similarly, Final Fan-tasy, developed by Square Enix, was first devel-oped and released in 1990. Since then, many dif-
2 www.microsoft.com/presspass/trial/jann99/01–11schmal.asp. Accessed July 7, 2003.
880 DecemberAcademy of Management Journal

ferent Final Fantasy titles have been released withnew storylines and new game challenges.
Our data captured the sequence of developer-platform links month by month. For example, Elec-tronic Arts launched “Need for Speed: Hot Pursuit2” for the GameCube console in September 2002,for the Xbox console in October 2002, and for thePlayStation2 console in November 2002. We thustreated each launch as a distinct link since a gamefor one type of console cannot be used on a differ-ent type, just as Microsoft Word for Windows can-not be used on a Macintosh. At the end, our finalsample consisted of 2,815 releases, each represent-ing a unique combination of game developer, con-sole, and title, spanning the eight years from Janu-ary 1995 through December 2002, or 96 months. Inthe Appendix, we describe in detail the steps wetook to assemble and validate the dataset.
Measures
Linkage. We defined the dependent variable, adeveloper’s choice to release a game title for a givenconsole, as categorical and time-varying. Specifi-cally, yij,t equaled 1 if developer i on date t releaseda game title for console j, where j was a console inthe developer’s choice set, Jit. For the remainingconsoles in the developer’s choice set, yij,t equaled0. Table 1, which traces the dates on which Elec-tronic Arts released “Madden NFL 2002,” illus-trates the coding of the dependent variable. As thetable shows, the set of console choices (Ji,t) forElectronic Arts’ first release of “Madden NFL 2002”included GameCube, PSOne, PlayStation2, andXbox. The game was first released by ElectronicArts (i) for PlayStation2 (j) in August 2001 (t);hence, yij,t is 1. For the three remaining consoles,yij,t is 0. For the second release of “Madden NFL2002,” the choice set excluded PlayStation2 be-cause developers never release the same title to aconsole twice. “Madden NFL 2002” was releasedfor Xbox in October 2001. For the final release ofthis game, its release for GameCube in November2001, the choice set excluded both PlayStation2and Xbox. As this example demonstrates, thechoice set was not constant. Table 1 further illus-trates that for a new and previously unreleased title(“Need for Speed: Hot Pursuit 2”), the choice setwas reset and would subsequently decrease as thesame title was released for additional consoles.
Table 1 illustrates one way in which the choiceset varied across time as a game title was sequentiallyreleased on multiple platforms. However, as a con-sole became obsolete, it was permanently removedfrom all choice sets and calculations. We determinedfrom our sample the last date t* that any developer
released a new title for console j. It is obsolete if therelease date t of a different title is greater than t*. Forexample, developers in 2000 stopped releasing titlesfor the Sega DreamCast console. For this reason,DreamCast was not a console in any of the choice setsfor “Madden NFL 2002” and “Need for Speed: HotPursuit 2” in 2001. Consequently, we removed all thetitles previously released for the obsolete consolefrom the network; such removal was also in line withBurt’s (2000) suggestion that a network evolves viathe decay of the actors (here, console manufacturers)and links (game titles). Finally, the introduction of anew console increases the number of consoles in adeveloper’s choice set.
We also recognized the exit of game developers byincluding in all calculations only active developersand their titles. We removed a developer and its titlesfrom the network after it stopped releasing new titles.From our sample, we were able to determine the lastdate on which a developer released a new title for anyconsole. Finally, for all calculations, we measured allmodel predictors just prior to date t.3
Platform and developer age. We defined plat-form age in months on the release date t of a gametitle as the difference between that date and consolej’s launch date. We also defined developer age inmonths as the difference between date t and the dateof developer i’s first title release for any console.
Platform and developer dominance. We de-fined platform j’s dominance on date t as the num-ber of titles released by all developers for the plat-form divided by the total number of titles in thenetwork. Similarly, we defined developer i’s dom-inance on date t as the number of titles released by
3 In this text, we omit the subscript t to enhance expo-sitional clarity.
TABLE 1Release Sequence for Two Game Titles
Game TitleRelease
Date Choice SetConsoleChoice
“Madden NFL2002”
8/2001 GameCubePSOne
PlayStation2
PlayStation2Xbox
“Madden NFL2002”
10/2001 GameCubePSOne
Xbox
Xbox“Madden NFL
2002”11/2001 GameCube
PSOneGameCube
“Need for Speed:Hot Pursuit 2”
9/2002 GameCubePSOne
GameCube
PlayStation2Xbox
2004 881Venkatraman and Lee

the developer for all platforms divided by the totalnumber of titles in the network.
Platform overlap density. We used overlap den-sity (Baum & Singh, 1994) to measure the potentialcompetition faced by developers in the platform jniche. The overlap density for platform j on date twas given by
Overlap Densityj, t � �i
pij, t � �k � j
wkj, t� �i
pik, t� .
The term pij, t denoted the proportion of titles thatdeveloper i released to platform j. Summing over alldevelopers thus denoted the total number of devel-opers releasing titles for platform j. Similarly, pik,t
denoted the proportion of titles that developer i hadreleased to platform k. Summing over all develop-ers thus distinguished the total number of develop-ers releasing titles for platform k from the totalreleasing titles for platform j.
Baum and Singh (1994) defined wkj, t as the de-gree of overlap between two market niches. Marketniches, in our research setting, corresponded to twoplatforms, j and k. The platform overlap degree orweight was defined on the interval 0 � wkj, t � 1and denoted the extent to which two platformsattracted the same developers and thus overlapped.If wkj, t equaled 0, two disjoint sets of developershad released titles for platforms k and j, and theintersection of the two sets was null. If wkj, t was 1,developers were releasing titles for both platforms.Adding the product of the overlap weight and thetotal number of developers that released titles for kto the total number of developers that released ti-tles for j thus denoted the total competition con-fronting a developer releasing a title to platform j.
Many specifications of overlap weight exist, withthe Euclidean metric being the most common (e.g.,Burt & Carlton, 1989). However, as Baum and Singhstated, “The overlap weight [is], in general, asym-metric” (1994: 351–352)—or, wjk, t is usually notequal to wkj, t. The Euclidean metric is symmetric.We thus used Sohn’s (2001) overlap metric, definedas
wkj, t �
�i
aik, t min(aik, t,aij, t)
�i
(aik, t)2,
where aij, t and aik, t are the numbers of titles releasedby developer i to platforms j and k, respectively.
Developer prior ties. We defined prior ties(Granovetter, 1985) on date t as the number of titlesthat had been released by developer i for platform jby that date.
Platform embeddedness. We defined platformj’s embeddedness using Uzzi’s (1996) second-ordercoupling. Let Pji, t denote the proportion of platformj’s video games released by developer i on date t forplatform j. Platform embeddedness was calculatedas ¥i(Pji, t)
2 and varied between 0 and 1. A valueclose to 1.0 for this index meant that a platform wastightly embedded with (supported by) a few develop-ers. A value close to 0 meant a platform was looselyembedded with (supported by) many developers.
Developer embeddedness. Similarly, we de-fined developer embeddedness using Uzzi’s (1996)first-order coupling. Let Pij denote the proportion ofthe developer i’s titles released for platform j ondate t. Developer embeddedness was ¥j(Pij, t)
2. Avalue of 1 meant that 100 percent of a developer’stitles were being released for a single platform, anda value close to 0 meant a developer was releasingtitles for many platforms. Table 2a summarizesmeans, standard deviations, and zero-order corre-lations for the variables.
Modeling Console Choice and Network Evolution
Our unit of analysis was a developer’s choice torelease a title for a specific console. We thus usedMcFadden’s (1974) multiprobability discrete choicemodel, a generalization of “logit” and multinomiallogit models, to test our hypotheses. A multiprobabil-ity model is commonly used when the dependentvariable consists of a choice from an unordered set ofalternatives. For example, Greve (2000) used the Mc-Fadden model to estimate market entry choices inTokyo that were based on attributes of alternativelocations within a consideration set. Greene and Hen-sher (1997) used the multiprobability model to ana-lyze choice of mode of transportation from a set offour alternatives. Powell, White, Koput, and Owen-Smith (2004) also used the McFadden model, tomodel partner choice in the biotechnology sector.
All covariates here time-varying because theyrepresented the network structure on any date.Moreover, a particular characteristic of McFad-den’s multiprobability discrete choice model is thatit requires as input information on a choice and allthe alternatives available at the time of the choice.Greene and Hensher’s (2003) analysis of 210 peo-ple’s choice of travel mode illustrates the model.Their data set contained 840 observations becauseeach person chose from a fixed choice set (air, train,bus, car). Hence, each of the 210 choices was asso-ciated with three “nonchoice” observations. Fol-lowing Greene (2003: 730), we present both sets ofdescriptive data—one for the choices (the studysample) and another for the choices and all alter-natives (the estimation sample).
882 DecemberAcademy of Management Journal

Our study sample contained 2,815 unique devel-oper-platform-title observations. Our estimationsample included, in addition to the study sample,all the consoles not chosen in each of the 2,815cases. However, the choice set for a developer’stitle was not fixed. Consider again the sequentiallaunches of “Madden NFL 2002” (Table 1). For thefirst launch of the game, the choice set consisted offour consoles; this release thus generated four ob-servations (that is, one for PlayStation2 and threefor the other consoles). For the second launch of“Madden NFL 2002,” three console choices gener-ated three observations (one for Xbox and one eachfor PSOne and GameCube). Moreover, the maximumnumber of consoles in a choice set varied over time asobsolete consoles were removed from the choice set.Consequently, as noted above, each of the 2,815 titlereleases created one or more additional observationsthat consisted of all active consoles for which thedeveloper had not released the title. The final estima-tion sample thus consisted of 11,931 observations.Summary statistics for the study and estimation sam-ple are found in Tables 2a and 2b.
We should also note the specification of modelcovariates in McFadden’s multiprobability discretechoice model: covariates are classified as varyingwith the choices in the choice set (here, platform
attributes) and as not so varying (here, developerattributes). Again, the August 2001 release of “Mad-den NFL 2002” in Table 1 is illustrative. Each of thefour consoles in the choice set seen there waslaunched by the manufacturer on a different date,so platform age, for example, differed for each con-sole. The consoles, however, represented choicesthat confronted Electronic Arts on August 2001.Consequently, developer age, for example, did notvary across the choices. As Greene stated, “Termsthat do not vary across alternatives – that is thosespecific to the individual – fall out of the probabil-ity. One method [is to create] . . . a complete set ofinteraction terms” (2003: 720) (between the choiceand individual covariates). In other words, to in-corporate both platform and developer attributessimultaneously, developer attributes needed to bespecified as “interaction” terms in the multiprob-ability model. Although the inclusion of many in-teraction terms complicated the time-varyingmodel, omitting them in the model specificationwould have implied that all developers were ho-mogeneous. The coefficients for the “main effects”were robust only given inclusion of these interac-tions, which is akin to the inclusion of controlvariables in multivariate regressions.
Hence, the probability that developer i would
TABLE 2Summary Statistics and Correlations
(2a) Study Sample
Variablea Mean s.d. 1 2 3 4 5 6 7
1. Platform age 33.61 21.142. Platform dominance 0.36 0.28 .553. Platform overlap density 118.11 33.43 .32 �.194. Platform embeddedness 0.04 0.05 �.34 �.21 �.325. Developer age 29.03 25.27 �.01b �.34 .37 �.056. Developer dominance 0.01 0.02 �.15 .12 �.31 .39 .187. Developer embeddedness 0.70 0.26 .17 .44 �.28 .02b �.61 �.098. Developer prior ties 4.45 6.23 .37 .25 .13 �.13 .33 .40 �.12
(2b) Estimation Samplec
Variable Mean s.d. 1 2 3 4 5 6 7
1. Platform age 38.91 26.812. Platform dominance 0.22 0.23 .433. Platform overlap density 113.97 33.24 .16 �.044. Platform embeddedness 0.07 0.16 �.35 �.26 �.145. Developer age 31.83 25.60 .16 �.13 .26 �.036. Developer dominance 0.01 0.02 �.08 .08 �.22 .09 .257. Developer embeddedness 0.68 0.26 �.14 .12 �.20 .02 �.61 �.148. Developer prior ties 2.28 5.46 .27 .36 .08 �.12 .31 .35 �.20
a n � 2,815. Correlations are significant at p � .05 or less owing to the large sample size, except as noted.b p � .10.c n � 11,931. All correlations are significant at p � .05 or less owing to the large sample size.
2004 883Venkatraman and Lee

release a title for platform j instead of for the otherplatforms in Ji,t was a function of a vector of plat-form attributes (Xj,t) that varied among all platformsin Ji,t; developer-specific dyadic attributes (Wij,t);and a vector of developer attributes (Zi,t) that didnot vary. The estimation model was:
Probability � yij,t � 1 �ji,t
� 1,Xj,t,Zi,t,Wij,t��
exp(�Xj,t � �Zi,tXj,t � �Wij,tXj,t)�ji,t
exp(�Xj,t � �Zi,tXj,t � �Wij,tXj,t).
We estimated two models. Model 1 (homoge-neous developers) includes only platform at-tributes: overlap density, embeddedness, platformdominance and platform newness. In model 2, werelaxed the assumption of homogeneity by incor-porating the four developer characteristics.
Both models were estimated with Stata 8.2. Thestandard errors were based on the coefficients fromthe estimation. However, we also estimated and
present odds ratios for model 2, obtained by takingthe exponential of the coefficients. An odds ratiogreater than 1.0 denoted an increase in probabilityfor higher values of the coefficient, and a valuelower than 1.0 denoted a decrease.
RESULTS
Table 3 presents estimations for the two models,which are both significant (pseudo-R2 � .24 and.52). The between-model change in chi-square isalso significant. The high pseudo-R2 in model 2adds credence to the results, despite the large sam-ple size. We used the full model, with both plat-form and developer attributes, for testing the fourhypotheses, assessing support for a hypothesisthrough the main effects (rows 1–4).
Our first hypothesis, predicting that densityoverlap will have a negative effect on network link-age, was supported (b1 � �0.02, odds ratio � 0.98,p � .05). Developers were less likely to launchproducts in a crowded space in which other devel-
TABLE 3Results of Multiprobability Regression Analysis
Variable Hypothesis
Model 1 Model 2
b s.e. b s.e.OddsRatio
Platform overlap density 1 0.01*** 0.00 �0.02* 0.01 0.98Platform embeddedness 2 �6.74*** 0.76 �39.58*** 6.71 0.00Platform dominance 3 3.78*** 0.18 2.83* 1.14 16.86Platform age 4 �0.04 0.00 �0.05*** 0.01 0.95Platform overlap density � developer age 0.00*** 0.00 1.00Platform overlap density � developer dominance 0.41 0.35 1.50Platform overlap density � developer embeddedness 0.02† 0.01 1.02Platform overlap density � developer prior ties 0.00† 0.00 1.00Platform embeddedness � developer age 0.23** 0.07 1.26Platform embeddedness � developer dominance �208.46*** 42.30 0.00Platform embeddedness � developer embeddedness 19.34** 7.10 2.5e8Platform embeddedness � developer prior ties 24.75*** 1.19 5.6e10Platform age � developer age �0.00** 0.00 1.00Platform age � developer dominance �3.95*** 0.37 0.02Platform age � developer embeddedness 0.03* 0.01 1.03Platform age � developer prior ties �0.00** 0.00 1.00Platform dominance � developer age 0.08*** 0.02 1.09Platform dominance � developer dominance �203.18*** 27.24 0.00Platform dominance � developer embeddedness �0.15 1.20 0.86Platform dominance � developer prior ties 0.47*** 0.10 1.61
Log-likelihood �2,954.95 �1,878.85Likelihood ratio chi-square 1,898.48 4,050.68Pseudo R2 .24 .52
† p � .10* p � .05
** p � .01*** p � .001
884 DecemberAcademy of Management Journal

opers and titles had strong presences. The interpre-tation of the odds ratio is that for a unit increase indensity overlap, the likelihood of attachment de-creases by 2 percent (1.00 � 0.98). We then testedHypothesis 2, on platform embeddedness throughcoupling. The effect was strong and in the expecteddirection (b2� �39.58, odds ratio: 0.00, p � .001),indicating that developers were unlikely to releasetitles to a platform that was already tightly con-nected to few developers.
Hypothesis 3 focuses on platform dominance. Asa predictor, platform dominance was strong andsignificant (b3 � 2.83, odds ratio � 16.86, p � .05).It is noteworthy that the impact of platform domi-nance on developers’ platform choice was muchstronger than the impact of competition within aplatform seen through overlap density. The impli-cation is that for a 10 percent increase in platformdominance, the odds of attachment increases 1.686times (16.86/10, given the range of platform domi-nance from 0.0–1.0). Our Hypothesis 4, stating thatin a fast-changing technology setting, developerswill be drawn to launch new titles for the mostinnovative gaming platform, received strong empir-ical support (b4� �0.05, odds ratio � 0.95, p �.001). A developer was more likely to release a titlefor a newer platform, because the odds of releasinga title for a platform decreased by 5 percent (1.00 –0.95) for a unit increase in the difference betweenthe title’s launch date and the platform’s launchdate. For the four hypotheses collectively, empiri-cal support was strong.
Further Validation
The analyses reported thus far measured plat-form dominance as the number of new gamelaunches instead of as the more refined measure,share through sales in units. To further validate ourresults, given the importance of platform dominance,we obtained additional data from the NPD Group�, anauthoritative industry source whose data has beenpreviously used by researchers (Shankar & Bayus,2003). This commercial database, spanning the years1995–2002, contains the same information structure(that is, developer, title, console, launch date) as ourevent sample. The NPD database also has yearly dataon the total copies of a game title–platform sold (thatis, units shipped) to retailers (for instance, Best Buy�)and the unit share of a title for a specific console.These additional data are important because, al-though all new titles are priced similarly at the timeof launch, popular titles linked to a specific platformmay have more influence over developers’ choices torelease to a console.
Unfortunately, this database contains observations
for only the top 100 titles. Nonetheless, we were ableto determine by performing a few calculations thatthe top 100 titles accounted for approximately 68percent of industry units shipped. We then recalcu-lated platform dominance using units shipped in-stead of new title counts to test the robustness of ourresults. We reestimated the model with yearly data byrecalibrating the measures at yearly resolutions.
The results, presented in Table 4, were remark-ably consistent with those for the original model:the pseudo-R2 was .50 for the validation (NPD)model versus .52 for the original model. This con-sistency is not surprising, given that the averagecorrelation over the eight study years between plat-form dominance (calculated using the number ofnew titles, our primary data), and unit sales (calcu-lated using the number of shipped titles, from NPDdata), is .85. The implication is that the sales levelof platforms is significantly influenced by new titlelaunches, the building block for network evolutionthat we studied here. This correlation also providesfurther confidence in the quality of our data and theveracity of our results.
Specifically, the coefficient for platform domi-nance was significant at a better level of statisticalprecision (p � .05, original analysis; p � .01, vali-dation analysis). Three of the four platform at-tribute effects were significant; density overlap’ssignificance as a main effect was not supported inthe validation analysis. The developer attribute“controls” were broadly supported, and the signs ofthe developer attribute coefficients (with the excep-tion of the interaction of platform age with devel-oper prior ties) were identical—albeit the Z-valuesobtained using the NPD data were smaller thanthose from our primary data.
The degree of density overlap (and of other ef-fects) observed via monthly “snapshots” of networkevolution might be greater than what would beobserved if our data were aggregated yearly. Sincethe validation analysis only included developerswith at least one title in the top 100, the level ofcompetition was underrepresented. It could also bethat the top 100 titles had different impacts in thelimited analysis than they did when all the titleswere used. Nevertheless, we believe that the sup-plementary analyses enhanced the robustness andvalidity of our results.
From Statistical Estimation to NetworkVisualization
We sought to shed further light on network evo-lution by employing complementary network mod-eling and visualization approaches (Albert & Bara-
2004 885Venkatraman and Lee

basi, 2002; Powell et al., 2004), using Pajek4
(Batagelj & Mrvar, 2003) to triangulate statisticalestimates of links and network topology structurechanges. We mapped linkage in networks by con-necting game titles with platforms to derive thetopology of the networks over time. Space con-straints prevent us from including yearly evolutionhere, but we include three snapshots. Figure 1 de-picts the network at the beginning of our studyperiod, December 1995, which captures the impactof the introduction of Sony PlayStation. Figure 2,for December 2000, captures the impact of the in-troduction of PlayStation2. Figure 3, for the end ofour study period, December 2002, highlights thecompetitive interaction between Sony and Mi-crosoft with the introduction of the Xbox. In thesefigures, each circle denotes a unique developer,and each line denotes one or more titles launchedby a developer to support a game platform, which is
denoted as a square. The sizes of the squares andcircles are proportional to the number of titles re-leased by developers (for circles) or written for aplatform (for squares).
The three figures taken together allow us to makea few useful points. First, they reinforce the centralrole of preferential working relationships with fewconsole makers: many developers who supportedthe original PlayStation also supported the subse-quent platform, PlayStation2, introduced by thesame organization, Sony. Second, the sequence ofgraphs demonstrates the strength of platform dom-inance as an attractor of new titles, with Sony Play-Station shown as receiving many new titles in Fig-ure 1 and Sony PlayStation2 as receiving many inFigures 2 and 3. Third, domain overlap is a centralissue; the graphs show many smaller players sup-porting one platform while the more prominentdevelopers (those with bigger circles) are clearlysupporting multiple platforms (Figures 2 and 3).Furthermore, the figures taken together highlight apower shift in the network from platform producersto a few major game developers. By December 2002,more developers were supporting multiple plat-forms. These Pajek figures reveal useful insights
4 Pajek is a program for the analysis and visualizationof large networks involving many hundreds of vertices.In Slovenian, it means “spider.” For a detailed illustra-tion of the ability of Pajek to visualize interorganizationalnetworks, see Powell et al. (2004).
TABLE 4Results of Validation Multiprobability Regression Analysis
Variable Hypothesis
Model 1 Model 2
b s.e. b s.e.
Platform overlap density 1 0.02*** 0.00 0.01 0.01Platform embeddedness 2 �19.96*** 2.46 �52.52*** 13.44Platform dominance 4 4.80*** 0.21 3.83** 1.12Platform age 4 �0.12*** 0.02 �0.28** 0.09Platform overlap density � developer age 0.00 0.00Platform overlap density � developer dominance 0.42 0.27Platform overlap density � developer embeddedness 0.00 0.01Platform overlap density � developer prior ties 0.00*** 0.00Platform embeddedness � developer age �0.07 2.17Platform embeddedness � developer dominance �73.08 260.89Platform embeddedness � developer embeddedness 34.05* 13.31Platform embeddedness � developer prior ties 13.38*** 1.13Platform dominance � developer age 0.55** 0.16Platform dominance � developer dominance �181.76*** 48.81Platform dominance � developer embeddedness �1.10 1.17Platform dominance � developer prior ties 0.08 0.13Platform age � developer age �0.02 0.01Platform age � developer dominance �52.43*** 4.70Platform age � developer embeddedness 0.36*** 0.10Platform age � developer prior ties �0.00 0.01
Log-likelihood �2,970.32 �2,109.42Likelihood ratio chi-square 2,540.21 4,262.01Pseudo-R2 .30 .50
* p � .05** p � .01
*** p � .001
886 DecemberAcademy of Management Journal

into the structure and dynamics of networks andcomplement the statistical analyses.
DISCUSSION
We focused on the dynamics of network links be-tween game consoles and video game developers—two clearly demarcated network roles—over aneight-year period in the U.S. video game sector. Wetheorized four related explanations for game devel-opers’ preferential linkage to specific platforms andfound strong empirical support. Results suggestthat one cannot understand such networks by fo-cusing on any one role since each developer’s suc-cess depends on its coordinating choices withthose of platform manufacturers (Shapiro & Varian,1998). The network dynamics of coordination be-tween platform manufacturers and game develop-ers are central since vertical integration is ineffec-tive in such system-based settings. Although someleading console makers like Sony have some oftheir own titles (see Figure 1), success in suchnetworks is critically based on relationships with
complementors. Similarly, game developers needto make critical choices about linking with one ormore platforms and adapting these links over time.We also found further corroborating insights fromnetwork visualization models.
Specifically, our results show that video gamenetworks evolve, with the formation of links re-flecting macro network characteristics (densityoverlap and embeddedness) and platform charac-teristics (dominance and newness) when developercharacteristics (age, share, coupling, and prior ties)are used as controls to specify a more completemodel. Structural embeddedness, seen through thecoupling of consoles and video games, emerged asthe strongest predictor of linkage. This result addsfurther credence to Uzzi’s (1997) notions of theparadox of embeddedness. Interestingly, our find-ings are consistent with the literature on networkeffects in technology systems (Arthur, 1989;Bresnahan & Greenstein, 1999). Firms designingcomplementary products are drawn to platformsthat have broad-based support. Future work mayusefully integrate ideas of embeddedness with net-
FIGURE 1Network Topology, December 1995a
a These are summary observations for two nonoverlapping (disjoint) networks. The sizes of the squares and circles shown here areproportional to network activity. For example, the larger a circle, the greater the number of titles released by the developer denoted by that circle.
2004 887Venkatraman and Lee

work effects to develop richer conceptualizationsand predictions for later empirical tests.
Platform newness emerged as a significant pre-dictor of attracting new links, lending further cre-dence to the importance of innovation in fast-changing markets (Brown & Eisenhardt, 1997).Developers are drawn to newer platforms, all otherthings being equal. This is the first large-samplestudy that we are aware of that focused on thedynamic process of network evolution in a settingin which the technological characteristics changedin significant ways to influence new platformlaunches. They subsequently impact preferentiallinks among organizations.
In addition to density overlap, extant couplingbetween platforms and developers, and platformnewness, we found that platform dominance influ-ences network links. Physical and technological
networks evolve in ways that support the linkinglogic of “the fit get richer” (Albert & Barabasi,2002). However, dominance is just one explanationwhen network evolution over eight years is exam-ined as monthly addition and deletion of nodes andlinks. Since platform dominance is not permanent(Evans et al., 2001) but dynamic, astute developersstrive to balance their commitment of complemen-tary products over an array of platforms with dif-ferent characteristics and positions in networks.
From a strategic management point of view, ourresults reinforce the need to understand competi-tion-cooperation in networks. Some interorganiza-tional networks foster innovation through directand indirect ties (Ahuja, 2000), and other networksmay have “small world” characteristics (Davis,Yoo, & Baker, 2003; Kogut & Walker, 2001; Watts,2003). We treated games as complementary re-
FIGURE 2Network Topology, December 2000a
a The sizes of the squares and circles shown here are proportional to network activity. For example, the larger a circle, the greater thenumber of titles released by the developer denoted by that circle.
888 DecemberAcademy of Management Journal

sources for a platform in the spirit of Podolny’s(2001) view of ties as pipes (resource conduits) andties as prisms (reflecting cues on node quality).However, in other settings, a tie may be only a pipeor only a prism. Furthermore, not all types of inter-organizational ties create conduits for resourceflows, because competitive interactions find differ-ent gateways to resources. In social networks, forexample, each actor may be “actively trying to co-opt those with whom it has dependencies” (Bor-gatti & Foster, 2003: 1004). Although bilateral rela-tionships facilitate resource flows (Gulati &Gargiulo, 1999), it is naıve to assume that extendedties through different organizations always serve asconduits for resource flows. We hope that our em-pirical findings in one type of network reflectingsystem-based competition stimulate future theoriz-
ing about the particular competitive-cooperativenature of these ties and add to the broader stream ofresearch focused on how network characteristicsimpact network performance (Baum et al., 2003;Powell et al., 2004; Uzzi & Spiro, 2003).
Methodologically, our study makes modest con-tributions. We went beyond describing networkstructure to analyze network evolution from a de-cision-making perspective. Greve (2000) demon-strated the value of models of choice in settings inwhich decision makers explicitly consider avail-able alternatives in terms of market characteristics.In this study, we used a set of platform and devel-oper attributes to shed light on linkages in net-works. Such models explicate the logic of networkdynamics as aggregates of individual actions(Salancik, 1995). We also combined statistical esti-
FIGURE 3Network Topology, December 2002a
a The sizes of the squares and circles shown here are proportional to network activity. For example, the larger a circle, the greater thenumber of titles released by the developer denoted by that circle.
2004 889Venkatraman and Lee

mations of preferential linkage with network visu-alization approaches to gain insights on networkevolution. We believe that such an integrative ap-proach, in line with that of Powell and his col-leagues (2004), may be useful for understanding theintricacies of networks. This triangulation allowedus to see patterns that would have remained ab-stract if only statistics were examined.
Our model treated the four explanations as inde-pendent, under ceteris paribus conditions. The re-sults, although strong and significant, raised somepossible avenues for theorizing. For example, con-nections among the four explanations that couldinform how developers make trade-offs betweendensity overlap and dominance merits additionalresearch. In cases that may indicate high expectedgrowth and acceptance of a platform, developers maychoose a new platform that is tightly coupled (that is,supported by few developers). We urge researchers tofocus on interesting connections that may spawn fur-ther research. This phenomenon of network evolu-tion is not unique to video games but exists in indus-tries such as software, telecommunications, mobileInternet, and financial services. These industriescould provide rich settings in which to refine theoriesand models of linkage formation and network evolu-tion under fast-changing technologies.
Extensions of this study should address some ofits limitations: (1) Our data set could be expandedto include game attributes—genre, functionality,links to movies, and so forth—to delve further intothe intricacies of how video games and consolescoevolve. (2) Video game development could bestudied to shed light on the ease of porting games todifferent platforms and on the restrictions on port-ing that console manufacturers may impose. (3)Future research could focus on additional links inthis network, such as social connections (friend-ship ties among game developers), board inter-locks, technical forums, and cross-equity or com-mon-venture investment links. (4) The video gamedevelopment process could also be studied to bet-ter specify the impact of time lags in decisions tolaunch games for platforms.
Our results offer some pointers for managementpractice. Interorganizational coordination of productarchitectures is not limited to video games but ap-pears to operate in many other settings. Coordinationof complementary offerings calls for a new compe-tency focused on “network orchestration.” This com-petency balances the inevitable tension between co-operation and competition across different types ofresources over time and involves the formation anddissolution of multiple types of relationships. Sincethe locus of critical resources in such settings liesoutside any one firm in a network (Gulati et al., 2000),
network orchestration as a competency may be a crit-ical driver of superior performance. Network orches-tration is at a higher level than functional boundaryspanning in purchasing, marketing, R&D, and opera-tions. In periods of turbulent change, a network canbe a source of strength (such as informational cues tothreats of obsolescence) or a source of constraint(such as rigidity and inertia). Network orchestrationas a competency entails managers’ simultaneouslyfocusing on the macro logic of network structure(how a portfolio of relationships is structured for re-source access as a whole) and the micro logic ofnetwork processes (selection, cultivation, and disso-lution of individual relationships) that contribute tomaximal performance.
In conclusion, networks have become a populartopic for management research (Borgatti & Foster,2003; Galaskiewicz & Wasserman, 1989; Gulati etal., 2000). Although alliances have been studied forsome time, they have been mostly treated as dyadicconnections—either static or dynamic. A networkperspective is a powerful way to holistically under-stand the complex resource flows and dependen-cies that create performance differences. We madean initial exploration into the dynamics of networkformation within system-based competition in onesetting and found strong, encouraging results. Wehope that this study will stimulate other research-ers to better examine how networks of relationshipsconfer competitive advantage over time. Such ef-forts will strengthen and broaden a network theoryof strategic management.
REFERENCES
Ahuja, G. 2000. Collaboration networks, structural holes,and innovation: A longitudinal study. Administra-tive Science Quarterly, 45: 425–455.
Albert, R., & Barabasi, A. 2002. Statistical mechanics ofcomplex networks. Reviews of Modern Physics, 74:47–97.
Arthur, W. B. 1989. Competing technologies, increasingreturns, and lock-in by historical small events. Eco-nomic Journal, 99: 116–131.
Arthur, W. B., Durlauf, S. N., & Lane, D. A. 1997. Theeconomy as a complex evolving system, II. Santa FeInstitute Studies in the Science of Complexity, Pro-ceedings, vol. 27. Reading, MA: Addison-Wesley.
Baker, W. E., Faulkner, R. R., & Fisher, G. A. 1998. Haz-ards of the market: The continuity and dissolution ofinterorganizational market relationships. AmericanSociological Review, 63: 147–177.
Baldwin, C., & Clark, K. 2000. Design rules: The powerof modularity. Cambridge, MA: MIT Press.
Barabasi, A. 2002. Linked: The new science of net-works. Cambridge, MA: Perseus Publishing.
890 DecemberAcademy of Management Journal

Batagelj, V., & Mrvar, A. 2003. Pajek—Analysis and vi-sualization of large networks. In M. Junger & P. Mut-zel (Eds.), Graph drawing software (mathematicsand visualization): 77–103. Berlin: Springer.
Baum, J. A. C., & Singh, J. V. 1994. Organizational nichesand the dynamics of organizational mortality. Amer-ican Journal of Sociology, 100: 346–380.
Baum, J. A. C., Shipilov, A. V., & Rowley, T. J. 2003.Where do small worlds come from? Industrial andCorporate Change, 12: 697–725.
Borgatti, S. P., & Foster, P. C. 2003. The network para-digm in organizational research: A review and typol-ogy. Journal of Management, 29: 991–1013.
Brandenberger, A. M., & Nalebuff, B. J. 1996. Co-opeti-tion. New York: Currency Doubleday.
Bresnahan, T., & Greenstein, S. 1999. Technological com-petition and the structure of the computer industry.Journal of Industrial Economics, 47: 1–40.
Brown, S. L., & Eisenhardt, K. M. 1997. The art of contin-uous change: Linking complexity theory and time-paced evolution in relentlessly shifting organizations.Administrative Science Quarterly, 42: 1–34.
Burt, R. S. 2000. Decay functions. Social Networks, 22:1–28.
Burt, R. S., & Carlton, D. S. 1989. Another look at thenetwork boundaries of American markets. AmericanJournal of Sociology, 94: 723–753.
Davis, G. F., Yoo, M., & W. E. Baker 2003. The smallworld of the American corporate elite, 1982–2001.Strategic Organization, 1: 301–326.
Dyer, J. H., & Singh, H. 1998. The relational view: Coop-erative strategy and sources of interorganizationalcompetitive advantage. Academy of ManagementReview, 23: 660–679.
Evans, D. S., Nichols, A. L., & Schmalansee, R. 2001. Ananalysis of the government’s economic case in US v.Microsoft. Antitrust Bulletin, 46(2): 163–252.
Frels, J. K., Shervani, R., & Srivastava, R. K. 2003. Theintegrated networks model: Explaining resource al-locations in network markets. Journal of Marketing,67(1): 29–45.
Galaskiewicz, J., & Wasserman, S. 1989. Mimetic processeswithin an interorganizational field: An empirical test.Administrative Science Quarterly, 34: 454–479.
Gallagher, S., & Park, S. H. 2002. Innovation and competi-tion in standard-based industries: A historical analysisof the U.S. home video game market. IEEE Transac-tions on Engineering Management, 49: 67–82.
Garud, R., Kumaraswamy, A., & Langlois, R. (Eds.). 2003.Managing in the modular age. Malden, MA: Black-well Publishing.
Gawer, A., & Cusumano, M. A. 2002. Platform leader-ship. Boston: Harvard Business School Press.
Granovetter, M. S. 1985. Economic action and social
structure: The problem of embeddedness. AmericanJournal of Sociology, 91: 481–510.
Greene, W. H. 2003. Econometric analysis. Upper Sad-dle River, NJ: Prentice-Hall.
Greene, W. H., & Hensher D. 1997. Multinomial logit anddiscrete choice models. In W. H. Greene, LIMDEP ver-sion 7.0 user’s manual revised. New York: Planview.
Greve, H. R. 2000. Market niche entry decisions: Competition,learning, and strategy in Tokyo banking, 1894–1936.Academy of Management Journal, 43: 816–836.
Gulati, R. 1995. Social structure and alliance formationpatterns: A longitudinal analysis. AdministrativeScience Quarterly, 40: 619–652.
Gulati, R., & Gargiulo, M. 1999. Where do interorganiza-tional networks come from? American Journal ofSociology, 104: 1439–1493.
Gulati, R., Nohria, N., & Zaheer, A. 2000. Strategic net-works. Strategic Management Journal, 21: 203–215.
Heide, J. B. 1994. Interorganizational governance in market-ing channels. Journal of Marketing, 58(1): 71–85.
Katz, M. L., & Shapiro, C. 1994. Systems competition andnetwork effects. Journal of Economic Perspectives,8: 93–105.
Kogut, B., & Walker, G. 2001. The small world of Ger-many and the durability of national networks. Amer-ican Sociological Review, 66: 317–335.
Liebowitz, S., & Margolis, S. E. 2001. Winners, losers &Microsoft: Competition and antitrust in high tech-nology. Oakland, CA: Independent Institute.
Marsden, P. V. 1981. Introducing influence and pro-cesses into a system of collective decisions. Ameri-can Journal of Sociology, 86: 1203–1235.
McFadden, D. 1974. Conditional logit analysis of qualita-tive choice behavior. In P. Zarembka (Ed.), Frontiers ineconometrics: 105–142. New York: Academic.
McKenzie, R. 2000. Trust on trial: How the Microsoftcase is reframing the rules of competition. Cam-bridge, MA: Belknap.
Nohria, N. 1992. Introduction: Is a network perspective auseful way of studying organizations? In N. Nohria &R. G. Eccles (Eds.), Networks and organizations:Structure, form, and action: 1–22. Boston: HarvardBusiness School Press.
Oliver, C. 1990. Determinants of interorganizational re-lationships: Integration and future directions. Acad-emy of Management Review, 15: 241–265.
Podolny, J. M. 2001. Networks as the pipes and prisms of themarket. American Journal of Sociology, 107: 33–60.
Podolny, J. M., & Stuart, T. E. 1995. A role-based ecologyof technological change. American Journal of Soci-ology, 100: 1224–1260.
Powell, W. W., White, D. R., Koput, K. W., & Owen-Smith,J. 2004. Network dynamics and field evolution: The
2004 891Venkatraman and Lee

growth of interorganizational collaboration in life sci-ences. American Journal of Sociology: In press.
Salancik, G. 1995. WANTED: A good theory of organiza-tion. Administrative Science Quarterly, 45: 1–24.
Schilling, M. A. 2003. Technological leapfrogging: Les-sons from the U.S. video game console industry.California Management Review, 45(3): 6–32.
Shankar, V., & Bayus, B. L. 2003. Network effects and com-petition: An empirical analysis of the home video gameindustry. Strategic Management Journal, 24: 375–384.
Shaprio, C., & Varian, H. 1998. Information rules: Astrategic guide to the network economy. Cam-bridge, MA: Harvard University Press.
Sohn, M. 2001. Distance and cosine measures of nicheoverlap. Social Networks, 23: 141–165.
Stuart, T. 1999. A structural perspective on organiza-tional innovation. Industrial and CorporateChange, 8: 745–775.
Subramani, M. R. & Venkatraman, N. 2003. Safeguardinginvestments in asymmetric interorganizational rela-tionships: Theory and evidence. Academy of Man-agement Journal, 46: 46–62.
Uzzi, B. 1996. The sources and consequences of embedded-ness for the economic performance of organizations:The network effect. American Sociological Review,61: 674–698.
Uzzi, B. 1997. Social structure and competition in inter-firm networks: The paradox of embeddedness. Ad-ministrative Science Quarterly, 42: 35–67.
Uzzi, B., & Spiro, J. 2003. Do small worlds make bigdifferences? Artist networks and the success ofBroadway musicals, 1945–1989. Working paper,Northwestern University, Evanston, IL.
Van de Bunt, G. G., Van Duijn, M., & Snijders, T. A. B.1999. Friendship networks through time: An actor-oriented dynamic statistical network model. Compu-tational & Mathematical Organization Theory,5(2): 167–199.
Van de Ven, A. H. 1976. On the nature, formation andmaintenance of relations among organizations.Academy of Management Review, 1: 24–36.
Watts, D. 2003. Six degrees: The science of a connectedage. New York: W. W. Norton.
Williamson, O. E. 1991. Strategizing, economizing, andeconomic organization. Strategic ManagementJournal, 12: 75–94.
APPENDIX
Assembling and Validating the Data Set
We extracted new U.S. console title, platform, devel-oper, and release date information from three Web sites
(www.gamefaqs.com,www.gamespot.com,andwww.ign.com). The data were then cross-validated with the listsprovided on console manufacturers’ Web sites. Nonpro-grammable single games (e.g., “Mattel Football”) and PCplatform titles were discarded. Also discarded weregames for portable handheld equipment, such as Ninten-do’s Gameboy Color and Sega’s GameGear, and titlesreleased only for Japanese and other non-U.S. markets.
Semantic variations were resolved and redundanciesremoved for all developers, platforms, titles, and releasedates using (1) the Web sites of platform manufacturers(e.g., www.playstation.com) and game developers (e.g.,www.ea.com), (2) independent video game databases(e.g., gamespot.com, ign.com, and vgmuseum.com), and (3)on-line retailer databases (e.g., bestbuy.com and amazon.com). We collected additional information from popularvideo game publications. A complete list of sources used tovalidate the data is available on request.
An observation was used if we got consistent data on itfrom at least three sources. We also discarded titles thatwere rereleased for the same platform in a subsequentyear as well as titles that consisted of bundles of previousreleases. However, existing titles released for new plat-forms were included because games rarely run on morethan one platform. Also discarded were titles that couldoperate on multiple consoles through the use of gameemulators. Although some recent platforms by a singlemanufacturer (e.g., Sony PlayStation 2) will accept gameswritten for a previous platform (e.g., Sony PlayStation),these games are rarely rereleased. If they were rereleased,we deleted data on them from the database.
Finally, we obtained yearly data for the top 100 titlesfor each year (1995–2002) from the NPD Group. Each ofthe 800 observations represents a unique platform, de-veloper, title, units shipped, unit share, and year combi-nation. The top 100 titles on average accounted for 68percent of sales, thus allowing for reasonable validation.We used these data to recalculate some variables, count-ing units shipped instead of number of new titles.
N. Venkatraman ([email protected]) is the David J.McGrath Jr. Professor of Management at the Boston Uni-versity School of Management. He received his doctoratefrom the University of Pittsburgh. His research interestsare at the intersection of strategic management and infor-mation technology, with an emphasis on competingthrough networks.
Chi-Hyon Lee ([email protected]) is an assistant researchprofessor at the Boston University School of Management.He received his doctorate from Boston University. His re-search interests are software ecosystem dynamics, alliancesand partnerships, and network analytics and methods.
892 DecemberAcademy of Management Journal
