orographic effects on rainfall induced by the passage of
TRANSCRIPT

Colón-Pagán, SOARS 2009
Orographic Effects on Rainfall Induced by the Passage of Tropical Cyclones over Mountainous Islands:
Part I: The Effect of Cloud Microphysics
Ian C. Colón-Pagán
Academic Affiliation, Fall 2009: 2nd Year Graduate Student, North Carolina A&T State University
SOARS® Summer 2009
Science Research Mentors: Dr. Bill Kuo and Dr. Bill Schreiner Advisers: Dr. Yuh-Lang Lin and Dr. Steve E. Koch
Writing and Communication Mentor: Sara Frank Bristow Computer Mentor: Wei Wang
Abstract
The passage of a tropical cyclone (TC) over a mesoscale mountainous island, such as Puerto Rico, often brings heavy rainfall which produces flooding and landslides. Factors that affect the amount and distribution of this type of orographic rainfall in this region are not well understood. This study investigates the impact of microphysics (MP) schemes in a TC simulation using the Advanced Research Weather Research and Forecast (ARW) model. The numerical mesoscale ARW model was adopted to conduct a study of Hurricane Jeanne’s (2004) passage over the island. Sensitivity experiments using four different MP schemes were performed. Each sensitivity experiment was represented by a single MP scheme, i.e.: WSM 5-Class (EXP1), Eta Ferrier Microphysics (EXP2), WSM 6-Class (EXP3), and the Thompson Graupel scheme (EXP4).
Results show strong consistency for the cyclonic track among all experiments with a significant landfall time difference of ~4 hours ahead of observations. Rainfall distribution was well represented, with maxima on the southeastern and higher mountain regions. EXP3 produced the best simulation in terms of both rainfall distribution and locations with high rainfall magnitude. However, there were sizeable differences between the model cyclone’s wind intensity and minimum sea-level pressure at model landfall and those of the observed storm. EXP2 and EXP3 produced a more realistic sea-level pressure between 988 and 992 hPa, and sustained winds of less than 87 mph, compared with 991 mbar and 60 mph of the observed storm, respectively. In conclusion, the simulation using the WSM 6-Class scheme (EXP3) appears to be strongly comparable with observations, and is the best choice for further investigations of the production of heavy orographic rainfall. Future study will examine some control parameters and common ingredients, such as Convective Available Potential Energy (CAPE), Precipitation Efficiency (E), and the impact of mountain height variations, to help understand the dynamical and physical processes associated with orographic precipitation induced by the passage of a TC.
The Significant Opportunities in Atmospheric Research and Science (SOARS) Program is managed by the University Corporation for Atmospheric Research (UCAR) with support from participating universities. SOARS is funded by the National Science Foundation, the National Oceanic and Atmospheric Administration (NOAA) Climate Program Office, the NOAA Oceans and Human Health Initiative, the Center for Multi-Scale Modeling of Atmospheric Processes at Colorado State University, and the Cooperative Institute for Research in Environmental Sciences. SOARS is a partner project with Research Experience in Solid Earth Science for Student (RESESS).
Page | 1
Colón-Pagán, SOARS 2009
1. Introduction
The passage of a tropical cyclone (TC) over a mesoscale mountainous island, such as Puerto Rico, often brings heavy rainfall. Such events can produce flooding, landslides, and debris flows, resulting in human causalities, structural damage, and economic loss. Factors that affect quantities and distribution of heavy rainfall events induced by TC landfall are not well understood. Previous research has studied these occurrences by varying several control parameters, such as Convective Available Potential Energy (CAPE) and mountain geometry. However, some questions are still unanswered regarding the relationship between these parameters and their effects on the production of heavy rainfall. Eventually, understanding this relationship will help improve the prediction of these significant heavy rainfall events in this and other regions.
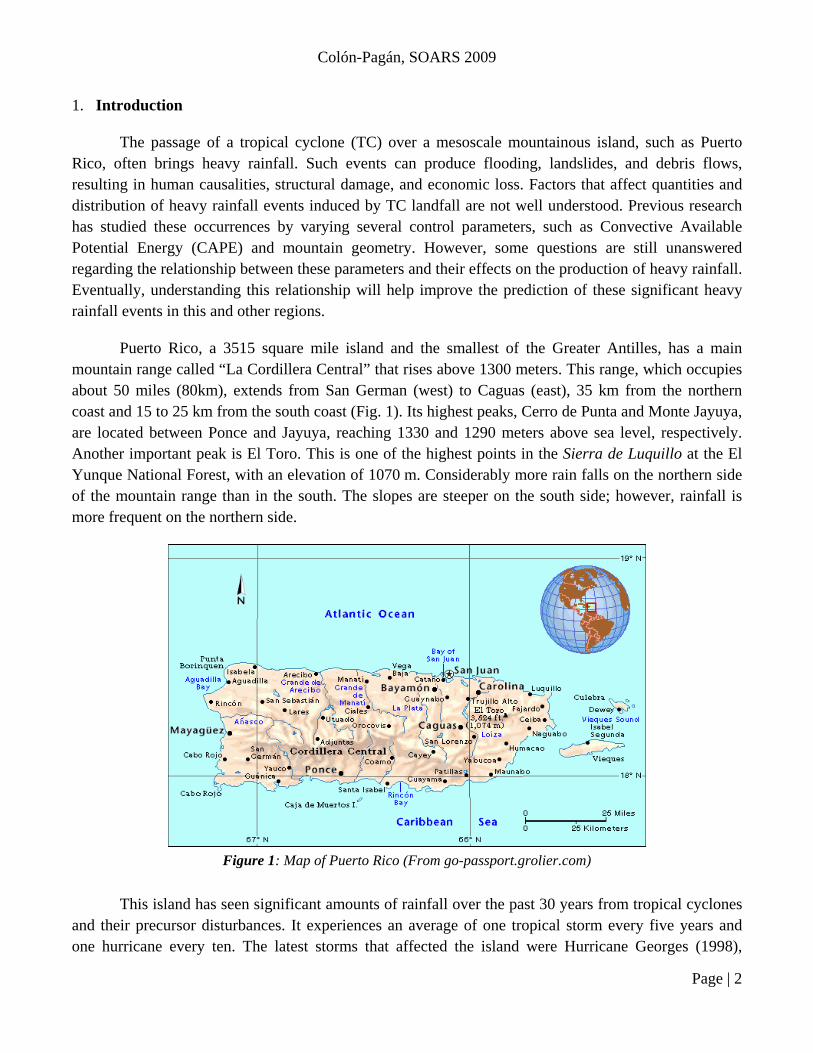
Puerto Rico, a 3515 square mile island and the smallest of the Greater Antilles, has a main mountain range called “La Cordillera Central” that rises above 1300 meters. This range, which occupies about 50 miles (80km), extends from San German (west) to Caguas (east), 35 km from the northern coast and 15 to 25 km from the south coast (Fig. 1). Its highest peaks, Cerro de Punta and Monte Jayuya, are located between Ponce and Jayuya, reaching 1330 and 1290 meters above sea level, respectively. Another important peak is El Toro. This is one of the highest points in the Sierra de Luquillo at the El Yunque National Forest, with an elevation of 1070 m. Considerably more rain falls on the northern side of the mountain range than in the south. The slopes are steeper on the south side; however, rainfall is more frequent on the northern side.
Figure 1: Map of Puerto Rico (From go-passport.grolier.com)
This island has seen significant amounts of rainfall over the past 30 years from tropical cyclones and their precursor disturbances. It experiences an average of one tropical storm every five years and one hurricane every ten. The latest storms that affected the island were Hurricane Georges (1998),
Page | 2

Colón-Pagán, SOARS 2009
Hurricane Jeanne as a tropical storm (2004), and the out-of-season Tropical Storm Olga in 2007. However, as mentioned for the island of Taiwan in Wifcraft et al. (2005), a tropical cyclone does not need to make landfall to cause damaging winds and heavy rainfall. In reality, since the year 2000 several tropical cyclones or their precursors have affected the island without a direct impact or landfall: Hurricane Debby in 2000, Hurricane Noel in 2007, and Tropical Storm Fay, Hurricane Hanna, and Hurricane Kyle during the 2008 Atlantic Hurricane Season.
a. Orographic Effects
In general, tropical cyclones are influenced by many meteorological factors that contribute to the production of heavy rainfall over land. Chen et al. (2005) state that the propagation of orographic precipitation systems may be controlled by basic wind speed (U), convective available potential energy (CAPE), and vertical wind shear. Orographic rainfall is produced by the lifting of air containing a significant amount of water vapor by the interaction with the mountain. As it moves upward, it cools and expands. Then it becomes saturated, so the vapor condensates and finally falls as precipitation. Moreover, an incoming airstream’s vertical moisture distribution and the mountain geometry are other supplementary flow parameters that can affect this process and determine the formation of orographically induced convective systems.
For tropical cyclone landfalls, the primary ingredients responsible for producing heavy rainfall over a mesoscale mountain appear to be the presence of a potentially unstable layer, a very moist airstream impinging on the mountain, and a low-level wind maximum associated with the outer circulation of the cyclone (Witcraft et al. 2005). Furthermore, it is strongly suggested by several authors that orographic rain is the result of a strong incoming flow and a quasi-stationary convective system located over the upslope side of the terrain. This effect can be associated with the magnitude of the convective available potential energy (CAPE) in the atmosphere (Chen et al 2005) and the orographic aspect ratio of mountain height-width (h/a) (Chen et al. 2008).
Near the center of a tropical cyclone and around the prominent feeder bands, the CAPE is very low, while this energy increases with distance from the center of circulation and on the windward side of a mountain range. CAPE associated with conditionally unstable airstreams, such as those related to tropical cyclones, might be released if the orographic forcing is sufficiently large to lift the incoming air parcels in the boundary layer above the level of free convection (LFC). Chen and Lin (2005) investigate the effects of CAPE on the generation and propagation of orographically generated precipitation systems by changing the model atmospheric temperature profile above 2 km. From this experiment they find that when the CAPE increases, the convective system can be located farther upstream with comparable orographic rainfall but different precipitation type (i.e. stratiform or convective). However, when the CAPE is low, the orographic rainfall amount is strongly dependent on the strength of the basic wind speed – the stronger the wind, the larger the amount of rainfall.
The mountain aspect ratio or height-width ratio can also play an essential role in dictating rainfall patterns along the mountain surface. For broader mountain ranges, it is observed that the
Page | 3

Colón-Pagán, SOARS 2009
maximum rainfall tends to be positioned on the upstream side of the mountain, while the maximum in precipitation is most likely to be positioned more toward the mountain peak or lee slope for narrow mountains. Colle (2004) studies the relationship between orographic precipitation distribution and environmental conditions with the terrain geometry for a stable airstream impinging on a two-dimensional, idealized mountain. He demonstrates that under a relatively weak mean flow, the slope determines the maximum amounts of precipitation. However, events of heavy rainfall are more likely to occur in the vicinity of wider and higher barriers than narrow barriers of the same aspect ratio.
Chen et al. (2008) observe that when the mountain height-width gets larger, which induces a larger lifting area, the convective system spreads more widely over the upslope, and the leading convective cell is located farther upstream. This explains why the convective system, and as a consequence, rainfall, can propagate further upstream when the mountain height-width gets larger. However, when varying the aspect ratio, results from Chen et al. (2008) show that the accumulated total rainfall for all these cases is about the same, even at different times. In other words, for a conditionally unstable flow, the total rainfall amount is insensitive to this control parameter, but the location of the convective system and the distribution of the precipitation can be very different from case to case. This concept should be tested for a region with a noteworthy aspect ratio, such as Puerto Rico.
Although orographic effects on producing heavy rainfall over a mountain island associated with the passage of tropical cyclones have been studied by some authors, some fundamental scientific questions remain unanswered. It is suggest by Chen et al. (2008) that flash floods may occur when quasi-stationary convective precipitation systems stay over the mountain or when abundant moisture is supplied for a significant period of time due to a low-level jet. For example, some of the unit discharge flood peaks in the stream gagging records of the USGS have occurred in Puerto Rico (Smith et al. 2005). Many of these flood peaks are associated with tropical cyclones. Hurricane Jeanne, which passed directly over the island on 14-15 September 2004 as a Tropical Storm, produced record flood peaks at numerous locations in Puerto Rico.
Recently, major improvements have been made to tropical cyclones (TCs) numerical simulations. Numerical weather prediction (NWP) models have become more sophisticated in the treatment of microphysical processes as the cost of high performance computing has decreased. Another improvement is the reduction of the grid spacing, which has an extraordinary impact in resolving fine-scale structures such as eye wall, feeder bands, and storm outflow (Witcraft et al. 2005). Moreover, physical package parameterization, such as microphysics and planetary boundary layer (PBL) parameterization, can have a great impact on the prediction of significant amounts of orographic rain, cyclonic track, and storm intensity. Witcraft et al. (2005) simulated Supertyphoon Bilis using the nonhydrostatic Penn State/NCAR Mesoscale Model Version 5 (MM5), and observed that the timing of the landfall in Taiwan lags behind the observed landfall by less than an hour. However, for the higher resolution simulations, rainfall distribution was well detailed with an overprediction over the mountains and southern regions of the island. In fact, these regions contained a positive precipitation efficiency,
Page | 4
Colón-Pagán, SOARS 2009
which is assumed to be a function of both the orographically induced vertical motion and the environmentally induced vertical motion.
A study of the passage of Hurricane Georges over Puerto Rico with the MM5 model results in simulations strongly comparable to observations, in terms of track, intensity, rainfall, and wind structure. The model track at landfall from the Cangiolosi et al. (1998) study is slightly different from the observed track, while the Orndorff et al. (1998) simulated track lags considerable time; however, the intensity was equal for both, near 970hPa. Regions of accumulated rainfall and wind structure over the Cordillera Central, strongly associated with the orographic enhancement, were correctly detected. Likewise, relative humidity (RH) on the entire troposphere was close to 100%, except on regions over and on the lee side of the mountains with low RH. This was consistent with observations by Cangiolosi et al. (1998) and Orndorff et al. (1998).
b. Cloud Microphysics
As reviewed by Prof. Robert Fovell (UCLA) and Dr. Hui Su (JPL) in their 2007 study of the impact of microphysics on hurricane track and intensity forecasts, a cloud is composed of billions of condensed water particles, which can include free-floating cloud droplets and ice crystals as well as snowflakes, moderate density graupel particles and higher density ice like hail. Numerical models cannot track every particle, so the physics of condensate creation, growth, destruction and motion has to be parameterized. "Cloud microphysics" or simply microphysics refers to how these processes are handled in a model. There are many microphysical schemes, employing different assumptions regarding condensate number and behavior. The microphysics parameterization schemes that were once used only in research are being adopted by operational agencies in the hope that explicit forecasts of clouds and precipitation will improve. These have been extensively tested and applied for different mesoscale systems in different geographical locations.
Some of the microphysics schemes available (WSM 5-Class, Ferrier Microphysics, and WSM 6-Class) are discussed in Aligo et al. (2005). In their study of the effects of different microphysical schemes on the mesoscale circulation and morphology of a bow echo, the Ferrier et al. microphysics within the higher resolution domain (4km) produced the best results as it reproduced convection over Nebraska, and had the most saturated environment just before convective initiation. On the other hand, a study of the air quality applications over the Iberian Peninsula by Borge et al. (2008) selected the WSM 6-Class scheme as part of the “best case” combination with great performance, along with the Yonsei University Planetary Boundary Layer (PBL) scheme. Although these studies are for mid-latitude regions, their results might not apply for subtropical and tropical regions.
To study orographic rain over Puerto Rico we must have a well-defined cyclone track, a comparable rainfall distribution, and a cyclone intensity that closely resembles observations. We adopted a mesoscale numerical model, the Advanced Research Weather and Research Forecast (ARW) model, to simulate tropical cyclones. The first case studied is Hurricane Jeanne from the 2004 Atlantic Hurricane Season, passing by the archipelago of Puerto Rico. This present study examines the
Page | 5

Colón-Pagán, SOARS 2009
microphysics options available in the ARW model. In particular, we investigate the following scientific problem: what would be the impact of microphysics schemes in a tropical cyclone simulation using the ARW model? This ARW model along with the experiment design and synoptic environments of Hurricane Jeanne will be described in Section 2. Section 3 will illustrate and discuss results of the numerical simulation, which include verification of the model and the effects of each microphysics option in cyclonic track, rainfall distribution, wind speed intensity, and central pressure. Concluding remarks and future work will be presented in Section 4 and 5, respectively.
2. Summary of Hurricane Jeanne, Model Description and Experiment Design
a. Summary of Hurricane Jeanne
Hurricane Jeanne was the tenth named storm, the seventh hurricane, and the fifth major hurricane of the 2004 Atlantic Hurricane Season. Jeanne formed from a tropical wave that moved from Africa to the eastern tropical Atlantic Ocean on 7 September (Lawrence and Cobb 2005), about 2000 miles to the east of the Leeward Islands. It was categorized as a Tropical Depression Eleven on September 13 and upgraded to a Tropical Storm the next day while it moved slowly over the Leeward Islands, about 235 miles southeast of San Juan. Influenced by a sub-tropical high-pressure system located to Jeanne’s north, its 10-15 mph west-northwestward path directed its center toward the Virgin Islands. Jeanne then made landfall in southeastern Puerto Rico around 16Z of September 15 as a 70 mph Tropical Storm with a minimum central pressure of 991 mbar. The center of rotation moved across Puerto Rico in about 12 hours, maintaining much of its intensity, then over the Mona Passage and inland at the eastern tip of the Dominican Republic just before Jeanne intensified to a category one hurricane. In Fig. 2, the tropical storm stage of Hurricane Jeanne is represented by the yellow line.
Figure 2: Track of Hurricane Jeanne as it crossed Puerto Rico on September 15, 2004. (Provided by the NOAA Coastal Service Center)
Page | 6

Colón-Pagán, SOARS 2009
Puerto Rico was impacted by tropical storm force winds and heavy rain up to ~20 inches, with flooding on a historic scale. Before landfall, Jeanne was nearing hurricane strength, with maximum sustained winds near 70 mph, and higher gusts and stronger winds in higher elevations. At landfall, the storm had an estimated minimum surface pressure of 991 mbar and tropical storm force winds extended outward up to 60 miles from the center. The observing site at San Juan Airport recorded a sustained wind of 49 mph, and the highest wind gust recorded of 71 mph. San Juan Doppler radar observations indicated that once the center of the storm made landfall along the southeast, it took a turn to the west across the municipalities of Arroyo, Patillas, Guayama, and Salinas and then turned to the north-northwest, crossing the central interior and moving over Vega Baja around 4 pm AST of September 15th.
At 5 pm AST Jeanne was located 25 miles west-southwest of San Juan over Arecibo and Barceloneta, with tropical storm force winds extending outward up to 70 miles from the center. Moving west-northwest near 8-10 mph, at 8 pm AST the center of tropical storm Jeanne was located over the northwestern towns of Puerto Rico with sustained winds near 65 mph. By 11 PM AST, the center of the tropical storm was located over open waters, about 20 miles west of Isabela, while a tropical cyclone warning remained in effect for Puerto Rico. By 5:00 am AST of the next day, the warning was discontinued while the storm’s center was located about 68 miles west of Aguadilla over the Mona Passage. At this time, the storm was moving west-northwestward near 9 mph with sustained tropical storm winds near 70 mph, threatening the Dominican Republic and Haiti (Hispaniola).
Figure 3: Accumulated rainfall from the passage of Hurricane Jeanne over Puerto Rico in 2004. (Provided by the Hydrometeorological Prediction Center)
Page | 7

Colón-Pagán, SOARS 2009
Jeanne's slow movement across Puerto Rico contributed to torrential rainfall along its path, with documented maximums of 19.22” in Aibonito (Fig. 3), ~20” near the El Yunque National Forest, ~15” over Sierra de Cayey towards the southeast, and more than 15” within the central mountain range (Fig. 4). However, an unofficial observation reported the highest storm total rainfall amount at Camp Garcia in Vieques, 24 inches. This excessive rainfall resulted in damage to roads, landslides, and collapsed bridges. A total of eight people were reported dead in Puerto Rico as a result of Jeanne’s passage through the island.
Figure 4:5-day rainfall accumulation during the passage of Hurricane Jeanne over Puerto Rico in 2004. (Provided by NOAA’s Earth System Research Laboratory)
b. Model Description and Experiment Design
The Advanced Research Weather Research and Forecasting (ARW) Model is a next-generation mesoscale numerical weather prediction system designed to serve both operational forecasting and atmospheric research needs (Skamarock et al. 2008). ARW is a fully compressible, three-dimensional (3D) nonhydrostatic model with terrain-following hydrostatic-pressure vertical coordinates. The ARW model can be used for a wide range of applications, from idealized research to operational forecasting, with an emphasis on horizontal grid sizes in the range of 1-10 km. Also, this model is suitable for applications on different scales, including mesoscale systems such as tropical cyclones. The National Center for Environmental Prediction (NCEP) Final Analyses (FNL) data, product from the Global Forecast System (GFS) with a global latitude/longitude 1.0 degree resolution, is used for initialization and boundary conditions during the model integration for Hurricane Jeanne. The FNL analyses are available on the surface, at 26 mandatory (and other pressure) levels from 1000mb to 10mb. The model is initialized at 0000 UTC September 14 and integrated for 120 hours.
In this study, a third order Runge-Kutta scheme with smaller time step for acoustic and gravity-wave modes is used. For atmospheric longwave and shortwave radiation physics, the Dudhia scheme and Rapid Radiative Transfer Model (RRTM) are applied, respectively. The Yonsei University (YSU) scheme is used to parameterize the Planetary Boundary Layer (PBL) while a 5-layer thermal diffusion
Page | 8
Colón-Pagán, SOARS 2009
soil-temperature-only scheme was selected for land surface. Finally, the Kain-Fritsch scheme, with a deep and shallow sub-grid scale convection, is utilized for cumulus parameterization.
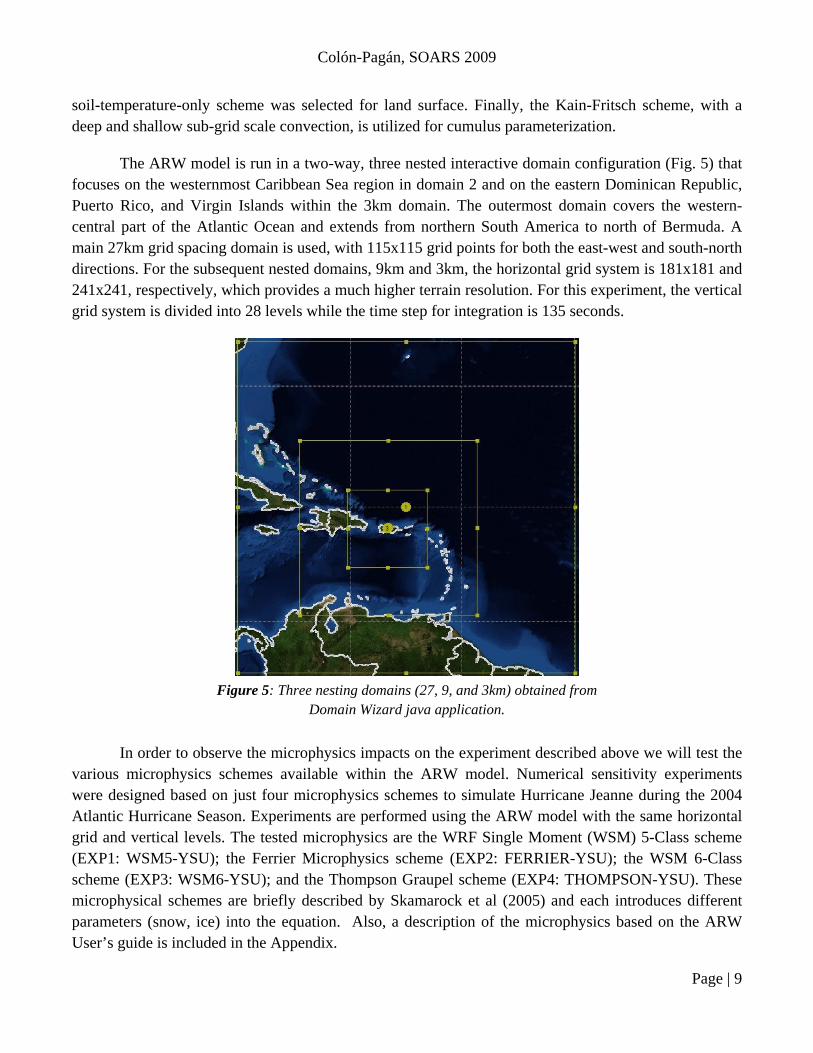
The ARW model is run in a two-way, three nested interactive domain configuration (Fig. 5) that focuses on the westernmost Caribbean Sea region in domain 2 and on the eastern Dominican Republic, Puerto Rico, and Virgin Islands within the 3km domain. The outermost domain covers the western-central part of the Atlantic Ocean and extends from northern South America to north of Bermuda. A main 27km grid spacing domain is used, with 115x115 grid points for both the east-west and south-north directions. For the subsequent nested domains, 9km and 3km, the horizontal grid system is 181x181 and 241x241, respectively, which provides a much higher terrain resolution. For this experiment, the vertical grid system is divided into 28 levels while the time step for integration is 135 seconds.
Figure 5: Three nesting domains (27, 9, and 3km) obtained from Domain Wizard java application.
In order to observe the microphysics impacts on the experiment described above we will test the various microphysics schemes available within the ARW model. Numerical sensitivity experiments were designed based on just four microphysics schemes to simulate Hurricane Jeanne during the 2004 Atlantic Hurricane Season. Experiments are performed using the ARW model with the same horizontal grid and vertical levels. The tested microphysics are the WRF Single Moment (WSM) 5-Class scheme (EXP1: WSM5-YSU); the Ferrier Microphysics scheme (EXP2: FERRIER-YSU); the WSM 6-Class scheme (EXP3: WSM6-YSU); and the Thompson Graupel scheme (EXP4: THOMPSON-YSU). These microphysical schemes are briefly described by Skamarock et al (2005) and each introduces different parameters (snow, ice) into the equation. Also, a description of the microphysics based on the ARW User’s guide is included in the Appendix.
Page | 9

Colón-Pagán, SOARS 2009
The model prediction of 120-hour accumulated precipitation for each model run using the above microphysics schemes are examined. Results from these experiments will then be compared with observations for verification. A qualitative comparison of the accumulated rainfall with the total amounts recorded is performed. For analysis purpose, we will utilize rainfall accumulation data from NOAA's Earth System Research Laboratory (ESRL) / Global Systems Division (GSD) and the Hydrometeorological Prediction Center (HPC). The location of the maximum amount and distribution of precipitation is what is important in this case study. Cyclonic track, wind speed intensity, and central pressure will be compared with data collected in the Tropical Cyclone Report for Hurricane Jeanne by the National Hurricane Center.
3. Results and Discussion
To ensure a meaningful study of rainfall induced by the passage of tropical cyclones over mountainous islands, a realistic topography and simulation of cyclonic track strongly comparable to observations must be used in the study. Figure 6 shows the topography of Puerto Rico reproduced by the Advanced Research Weather and Research Forecast (ARW) model for 3km simulation. This is the domain of highest resolution in the two-way, triple nested simulation. The ARW model reproduced the locations of Puerto Rico’s higher altitude regions, such as El Yunque National Forest to the east of the island and the Cordillera Central within the center. However, the ARW model could not fully reproduce peak height, missing nearly half of the actual elevation. For the highest peak, Cerro de Punta, located around latitude 18.2o North and longitude 66.5o West, the ARW model missed close to 600 meters from its nearly 1400-meter elevation. Moreover, 500 meters out of its 1100-meter height were not reproduced for El Yunque, located towards the eastern tip of the island.
Figure 6: Terrain sketch for Puerto Rico in meters. Made with the Grid Analysis and Display System (GrADS) for the 3km nested domain.
Page | 10
Colón-Pagán, SOARS 2009
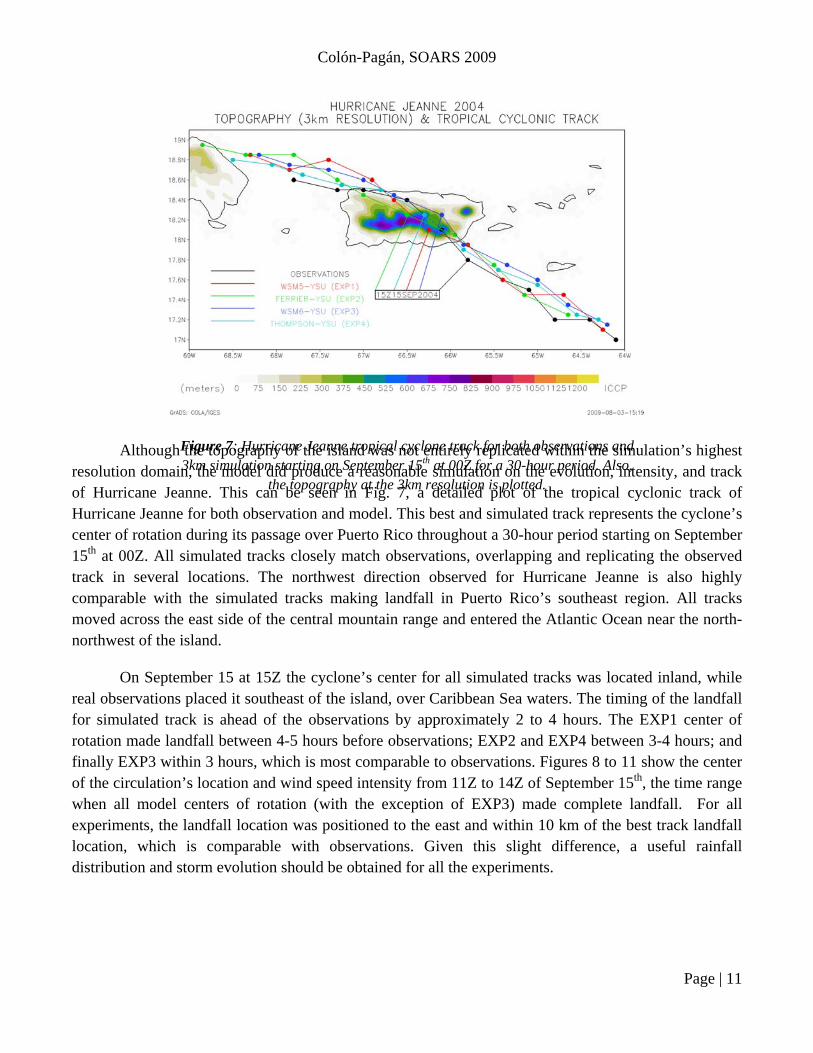
Figure 7: Hurricane Jeanne tropical cyclone track for both observations and 3km simulation starting on September 15th at 00Z for a 30-hour period. Also,
the topography at the 3km resolution is plotted.
Although the topography of the island was not entirely replicated within the simulation’s highest resolution domain, the model did produce a reasonable simulation on the evolution, intensity, and track of Hurricane Jeanne. This can be seen in Fig. 7, a detailed plot of the tropical cyclonic track of Hurricane Jeanne for both observation and model. This best and simulated track represents the cyclone’s center of rotation during its passage over Puerto Rico throughout a 30-hour period starting on September 15th at 00Z. All simulated tracks closely match observations, overlapping and replicating the observed track in several locations. The northwest direction observed for Hurricane Jeanne is also highly comparable with the simulated tracks making landfall in Puerto Rico’s southeast region. All tracks moved across the east side of the central mountain range and entered the Atlantic Ocean near the north-northwest of the island.
On September 15 at 15Z the cyclone’s center for all simulated tracks was located inland, while real observations placed it southeast of the island, over Caribbean Sea waters. The timing of the landfall for simulated track is ahead of the observations by approximately 2 to 4 hours. The EXP1 center of rotation made landfall between 4-5 hours before observations; EXP2 and EXP4 between 3-4 hours; and finally EXP3 within 3 hours, which is most comparable to observations. Figures 8 to 11 show the center of the circulation’s location and wind speed intensity from 11Z to 14Z of September 15th, the time range when all model centers of rotation (with the exception of EXP3) made complete landfall. For all experiments, the landfall location was positioned to the east and within 10 km of the best track landfall location, which is comparable with observations. Given this slight difference, a useful rainfall distribution and storm evolution should be obtained for all the experiments.
Page | 11

Colón-Pagán, SOARS 2009
Page | 12
Figure 8: Wind speed intensity and center of circulation during model landfall for Hurricane Jeanne on September 15th at 11Z.
Figure 9: Wind speed intensity and center of circulation during model landfall for Hurricane Jeanne on September 15th at 12Z.

Colón-Pagán, SOARS 2009
Page | 13
Figure 10: Wind speed intensity and center of circulation during model landfall for Hurricane Jeanne on September 15th at 13Z.
Figure 11: Wind speed intensity and center of circulation during model landfall for Hurricane Jeanne on September 15th at 14Z.

Colón-Pagán, SOARS 2009
For Hurricane Jeanne (2004), the model overpredicted its wind speed intensity during all experiments. Unlike the wind, the sea-level (central) pressure was well simulated by some of the experiments. At 12Z and 18Z of September 14th, a reconnaissance flight measured maximum tropical storm-sustained winds close to 32 m/s and minimum central pressure of 991 mbar. Over land, the observing site at San Juan Airport recorded a 2-minute sustained wind of near 22 m/s, a peak gust of 32 m/s, and a minimum central pressure of 1004.1 mbar. Sea-level pressure minimums at landfall and during the following 6 hours are represented in Figs. 12 to 14. EXP2 produced a highly comparable sea-level pressure between 990 and 992 mbar at model landfall. It kept this pressure range at 15Z September 15th, and at 18Z of the same day the minimum sea-level pressure changed to a lower range between 988 and 990 mbar. EXP3 showed the same pattern at a lower range, shifting from a 988-990 mbar to 986-988 mbar at 18Z. The EXP1 sea-level pressure changed from 986-988 mbar to the next higher range at 15Z and maintained it for three more hours. Finally, the sea-level pressure for EXP4 was overpredicted at all times within the 974-982 mbar ranges. All experiments showed an increase of sea-level pressure after landfall, either at the 3-hour or 6-hour period. This demonstrates that the topography has an important impact on this variable, resulting in an intensity reduction.
Figure12: Simulated sea-level (central) pressure for Hurricane Jeanne at 12Z September 15, 2004.
Page | 14

Colón-Pagán, SOARS 2009
Page | 15
Figure 13: Simulated sea-level (central) pressure for Hurricane Jeanne at 15Z September 15, 2004.
Figure14: Simulated sea-level (central) pressure for Hurricane Jeanne at 18Z September 15, 2004.

Colón-Pagán, SOARS 2009
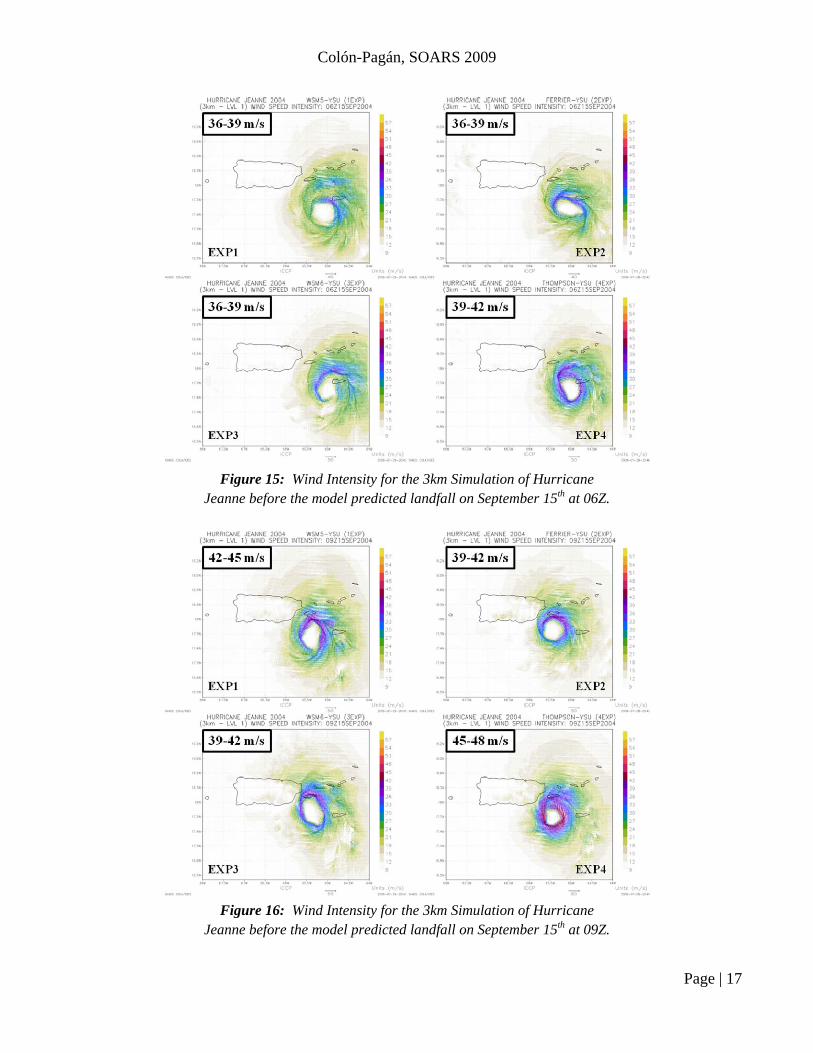
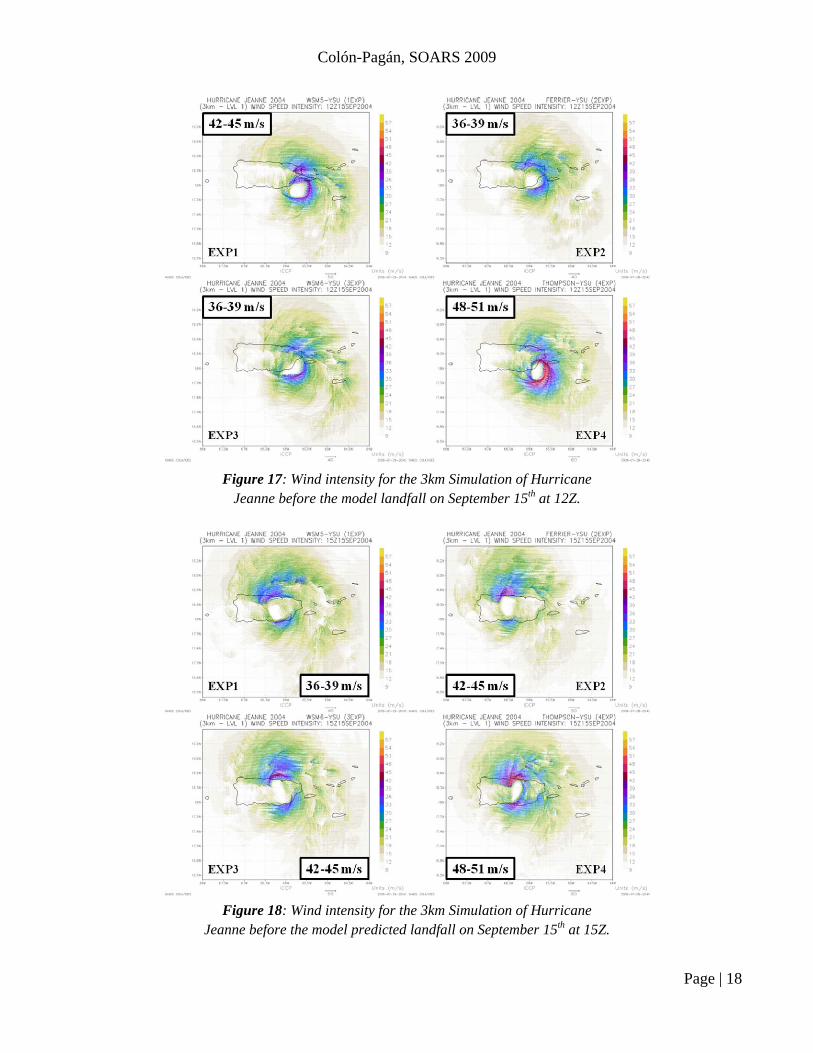
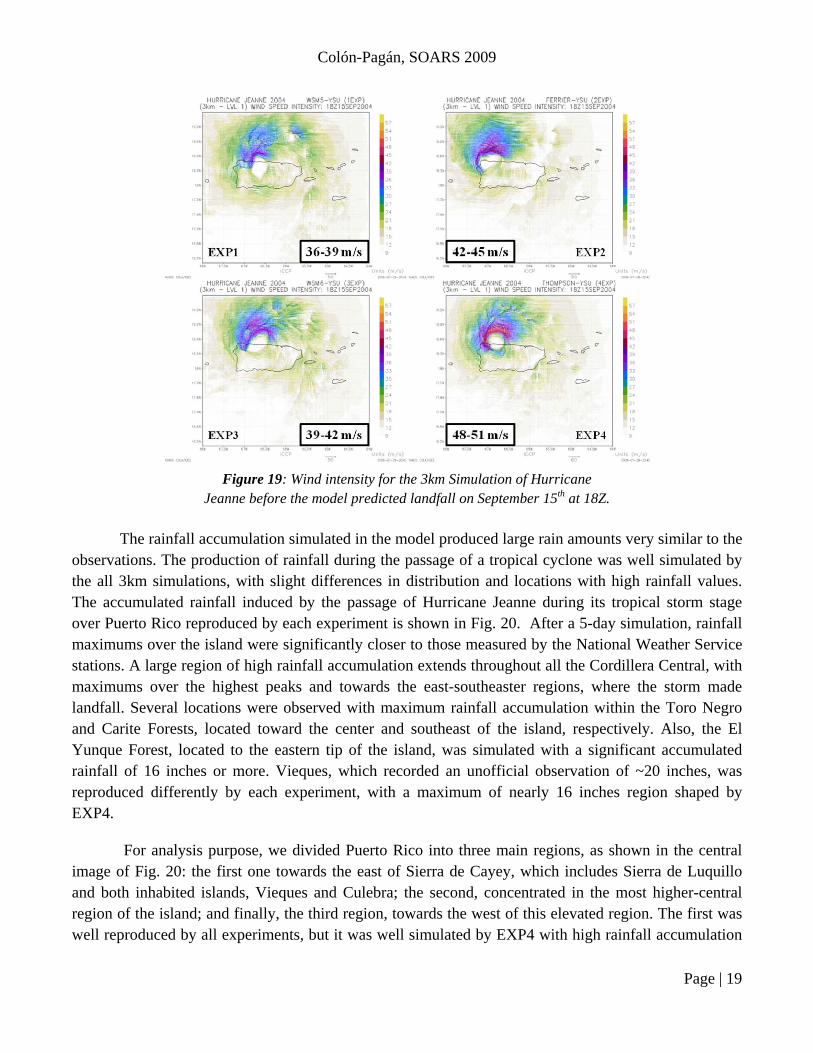
Model simulations for wind-speed intensity were overpredicted at all times: before, during, and after landfall. Figures 15 to 19 represent the wind-speed intensity of Jeanne starting at 06Z and ending at 18Z of September 15th 2004. This intensity is inconsistent with what was truly observed. Experiments have maximum winds that contrast with the tropical cyclone’s reality in later stages, before it made landfall in Florida. The model reproduced maximum winds that represent a category 1 to 3 hurricane and not a tropical storm event. EXP1 to EXP3 had the lowest maximum sustained winds between 36-39 meters per seconds, which represents a category one hurricane. This occurred at 06Z when the center of rotation was over warmer Caribbean Sea waters, at 12Z exactly before landfall for EXP2 and EXP3, and only maintained at that range for EXP1 until 18Z. The rest of the model-observed time maximum sustained winds varied between 39 and 51 m/s, far from observations. For EXP4, the overprediction was the highest at all times with maximum sustained winds of 39-42, 45-48, and 48-51 meters per second at 06Z, 09Z, and 12Z-18Z, respectively.
A region of strong winds to the north of the center was present most of the time. Only at landfall, and when the topography interaction was evident, another pattern was observed. Strong winds shifted from the eastern side of the eye wall to the western side, but always within the northern areas of the system. EXP3 and EXP4 showed regions of strong winds to the southeast of the eye-wall before landfall, a section still in contact with warmer waters. A wind-speed increase was clear before landfall for all experiments, but there is a strong disagreement during and after it. EXP1 showed a significant increment in wind speed before landfall, followed by a reduction after landfall, which maintain until 18Z. As for to EXP1, EXP2 showed intensification before landfall and a decrease in intensity at landfall; but unlike EXP1, it showed intensification when its center was over the island and its northern region started to interact with more turbulent waters of the Atlantic Ocean. The pattern in EXP3 was similar for those of EXP1 an EXP2, strengthening before landfall, decreasing during landfall, and strengthening when it interacted with the ocean, but the intensity was reduced when half of its center of circulation reached the Atlantic waters. Moreover, EXP4 showed strengthening at all times, which is contrary to observations and other experiments.
Even though there was a persistent wind speed overprediction for all the experiments developed, EXP3 produced more reliable wind speed and pattern intensities when compared to the other experiments. It was evident that the mountain made a significant change in the storm intensity. Jeanne made landfall for both model and observations within the southeastern coast of Puerto Rico, where Sierra de Cayey and Sierra de Luquillo are located. Then, with its north-northwest path, it interacted with the central mountain range, located further west. However, this excessive wind intensity overprediction for all experiments, which strongly differs from the barely tropical storm winds observed in the island, could be an important factor in the determination of rainfall distribution, mainly over the mountains and higher regions.
Page | 16
Colón-Pagán, SOARS 2009
Page | 17
Figure 15: Wind Intensity for the 3km Simulation of Hurricane Jeanne before the model predicted landfall on September 15th at 06Z.
Figure 16: Wind Intensity for the 3km Simulation of Hurricane Jeanne before the model predicted landfall on September 15th at 09Z.
Colón-Pagán, SOARS 2009
Page | 18
Figure 17: Wind intensity for the 3km Simulation of Hurricane Jeanne before the model landfall on September 15th at 12Z.
Figure 18: Wind intensity for the 3km Simulation of Hurricane Jeanne before the model predicted landfall on September 15th at 15Z.
Colón-Pagán, SOARS 2009
Page | 19
Figure 19: Wind intensity for the 3km Simulation of Hurricane Jeanne before the model predicted landfall on September 15th at 18Z.
The rainfall accumulation simulated in the model produced large rain amounts very similar to the observations. The production of rainfall during the passage of a tropical cyclone was well simulated by the all 3km simulations, with slight differences in distribution and locations with high rainfall values. The accumulated rainfall induced by the passage of Hurricane Jeanne during its tropical storm stage over Puerto Rico reproduced by each experiment is shown in Fig. 20. After a 5-day simulation, rainfall maximums over the island were significantly closer to those measured by the National Weather Service stations. A large region of high rainfall accumulation extends throughout all the Cordillera Central, with maximums over the highest peaks and towards the east-southeaster regions, where the storm made landfall. Several locations were observed with maximum rainfall accumulation within the Toro Negro and Carite Forests, located toward the center and southeast of the island, respectively. Also, the El Yunque Forest, located to the eastern tip of the island, was simulated with a significant accumulated rainfall of 16 inches or more. Vieques, which recorded an unofficial observation of ~20 inches, was reproduced differently by each experiment, with a maximum of nearly 16 inches region shaped by EXP4.
For analysis purpose, we divided Puerto Rico into three main regions, as shown in the central image of Fig. 20: the first one towards the east of Sierra de Cayey, which includes Sierra de Luquillo and both inhabited islands, Vieques and Culebra; the second, concentrated in the most higher-central region of the island; and finally, the third region, towards the west of this elevated region. The first was well reproduced by all experiments, but it was well simulated by EXP4 with high rainfall accumulation

Colón-Pagán, SOARS 2009
over Sierra de Cayey and El Yunque National Forest. EXP2 and EXP3 reproduced this region reasonably well, missing some rainfall peak locations towards the central-southeastern region of the island. Region 2 was simulated with modest skill given that none of the experiments reproduced an area of high peaks towards the eastern side of the central mountain range, as represented within the southeast part of the hexagon in Fig. 20. Finally, region three had the lowest observed maximum amounts of accumulated rainfall of less than ~10 inches. Only EXP1 and EXP3 simulated this region with comparable results. EXP2 and EXP4 reproduced a region of high peaks that strongly disagrees with observations toward the southwest of the central mountain range and northwest of the island, respectively.
In general EXP1 underpredicted accumulated rainfall among all three regions, resulting in a defective simulation. EXP2 and EXP4 agreed with observations in the first and second regions, but overpredicted in the western-most locations. However, EXP3 rain accumulation simulation resulted as the one that closely matches observations, with well-defined high peaks and smooth rainfall distribution where the storm made landfall and on regions of high elevation.
Figure 20: 5-day rainfall accumulation for the passage of Hurricane Jeanne over Puerto Rico in 2004.
Page | 20

Colón-Pagán, SOARS 2009
4. Conclusion
The objective of this research is to obtain a simulation that compares well with observations for Hurricane Jeanne (2004). The experiments conducted to date were based on a numerical simulation of this event using the Advanced Research Weather Research and Forecasting (ARW) model version 3.1. A two-way, triple nested domain configuration was required to fulfill the project’s objective. The model simulations showed cyclonic track and landfall time and location that closely match observations. EXP3 had the closest landfall time and location, within a 3-hour difference and less than 5 km, respectively. For storm intensity, the experiment that uses the Eta Ferrier scheme (EXP2) had the sea-level pressure that most closely represents observations. Wind speed intensity varied significantly among experiments and was strongly overpredicted for the analyzed period. However, the EXP3 simulation produced maximum sustained winds comparable to observations over land and water.
Model runs using the different microphysical schemes produced precipitation amounts that were approximately in the same areas, over higher altitude regions and near landfall location. The horizontal distribution of the 120-hr accumulated rainfall for hurricane Jeanne (2004) was well reproduced by EXP3. Locations with high magnitudes of rainfall were consistent with observations for every experiment, with a maximum of more than 22” near El Yunque National Forest and within the Cordillera Central peaks. One exception is those experiments that exaggerated amounts in the west side of Puerto Rico, EXP2 and EXP4, with the Eta Ferrier and Thompson graupel schemes, respectively.
Rarely, a particular scheme or option produced the best results for all the parameters and/or locations, so the selection was guided by the aggregated performance more than microphysics expertise. The option identified as producing the best results overall is EXP3, which uses the WRF Single Moment (WSM) 6-Class microphysics scheme. The outputs from this experiment confirm that, in general, this configuration provides better performance than any of the other experiments carried out. The differences in the accumulated rainfall and storm intensity can be related to the water-based particles processes considered by the microphysics scheme use. Different schemes consider melting snow, graupel or riming processes, cloud and ice processes differently. However, more analysis must be done in order to completely understand the effects of microphysics in tropical cyclones simulations with the ARW model. This could be possible by simply varying other physical parameters available in the model or by using other initial conditions, such as data from the European Centre for Medium-Range Weather Forecasts (ECMWF).
5. Future Work
Future work includes the variation of the Planetary Boundary Layer (PBL) and other Microphysics schemes of the ARW model to ensure a simulation that compares most closely with observations. The PBL will be varied within the YSU (1) and the Eta (2) schemes. For the microphysics options, we will include the Lin et al. scheme (EXP5), a sophisticated scheme that includes ice, snow, and graupel processes, and is suitable for real-data, high-resolution simulations. This set of experiments will provide up to 6 potential simulations to compare, in terms of rainfall, track, and wind speed
Page | 21
Colón-Pagán, SOARS 2009
intensity. This will help us obtain the control experiment by changing the two main processes responsible for the production of heavy orographic rainfall in the model, physical and dynamical. This will eventually produce the simulation that best compares with observations.
Subsequently, the orographic effects will be studied while varying CAPE and aspect ratio (h/a), and observing their impact on the production of rainfall. We will also investigate and determine whether the environment or the orographic low-level vertical motion has the greatest impact on the production of rainfall during the passage of a tropical cyclone over Puerto Rico. Finally, we will study the total precipitation equation (P), which is the product of CAPE, integrated precipitable water, precipitation efficiency, and the combined environmental and orographic vertical motion, as discussed in Lin et al. 2001.
6. Acknowledgements
I would like to thank Dr. Bill Kuo and Dr. Bill Schreiner from UCAR, Dr. Yuh-Lang Lin from NCA&TSU, and Dr. Steve Koch from NOAA’s Earth System Research Laboratories (ESRL) for their constant scientific support. Also, I thank Wei Wang from the Microscale and Mesoscale Meteorology (MMM) Division for her help with the set up of the WRF ARW model and additional technical support. I would strongly thank and recognize Sara Frank Bristow from the Constellation Observing System for Meteorology, Ionosphere, and Climate (COSMIC) Program for her extraordinary writing and communication support. Finally, I would like to thank the SOARS Staff for their unconditional support. I can state that I am where I am thanks to them and every person involved with the SOARS Program; funders, mentors, and NCAR/UCAR staff.
7. References
Aligo, E.A. and W.A.Gallus, JR, 2005: The Impact of Different Microphysical Schemes on Mesoscale Circulations and Convective System Morphology in 4-10 km Grid Spacing WRF Simulations. July 30, 2009. <http://74.125.155.132/search?q=cache:2zM2JEHRCTEJ:ams.confex.com/ams/ pdfpapers/94708.pdf+The+Impact+of+Different+Microphysical+Schemes+on+Mesoscale+Circulations+and+Convective+System+Morphology+in+4-10+km+Grid+Spacing+WRF+Simulations&cd= 1&hl=en&ct=clnk&gl=us&client=firefox-a>
Borge, R., V. Alexandrov, J.J. del Vas, J. Lumbreras, and E. Rodriguez, 2008: A comprehensive sensitivity analysis of the WRF model for air quality applications over the Iberian Peninsula. July 31st 2009. < http://www.sciencedirect.com/science?_ob=ArticleURL&_udi=B6VH3-4TDVMKT-1&_user=918210&_rdoc=1&_fmt=&_orig=search&_sort=d&_docanchor=&view =c&_searchStrId=970725632&_rerunOrigin=google&_acct=C000047944&_version=1&_urlVersion=0&_userid=918210&md5=db689ee22b3126716ac2d7544b70496c#bbib45>
Cangoliosi, J. and S.S. Chen, 1998: A Numerical Study of the Topography Effects on Structure and Rainfall in Hurricane Georges (1998). June 19th 2009. < http://docs.google.com/gview?a=v&q=
Page | 22

Colón-Pagán, SOARS 2009
cache:Xyn4mxI1Q-gJ:ams.confex.com/ams/pdfpapers/36929.pdf+a+numerical+study+of+the+ topography+effects+on+structure+and+rainfall+in+hurricane+georges&hl=en&gl=us>
Chen, S.-H. and Y.-L. Lin, 2005: Effects of Moist Froude Number and CAPE on a Conditionally Unstable Flow over a Mesoscale Mountain Ridge. Journal of the Atmospheric Sciences, 62, 331-350.
Chen, S.-H., Y.-L. Lin, and Z. Zhao, 2008: Effects of Unsaturated Moist Froude Number and Orographic Aspect Ratio on a conditionally Unstable Flow over a Mesoscale Mountain. Journal of the Meteorological Society of Japan, 86, 353-367.
Chien, F.-C., Y.-C. Liu, and C.-S. Lee, 2008: Heavy Rainfall and Southwesterly flow after the Leaving of Typhoon Mindulle (2004) from Taiwan. Journal of the Meteorological Society of Japan, 86, 17-41.
Colle, B.A., 2004: Sensitivity of Orographic Precipitation to Changing Ambient Conditions and Terrain geometries: An Idealized Modeling Perspective. Journal of the Atmospheric Science, 61, 588-606.
Fovell, R., and H. Su., 2007: Impact of Microphysics on Hurricane Track and Intensity Forecasts, Connecting state-of-the-art satellite observations and hurricane forecast models. July 18th, 2009. <http://mls.jpl.nasa.gov/research/hurricanes.php>
Lawrence, M. B. and H. D. Cobb, 2005: Tropical Cyclone Report: Hurricane Jeanne. National Hurricane Center, 1-20.
Lin, Y.-L., S. Chiao, T.-A. Wang, M. L. Kaplan, and R. P. Weglarz, 2001: Some Common Ingredients for Heavy Orographic Rainfall. Weather and Forecasting, 16, 633-660.
Lin, Y.-L., N. C. Witcraft, and Y.-H. Kuo, 2006: Dynamics of Track Deflection Associated with the Passage of Tropical Cyclones over a Mesoscale Mountain. Monthly Weather Review, 134, 3509-3538.
Nykanen, D.K., and D. Harris, 2003: Orographic Influences on the Multiscale Statistical Properties of Precipitation. Journal of Geophysical Research, 108(D8), 8381, doi:10.1029/2001JD001518, 1-13.
Skamarock, W. C., J. B. Klemp, J. Dudhia, D. O. Gill, D. M. Barker, M. Duda, X.-Y. Huang, W. Wang and J. G. Powers, 2008: A Description of the Advanced Research WRF Version 3. NCAR Technical Note, 2008. 13 July 2009. < http://www.mmm.ucar.edu/wrf/users/docs/ arw_v3.pdf>
Smith, J. A., P. Sturdenvant-Rees, M.L. Baeck, and M. C. Larsen, 2005: Tropical Cyclones and the Flood Hydrology of Puerto Rico. Water Resources Research, 41, W06020, doi:10.1029/2004WR003530, 1-16.
Witcraft, N.C., Y.-L. Lin, and Y.-H. Kuo, 2005: Dynamics of Orographic Rain Associated with the Passage of a Tropical Cyclone over a Mesoscale Mountain. Terrestrial, Atmospheric, and Oceanic Sciences, 16, 1133-1161.
“National Centers for Environmental Prediction - Hydrometeorological Prediction Center” Tropical Cyclone Rainfall Data 2009. Ed. David Roth. 2009. National Oceanic and Atmospheric
Page | 23

Colón-Pagán, SOARS 2009
Administration/National Weather Service. 10 June 2009. <http://www.hpc.ncep.noaa.gov/ tropical/rain/tcrainfall.htm>
Appendix: Microphysics description from the ARW User’s Guide
a. WRF Simple Moment 5-Class Scheme
This scheme is similar to the WSM3 simple ice scheme. However, vapor, rain, snow, cloud ice, and cloud water are held in five different arrays. Thus, it allows supercooled water to exist, and a gradual melting of snow falling below the melting layer. Details can be found in Hong et al. (2004), and Hong and Lim (2006). As with WSM6, the saturation adjustment follows Dudhia (1989) and Hong et al. (1998) in separately treating ice and water saturation processes, rather than a combined saturation such as the Purdue Lin (above) and Goddard (Tao et al., 1989) schemes. This scheme is efficient in intermediate grids between the mesoscale and cloud-resolving grids.
b. WRF Simple Moment 6-Class Scheme
The six-class scheme extends the WSM5 scheme to include graupel and its associated processes. Some of the graupel-related terms follow Lin et al. (1983), but its ice-phase behavior is much different due to the changes of Hong et al. (2004). A new method for representing mixed-phase particle fall speeds for the snow and graupel particles by assigning a single fall speed to both that is weighted by the mixing ratios, and applying that fall speed to both sedimentation and accretion processes is introduced (Dudhia et al., 2008). The behavior of the WSM3, WSM5, and WSM6 schemes differ little for coarser mesoscale grids, but they work much differently on cloud-resolving grids. Of the three WSM schemes, the WSM6 scheme is the most suitable for cloud-resolving grids, considering the efficiency and theoretical backgrounds (Hong and Lim, 2006).
c. Eta Grid-scale Cloud and Precipitation (2001) Scheme
This is also known as EGCP01 or the Eta Ferrier scheme. The scheme predicts changes in water vapor and condensate in the forms of cloud water, rain, cloud ice, and precipitation ice (snow/graupel/sleet). The individual hydrometeor fields are combined into total condensate, and it is the water vapor and total condensate that are advected in the model. Local storage arrays retain first-guess information that extract contributions of cloud water, rain, cloud ice, and precipitation ice of variable density in the form of snow, graupel, or sleet. The density of precipitation ice is estimated from a local array that stores information on the total growth of ice by vapor deposition and accretion of liquid water. Sedimentation is treated by partitioning the time averaged flux of precipitation into a grid box between local storage in the box and fall out through the bottom of the box. This approach, together with modifications in the treatment of rapid microphysical processes, permits large time steps to be used with stable results. The mean size of precipitation ice is assumed to be a function of temperature following the observational results of Ryan (1996). Mixed-phase processes are now considered at temperatures warmer than -30C (previously -10C), whereas ice saturation is assumed for cloudy conditions at colder
Page | 24
Colón-Pagán, SOARS 2009
Page | 25
temperatures. Further description of the scheme can be found in Sec. 3.1 of the November 2001 Technical Procedures Bulletin (TPB) at http://www.emc.ncep.noaa.gov/mmb/mmbpll/eta12tpb/ and on the COMET page at http://meted.ucar.edu/nwp/pcu2/etapcp1.htm.
d. Thompson et al. scheme
A new bulk microphysical parameterization (BMP) has been developed for use with WRF or other mesoscale models. Compared to earlier single-moment BMPs, the new scheme incorporates a large number of improvements to both physical processes and computer coding plus employs many techniques found in far more sophisticated spectral/bin schemes using look-up tables. Unlike any other BMP, the assumed snow size distribution depends on both ice water content and temperature and is represented as a sum of exponential and gamma distributions. Furthermore, snow assumes a non-spherical shape with a bulk density that varies inversely with diameter as found in observations and in contrast to nearly all other BMPs that assume spherical snow with constant density. New features specific to this version of the bulk scheme compared to the Thompson et al. (2004) paper description include:
i. generalized gamma distribution shape for each hydrometeor species, ii. non-spherical, variable density snow, and size distribution matching observations,
iii. y-intercept of rain depends on rain mixing ratio and whether apparent source is melted ice,
iv. y-intercept of graupel depends on graupel mixing ratio, v. a more accurate saturation adjustment scheme,
vi. variable gamma distribution shape parameter for cloud water droplets based on observations,
vii. look-up table for freezing of water drops, viii. look-up table for transferring cloud ice into snow category,
ix. improved vapor deposition/sublimation and evaporation, x. variable collection efficiency for rain, snow, and graupel collecting cloud droplets,
xi. improved rain collecting snow and graupel.