overview - surveillance, epidemiology, and end results … · seer cancer statistics review...
TRANSCRIPT
SEER Cancer Statistics Review 1973-1999 National Cancer Institute
OVERVIEW
BACKGROUND AND DATA SOURCES
There are three measures that are commonly used to assess the impact of cancer in the generalpopulation. The incidence rate is the number of new cases per year per 100,000 persons. Themortality rate is the number of deaths per year per 100,000 persons. The survival rate is the proportionof patients alive at some point subsequent to the diagnosis of their cancer. All three measures areemployed in this report. The Surveillance, Epidemiology, and End Results (SEER) Program(http://seer.cancer.gov) — based within the Surveillance Research Program (SRP) at the NationalCancer Institute (NCI) — collects incidence and survival data for all areas that participate in theProgram. The National Center for Health Statistics (NCHS) provides mortality data for the entire UnitedStates (US). All incidence and mortality rates in this report are age-adjusted (see below) to the 2000 USstandard million population (see Appendix) unless otherwise specified. Age adjustment minimizes theeffect of a difference in age distributions when comparing rates. Data are presented for a wide spectrumof cancers.
The annual SEER Cancer Statistics Review (CSR), containing the most recent incidence, mortality, andsurvival statistics, is published by the Cancer Statistics Branch of the NCI. The scope and purpose of theCSR follow a report to the Senate Appropriations Committee (Breslow, 1988), which recommended thata broad profile of cancer be presented regularly to the American public. This CSR includes incidence,mortality, and survival data from 1973 through 1999 , the most recent year for which data are available. (Incidence data for 1999 may not be complete. Therefore, exercise caution when comparing rates for1999 with those for previous years.). Most of the rates in this publication have been age-adjusted to the2000 US standard million population. Previous publications have used the 1970 US standard millionpopulation. Therefore, this publication can not be compared to previous publications. This changeconforms to a new federal policy for reporting disease rates and it allows for the age-adjusted rate tomore reflect the current age distribution and burden of cancer.
Since 1996, the CSR has also been available (in .pdf format) athttp://seer.cancer.gov/Publications/CSR1973_1999. (Replace 1999 in address for earlier editions.) Thewebsite allows timelier distribution of the CSR. Additional SEER data can be obtained via FASTATS(http://seer.cancer.gov) or CanQues, an interactive system athttp://seer.cancer.gov/ScientificSystems/CanQues, which allows the user to access over 10,000,000cancer statistics. The SEER public-use file with SEER*Stat software can be used over the internet orthe user can order a CD-ROM at http://seer.cancer.gov/Publications/Data1973_1998/. . SEER*Statprovides a user-friendly PC desktop system for the production of a myriad of cancer statistics, such asincidence rates and survival rates, for various demographic and medical input variables. The SEERpublic-use data file contains information on over 3,200,000 tumors with no personal identifiers.
THE SEER PROGRAM
The National Cancer Act of 1971 mandated the collection, analysis, and dissemination of data useful inthe prevention, diagnosis, and treatment of cancer. This mandate led to the establishment of the SEERProgram. A continuing project of the NCI, the population-based cancer registries participating in theSEER Program routinely collect data on all cancers occurring in residents of the participating areas. Trends in cancer incidence and patient survival in the US are derived from this database.
The SEER Program is a sequel to two earlier NCI programs — the End Results Program and the ThirdNational Cancer Survey. The initial SEER reporting areas were the States of Connecticut, Iowa, NewMexico, Utah, and Hawaii; the metropolitan areas of Detroit, Michigan, and San Francisco-Oakland,California; and the Commonwealth of Puerto Rico. Case ascertainment began with January 1, 1973,diagnoses.

SEER Cancer Statistics Review 1973-1999 National Cancer Institute SEER Cancer Statistics Review 1973-1999 National Cancer Institute
In 1974-1975, the program was expanded to include the metropolitan area of New Orleans, Louisiana,the thirteen-county Seattle-Puget Sound area in the State of Washington, and the metropolitan area ofAtlanta, Georgia. New Orleans participated in the program only through the 1977 data collection year. In 1978, ten predominantly black rural counties in Georgia were added. American Indian residents ofArizona were added in 1980. In 1983, four counties in New Jersey were added with coverageretrospective to 1979. New Jersey and Puerto Rico participated in the program until the end of the 1989reporting year. The National Cancer Institute also began funding a cancer registry that, with technical assistancefrom SEER, collects information on cancer cases among Alaska Native populations residing in Alaska. In 1992,the SEER Program was expanded to increase coverage of minority populations, especially Hispanics, by adding
Los Angeles County and four counties in the San Jose-Monterey area south of San Francisco. In 2002, the SEERProgram expanded coverage to include Kentucky and Greater California (the counties of California that were notalready covered by SEER). Also in 2002, New Jersey and Louisiana became SEER participants again.
The long-term incidence trends and survival data for this report are from five states — Connecticut,Hawaii, Iowa, New Mexico, and Utah — and four metropolitan areas — Detroit, Atlanta, San Francisco-Oakland, and Seattle-Puget Sound (Fig. I-1). Additional tables, show more recent incidence rates andtrends for SEER 12 areas (the 9 areas above plus Los Angeles, San Jose-Monterey, and the AlaskaNative Registry) since 1992.
The participating regions were selected principally for their ability to operate and maintain a population-based cancer reporting system and for their epidemiologically significant population subgroups. Withrespect to selected demographic and epidemiologic factors, they are when combined a reasonablyrepresentative subset of the US population. Data from the 9 or 12 SEER geographic areas used in thisreport represent, respectively, approximately 10 or 14 percent of the US population. By the end of the1999 diagnosis year, the database contained information on over 3,200,000 cases diagnosed since 1973.Over 170,000 new cases are added annually.
The goals of the SEER Program are:(1) to assemble and report, on a periodic basis, estimates of cancer incidence and mortality in the
US;(2) to monitor annual cancer incidence trends to identify unusual changes in specific forms of cancer
occurring in population subgroups defined by geographic and demographic characteristics;(3) to provide continuing information on trends over time in the extent of disease at diagnosis,
trends in therapy, and associated changes in patient survival; and(4) to promote studies designed to identify factors amenable to cancer control interventions, such
as: (a) environmental, occupational, socioeconomic, dietary, and health-related exposures; (b)screening practices, early detection and treatment; and (c) determinants of the length and qualityof patient survival.
Incidence and survival data: The SEER Program contracts with nonprofit, medically-orientedorganizations having statutory responsibility for registering diagnoses of cancer among residents of theirrespective geographic coverage areas. Each SEER contractor:(1) maintains a cancer information reporting system; (2) abstracts records for resident cancer patients seen in every hospital both inside and outside the
coverage area;(3) abstracts all death certificates of residents (dying both inside and outside the coverage area) on
which cancer is listed as a cause of death;(4) ensures complete ascertainment of cases by searching records of private laboratories,
radiotherapy units, nursing homes, and other health services units that provide diagnosticservice;
(5) registers all in situ and malignant neoplasms (with the exceptions of certain histologies forcancer of the skin and (beginning in 1996) in situ neoplasms of the cervix uteri);
(6) records data on all newly diagnosed cancers, including selected patient demographics, primarysite, morphology, diagnostic confirmation, extent of disease, and first course of cancer-directedtherapy;
(7) provides active follow-up on all living patients (except for those with in situ cancer of the cervixuteri);
(8) maintains confidentiality of patient records;(9) semiannually submits electronically to NCI data on all reportable diagnoses of cancer made in
residents of the coverage area.
For 1992 to 2000 diagnoses, the SEER program codes site and histology by the InternationalClassification of Diseases for Oncology, second edition (ICD-O-2) (Percy, Van Holten, & Muir, 1990). Allcases before 1992 were machine-converted to ICD-O-2. Beginning with 2001 diagnoses, cases will becoded according to the third edition (ICD-O-3) (Fritz et al., 2000). The primary site groupings used forincidence are found in the Appendix. Follow-up rates are also in the Appendix.
Mortality data: The SEER Program annually obtains from the NCHS a public-use file containinginformation on all deaths occurring in the US by calendar year. Information on each death includes ageat death, sex, geographic area of residence, and underlying and contributing causes of death. For thispublication, only the underlying cause of death is used in the calculation of mortality rates. Cause ofdeath before 1999 was coded according to ICD-9; beginning with deaths in1999, ICD-10 was used. Mortality rates for the SEER geographic areas, for each state, and for the entire US are obtained fromthese data. A list of the mortality site groupings used in this publication is in the Appendix.
Numbers of estimated cancers and deaths in 2002: The SEER Program has obtained from theAmerican Cancer Society (ACS) projections of the numbers of cancer cases and cancer deaths in the USin 2002. The ACS projects incidence in 2002 based on incidence rates from SEER for 1979-98 to the2002 estimated US population (Jemal et al., 2002).
Population data: The county population estimates implemented in the NCI SEER*Stat software for thecalculation of cancer incidence and mortality rates are available athttp://www01.ims.nci.nih.gov/popdata/download.html. They represent a modification of the annual timeseries of July 1 county population estimates (by age, sex, race, and Hispanic origin) produced by thePopulation Estimates Program of the Bureau of the Census with support from the NCI through aninteragency agreement. The Census Bureau's population estimates are available on their Web site,http://eire.census.gov/popest/data/counties.php. The procedures implemented by the Census Bureau inproducing their county estimates are documented athttp://www.census.gov/population/estimates/county/casrh_doc.txt.Please refer to http:// www01.ims.nci.nih.gov/popdata/methods.pdf for specific documentation regardingmodifications made by the NCI to the Census Bureau estimates. The following summarizes thesemodifications.
The initial modification affects only population estimates for the State of Hawaii. The EpidemiologyProgram of the Hawaii Cancer Research Center has developed its own set of population estimates,based on sample survey data collected by the Hawaii Department of Health.This effort grew out of a concern that the native Hawaiian population has been vastly undercounted inprevious censuses. The "Hawaii-adjustment" to the BOC estimates has the net result of reducing theestimated white population and increasing the Asian and Pacific Islander population for the state. TheBureau of Census estimates for the total population, black population, and American Indian and AlaskaNative populations in Hawaii are unaffected.
An additional modification to the Census Bureau estimates was recently implemented in order to meetrequirements for age-adjustment according to the year 2000 US population standard. Population estimates for two new age groups (less-than-one-year-olds and one-to-four-year-olds) werecreated for the 1969-89 estimates and for the 1990-99 estimates.
SEER Cancer Statistics Review 1973-1999 National Cancer Institute SEER Cancer Statistics Review 1973-1999 National Cancer Institute
DEFINITIONS
Several technical terms are used in presenting the data in this report. Their definitions are presentedhere to clarify them for the reader.
Incidence rate: The cancer incidence rate is the number of new cancers of a specific site/type occurringin a specified population during a year, usually expressed as the number of cancers per 100,000population at risk. That is,
Incidence rate = (New cancers / Population) × 100,000.
The numerator of the incidence rate is the number of new cancers; the denominator of the incidence rateis the size of the population. The number of new cancers may include multiple primary cancersoccurring in one patient. The population used depends on the rate to be calculated. For cancer sitesthat occur in only one sex, the sex-specific population (e.g., females for cervical cancer) is used.
The incidence rate can be computed for a given type of cancer or for all cancers combined. Except for5-year age-specific rates, all incidence rates are age-adjusted (see below) to the 2000 US standard population (or, where appropriate, to the world standard million population). (In previous editions of theCSR, the 1970 US standard million population was used; therefore, incidence rates in this edition can notbe compared to those in previous editions.) Incidence rates are for invasive cancer only, unlessotherwise specified. (An exception is the incidence rate for cancer of the urinary bladder; there both insitu and invasive cancers are counted.)
Mortality rate: The cancer mortality rate is the number of deaths with cancer given as the underlyingcause of death occurring in a specified population during a year, usually expressed as the number ofdeaths due to cancer per 100,000 population. That is,
Mortality Rate = (Cancer Deaths / Population) × 100,000.
The numerator of the mortality rate is the number of deaths; the denominator of the mortality rate is thesize of the population. As with the incidence rate, the population used depends on the rate to becalculated. The mortality rate can be computed for a given cancer site or for all cancers combined. Except for 5-year age-specific rates, all mortality rates are age-adjusted (see below) to the 2000 USstandard million population (or, where appropriate, to the world standard million population). (In previouseditions of the CSR, the 1970 US standard million population was used; therefore, mortality rates in thisedition can not be compared to those in previous editions.)
Standard million population: A standard population for a geographic area, such as the US or theworld, is a table giving the proportions of the population falling into the age groups 0, 1-4, 5-9, ..., 80-84,and 85+. A standard million population for a geographic area is a table giving the number of personsin each age group 0, 1-4, ... , 85+ out of a theoretical cohort of 1,000,000 persons that is distributed byage in the same proportions as the population. Table A-7 shows the US 2000 and world standard millionpopulations. This publication does not use the new world standard million population used in someWorld Health Organization mortality publications.
Age-adjusted rate: An age-adjusted incidence or mortality rate is a weighted average of the age-specific incidence or mortality rates, where the weights are the proportions of persons in thecorresponding age groups of a standard million population. The potential confounding effect of age isreduced when comparing age-adjusted rates computed using the same standard million population. Forthis report, the 2000 US standard million population and the world standard million population are usedas the weights in computing age-adjusted rates, unless otherwise noted.

SEER Cancer Statistics Review 1973-1999 National Cancer Institute
Percent change: The percent change (PC) in a statistic over a given time interval is Percent change = (Final value ! Initial value) / Initial value * 100.
(In this report, the initial year is usually 1973, and the final year is usually 1999.) A positive PCcorresponds to an increasing trend, a negative PC to a decreasing trend.
Estimated annual percent change: The estimated annual percent change (EAPC) is calculated by firstfitting a regression line to the natural logarithm of the rates (r) using calendar year (x) as a regressorvariable. In this report we use the method of weighted least squares to calculate the regressionequation. If is the resulting regression equation (with slope m), then ln( )r mx b= +
. A positive EAPC corresponds to an increasing trend, a negative EAPC to aEAPC em= −100 1( )decreasing trend.
Because the methods used in their calculation are mathematically different, the signs of the PC and theEAPC for a given statistic and time interval may differ, as occurs in a few of the tables presented. Thatis, one of these statistics may show an increasing trend, the other a decreasing trend.
Testing the hypothesis that the actual mean annual percent change is 0 is equivalent to testing thehypothesis that the theoretical slope estimated by the slope m of the line representing the equation
is 0. The latter hypothesis is tested using the t distribution of m / SEm with n ! 2 degreesln( )r mx b= +of freedom. The standard error of m, SEm, is obtained from the fit of the regression (Kleinbaum et al.,1988). (This calculation assumes that the rates increased or decreased at a constant rate over the entirecalendar year interval; the validity of this assumption was not assessed.) In those few instances where atleast one of the rates was 0, the linear regression was not calculated.
Life table: A table for a given population listing, for each sex and each age from 0 to 120, how manymembers die at that age and how many survive one more year.
Observed survival rate: The observed survival rate represents the proportion of cancer patientssurviving for a specified time interval after diagnosis. Note that some of those not surviving died of thegiven cancer and some died of other causes.
Relative survival rate: The relative survival rate is calculated using a procedure (Ederer et al., 1961)whereby the observed survival rate is adjusted for expected mortality. The relative survival rateapproximates the likelihood that a patient will not die from causes associated specifically with the givencancer before some specified time after diagnosis. It is always larger than the observed survival rate forthe same group of patients.
Standard error: The standard error of a rate is a measure of the sampling variability of the rate.
Person-years of life lost: The person-years of life lost (PYLL) is calculated as follows: For eachindividual who dies of the cancer of interest, the number of years of expected additional life for anaverage person of that age and sex is obtained from life tables for the US population (available from theNCHS). The PYLL in the general population associated with a particular cancer is simply the sum of thisexpectation over all those individuals who died of that cancer in a particular year.
Average years of life lost: The average years of life lost (AYLL) associated with a particular cancer isthe PYLL associated with that cancer in the general population divided by the number of deaths from thatcancer in the general population in a specific year.
Prevalence: Prevalence is defined as the number or percent of people alive on a certain date in apopulation who previously had a diagnosis of the disease. It includes new (incidence) and pre-existingcases and is a function of both past incidence and survival.

SEER Cancer Statistics Review 1973-1999 National Cancer Institute
Stage of disease at diagnosis: Extent of disease information determines stage of disease at diagnosis. The historical stage presented has four levels. An invasive neoplasm confined entirely to the organ oforigin is said to be localized. A neoplasm that has extended beyond the limits of the organ of origin,either directly into surrounding organs or tissues or into regional lymph nodes, is said to be regional. Aneoplasm that has spread to parts of the body remote from the primary tumor, either by direct extensionor by discontinuous metastasis, is said to be distant. When information is not sufficient to assign astage, a neoplasm is said to be unstaged. In situ tumors (except those of the cervix uteri) are alsocollected by SEER but generally are not published in this series. For some cancers and diagnosis years,the extent of disease information can also be converted to Stages 0-IV as defined by the American JointCommittee on Cancer (Beahrs et al., 1988).
SUMMARY TABLES
While there are detailed tables in separate sections for each of the major cancer sites, information onsome rare cancers can be found in the summary tables of section I. For a detailed list of primary sites,the summary tables provide incidence and mortality rates for the most recent 5-year period, trends —percent change (PC) and estimated annual percent change (EAPC) — from 1973 to the most recentyear, median age at diagnosis, median age at death, and survival rates. The information is provided byrace (all races, whites, blacks) and by sex.
LONG-TERM TRENDS, 1950-1999
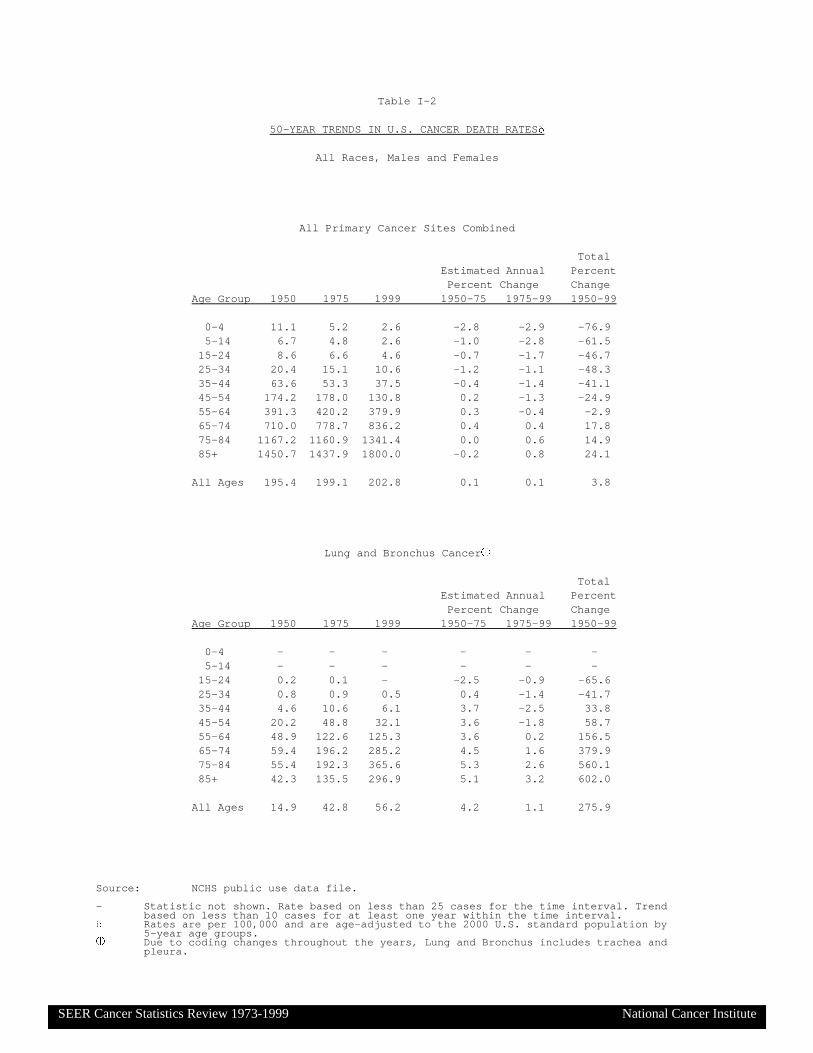
Trends in cancer mortality from 1950 to 1999 are summarized by age both for all cancers combined(Table I-2). These mortality data are based on experience in the entire US.
Summaries of long-term trends in cancer incidence, mortality, and survival are outlined in Table I-3. Thefirst two columns of the table show the estimated number of new cancers and the reported number ofcancer deaths for 1999; the next four columns show incidence and mortality changes from 1950 to 1999. Both the percent change (PC) and the estimated annual percent change (EAPC) for incidence are basedon data from the five geographic areas for which data are available for each of three time periods:around 1950, 1969-71, and 1973-99. Due to the limited availability of incidence data from the early timeperiods and the change in the composition of the nonwhite population over time, the incidence trends arepresented for whites only. The estimates for children are for children of all races in Connecticut only. Mortality data are for the entire US; they are for whites only in order to be comparable to the incidencedata. The last two columns display 5-year relative survival figures for patients diagnosed during two timeintervals, 1950-54 and a recent time period; the figures are based on information from the End Resultsprogram for 1950-54 and SEER for the recent time period.
Use caution when interpreting these statistics. Evaluating trends over a long period of time may hiderecent changes in the trends.
YEARS OF LIFE LOST DUE TO PREMATURE DEATH FROM VARIOUS CAUSES
Mortality rates alone give an incomplete picture of the burden deaths impose on the population. Anothermeasure, which adds a different dimension, is the years of life lost due to premature death. This shows the extent to which life is cut short by a particular cause or disease.
This measure is estimated by linking life table data to each death of a person of given age and sex. Thelife table permits a determination of the number of additional years an average person of that age andsex would be expected to live. In this report, the age groups used in the calculation were 1-yearintervals. These remaining years of life left are summed over all deaths due to a particular cause,yielding the estimate of the number of person-years of life lost (PYLL). The average years of life lost(AYLL) is obtained by dividing the PYLL by the number of deaths. Both of these measures can becalculated for any cause of death.

SEER Cancer Statistics Review 1973-1999 National Cancer Institute
CANCER PREVALENCE
Prevalence is defined as the number or percent of people alive on a certain date in a population whopreviously had a diagnosis of the disease. It includes new (incidence) and pre-existing cases and is afunction of both past incidence and survival. Tables on prevalance are not shown in the overview thisyear. Instead, there is a special section devoted to prevalence which includes prevalance estimates anda discussion of statistical methods used to calculate prevalence.
PROBABILITY OF BEING DIAGNOSED WITH OR DYING FROM CANCEREach site-specific section of the book contains a table showing the probability (expressed as a percent)of a person of a specified race, sex, and age (0, 10, 20, 30, 40, 50, or 60) being diagnosed with thespecified cancer within the next 10, 20, or 30 years or within their remaining lifetime. Lifetime risks ofbeing diagnosed with cancer and lifetime risks of dying from cancer also appear (as percents) in eachtable. There are summary tables of lifetime risk in the overview.
Lifetime and interval risks of being diagnosed with cancer: The probability of being diagnosed withcancer is computed by applying cross-sectional age-specific 1997-99 incidence rates from the 12 SEERareas and mortality rates from the entire US to a hypothetical cohort of 10,000,000 live births. Thiscohort is considered to be at risk for two mutually exclusive events: (1) developing the specified cancer,and (2) dying of other causes without developing the specified cancer. Using these two types of events,a standard multiple decrement life table (with 20 age groups from 0-4 to 90-94 and 95+) is derived. For each age interval, the number alive and free of the specified cancer at the beginning of the intervalis decremented by the number who develop the specified cancer and the number who die of othercauses. The lifetime risk of being diagnosed with the specified cancer is derived by summing all cancercases from age 0-4 through age 95+ and dividing by 10,000,000. This calculation does not assume anindividual lives to any particular age; rather, it is the sum over all age intervals of the probability of livingto the beginning of that interval without developing the given cancer times the probability of developingthe cancer in that interval. The probability of developing cancer during any time period (e.g.,within 10years of a specific age say 50) is calculated by adding up all the cancers in the life table over thespecified age range and dividing by the number of individuals alive and free of the specified cancer atthe beginning of the period (Feuer et al., 1992; Feuer et al., 1993). To improve the precision of thecalculations, rates were calculated for the age groups 85-89, 90-94, and 95+. The BOC providedpopulations for these age groups for 1990 to 1999.
Lifetime risk of dying from cancer: The lifetime risk of dying from a specified cancer is derived usinga standard multiple decrement life table (Elandt-Johnson & Johnson, 1980). For each age, the risks ofdying of the specified cancer and of all other causes are calculated, based on mortality data from theentire United States.
U.S. CANCER MORTALITY RATES BY STATE
Each cancer-site-specific section of the book presents, for all 50 states and the District of Columbia,average annual mortality rates for the most recent 5-year period for all persons, males only, and femalesonly. The rates are per 100,000 persons; they are age-adjusted to the US 2000 standard millionpopulation. (In previous editions of the CSR, the 1970 US standard million population was used;therefore, mortality rates in this edition differ from those in earlier editions.)The five states with the highest rates and the five states with the lowest rates are identified. The statesare also ranked from highest rate to lowest rate for each of the cancers for which rates are reported.
The percent difference (PD) between a state rate and the rate for the total US is given by the formula:PD = [(State rate ! Total US rate) / Total US rate] × 100 .
The standard error for each age-adjusted state rate is calculated, based on the assumptions that (1) foreach age-specific rate, the number of deaths is a Poisson random variable (Keyfitz, 1966) and (2) the

SEER Cancer Statistics Review 1973-1999 National Cancer Institute
variance of the age-adjusted rate is a linear combination of the variances of the age-specific rates(Snedecor & Cochran, 1980; pp. 188-9).
The standard error of the difference (SEd) between a state rate and the total US rate is given by theformula
,SE SE SEd s u= +2 2
where SEs and SEu are the standard errors of a state rate and of the total US rate, respectively. Thevariance of each rate (i.e., the square of the standard error) is based on the Poisson assumption. Thestandard error does not represent the total error that may be present in the age-adjusted rate; it is merelythe square root of the variance associated with the rates. In addition to this variance, there also existpotential biases and errors in the measurement of the rate that are difficult to assess accurately andprobably impact differently on the error calculations for different states. The difference between each age-adjusted state rate and the age-adjusted US rate is tested for statisticalsignificance (see below) by calculating a Z (standard normal) statistic from the formula:
Z = (State rate ! Total US rate) / SEd
Although the rates being compared are not independent because each state is part of the US, thisdoesn't substantially affect the statistical test because each state represents a small proportion of thetotal US.
SOCIOECONOMIC STATUS AND CANCER
As a supplement to this year’s SEER Cancer Statistics Review, a publication entitled “AreaSocioeconomic Variations in Cancer Incidence, Mortality, Disease Stage, and Survival, 1975-1999” will be released in the Summer of 2002. This publication includes analyses of trends and patternsin rates of incidence, mortality, stage of disease at diagnosis, and survival from all cancers combinedand from lung, colorectal, prostate, breast, cervical, and melanoma cancers in relation to two areasocioeconomic measures: median family income and percentage of population with at least a highschool diploma. Cancer incidence and mortality trends are presented for the 1975-1999 time period.Trends in cancer survival and stage at diagnosis are presented for the 1988-1999 time period. Areasocioeconomic measures are defined at both the county and census tract levels using decennial censusdata. Cancer incidence, disease stage, and survival data are drawn from the SEER database, whereascancer mortality data for the entire United States come from the national mortality database maintainedby the National Center for Health Statistics.
MEASUREMENT ERRORS
Errors in the estimation of death rates can occur in either the numerator (the number of reported deaths)or the denominator (the size of the population). One possible source of numerator error isunderregistration of deaths. Although investigation by the National Center for Health Statistics indicatesthat over 99% of all deaths in the US are registered, little is known about the possible existence of anydifferences in death registration by geographic area, age, sex, or race.
Numerator error also can occur due to misclassifications, especially of race, ethnicity, or cause of death. Research indicates that, for infant mortality, misclassification is highest for races other than white orblack (Hahn et al., 1992). The true extent of racial or ethnic misclassifications in death certificate codingremains unknown.
In coding overall cancer mortality, misclassifications of cause of death would occur when either the truecause of death was cancer while a cause other than cancer was coded, or vice versa. Even if a death iscorrectly attributed to cancer, the primary cancer may be incorrectly identified. It is already known, forexample, that this is a problem with primary liver cancer (Percy, Ries, & Van Holten, 1990).
Denominator errors arise through under- and overenumeration in the decennial census, which is thebasis of intercensal population estimates and population projections. To the extent that any over- or

SEER Cancer Statistics Review 1973-1999 National Cancer Institute
undercount is substantial and variable among subgroups or geographic areas, it may have importantconsequences on calculated death rate statistics. The effect of an undercount of population is that itdecreases the denominator, leading to an overestimate of the rate. Conversely, an overcount ofpopulation would result in an underestimate of the rate.
In 1980, underenumeration varied by age group, with the greatest difference found for those 80 andolder, who were undercounted by about 5% (US Bureau of the Census, 1986). All other age groups wereeither over- or undercounted by less than 3%. For race-sex-age groups, the coverage was lowest forblack males aged 40-49, who were undercounted by 19%. It is thought that no improvement wasachieved with the 1990 census; in some instances, underenumeration may have been worse than in1980.
Any of these errors alters the count in either the numerator or the denominator, which in turn affects thecalculated rate. Since the types of error encountered may differ by type of cancer, age group, race, sex,or even state, their impact is difficult to ascertain. Use caution when dealing with those areas wherepotential problems may be present.
STATISTICAL SIGNIFICANCE
Errors may be made in the determination of a given statistic. In order to test whether two groups (suchas the populations of a state and the entire US) have the same or different actual rates, the observedrates for the groups are compared. Statisticians consider that a difference in observed rates can beexplained by one of two hypotheses: (H0) The actual rates are really the same, but the observed ratesare different because of some combination of error-causing factors, or (H1) the actual rates of the groupsare really different. H0 is called the null hypothesis (because it says there is no real difference); H1 iscalled the alternate hypothesis. Typically, H0 is rejected only if there is strong evidence in favor of H1. (Thus, if the observed rates are equal, we cannot reject H0.)
Using statistical theory, one can determine the distribution of the rate difference under the assumptionthat H0 is true. Then values of the rate difference that are very unlikely to occur if H0 is true areidentified. More specifically, a small positive number, called alpha (a), is chosen; usually, a is 0.05 or0.01. (Alpha is called the significance level of the hypothesis test.) One can then identify limits for thedifference in rates such that, if H0 is true, the probability of the difference being outside of those limits isa. If the observed difference is outside of these limits, then the observed result is very unlikely to happenif H0 is true, so H0 is rejected.
Another way of looking at the same process is to calculate, assuming H0 is true, the probability that theobserved difference or any greater observed difference would occur; this number is called the P-value ofthe observed result. If the P-value of a comparison is less than a — that is, the observed difference isvery unlikely to happen if the null hypothesis is true — H0 will be rejected. If the P-value of a test isgreater than the significance level a, H0 will not be rejected. When a difference in rates is sufficientlylarge to cause the null hypothesis to be rejected for a given value of a, it is called a statisticallysignificant difference.
When a null hypothesis is rejected, there remains a small chance that a wrong decision has been made. If many statistical comparisons are done, even with a = 0.01, the chance of making at least one wrongdecision becomes a concern. In testing the differences between the total US rate and the rate for eachstate (or for the District of Columbia) for a given cancer, 51 statistical comparisons of the type describedabove are performed. Based on one of Bonferroni's inequalities (if there are n events and pi is theprobability of success in event i, then P(at least 1 success) < p1 + ... + pn) (Snedecor & Cochran,1980; p.115-117), the significance level a for each individual comparison was set equal to 0.01/51 . 0.0002. Thus, only individual-state-to-total-US comparisons with an associated P-value less than 0.0002 areconsidered to be statistically significant. That is, a very small significance level a ( 0.0002) is used inorder to minimize the total risk (0.01) of falsely deciding that some pair of equal rates are unequal.

SEER Cancer Statistics Review 1973-1999 National Cancer Institute
Use caution in assessing statistically significant differences. Population size has an important role in anycalculation of statistical significance. Some states may have estimated rates that are very close to theestimated total US rate, but because of their large population, the difference between their estimated rateand the estimated total US rate is found to be statistically significant. In this case, the true state rate andthe true US rate are almost certainly different, because the observed difference, though small, is nearlyimpossible if the null hypothesis (equal rates) is true. A small difference in rates, however, may have nopractical importance.
On the other hand, some smaller states may have estimated rates that differ substantially from theestimated total US rate, but because of their relatively small population, the differences are found to bestatistically nonsignificant. When this happens, if the true state rate and the true US rate were equal, theprobability of obtaining a difference at least as large as what has been observed is greater thana . 0.0002. Therefore, because the evidence against it isn’t strong enough, the null hypothesis (equalrates) is not rejected.
If the percent difference (PD) between the two rates is small, there may be some question about theimportance of the difference. It is difficult to specify a minimally significant absolute PD, below which thedifference would always be unimportant, because the observed PD will depend on the populations of theareas involved. It may be of value to consider the size of the PD between a state rate and the US rate inassessing the importance of a statistically significant difference. To further assist readers in interpretingthe data, the tables are footnoted to indicate variations of more than 15% between a state rate and theUS rate.
Comparing individual state rates with the US rate and assessing statistical significance is not anappropriate procedure for assessing geographic clustering of state rates. Identification of states whichmay represent regional clusters of high or low rates would require additional statistical and graphicalanalyses.
For a number of cancers, the District of Columbia has the highest mortality rates. Use caution whencomparing cancer rates for the District with those from the 50 states. The District is an entirely urbanarea, whereas a state includes urban, suburban, and rural areas. Mortality rates for many cancers arehigher in urban areas. Also, the District has a higher percentage of blacks (about two-thirds) than anystate; their higher mortality rates for several types of cancer elevate the overall rate for the District.
JOINPOINT REGRESSION ANALYSIS OF CANCER TRENDS
A recent advance in the presentation of cancer trends is the use of joinpoint models (Kim et al., 2000). Inpast issues of the Cancer Statistics Review, certain time intervals (e.g., 1973-1996) were specified andthe estimated annual percent changes (EAPC) were computed over those intervals. The choices ofwhere to start and where to end an interval were arbitrary and sometimes did not give an accuratepicture of the trend for a given cancer site. For example, the rates might be increasing and decreasing indifferent parts of the same interval. For some sites, increases occurred in the earlier years, followed bydeclines in more recent years.
To achieve greater descriptive accuracy, the computer now statistically finds the number and location ofplaces where a trend changes. The point (in time) where a trend changes is called a joinpoint. Trendsmay change in different ways at a joinpoint: from up to down, from down to up, from up to up at adifferent rate, or from down to down at a different rate. In order to find the most accurate set ofjoinpoints with corresponding fixed-rate intervals, we use a joinpoint regression model. Joinpointregression models on the natural logarithms of the rates describe the trends by a sequence of connectedstraight line segments. Adjacent segments are connected at a joinpoint. Each segment has anassociated EAPC. On a logarithmic scale, the segments are linear.

SEER Cancer Statistics Review 1973-1999 National Cancer Institute
Joinpoint analysis first assumes no joinpoints are needed to describe the data accurately — i.e., thetrend over the entire interval 1973-1999 does not change. Joinpoints are added in turn if they arestatistically significant. Thus, in the final model, each joinpoint (up to a maximum of three) represents asignificant change in trend. Smoother polynomial models may provide a good fit overall, but are lesssensitive to what is occurring at the ends of the data, especially for the most recent points.
A Windows-based program, Joinpoint, is freely available at http://srab.cancer.gov/joinpoint/; it acceptsdata from the SEER*Stat program. Further details on joinpoint regression may be found in a previousCSR (Ries et al., 2000) and in the cited reference.
INTERPRETATION OF CANCER STATISTICS
When reviewing the various cancer incidence, mortality, and survival statistics provided in this report, beaware that a number of factors may affect the interpretation of many of these statistics.
Survival rates for all cancers combined: The mix of cancers changes over time as the incidence ofsome cancers increases and the incidence of others decreases. Thus, in calculating the survival rate forall cancers combined, the proportions corresponding to the specific cancers will also change over time. Therefore, the overall cancer survival rate can fluctuate even when the survival rates for site-specificcancers remain unchanged. (While it is possible to adjust the survival rate for all cancers combined onthe basis of the relative frequency of each specific cancer in some specified reference period, ratesadjusted in this manner differ by only a small amount from unadjusted rates. In the future, such anadjustment may become more important if there are substantial changes in the incidence of variouscancers.)
Early detection/screening: The improved earlier detection and diagnosis of cancers may produce anincrease in both incidence rates and survival rates. These increases can occur as a result of theintroduction of a new procedure to screen subgroups of the population for a specific cancer; they neednot be related to whether use of the screening test results in a decrease in mortality from that cancer. Asthe proportion of cancers detected at screening increases, presumably as a result of increased screeningof the population, patient survival rates will increase, because they are based on survival time afterdiagnosis. The interval between the time a cancer is diagnosed by a screening procedure and the timewhen the cancer would have been diagnosed in the absence of screening is called lead-time (Zelen,1976). (Screening for breast cancer has been demonstrated to result in increased survival over andabove that resulting from lead-time alone and to reduce breast cancer mortality. The benefit of screeningis being studied for some other cancers.)
If a new screening procedure consistently detects cancer in a preinvasive phase, this may result in adecrease in survival rates for invasive cancer. In this case, length-biased sampling (Zelen, 1976) maybe operating. Length-biased sampling would result in the preferential detection — in a preinvasive phase— of those cancers that would have had a relatively good prognosis had they progressed to invasivedisease; these potentially invasive cancers would be systematically eliminated. If this occurs, the mix ofcancers that are not detected at screening and progress to invasive may become less prognosticallyfavorable, resulting in a decrease in survival rates for patients with invasive cancers. (Length-biasedsampling may at least partially explain survival trends for cervical cancer. Other cancers possiblyaffected include breast, colon, rectum, and prostate.)
Changes in diagnostic criteria: Early detection of cancer resulting from either screening or earlierresponse to symptoms may result in the increasing diagnosis of small tumors that are not yet life-threatening. This may have the effect of raising the incidence and survival rates with little or no change

SEER Cancer Statistics Review 1973-1999 National Cancer Institute
in mortality rates. Breast, colon, prostate, cervix uteri, bladder, and skin (melanoma) are the cancer sitesmost likely to be affected.
Technological advances in diagnostic procedures: In this report, trends in survival by stage atdiagnosis are not presented for specific cancers; trends in stage distributions are presented rarely. However, it is possible to compare survival rates by stage and stage distributions given here with thosefor earlier time periods (as provided in previous reports or available from the SEER public-use data file). Thus, it is necessary to comment on the effect of technological advances on the diagnosis and staging ofcancer.
The assignment of a given stage to a particular cancer may change over time due to advances indiagnostic technology. Introduction of new technology can give rise to a phenomenon known as stagemigration. Stage migration occurs when diagnostic procedures change over time, resulting in anincrease in the probability that a given cancer will be diagnosed in a more advanced stage. Forexample, certain distant metastases that would have been undetectable a few years ago can now bediagnosed by a computer tomography (CT) scan or by magnetic resonance imaging (MRI). Therefore,some patients who would have been diagnosed previously as having cancer in a localized or regionalstage are now diagnosed as having cancer in a distant stage. The likely result would be to remove theworst survivors — those with previously undetected distant metastases — from the localized andregional categories and put them into the distant category. As a result, the stage-at-diagnosis distributionfor a cancer may become less favorable over time, but the survival rates for each stage may improve:the early stage will lose cases that will survive shorter than those remaining in that category, while theadvanced stage will gain cases that will survive longer than those already in that category. However,overall survival would not change (Feinstein et al., 1985). Stage migration is an important concept tounderstand when examining temporal trends in survival by stage at diagnosis as well as temporal trendsin stage distributions; it could affect the analysis of virtually all solid tumors.
Evolution of stage classifications: Every few years, the American Joint Committee on Cancerproduces a new cancer-staging manual (Beahrs, 1988). The evolution of such classifications reflects theidentification of new prognostic factors that may influence choice of treatment. The SEER Programcollects data on extent of disease (EOD) rather than stage; EOD is more specific than stage and usuallydetermines stage, even when stage definitions change. Thus, SEER easily adapts to changes in stagedefinitions; moreover, trends in a newly redefined stage can usually be calculated.
For those cancers for which new prognostic variables are introduced into staging, so that previouslycollected EOD data cannot determine new stage categories, there can be problems in assessing trendsin stage of disease. Only by reviewing the evolution of staging for a given cancer is it possible todetermine what effect changes in stage definitions have had on stage-specific survival and on stage-at-diagnosis distributions. Stage migration (mentioned above) and EOD migration need also be taken intoaccount. One reason for using the historical categories of localized, regional, and distant is that thesecategories have been fairly consistent over time.
Interpreting relative survival rates: The relative survival rate is the ratio of the observed survival rateto the expected survival rate for a given patient cohort. When the base population used in calculatingthe expected survival is similar to the cohort of cancer patients except for the latter’s cancer experience,the relative survival rate approximates the cancer's cause-specific survival rate. The expected survivalrate is based on mortality rates for the entire population, taking into account, as appropriate, the age,sex, race, and year of diagnosis of the patients. Assuming that the presence of cancer is the only factorthat distinguishes the cancer patient cohort from the general population, the relative survival rateapproximates the probability that a patient will not die of the diagnosed cancer within the given timeinterval.
SEER Cancer Statistics Review 1973-1999 National Cancer Institute
A factor related to the risk of a cancer may also be related to the risk of dying from causes unrelated tothe cancer. An example of such a factor is smoking. Smoking is a major risk factor for lung cancer;therefore, a cohort of lung cancer patients will contain a much higher proportion of smokers than doesthe general population. However, smoking is also a risk factor for other diseases, resulting in smokershaving a shorter life expectancy than nonsmokers. Expected survival rates for lung cancer patientsbased on the general population will be unduly optimistic for this reason; they will result in relative ratesthat are lower than they should be.The problem cannot be easily corrected because separate life tables for smokers and nonsmokers arenot available. Amount of smoking (usually measured in pack-years) is clearly an important variable. The possibility that expected rates may not be appropriate for a given patient cohort should also beconsidered when examining relative survival rates for patients with cancers of the cervix uteri or breast,because the risk of these cancers has been associated with socioeconomic status (Baquet et al., 1991),which may be related to life expectancy.
Previous to the CSR for 1973-1996, the expected rate tables used were for 1970 and 1980; there wereseparate tables for whites, blacks, American Indians, Chinese, Japanese, Filipinos, white Hispanics, andHawaiians. In updating the tables for 1990, several problems emerged. The US life tables are based onage, race, and sex information from death certificates. The information on race on the death certificatemay not be accurate (Rosenberg et al., 1999). One reason is that funeral directors may inaccuratelyreport race on a death certificate. Also, reported age at death, especially for those older than 85, maynot be accurate because birth certificates were not issued with as much regularity in the early 1900s asthey are today. Although race misclassification and age-at-death misreporting exist across all races,they may be more problematic for races other than white or black because of those races' smallerpopulation sizes. Therefore, life tables were generated for 1970, 1980, and 1990 only for white, black,and other; these life tables were used to produce the relative survival rates in this book. There may besmall variations among survival rates calculated in this CSR and those in CSRs prior to 1973-1996.
Comparison with other databases: The SEER data are obtained from population-based cancerregistries covering about 14 percent of the US population. It is sometimes of interest to compare cancerstatistics for SEER areas with those from other registries both in the US and worldwide. In making suchcomparisons, one must carefully consider the factors considered above for both data sources. Inaddition, one should assess all of the following: (1) completeness of case ascertainment, (2) rules usedto determine multiple primaries, (3) follow-up, (4) rules used in assigning and coding cause of death, and(5) the sources and procedures used in obtaining population estimates. Depending on the rates beingcompared, there could be other confounding factors which should be considered. The same standardmillion population should be used for the age-adjustment of each group being compared.
It is sometimes interesting to compare survival data for cancer patients in SEER areas with data fromclinical trials. This must be done with great caution. Survival data from clinical trials may have beenobtained from a patient population that differs from that of SEER patients in prognostic factors for thegiven cancer; any survival comparisons would have to adjust for such differences. Also, it is necessaryto verify that the methodology used in computing survival rates is the same for both data sources. Furthermore, clinical-trials patients may differ from SEER patients in characteristics that may be relatedto survival but are not recorded in either database. If this were true for a given cancer, it would not bepossible to make valid comparisons of this type.
Errors in data collection: In the process of registering cancer patients, errors may be made inabstracting and coding the data, which includes demographic information, cancer site, histology, extentof disease, treatment, and patient survival. Quality control studies are periodically carried out to detectand correct this type of error, but no attempt is made to incorporate this source of error into the varianceestimates of cancer rates reported here.

SEER Cancer Statistics Review 1973-1999 National Cancer Institute
Comparison of this report with previous reports: It is important to note that most rates in this CSRwere age-adjusted to the 2000 standard million US population; in the past, the 1970 standard millionpopulation was used. Therefore rates in this report can not be compared to rates and trends in previousreports.
The cancer registries that participate in the SEER Program submit data on all cancers diagnosed in theircoverage areas to the NCI each year. Because of the dynamic nature of the registries' databases, thereported number of new cancer cases in a particular race-sex-age-cancer category may change for acalendar year for which data have already been reported in a previous publication. Additional cancercases that were previously overlooked for a given diagnosis year may have been found and reported tothe central registry. There may have been follow-back of cancers diagnosed by death certificate only;successful efforts to establish the dates of diagnosis for such patients will change the number of patientsreported for a given diagnosis year. Code changes may occur when a patient dies; for example,information on race is generally available on the death certificate and may be used to update apreviously unknown value. There may have been elimination of duplicate records for the same patient,often due to name changes or misspellings.
Thus, a recent report may have a different number of cases for a given diagnosis year than an earlierreport, with resulting effects on incidence and possibly survival rates. Population estimates may alsochange from one report to another for some calendar years. This occurs because the NCI receivespopulation estimates that are regularly updated by the BOC; for example, previous population estimatesfor years beginning with 1990 were replaced with new estimates from the BOC. Such changes mayresult in some differences between incidence and mortality rates for a given calendar period as publishedin different reports.
STANDARD ERRORS OF RATES
Survival rates: In the tables presenting survival rates, the magnitude of the standard error is given as aclue to the reliability of a given rate: the greater the standard error, the less reliable the rate. In addition,if there were fewer than 25 diagnoses in the first interval of the life table constructed to calculatesurvival, or if all cases became lost to follow-up within an interval, a valid survival rate could not becalculated, as is noted in the table footnotes.
The standard error (SE) of a relative survival rate is obtained as follows (Ederer et al., 1961):
SE CR CR qe d
qe d
qe dt t
t
t t
( ) ...= ⋅−
+−
+ +−
1
1 1
2
2 2
where CRt is the t-year relative survival rate, and for i = 1, ... , t, qi is the probability of dying in year i after diagnosis,ei is the effective number of patients at risk in year i after diagnosis, anddi is the number of deaths in year i after diagnosis.
Incidence and mortality rates: The standard errors of age-adjusted incidence and mortality rates areoften not specified. However, the reader can approximate the SE of a particular incidence or mortalityrate by the following formula for the SE of a crude incidence or mortality rate (Keyfitz, 1966):
SE( ) /rate rate cancer cases or deaths≈
Appendix Tables A-1 and A-2 provide numbers of cancer diagnoses within SEER areas and numbers ofdeaths in the entire US, respectively, by race and sex for the most recent 5-year period. These can beused to obtain approximations of the standard errors for associated age-adjusted rates for the same timeperiod using the above formula. To approximate the standard error of a rate for a single year, use theformula but substitute the cancer cases or deaths with the number of cancer cases or deaths divided by5.

SEER Cancer Statistics Review 1973-1999 National Cancer Institute
REFERENCES
Baquet CR, Horm JW, Gibbs T, Greenwald P. Socioeconomic factors and cancer incidence amongblacks and whites. J Natl Cancer Inst 1991; 83:551-557.
Beahrs OH, Henson DE, Hutter RV, Myers MH, editors. Manual for Staging of Cancer, 3rd ed. Philadelphia (PA): Lippincott; 1988.
Breslow L (Chairman, Extramural Committee to Assess Measures of Progress Against Cancer).Measurement of progress against cancer: Final report to the Senate Appropriations Committee.Bethesda: National Cancer Institute; 1988.
Ederer F, Axtell LM, Cutler SJ. The relative survival rate: A statistical methodology. J Natl Cancer InstMonogr 1961; 6:101-121.
Elandt-Johnson RC, Johnson NL. Survival Models and Data Analysis. New York (NY): Wiley; 1980.
Feinstein AR, Sosin DM, Wells CK. The Will Rogers phenomenon: Stage migration and new diagnostictechniques as a source of misleading statistics for survival of cancer. New Engl J Med 1985; 312:1604-1608.
Feldman AR, Kessler L, Myers M, Naughton MD. The prevalence of cancer: Estimates based on theConnecticut Tumor Registry. New Engl J Med 1986; 315:1394-1397.
Feuer EJ, Wun L-M, Boring CC. Probability of developing cancer. In: Miller BA, Ries LAG, Hankey BF,Kosary CL, Edwards BK, editors. Cancer Statistics Review: 1973-1989, National Cancer Institute, NIHPub. No. 92-2789, 1992. p. XXX.1-8.
Feuer EJ, Wun L-M, Boring CC, Flanders WD, Timmel MJ, Tong T. The lifetime risk of developingbreast cancer. J Natl Cancer Inst 1993; 85:892-897.
Fritz A, Percy C, Jack A, Shanmugaratnam K, Sobin L, Parkin DM, Whelan S, editors. InternationalClassification of Diseases for Oncology, 3rd ed. Geneva: World Health Organization; 2000.
Hahn RA, Mulinare J, Teutsch SM. Inconsistencies in coding of race and ethnicity between birth anddeath in U.S. infants. JAMA 1992; 267:259-263.
Jemal A, Thomas A, Murray T, Thun M. Cancer statistics, 2002. CA Cancer J Clin 2002; 52:23-47.
Keyfitz N. Sampling variance of standardized mortality rates. Hum Biol 1966; 38:309-317.
Kim H-J, Fay MP, Feuer EJ, Midthune DN. Permutation tests for joinpoint regression with applications tocancer rates. Stat Med 2000; 19:335-351.
Kleinbaum DG, Kupper LL, Muller KE. Applied Regression Analysis and Other Multivariable Methods,2nd ed. Boston (MA): PWS-Kent, 1988. p. 266-268.
Percy C, Ries LAG, Van Holten VD. The accuracy of liver cancer as the underlying cause of death ondeath certificates. Public Health Rep 1990; 105:361-368.
Percy C, Van Holten V, Muir C, editors. International Classification of Diseases for Oncology, 2nd ed.Geneva: World Health Organization; 1990.

SEER Cancer Statistics Review 1973-1999 National Cancer Institute
Ries LAG, Eisner MP, Kosary CL, Hankey BF, Miller BA, Clegg LX, Edwards BK (eds). SEER CancerStatistics Review, 1973-1997, National Cancer Institute. NIH Pub. No. 00-2789. Bethesda, MD, 2000.
Rosenberg HM, Maurer JD, Sorlie PD, Johnson NJ, MacDorman MF, Hoyert DL, Spitler JF, Scott C. Quality of Death Rates by Race and Hispanic Origin: A Summary of Current Research. Hyattsville (MD):National Center for Health Statistics; Vital and Health Statistics, Series 2, No. 128, 1999.
Snedecor GW, Cochran WG. Statistical Methods, 7th ed. Ames (IA): Iowa State University Press; 1980.
US Bureau of the Census. Current Population Reports; Series P-25 No. 985. Washington (DC): USGovernment Printing Office; 1986.
Zelen M. Theory of early detection of breast cancer in the general population. In: Heuson J-C,Mattheiem WH, Rozencweig M, editors. Breast Cancer: Trends in Research and Treatment. New York(NY): Raven Press; 1976. p. 287-299.

Source: Cancer Facts & Figures – 2002, American Cancer Society (ACS), Atlanta, Georgia, 2002. Excludes basal and squamous cell skin and in situ carcinomas except urinary bladder. Incidence projections are based on rates from the NCI SEER Program 1979-1998.
SEER Cancer Statistics Review 1973-1999 National Cancer Institute
Table I-1
ESTIMATED NEW CANCER CASES AND DEATHS FOR 2002
All Races, By Sex
Primary Site Estimated New Cases Estimated DeathsTotal Males Females Total Males Females
All Sites 1,284,900 637,500 647,400 555,500 288,200 267,300Oral Cavity and Pharynx 28,900 18,900 10,000 7,400 4,900 2,500 Tongue 7,100 4,700 2,400 1,700 1,100 600 Mouth 9,800 5,200 4,600 2,000 1,100 900 Pharynx 8,600 6,500 2,100 2,100 1,500 600 Other Oral Cavity 3,400 2,500 900 1,600 1,200 400Digestive System 250,600 130,300 120,300 132,300 70,800 61,500 Esophagus 13,100 9,800 3,300 12,600 9,600 3,000 Stomach 21,600 13,300 8,300 12,400 7,200 5,200 Small Intestine 5,300 2,500 2,800 1,100 600 500 Colon 107,300 50,000 57,300 48,100 23,100 25,000 Rectum 41,000 22,600 18,400 8,500 4,700 3,800 Anus, Anal Canal, and Anorectum
3,900 1,700 2,200 500 200 300
Liver and Intrahepatic Bile Duct
16,600 11,000 5,600 14,100 8,900 5,200
Gallbladder and Other Biliary
7,100 3,400 3,700 3,500 1,300 2,200
Pancreas 30,300 14,700 15,600 29,700 14,500 15,200 Other Digestive 4,400 1,300 3,100 1,800 700 1,100Respiratory System 183,200 100,700 82,500 161,400 94,100 67,300 Larynx 8,900 6,900 2,000 3,700 2,900 800 Lung and Bronchus 169,400 90,200 79,200 154,900 89,200 65,700 Other Respiratory 4,900 3,600 1,300 2,800 2,000 800Bones and Joints 2,400 1,300 1,100 1,300 700 600Soft Tissues 8,300 4,400 3,900 3,900 2,000 1,900Skin (excl. basal & squamous) 58,300 32,500 25,800 9,600 6,200 3,400 Melanomas of Skin 53,600 30,100 23,500 7,400 4,700 2,700 Other non-epithelial skin 4,700 2,400 2,300 2,200 1,500 700Breast 205,000 1,500 203,500 40,000 400 39,600Genital Organs 279,100 197,700 81,400 57,100 30,900 26,200 Cervix (uterus) 13,000 13,000 4,100 4,100 Endometrium (uterus) 39,300 39,300 6,600 6,600 Ovary 23,300 23,300 13,900 13,900 Vulva 3,800 3,800 800 800 Vagina and other genital organs, female
2,000 2,000 800 800
Prostate 189,000 189,000 30,200 30,200 Testis 7,500 7,500 400 400 Penis and other genital organs, male
1,200 1,200 200 200
Urinary System 90,700 62,200 28,500 24,900 16,200 8,700 Urinary Bladder 56,500 41,500 15,000 12,600 8,600 4,000 Kidney and Renal Pelvis 31,800 19,100 12,700 11,600 7,200 4,400 Ureter and other urinary organs
2,400 1,600 800 700 400 300
Eye and Orbit 2,200 1,100 1,100 200 100 100Brain and Other Nervous System
17,000 9,600 7,400 13,100 7,200 5,900
Endocrine System 22,700 6,000 16,700 2,300 1,000 1,300 Thyroid 20,700 4,900 15,800 1,300 500 800 Other Endocrine 2,000 1,100 900 1,000 500 500Lymphoma 60,900 31,900 29,000 25,800 13,500 12,300 Hodgkin’s Disease 7,000 3,700 3,300 1,400 800 600 Non-Hodgkin’s Lymphoma 53,900 28,200 25,700 24,400 12,700 11,700Multiple Myeloma 14,600 7,800 6,800 10,800 5,500 5,300Leukemia 30,800 17,600 13,200 21,700 12,100 9,600 Lymphocytic Leukemias 10,800 6,300 4,500 5,900 3,400 2,500 Myeloid Leukemias 15,000 8,400 6,600 9,400 5,100 4,300 Other leukemia 5,000 2,900 2,100 6,400 3,600 2,800All Other Sites 30,200 14,000 16,200 43,700 22,600 21,100
Source: NCHS public use data file.
- Statistic not shown. Rate based on less than 25 cases for the time interval. Trendbased on less than 10 cases for at least one year within the time interval.Rates are per 100,000 and are age-adjusted to the 2000 U.S. standard population by5-year age groups.
£ Due to coding changes throughout the years, Lung and Bronchus includes trachea andpleura.
Table I-2
50-YEAR TRENDS IN U.S. CANCER DEATH RATES
All Races, Males and Females
All Primary Cancer Sites Combined
TotalEstimated Annual PercentPercent Change Change
Age Group 1950 1975 1999 1950-75 1975-99 1950-99
0-4 11.1 5.2 2.6 -2.8 -2.9 -76.9 5-14 6.7 4.8 2.6 -1.0 -2.8 -61.5 15-24 8.6 6.6 4.6 -0.7 -1.7 -46.7 25-34 20.4 15.1 10.6 -1.2 -1.1 -48.3 35-44 63.6 53.3 37.5 -0.4 -1.4 -41.1 45-54 174.2 178.0 130.8 0.2 -1.3 -24.9 55-64 391.3 420.2 379.9 0.3 -0.4 -2.9 65-74 710.0 778.7 836.2 0.4 0.4 17.8 75-84 1167.2 1160.9 1341.4 0.0 0.6 14.9 85+ 1450.7 1437.9 1800.0 -0.2 0.8 24.1
All Ages 195.4 199.1 202.8 0.1 0.1 3.8
Lung and Bronchus Cancer£
TotalEstimated Annual PercentPercent Change Change
Age Group 1950 1975 1999 1950-75 1975-99 1950-99
0-4 - - - - - - 5-14 - - - - - - 15-24 0.2 0.1 - -2.5 -0.9 -65.6 25-34 0.8 0.9 0.5 0.4 -1.4 -41.7 35-44 4.6 10.6 6.1 3.7 -2.5 33.8 45-54 20.2 48.8 32.1 3.6 -1.8 58.7 55-64 48.9 122.6 125.3 3.6 0.2 156.5 65-74 59.4 196.2 285.2 4.5 1.6 379.9 75-84 55.4 192.3 365.6 5.3 2.6 560.1 85+ 42.3 135.5 296.9 5.1 3.2 602.0
All Ages 14.9 42.8 56.2 4.2 1.1 275.9
SEER Cancer Statistics Review 1973-1999 National Cancer Institute

The EAPC is the Estimated Annual Percent Change over the time interval. Ratesused in the calculation of the EAPC are age-adjusted to the 2000 U.S. standardpopulation.
£ Facts and Figures, 1998. American Cancer Society, Atlanta, Georgia, 1998.NCHS public use data file.
' All Sites, Liver & Intrahep, Brain & Other nervous and Childhood cancers are forall races as opposed to whites.
§ Data prior to 1973 are from Devesa, Silverman, Young, et al. Cancer Incidence andMortality Trends Among Whites in the United States, 1947-84. JNCI 1987;79:701-770 with the exception of All Sites, Liver & Intrahep, Brain & Othernervous and Childhood cancers which come from historical Connecticut data. Datafor 1973-98 are from the same areas used in Devesa or the Connecticut registry ofthe SEER Program.NCHS public use tape. Due to coding changes throughout the years: Colon excludesother digestive tract; Rectum includes anal canal; Liver & Intrahep includesgallbladder & biliary tract, NOS; Lung & Bronchus includes trachea & pleura; Ovaryincludes fallopian tube; Urinary bladder includes other urinary organs; Kidney &Renal pelvis includes ureter; NHL and Multiple myeloma each include a small numberof leukemias; NHL includes a small number of ill-defined sites.Rates for 1950-54 are from NCI Survival Report 5 with the exception of All Sites,Oral cavity & Pharynx, Colon & Rectum, Non-Hodgkin's lymphomas and Childhoodcancers which come from historical Connecticut data. Rates for 1992-98 are fromthe SEER Program with the exception of the sites just listed which come from theConnecticut registry of the SEER Program.
Table I-3
SUMMARY OF CHANGES IN CANCER INCIDENCE AND MORTALITY, 1950-99 AND
5-YEAR RELATIVE SURVIVAL RATES, 1950-98
Males and Females, By Primary Cancer Site
All Races Whites
Percent Change 1950-99'5-Year Relative
Estimated Actual U.S. Survival RatesCancer Cancer Incidence§ Mortality (Percent)Cases Deaths
Primary Site in 1999 £ in 1999 Total EAPC Total EAPC 1950-54 1992-98
Oral cavity and Pharynx 29,800 7,486 -44.6 -0.7 -46.9 -1.0 46 58.8Esophagus 12,500 11,917 0.7 0.3 26.8 0.6 4 14.7Stomach 21,900 12,711 -77.8 -2.5 -83.0 -3.6 12 20.9Colon and Rectum 129,400 57,155 -2.1 -0.2 -39.7 -1.0 37 62.6 Colon 94,700 48,433 11.2 0.1 -26.6 -0.5 41 62.7 Rectum 34,700 8,722 -23.9 -0.7 -68.8 -2.7 40 62.4Liver and Intrahep 14,500 15,972 206.7 1.9 21.5 0.5 1 6.5Pancreas 28,600 29,081 3.7 0.0 19.3 0.1 1 4.3Larynx 10,600 3,815 28.6 0.1 -21.0 -0.4 52 65.9Lung and Bronchus 171,600 152,480 227.9 2.1 248.2 2.3 6 15.0 Males 94,000 89,707 149.0 1.1 180.5 1.6 5 13.3 Females 77,600 62,773 571.5 4.2 600.6 4.6 9 17.0Melanomas of skin 44,200 7,215 506.7 4.1 161.8 1.9 49 89.3Breast(females) 175,000 41,144 62.9 1.3 -19.8 -0.2 60 87.6Cervix uteri 12,800 4,204 -80.4 -2.7 -78.4 -3.5 59 72.1Corpus and Uterus, NOS 37,400 6,468 1.8 -0.5 -68.9 -2.2 72 86.0Ovary 25,200 14,035 -1.2 0.2 -2.2 -0.3 30 52.5Prostate 179,300 31,728 206.1 3.2 -8.2 0.3 43 97.8Testis 7,400 378 144.6 1.9 -68.8 -3.0 57 95.7Urinary bladder 54,200 12,205 54.7 0.9 -34.8 -1.1 53 82.3Kidney and Renal pelvis 30,000 11,461 128.3 1.9 29.0 0.6 34 62.4Brain and Other nervous 16,800 12,765 112.9 1.1 49.3 0.6 21 31.5Thyroid 18,100 1,241 169.2 1.9 -49.1 -1.7 80 96.0Hodgkin's disease 7,200 1,403 2.1 0.1 -73.6 -3.3 30 84.7Non-Hodgkin's lymphomas 56,800 22,612 189.8 2.8 128.1 1.6 33 56.1Multiple myeloma 13,700 10,565 183.2 1.6 211.4 1.8 6 29.5Leukemias 30,200 21,014 2.0 0.2 -3.9 -0.4 10 47.3Childhood(0-14 yrs) 8,400 1,498 44.3 0.8 -69.0 -2.7 20 78.6All Sites 1,221,800 549,829 58.7 1.0 0.2 0.1 35 63.8
SEER Cancer Statistics Review 1973-1999 National Cancer Institute

Note: Incidence and death rates are per 100,000 and are age-adjusted to the 2000 U.S.standard population by 5-year age groups. Survival rates are expressed aspercents.
§ SEER 12 areas.NCHS public use data file.
' SEER 9 areas.
- Statistic could not be calculated.
Table I-4AGE-ADJUSTED SEER INCIDENCE AND U.S. DEATH RATES AND 5-YEAR RELATIVE SURVIVAL RATES
By Primary Cancer Site, Sex and Time Period
All Races
Incidence§ US Mortality Survival '
(1995-99) (1995-99) (1992-98)Site Total Males Females Total Males Females Total Males Females
All Sites 468.9 549.6 416.1 206.0 259.1 171.4 62.4 61.9 63.0
Oral Cavity & Pharynx: 11.1 16.4 6.7 3.0 4.6 1.8 56.4 54.6 60.1
Lip 1.1 1.9 0.4 0.0 0.1 0.0 94.5 95.3 91.1 Tongue 2.5 3.6 1.6 0.7 1.0 0.4 52.1 49.5 57.2 Salivary gland 1.2 1.5 1.0 0.3 0.4 0.2 73.9 69.9 78.5 Floor of mouth 0.9 1.3 0.6 0.1 0.1 0.0 51.3 50.2 53.8 Gum & other 1.8 2.3 1.4 0.5 0.7 0.4 53.1 45.4 64.4 oral cavity Nasopharynx 0.8 1.1 0.5 0.3 0.4 0.2 57.3 58.0 55.4 Tonsil 1.2 2.0 0.5 0.2 0.3 0.1 52.8 52.6 53.2 Oropharynx 0.3 0.5 0.2 0.2 0.3 0.1 37.0 38.4 34.1 Hypopharynx 0.9 1.6 0.4 0.2 0.3 0.1 30.2 29.5 32.4 Other oral cavity 0.3 0.5 0.2 0.6 1.0 0.3 31.9 35.2 23.1 & pharynx
Digestive System: 91.0 112.0 74.9 48.7 62.2 38.6 43.4 41.6 45.6 Esophagus 4.5 7.5 2.1 4.3 7.6 1.8 13.3 13.4 13.1 Stomach 9.1 13.1 6.2 5.0 7.1 3.5 22.0 20.8 24.0 Small intestine 1.6 1.9 1.4 0.4 0.5 0.3 52.6 50.7 54.6 Colon & Rectum: 53.7 63.5 46.3 21.7 26.3 18.5 61.9 61.9 61.9 Colon 38.8 44.4 34.7 18.7 22.3 16.1 61.9 62.3 61.5 Rectum 14.9 19.1 11.6 3.1 4.0 2.4 61.7 60.9 62.8 Anus, anal canal & 1.3 1.2 1.3 0.2 0.1 0.2 64.7 56.8 70.4 anorectum Liver & Intrahep: 5.7 8.5 3.3 4.5 6.5 3.0 6.5 6.2 7.1 Liver 4.8 7.5 2.6 3.6 5.5 2.2 7.1 6.5 8.5 Intrahep bile duct 0.9 1.1 0.7 0.9 1.0 0.8 3.5 4.3 2.5 Gallbladder 1.2 0.9 1.5 0.8 0.5 1.0 15.1 14.0 15.3 Other biliary 1.4 1.8 1.2 0.6 0.7 0.5 18.2 19.1 17.2 Pancreas 10.9 12.4 9.8 10.6 12.2 9.3 4.3 4.2 4.4 Retroperitoneum 0.4 0.5 0.4 0.1 0.1 0.1 46.7 44.8 48.5 Peritoneum, omentum & 0.6 0.2 0.9 0.2 0.1 0.2 33.6 18.5 37.5 mesentery Other digestive 0.4 0.5 0.3 0.2 0.3 0.2 6.3 4.5 8.4 system
Respiratory System: 68.7 91.7 51.9 59.6 84.5 41.8 18.3 18.1 18.6 Nose, nasal cavity & 0.7 0.9 0.5 0.2 0.2 0.1 56.4 55.1 58.2 middle ear Larynx 4.0 7.1 1.6 1.5 2.7 0.6 64.4 65.9 58.9 Lung & bronchus 62.9 81.6 49.4 57.7 81.2 41.0 14.7 13.1 16.7 Pleura 0.9 1.8 0.3 0.2 0.3 0.1 7.3 4.6 16.9 Trachea & other 0.2 0.3 0.1 0.1 0.1 0.1 45.3 47.3 40.6 respiratory organs
Bones & joints 0.9 1.0 0.8 0.5 0.6 0.4 70.0 68.4 72.2
Soft tissue (incl heart) 2.8 3.4 2.4 1.5 1.6 1.4 66.8 66.8 66.7
Skin (ex basal & squam): 19.5 25.5 14.9 3.6 5.3 2.3 78.5 70.3 91.0 Melanomas of skin 16.3 20.4 13.3 2.7 4.0 1.8 89.1 87.0 91.5 Other non-epithelial 3.2 5.1 1.5 0.8 1.4 0.4 42.8 34.4 85.9 skin
Breast 73.4 1.1 134.1 16.4 0.3 28.8 86.2 83.0 86.2
SEER Cancer Statistics Review 1973-1999 National Cancer Institute

Note: Incidence and death rates are per 100,000 and are age-adjusted to the 2000 U.S.standard population by 5-year age groups. Survival rates are expressed aspercents.
§ SEER 12 areas.NCHS public use data file.
' SEER 9 areas.- Statistic could not be calculated.
Table I-4 - continuedAGE-ADJUSTED SEER INCIDENCE AND U.S. DEATH RATES AND 5-YEAR RELATIVE SURVIVAL RATES
By Primary Cancer Site, Sex and Time Period
All Races
Incidence§ US Mortality Survival '
(1995-99) (1995-99) (1992-98)Site Total Males Females Total Males Females Total Males Females
Female Genital System: 29.8 - 55.0 9.7 - 17.1 71.2 - 71.2 Cervix uteri 5.1 - 9.8 1.7 - 3.1 70.7 - 70.7 Corpus uteri 13.3 - 24.2 1.2 - 2.1 85.1 - 85.1 Uterus, NOS 0.3 - 0.4 1.2 - 2.1 29.1 - 29.1 Ovary 9.1 - 16.8 5.1 - 9.0 53.1 - 53.1 Vagina 0.4 - 0.7 0.2 - 0.3 46.3 - 46.3 Vulva 1.3 - 2.2 0.3 - 0.5 75.6 - 75.6 Other female 0.4 - 0.7 0.1 - 0.2 66.4 - 66.4 genital system
Male Genital System: 74.6 171.6 - 12.8 34.4 - 96.7 96.7 - Prostate 71.5 165.4 - 12.6 33.9 - 97.0 97.0 - Testis 2.5 5.1 - 0.1 0.3 - 95.4 95.4 - Penis 0.3 0.7 - 0.1 0.2 - 72.3 72.3 - Other male 0.2 0.4 - 0.0 0.0 - 77.4 77.4 - genital system
Urinary System: 31.7 51.4 17.1 8.9 14.1 5.4 74.1 76.5 68.9 Urinary bladder 20.0 35.1 9.1 4.4 7.7 2.4 81.5 83.8 75.3 Kidney & renal pelvis 10.8 15.0 7.5 4.3 6.1 2.9 62.1 62.0 62.1 Ureter 0.5 0.8 0.3 0.1 0.2 0.1 56.0 55.2 57.2 Other urinary system 0.3 0.6 0.2 0.1 0.1 0.1 63.5 70.2 52.1
Eye & Orbit 0.8 1.0 0.7 0.1 0.1 0.1 81.3 80.2 82.7
Brain & Nervous System: 6.4 7.6 5.4 4.7 5.7 3.9 32.2 32.7 31.6 Brain 6.0 7.2 5.0 4.6 5.6 3.8 29.5 30.0 29.0 Cranial nerves & other 0.4 0.4 0.3 0.1 0.1 0.1 72.2 75.1 68.8 nervous system
Endocrine System: 7.2 4.2 10.1 0.8 0.8 0.8 92.2 86.8 94.3 Thyroid 6.6 3.5 9.5 0.5 0.4 0.5 95.6 92.4 96.7 Other endocrine & 0.6 0.7 0.6 0.3 0.4 0.3 58.5 61.1 55.5 thymus
Lymphomas: 21.8 26.7 17.8 9.3 11.5 7.6 59.7 56.2 64.0 Hodgkin's disease 2.7 3.0 2.4 0.5 0.6 0.4 83.8 81.7 86.1 Non-Hodgkin's 19.1 23.6 15.4 8.7 10.8 7.2 55.0 51.4 59.5 lymphomas
Multiple myeloma 5.5 6.8 4.5 3.9 4.9 3.3 30.2 31.5 28.8
Leukemias: 12.0 15.8 9.3 7.8 10.4 6.0 45.9 47.1 44.3 Lymphocytic: 5.2 6.9 3.9 2.3 3.2 1.6 68.8 68.1 69.7 Acute lymphocytic 1.5 1.7 1.3 0.5 0.6 0.4 63.5 61.6 66.1 Chronic lymphocytic 3.5 4.9 2.4 1.6 2.4 1.1 73.1 73.0 73.2 Other lymphocytic 0.2 0.2 0.1 0.1 0.2 0.1 44.9 44.9 45.1 Myeloid: 5.4 6.8 4.3 3.4 4.4 2.7 23.9 24.0 23.9 Acute myeloid 3.6 4.4 3.0 2.4 3.1 2.0 18.7 17.7 19.7 Chronic myeloid 1.7 2.2 1.3 0.8 1.1 0.6 34.5 35.6 33.1 Other myeloid 0.1 0.1 0.1 0.1 0.2 0.1 24.1 22.7 25.2 Monocytic: 0.3 0.3 0.2 0.1 0.1 0.1 18.0 20.3 14.7 Acute monocytic 0.2 0.3 0.2 0.1 0.1 0.0 19.6 22.0 15.9 Chronic monocytic 0.0 0.0 0.0 0.0 0.0 0.0 - - - Other monocytic 0.0 0.0 0.0 0.0 0.0 0.0 - - - Other: 1.3 1.8 0.9 2.1 2.7 1.6 39.9 47.5 27.3 Other acute 0.5 0.6 0.4 1.0 1.3 0.8 9.5 9.8 9.2 Other chronic 0.0 0.0 0.0 0.1 0.1 0.1 25.9 - 12.6 Aleukemic, subleuk & 0.8 1.1 0.5 0.9 1.3 0.7 58.3 66.9 41.4 NOS
Ill-defined & 11.8 13.4 10.6 14.8 18.1 12.3 13.7 15.4 12.2 unspecified
SEER Cancer Statistics Review 1973-1999 National Cancer Institute

Note: Incidence and death rates are per 100,000 and are age-adjusted to the 2000 U.S.standard population by 5-year age groups. Survival rates are expressed aspercents.
§ SEER 12 areas.NCHS public use data file.
' SEER 9 areas.- Statistic could not be calculated.
Table I-5AGE-ADJUSTED SEER INCIDENCE AND U.S. DEATH RATES AND 5-YEAR RELATIVE SURVIVAL RATES
By Primary Cancer Site, Sex and Time Period
Whites
Incidence§ US Mortality Survival '
(1995-99) (1995-99) (1992-98)Site Total Males Females Total Males Females Total Males Females
All Sites 473.2 546.1 427.0 202.5 253.0 169.8 63.8 63.5 64.2
Oral Cavity & Pharynx: 10.9 16.1 6.6 2.8 4.2 1.7 58.8 57.8 60.9 Lip 1.2 2.3 0.4 0.0 0.1 0.0 94.5 95.3 90.8 Tongue 2.6 3.7 1.6 0.7 1.0 0.4 53.9 51.9 57.7 Salivary gland 1.2 1.6 1.0 0.3 0.4 0.2 73.5 69.6 78.1 Floor of mouth 0.9 1.3 0.6 0.1 0.1 0.0 54.4 54.1 55.1 Gum & other 1.8 2.2 1.5 0.5 0.6 0.4 55.9 49.3 65.0 oral cavity Nasopharynx 0.4 0.6 0.3 0.2 0.3 0.1 50.3 50.7 49.2 Tonsil 1.2 2.0 0.5 0.2 0.3 0.1 55.4 55.8 54.1 Oropharynx 0.3 0.5 0.2 0.2 0.3 0.1 40.1 42.3 35.8 Hypopharynx 0.9 1.5 0.4 0.1 0.2 0.1 32.2 31.3 34.8 Other oral cavity 0.3 0.5 0.2 0.5 0.9 0.3 34.5 38.2 25.7 & pharynx
Digestive System: 87.4 107.3 72.1 46.6 59.6 36.9 45.0 43.3 47.0 Esophagus 4.3 7.3 2.0 4.1 7.2 1.7 14.7 14.7 14.8 Stomach 7.7 11.3 5.1 4.4 6.3 3.0 20.9 19.5 23.4 Small intestine 1.6 1.9 1.4 0.4 0.5 0.3 53.9 51.3 56.7 Colon & Rectum: 53.2 63.1 45.7 21.3 25.8 18.0 62.6 62.6 62.7 Colon 38.4 44.2 34.2 18.2 21.9 15.6 62.7 63.0 62.4 Rectum 14.8 18.9 11.6 3.1 4.0 2.4 62.4 61.6 63.5 Anus, anal canal & 1.3 1.2 1.4 0.2 0.1 0.2 67.1 61.1 71.2 anorectum Liver & Intrahep: 4.5 6.8 2.7 4.1 5.9 2.8 6.5 5.9 7.8 Liver 3.7 5.7 2.0 3.2 4.9 2.0 7.2 6.1 9.7 Intrahep bile duct 0.9 1.1 0.7 0.9 1.0 0.8 4.1 5.1 2.7 Gallbladder 1.2 0.8 1.5 0.8 0.5 0.9 14.9 12.9 15.4 Other biliary 1.4 1.7 1.2 0.6 0.7 0.5 19.0 20.8 17.1 Pancreas 10.6 12.1 9.4 10.3 12.0 9.0 4.3 4.3 4.4 Retroperitoneum 0.4 0.5 0.4 0.1 0.1 0.1 47.8 46.2 49.3 Peritoneum, omentum & 0.7 0.2 1.0 0.2 0.1 0.2 32.5 14.7 37.3 mesentery Other digestive 0.4 0.5 0.3 0.2 0.3 0.2 4.7 1.4 8.6 system
Respiratory System: 69.1 89.9 54.0 59.3 82.8 42.5 18.6 18.5 18.8 Nose, nasal cavity & 0.7 0.9 0.5 0.2 0.2 0.1 59.6 59.4 59.8 middle ear Larynx 4.0 7.0 1.6 1.3 2.4 0.5 65.9 67.7 59.2 Lung & bronchus 63.2 79.8 51.4 57.5 79.7 41.7 15.0 13.3 17.0 Pleura 1.0 1.9 0.3 0.2 0.3 0.1 7.4 4.9 17.0 Trachea & other 0.2 0.3 0.1 0.1 0.1 0.1 43.1 45.1 38.7 respiratory organs
Bones & joints 1.0 1.1 0.8 0.5 0.6 0.4 70.4 69.3 71.9
Soft tissue (incl heart) 2.8 3.4 2.4 1.5 1.6 1.3 67.8 68.4 67.2
Skin (ex basal & squam): 22.2 28.6 17.3 3.9 5.8 2.5 80.1 72.5 91.3 Melanomas of skin 19.0 23.5 15.7 3.1 4.4 2.1 89.3 87.1 91.8 Other non-epithelial 3.2 5.1 1.5 0.8 1.4 0.4 43.4 34.9 86.5 skin
Breast 75.5 1.1 139.0 16.0 0.3 28.2 87.5 86.2 87.6
SEER Cancer Statistics Review 1973-1999 National Cancer Institute

Note: Incidence and death rates are per 100,000 and are age-adjusted to the 2000 U.S.standard population by 5-year age groups. Survival rates are expressed aspercents.
§ SEER 12 areas.NCHS public use data file.
' SEER 9 areas.- Statistic could not be calculated.
Table I-5 - continuedAGE-ADJUSTED SEER INCIDENCE AND U.S. DEATH RATES AND 5-YEAR RELATIVE SURVIVAL RATES
By Primary Cancer Site, Sex and Time Period
Whites
Incidence§ US Mortality Survival '
(1995-99) (1995-99) (1992-98)Site Total Males Females Total Males Females Total Males Females
Female Genital System: 30.7 - 57.0 9.5 - 16.9 72.2 - 72.2 Cervix uteri 4.7 - 9.2 1.5 - 2.8 72.1 - 72.1 Corpus uteri 14.0 - 25.7 1.1 - 2.0 86.8 - 86.8 Uterus, NOS 0.2 - 0.4 1.1 - 1.9 26.7 - 26.7 Ovary 9.6 - 17.9 5.2 - 9.3 52.5 - 52.5 Vagina 0.4 - 0.7 0.1 - 0.2 47.2 - 47.2 Vulva 1.3 - 2.4 0.3 - 0.5 75.5 - 75.5 Other female 0.4 - 0.7 0.1 - 0.2 67.0 - 67.0 genital system
Male Genital System: 72.6 165.7 - 11.8 31.7 - 97.5 97.5 - Prostate 69.1 158.7 - 11.6 31.2 - 97.8 97.8 - Testis 3.0 6.0 - 0.1 0.3 - 95.7 95.7 - Penis 0.3 0.7 - 0.1 0.2 - 73.4 73.4 - Other male 0.1 0.3 - 0.0 0.0 - 77.8 77.8 - genital system
Urinary System: 33.7 55.1 17.9 9.0 14.5 5.4 75.2 77.7 69.6 Urinary bladder 21.8 38.5 9.7 4.5 8.0 2.3 82.3 84.4 76.4 Kidney & renal pelvis 11.0 15.2 7.7 4.3 6.2 2.9 62.4 62.8 61.8 Ureter 0.6 0.8 0.4 0.1 0.2 0.1 58.5 59.3 57.3 Other urinary system 0.3 0.5 0.2 0.1 0.1 0.1 63.6 67.5 55.1
Eye & Orbit 0.9 1.1 0.7 0.1 0.1 0.1 80.9 80.0 81.9
Brain & Nervous System: 7.0 8.3 5.9 5.1 6.1 4.2 31.5 31.8 31.0 Brain 6.6 7.9 5.5 4.9 6.0 4.1 28.7 28.8 28.5 Cranial nerves & other 0.4 0.4 0.3 0.1 0.1 0.1 74.8 78.6 70.0 nervous system
Endocrine System: 7.4 4.3 10.4 0.8 0.8 0.8 92.7 87.9 94.6 Thyroid 6.8 3.6 9.8 0.5 0.4 0.5 96.0 92.9 97.0 Other endocrine & 0.6 0.7 0.5 0.3 0.4 0.3 57.3 61.9 51.9 thymus
Lymphomas: 22.9 27.8 18.8 9.6 11.8 7.9 60.7 57.5 64.7 Hodgkin's disease 3.0 3.3 2.7 0.5 0.7 0.4 84.7 82.8 86.9 Non-Hodgkin's 19.9 24.5 16.0 9.1 11.2 7.5 56.1 52.7 60.2 lymphomas
Multiple myeloma 5.1 6.4 4.1 3.6 4.5 3.0 29.5 30.9 28.0
Leukemias: 12.6 16.6 9.7 8.0 10.6 6.1 47.3 48.4 45.7 Lymphocytic: 5.5 7.3 4.2 2.3 3.3 1.7 69.9 69.4 70.8 Acute lymphocytic 1.6 1.8 1.4 0.5 0.7 0.4 63.4 61.5 66.0 Chronic lymphocytic 3.7 5.3 2.6 1.7 2.5 1.1 74.4 74.4 74.4 Other lymphocytic 0.2 0.2 0.1 0.1 0.2 0.1 46.7 45.1 49.1 Myeloid: 5.5 7.0 4.4 3.5 4.5 2.8 23.8 23.7 23.9 Acute myeloid 3.7 4.6 3.1 2.5 3.2 2.0 18.1 17.0 19.4 Chronic myeloid 1.7 2.3 1.3 0.8 1.1 0.6 34.9 35.9 33.7 Other myeloid 0.1 0.1 0.1 0.1 0.2 0.1 25.0 26.7 23.2 Monocytic: 0.3 0.4 0.2 0.1 0.1 0.1 20.3 20.4 17.7 Acute monocytic 0.2 0.3 0.2 0.1 0.1 0.0 20.9 22.2 18.9 Chronic monocytic 0.0 0.0 0.0 0.0 0.0 0.0 - - - Other monocytic 0.0 0.0 0.0 0.0 0.0 0.0 - - - Other: 1.3 1.9 0.9 2.1 2.8 1.6 42.4 50.8 28.3 Other acute 0.5 0.6 0.4 1.1 1.4 0.9 9.3 9.2 9.4 Other chronic 0.0 0.0 0.0 0.1 0.1 0.1 25.2 - - Aleukemic, subleuk & 0.8 1.2 0.5 0.9 1.3 0.7 61.8 71.2 42.7 NOS
Ill-defined & 11.6 13.3 10.3 14.5 17.7 12.1 14.1 16.4 12.1 unspecified
SEER Cancer Statistics Review 1973-1999 National Cancer Institute

Note: Incidence and death rates are per 100,000 and are age-adjusted to the 2000 U.S.standard population by 5-year age groups. Survival rates are expressed aspercents.
§ SEER 12 areas.NCHS public use data file.
' SEER 9 areas.- Statistic could not be calculated.
Table I-6AGE-ADJUSTED SEER INCIDENCE AND U.S. DEATH RATES AND 5-YEAR RELATIVE SURVIVAL RATES
By Primary Cancer Site, Sex and Time Period
Blacks
Incidence§ US Mortality Survival '
(1995-99) (1995-99) (1992-98)Site Total Males Females Total Males Females Total Males Females
All Sites 516.0 674.5 405.3 263.0 359.2 203.5 52.6 54.0 51.0
Oral Cavity & Pharynx: 12.8 20.8 6.7 4.8 8.3 2.2 34.9 29.5 49.3 Lip 0.1 0.2 0.1 0.0 0.0 0.0 - - - Tongue 2.6 4.2 1.4 1.0 1.7 0.5 33.7 30.0 43.7 Salivary gland 1.0 1.2 0.9 0.2 0.3 0.2 75.9 63.2 89.1 Floor of mouth 1.2 1.9 0.7 0.1 0.3 0.1 32.3 29.8 40.7 Gum & other 2.3 3.6 1.3 0.7 1.1 0.4 35.0 23.5 61.2 oral cavity Nasopharynx 0.7 1.1 0.4 0.4 0.6 0.2 42.5 42.3 40.9 Tonsil 2.0 3.5 0.8 0.4 0.8 0.2 35.1 32.4 43.7 Oropharynx 0.6 1.2 0.2 0.5 0.8 0.2 24.3 25.2 - Hypopharynx 1.6 3.0 0.5 0.3 0.5 0.1 20.5 19.3 24.9 Other oral cavity 0.5 1.0 0.2 1.2 2.3 0.5 15.5 17.5 - & pharynx
Digestive System: 113.0 135.3 96.4 69.4 89.6 55.3 34.2 31.5 36.9 Esophagus 7.4 11.7 4.2 7.4 12.9 3.5 8.3 9.0 6.7 Stomach 13.8 18.7 10.2 9.8 14.2 6.8 20.0 19.2 21.1 Small intestine 2.9 3.4 2.6 0.6 0.7 0.5 47.4 45.9 50.2 Colon & Rectum: 61.3 69.3 55.6 29.0 34.4 25.4 52.8 52.7 52.8 Colon 47.0 51.5 44.0 25.4 29.7 22.5 52.8 53.2 52.5 Rectum 14.2 17.8 11.6 3.6 4.7 2.8 52.7 51.6 53.8 Anus, anal canal & 1.4 1.6 1.2 0.2 0.2 0.2 49.1 36.6 62.9 anorectum Liver & Intrahep: 6.6 10.0 3.9 6.1 9.2 3.9 4.0 3.1 6.2 Liver 6.0 9.2 3.4 5.4 8.3 3.2 4.3 3.4 6.8 Intrahep bile duct 0.6 0.8 0.5 0.8 0.9 0.7 0.0 0.0 - Gallbladder 1.4 1.0 1.7 0.9 0.6 1.1 11.5 11.3 11.6 Other biliary 1.1 1.3 1.0 0.5 0.5 0.4 22.6 14.0 28.1 Pancreas 15.9 17.2 14.7 14.4 16.2 13.0 3.9 4.2 3.7 Retroperitoneum 0.4 0.5 0.4 0.1 0.1 0.1 42.8 - 45.3 Peritoneum, omentum & 0.4 0.1 0.6 0.1 0.1 0.2 43.7 - 30.9 mesentery Other digestive 0.4 0.5 0.4 0.3 0.4 0.2 2.6 - - system
Respiratory System: 89.5 135.2 56.9 71.2 115.6 41.5 16.1 15.5 17.1 Nose, nasal cavity & 0.8 1.1 0.6 0.2 0.3 0.2 39.1 35.3 45.0 middle ear Larynx 6.6 12.0 2.6 2.9 5.8 0.9 54.1 54.3 54.0 Lung & bronchus 81.1 120.6 53.1 67.8 109.1 40.2 12.3 10.8 14.7 Pleura 0.7 1.2 0.3 0.1 0.1 0.0 7.6 2.6 - Trachea & other 0.3 0.4 0.2 0.2 0.2 0.1 38.3 - - respiratory organs
Bones & joints 0.8 0.9 0.6 0.5 0.7 0.4 65.4 61.1 69.8
Soft tissue (incl heart) 3.0 3.3 2.7 1.8 1.7 1.9 64.3 63.1 65.6
Skin (ex basal & squam): 4.8 8.0 2.3 1.1 1.6 0.8 39.8 31.8 76.1 Melanomas of skin 1.2 1.6 0.9 0.5 0.5 0.5 65.5 69.4 61.9 Other non-epithelial 3.7 6.4 1.4 0.7 1.1 0.3 36.4 28.9 81.8 skin
Breast 69.7 1.8 121.5 22.0 0.7 37.1 72.4 60.0 72.5
SEER Cancer Statistics Review 1973-1999 National Cancer Institute
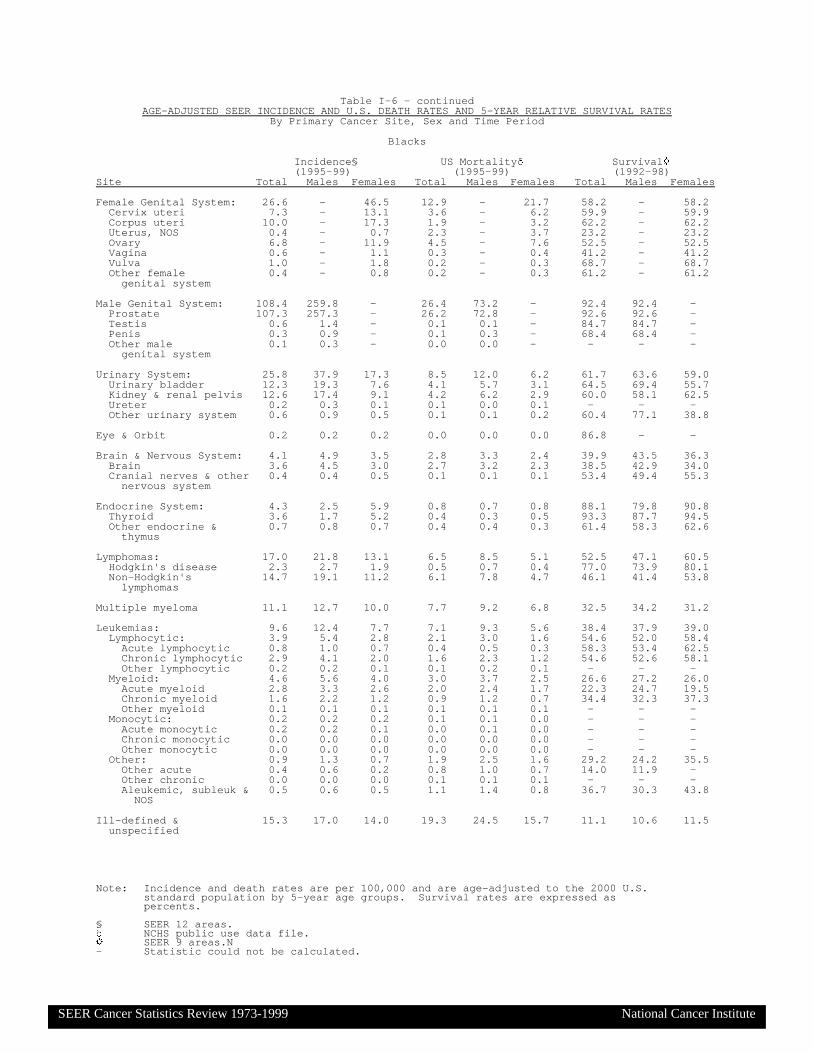
Note: Incidence and death rates are per 100,000 and are age-adjusted to the 2000 U.S.standard population by 5-year age groups. Survival rates are expressed aspercents.
§ SEER 12 areas.NCHS public use data file.
' SEER 9 areas.N- Statistic could not be calculated.
Table I-6 - continuedAGE-ADJUSTED SEER INCIDENCE AND U.S. DEATH RATES AND 5-YEAR RELATIVE SURVIVAL RATES
By Primary Cancer Site, Sex and Time Period
Blacks
Incidence§ US Mortality Survival '
(1995-99) (1995-99) (1992-98)Site Total Males Females Total Males Females Total Males Females
Female Genital System: 26.6 - 46.5 12.9 - 21.7 58.2 - 58.2 Cervix uteri 7.3 - 13.1 3.6 - 6.2 59.9 - 59.9 Corpus uteri 10.0 - 17.3 1.9 - 3.2 62.2 - 62.2 Uterus, NOS 0.4 - 0.7 2.3 - 3.7 23.2 - 23.2 Ovary 6.8 - 11.9 4.5 - 7.6 52.5 - 52.5 Vagina 0.6 - 1.1 0.3 - 0.4 41.2 - 41.2 Vulva 1.0 - 1.8 0.2 - 0.3 68.7 - 68.7 Other female 0.4 - 0.8 0.2 - 0.3 61.2 - 61.2 genital system
Male Genital System: 108.4 259.8 - 26.4 73.2 - 92.4 92.4 - Prostate 107.3 257.3 - 26.2 72.8 - 92.6 92.6 - Testis 0.6 1.4 - 0.1 0.1 - 84.7 84.7 - Penis 0.3 0.9 - 0.1 0.3 - 68.4 68.4 - Other male 0.1 0.3 - 0.0 0.0 - - - - genital system
Urinary System: 25.8 37.9 17.3 8.5 12.0 6.2 61.7 63.6 59.0 Urinary bladder 12.3 19.3 7.6 4.1 5.7 3.1 64.5 69.4 55.7 Kidney & renal pelvis 12.6 17.4 9.1 4.2 6.2 2.9 60.0 58.1 62.5 Ureter 0.2 0.3 0.1 0.1 0.0 0.1 - - - Other urinary system 0.6 0.9 0.5 0.1 0.1 0.2 60.4 77.1 38.8
Eye & Orbit 0.2 0.2 0.2 0.0 0.0 0.0 86.8 - -
Brain & Nervous System: 4.1 4.9 3.5 2.8 3.3 2.4 39.9 43.5 36.3 Brain 3.6 4.5 3.0 2.7 3.2 2.3 38.5 42.9 34.0 Cranial nerves & other 0.4 0.4 0.5 0.1 0.1 0.1 53.4 49.4 55.3 nervous system
Endocrine System: 4.3 2.5 5.9 0.8 0.7 0.8 88.1 79.8 90.8 Thyroid 3.6 1.7 5.2 0.4 0.3 0.5 93.3 87.7 94.5 Other endocrine & 0.7 0.8 0.7 0.4 0.4 0.3 61.4 58.3 62.6 thymus
Lymphomas: 17.0 21.8 13.1 6.5 8.5 5.1 52.5 47.1 60.5 Hodgkin's disease 2.3 2.7 1.9 0.5 0.7 0.4 77.0 73.9 80.1 Non-Hodgkin's 14.7 19.1 11.2 6.1 7.8 4.7 46.1 41.4 53.8 lymphomas
Multiple myeloma 11.1 12.7 10.0 7.7 9.2 6.8 32.5 34.2 31.2
Leukemias: 9.6 12.4 7.7 7.1 9.3 5.6 38.4 37.9 39.0 Lymphocytic: 3.9 5.4 2.8 2.1 3.0 1.6 54.6 52.0 58.4 Acute lymphocytic 0.8 1.0 0.7 0.4 0.5 0.3 58.3 53.4 62.5 Chronic lymphocytic 2.9 4.1 2.0 1.6 2.3 1.2 54.6 52.6 58.1 Other lymphocytic 0.2 0.2 0.1 0.1 0.2 0.1 - - - Myeloid: 4.6 5.6 4.0 3.0 3.7 2.5 26.6 27.2 26.0 Acute myeloid 2.8 3.3 2.6 2.0 2.4 1.7 22.3 24.7 19.5 Chronic myeloid 1.6 2.2 1.2 0.9 1.2 0.7 34.4 32.3 37.3 Other myeloid 0.1 0.1 0.1 0.1 0.1 0.1 - - - Monocytic: 0.2 0.2 0.2 0.1 0.1 0.0 - - - Acute monocytic 0.2 0.2 0.1 0.0 0.1 0.0 - - - Chronic monocytic 0.0 0.0 0.0 0.0 0.0 0.0 - - - Other monocytic 0.0 0.0 0.0 0.0 0.0 0.0 - - - Other: 0.9 1.3 0.7 1.9 2.5 1.6 29.2 24.2 35.5 Other acute 0.4 0.6 0.2 0.8 1.0 0.7 14.0 11.9 - Other chronic 0.0 0.0 0.0 0.1 0.1 0.1 - - - Aleukemic, subleuk & 0.5 0.6 0.5 1.1 1.4 0.8 36.7 30.3 43.8 NOS
Ill-defined & 15.3 17.0 14.0 19.3 24.5 15.7 11.1 10.6 11.5 unspecified
SEER Cancer Statistics Review 1973-1999 National Cancer Institute
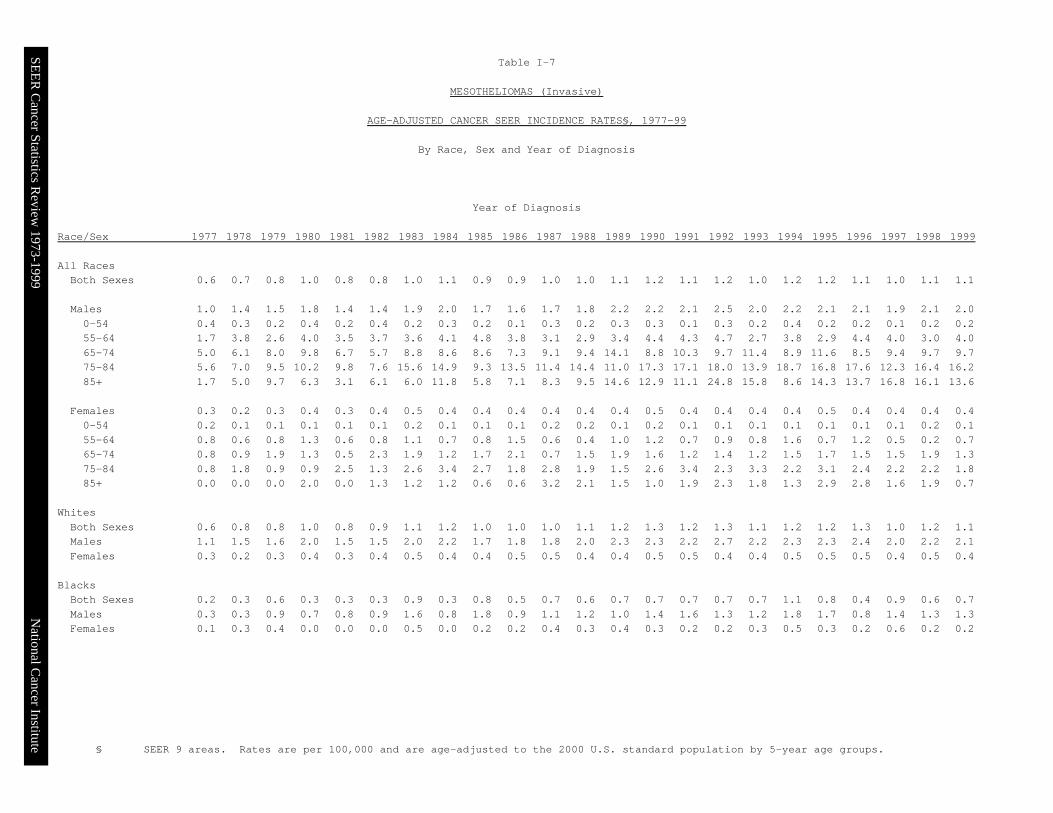
§ SEER 9 areas. Rates are per 100,000 and are age-adjusted to the 2000 U.S. standard population by 5-year age groups.
Table I-7
MESOTHELIOMAS (Invasive)
AGE-ADJUSTED CANCER SEER INCIDENCE RATES§, 1977-99
By Race, Sex and Year of Diagnosis
Year of Diagnosis Race/Sex 1977 1978 1979 1980 1981 1982 1983 1984 1985 1986 1987 1988 1989 1990 1991 1992 1993 1994 1995 1996 1997 1998 1999 All Races Both Sexes 0.6 0.7 0.8 1.0 0.8 0.8 1.0 1.1 0.9 0.9 1.0 1.0 1.1 1.2 1.1 1.2 1.0 1.2 1.2 1.1 1.0 1.1 1.1 Males 1.0 1.4 1.5 1.8 1.4 1.4 1.9 2.0 1.7 1.6 1.7 1.8 2.2 2.2 2.1 2.5 2.0 2.2 2.1 2.1 1.9 2.1 2.0 0-54 0.4 0.3 0.2 0.4 0.2 0.4 0.2 0.3 0.2 0.1 0.3 0.2 0.3 0.3 0.1 0.3 0.2 0.4 0.2 0.2 0.1 0.2 0.2 55-64 1.7 3.8 2.6 4.0 3.5 3.7 3.6 4.1 4.8 3.8 3.1 2.9 3.4 4.4 4.3 4.7 2.7 3.8 2.9 4.4 4.0 3.0 4.0 65-74 5.0 6.1 8.0 9.8 6.7 5.7 8.8 8.6 8.6 7.3 9.1 9.4 14.1 8.8 10.3 9.7 11.4 8.9 11.6 8.5 9.4 9.7 9.7 75-84 5.6 7.0 9.5 10.2 9.8 7.6 15.6 14.9 9.3 13.5 11.4 14.4 11.0 17.3 17.1 18.0 13.9 18.7 16.8 17.6 12.3 16.4 16.2 85+ 1.7 5.0 9.7 6.3 3.1 6.1 6.0 11.8 5.8 7.1 8.3 9.5 14.6 12.9 11.1 24.8 15.8 8.6 14.3 13.7 16.8 16.1 13.6 Females 0.3 0.2 0.3 0.4 0.3 0.4 0.5 0.4 0.4 0.4 0.4 0.4 0.4 0.5 0.4 0.4 0.4 0.4 0.5 0.4 0.4 0.4 0.4 0-54 0.2 0.1 0.1 0.1 0.1 0.1 0.2 0.1 0.1 0.1 0.2 0.2 0.1 0.2 0.1 0.1 0.1 0.1 0.1 0.1 0.1 0.2 0.1 55-64 0.8 0.6 0.8 1.3 0.6 0.8 1.1 0.7 0.8 1.5 0.6 0.4 1.0 1.2 0.7 0.9 0.8 1.6 0.7 1.2 0.5 0.2 0.7 65-74 0.8 0.9 1.9 1.3 0.5 2.3 1.9 1.2 1.7 2.1 0.7 1.5 1.9 1.6 1.2 1.4 1.2 1.5 1.7 1.5 1.5 1.9 1.3 75-84 0.8 1.8 0.9 0.9 2.5 1.3 2.6 3.4 2.7 1.8 2.8 1.9 1.5 2.6 3.4 2.3 3.3 2.2 3.1 2.4 2.2 2.2 1.8 85+ 0.0 0.0 0.0 2.0 0.0 1.3 1.2 1.2 0.6 0.6 3.2 2.1 1.5 1.0 1.9 2.3 1.8 1.3 2.9 2.8 1.6 1.9 0.7 Whites Both Sexes 0.6 0.8 0.8 1.0 0.8 0.9 1.1 1.2 1.0 1.0 1.0 1.1 1.2 1.3 1.2 1.3 1.1 1.2 1.2 1.3 1.0 1.2 1.1 Males 1.1 1.5 1.6 2.0 1.5 1.5 2.0 2.2 1.7 1.8 1.8 2.0 2.3 2.3 2.2 2.7 2.2 2.3 2.3 2.4 2.0 2.2 2.1 Females 0.3 0.2 0.3 0.4 0.3 0.4 0.5 0.4 0.4 0.5 0.5 0.4 0.4 0.5 0.5 0.4 0.4 0.5 0.5 0.5 0.4 0.5 0.4 Blacks Both Sexes 0.2 0.3 0.6 0.3 0.3 0.3 0.9 0.3 0.8 0.5 0.7 0.6 0.7 0.7 0.7 0.7 0.7 1.1 0.8 0.4 0.9 0.6 0.7 Males 0.3 0.3 0.9 0.7 0.8 0.9 1.6 0.8 1.8 0.9 1.1 1.2 1.0 1.4 1.6 1.3 1.2 1.8 1.7 0.8 1.4 1.3 1.3 Females 0.1 0.3 0.4 0.0 0.0 0.0 0.5 0.0 0.2 0.2 0.4 0.3 0.4 0.3 0.2 0.2 0.3 0.5 0.3 0.2 0.6 0.2 0.2
SEER C
ancer Statistics Review
1973-1999N
ational Cancer Institute

The EAPC is the Estimated Annual Percent Change over the time interval.§ SEER 12 areas. Rates are per 100,000 and are age-adjusted to the 2000 U. S.
standard population by 5-year age groups.* NCHS public use data file. Rates are per 100,000 and are age-adjusted to the 2000
U. S. standard population by 5-year age groups.’ The EAPC is significantly different from zero (p<.05).- Statistic could not be calculated.
Table I-8SEER INCIDENCE AND U.S. MORTALITY TRENDS BY PRIMARY CANCER SITE AND SEX
All Races, 1992-99
Incidence§ US Mortality*
Total Males Females Total Males FemalesSite EAPC EAPC EAPC EAPC EAPC EAPC All Sites -0.9’ -2.3’ 0.3 -0.9’ -1.5’ -0.6’ Oral Cavity & Pharynx: -2.1’ -2.6’ -1.3 -2.5’ -2.8’ -2.2’ Lip -4.2’ -5.3’ -2.1 -5.5’ -7.1’ -3.2 Tongue -0.5 -1.0 -0.1 -2.0’ -2.3’ -1.6’ Salivary gland 0.2 -0.7 1.1 -2.0’ -2.5’ -1.6 Floor of mouth -4.2’ -5.6’ -1.5 -7.9’ -8.1’ -8.1’ Gum & other -4.1’ -5.0’ -2.6’ -3.1’ -3.9’ -2.4’ oral cavity Nasopharynx -0.8 -1.4 0.2 -2.2’ -2.5’ -1.7’ Tonsil 0.1 1.4 -4.1’ -1.7 -2.0 -1.6 Oropharynx -1.6 -2.8 1.0 0.2 0.4 -0.6 Hypopharynx -2.5’ -2.5 -3.0 -4.7’ -5.6’ -2.5 Other oral cavity -5.1’ -5.8’ -4.1 -2.3’ -2.1’ -3.1’ & pharynx Digestive System: -0.3 -0.6 -0.1 -0.9’ -1.1’ -0.9’ Esophagus 0.5 0.6 -0.4 0.7’ 0.7’ 0.1 Stomach -1.3’ -2.1’ -0.4 -2.8’ -3.2’ -2.5’ Small intestine 1.4 -0.2 3.3’ -0.7 0.3 -1.8’ Colon & Rectum: -0.6 -1.0’ -0.3 -1.7’ -2.1’ -1.6’ Colon -0.8’ -1.3’ -0.5 -1.9’ -2.3’ -1.7’ Rectum -0.1 -0.4 0.2 -0.8’ -1.1’ -0.7’ Anus, anal canal & 1.8 2.1 1.6 0.3 0.0 0.5 anorectum Liver & Intrahep: 4.3’ 3.8’ 4.5’ 2.4’ 2.3’ 1.9’ Liver 4.7’ 4.1’ 5.2’ 2.0’ 2.1’ 0.9 Intrahep bile duct 2.2 1.8 2.2 4.1’ 3.1’ 4.9’ Gallbladder -2.9’ -1.6 -3.1’ -2.1’ -1.5 -2.1’ Other biliary -1.8 -1.8 -2.0 -4.3’ -4.4’ -4.3’ Pancreas -0.6 -0.7 -0.7 -0.1 -0.3 -0.1 Retroperitoneum -1.6 1.2 -3.9’ -3.0’ -2.4 -3.6 Peritoneum, omentum & 10.5’ -1.9 13.6’ 7.7’ -1.5 11.2’ mesentery Other digestive 0.0 -1.0 1.1 8.3 9.1 7.5 system Respiratory System: -1.4’ -2.5’ 0.1 -0.7’ -1.9’ 0.8’ Nose, nasal cavity & -0.8 -1.1 -1.1 -1.7 -1.4 -2.7’ middle ear Larynx -2.6’ -3.5’ -0.1 -2.0’ -2.5’ -1.3’ Lung & bronchus -1.3’ -2.5’ 0.1 -0.7’ -1.8’ 0.8’ Pleura -1.9’ -2.5’ -1.4 -4.3’ -4.1’ -6.1’ Trachea & other -4.2’ -5.1’ -2.6 -4.8’ -6.6’ -2.7 respiratory organs Bones & joints -0.7 -1.4 -0.3 -0.8 -0.8 -0.8 Soft tissue (incl heart) 1.2 0.9 1.6 -0.2 0.1 -0.6 Skin (ex basal & squam): -0.8 -2.4’ 2.5’ -0.3 -0.2 -0.6 Melanomas of skin 2.8’ 2.9’ 2.7’ 0.1 0.5 -0.5 Other non-epithelial -13.4’ -15.9’ 0.7 -1.7 -2.1 -1.1 skin Breast 0.9’ 0.2 1.1’ -2.5’ -0.4 -2.4’
SEER Cancer Statistics Review 1973-1999 National Cancer Institute
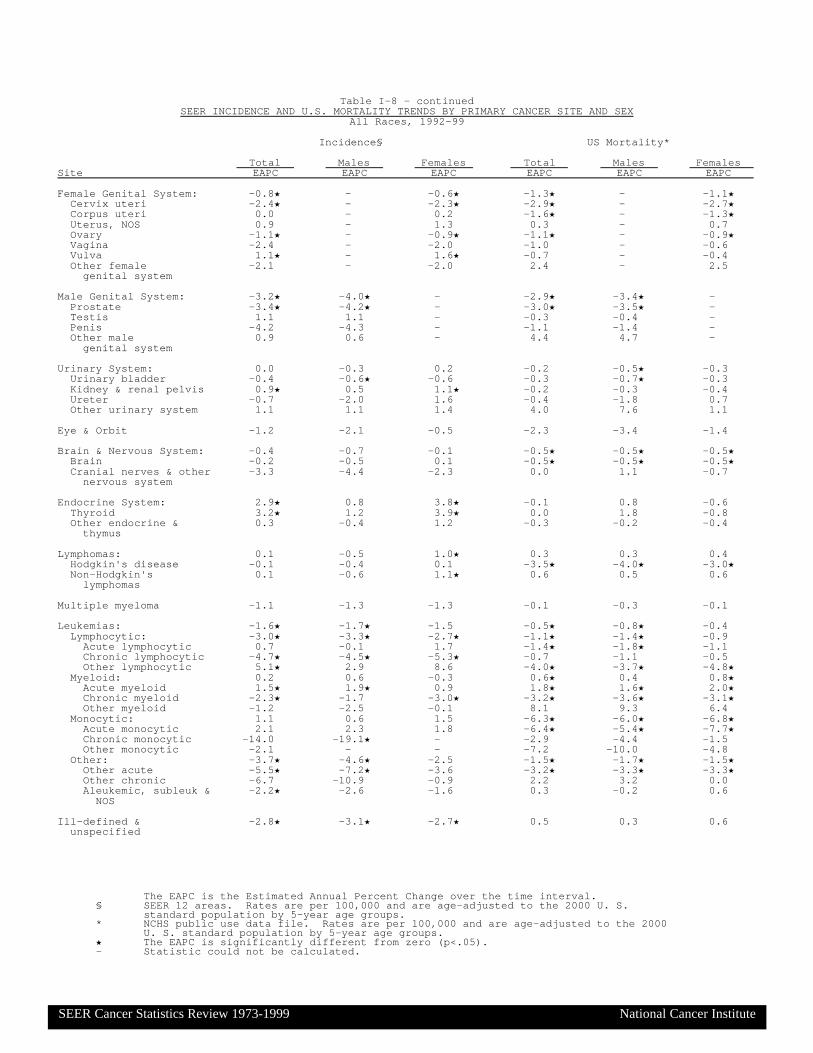
The EAPC is the Estimated Annual Percent Change over the time interval.§ SEER 12 areas. Rates are per 100,000 and are age-adjusted to the 2000 U. S.
standard population by 5-year age groups.* NCHS public use data file. Rates are per 100,000 and are age-adjusted to the 2000
U. S. standard population by 5-year age groups.’ The EAPC is significantly different from zero (p<.05).- Statistic could not be calculated.
Table I-8 - continuedSEER INCIDENCE AND U.S. MORTALITY TRENDS BY PRIMARY CANCER SITE AND SEX
All Races, 1992-99
Incidence§ US Mortality*
Total Males Females Total Males FemalesSite EAPC EAPC EAPC EAPC EAPC EAPC Female Genital System: -0.8’ - -0.6’ -1.3’ - -1.1’ Cervix uteri -2.4’ - -2.3’ -2.9’ - -2.7’ Corpus uteri 0.0 - 0.2 -1.6’ - -1.3’ Uterus, NOS 0.9 - 1.3 0.3 - 0.7 Ovary -1.1’ - -0.9’ -1.1’ - -0.9’ Vagina -2.4 - -2.0 -1.0 - -0.6 Vulva 1.1’ - 1.6’ -0.7 - -0.4 Other female -2.1 - -2.0 2.4 - 2.5 genital system Male Genital System: -3.2’ -4.0’ - -2.9’ -3.4’ - Prostate -3.4’ -4.2’ - -3.0’ -3.5’ - Testis 1.1 1.1 - -0.3 -0.4 - Penis -4.2 -4.3 - -1.1 -1.4 - Other male 0.9 0.6 - 4.4 4.7 - genital system Urinary System: 0.0 -0.3 0.2 -0.2 -0.5’ -0.3 Urinary bladder -0.4 -0.6’ -0.6 -0.3 -0.7’ -0.3 Kidney & renal pelvis 0.9’ 0.5 1.1’ -0.2 -0.3 -0.4 Ureter -0.7 -2.0 1.6 -0.4 -1.8 0.7 Other urinary system 1.1 1.1 1.4 4.0 7.6 1.1 Eye & Orbit -1.2 -2.1 -0.5 -2.3 -3.4 -1.4 Brain & Nervous System: -0.4 -0.7 -0.1 -0.5’ -0.5’ -0.5’ Brain -0.2 -0.5 0.1 -0.5’ -0.5’ -0.5’ Cranial nerves & other -3.3 -4.4 -2.3 0.0 1.1 -0.7 nervous system Endocrine System: 2.9’ 0.8 3.8’ -0.1 0.8 -0.6 Thyroid 3.2’ 1.2 3.9’ 0.0 1.8 -0.8 Other endocrine & 0.3 -0.4 1.2 -0.3 -0.2 -0.4 thymus Lymphomas: 0.1 -0.5 1.0’ 0.3 0.3 0.4 Hodgkin's disease -0.1 -0.4 0.1 -3.5’ -4.0’ -3.0’ Non-Hodgkin's 0.1 -0.6 1.1’ 0.6 0.5 0.6 lymphomas Multiple myeloma -1.1 -1.3 -1.3 -0.1 -0.3 -0.1 Leukemias: -1.6’ -1.7’ -1.5 -0.5’ -0.8’ -0.4 Lymphocytic: -3.0’ -3.3’ -2.7’ -1.1’ -1.4’ -0.9 Acute lymphocytic 0.7 -0.1 1.7 -1.4’ -1.8’ -1.1 Chronic lymphocytic -4.7’ -4.5’ -5.3’ -0.7 -1.1 -0.5 Other lymphocytic 5.1’ 2.9 8.6 -4.0’ -3.7’ -4.8’ Myeloid: 0.2 0.6 -0.3 0.6’ 0.4 0.8’ Acute myeloid 1.5’ 1.9’ 0.9 1.8’ 1.6’ 2.0’ Chronic myeloid -2.3’ -1.7 -3.0’ -3.2’ -3.6’ -3.1’ Other myeloid -1.2 -2.5 -0.1 8.1 9.3 6.4 Monocytic: 1.1 0.6 1.5 -6.3’ -6.0’ -6.8’ Acute monocytic 2.1 2.3 1.8 -6.4’ -5.4’ -7.7’ Chronic monocytic -14.0 -19.1’ - -2.9 -4.4 -1.5 Other monocytic -2.1 - - -7.2 -10.0 -4.8 Other: -3.7’ -4.6’ -2.5 -1.5’ -1.7’ -1.5’ Other acute -5.5’ -7.2’ -3.6 -3.2’ -3.3’ -3.3’ Other chronic -6.7 -10.9 -0.9 2.2 3.2 0.0 Aleukemic, subleuk & -2.2’ -2.6 -1.6 0.3 -0.2 0.6 NOS Ill-defined & -2.8’ -3.1’ -2.7’ 0.5 0.3 0.6 unspecified
SEER Cancer Statistics Review 1973-1999 National Cancer Institute

The EAPC is the Estimated Annual Percent Change over the time interval.§ SEER 12 areas. Rates are per 100,000 and are age-adjusted to the 2000 U. S.
standard population by 5-year age groups.* NCHS public use data file. Rates are per 100,000 and are age-adjusted to the 2000
U. S. standard population by 5-year age groups.’ The EAPC is significantly different from zero (p<.05).- Statistic could not be calculated.
Table I-9SEER INCIDENCE AND U.S. MORTALITY TRENDS BY PRIMARY CANCER SITE AND SEX
Whites, 1992-99
Incidence§ US Mortality*
Total Males Females Total Males FemalesSite EAPC EAPC EAPC EAPC EAPC EAPC All Sites -0.9’ -2.4’ 0.4 -0.9’ -1.4’ -0.6’ Oral Cavity & Pharynx: -2.2’ -2.7’ -1.7’ -2.2’ -2.5’ -2.2’ Lip -4.4’ -5.5’ -2.4 -5.5’ -7.1’ -3.3 Tongue -0.7 -0.6’ -1.4 -1.4’ -1.7’ -1.3 Salivary gland 0.5 -0.4 1.4 -2.2’ -2.7’ -2.0 Floor of mouth -3.8 -4.9’ -1.7 -7.7’ -7.9’ -8.1’ Gum & other -4.5’ -5.6’ -2.8’ -2.8’ -3.6’ -2.2’ oral cavity Nasopharynx -1.9 -2.1 -2.1 -2.7’ -2.4 -3.2’ Tonsil 0.0 1.3 -4.4’ -1.0 -1.2 -1.8 Oropharynx -1.8 -3.5 1.6 0.7 0.7 0.0 Hypopharynx -1.9 -2.2 -2.2 -4.4’ -5.3’ -2.6 Other oral cavity -4.6’ -5.7’ -2.2 -2.1’ -1.9 -2.9’ & pharynx Digestive System: -0.3 -0.6 -0.1 -0.9’ -1.0’ -1.0’ Esophagus 1.6’ 1.9’ 0.1 1.8’ 1.8’ 1.0’ Stomach -1.6’ -2.3’ -1.0 -3.0’ -3.4’ -2.8’ Small intestine 1.1 -0.1 2.3’ -0.8 0.5 -2.2’ Colon & Rectum: -0.7 -1.1’ -0.4 -1.9’ -2.2’ -1.7’ Colon -0.9’ -1.4’ -0.6 -2.1’ -2.4’ -1.9’ Rectum -0.1 -0.6 0.2 -0.7’ -1.1’ -0.5 Anus, anal canal & 2.3 2.9 1.9 0.5 0.4 0.6 anorectum Liver & Intrahep: 4.7’ 3.9’ 5.2’ 2.4’ 2.3’ 1.8’ Liver 5.2’ 4.3’ 6.1’ 2.0’ 2.2’ 0.7 Intrahep bile duct 2.5 1.7 2.9 4.1’ 3.1’ 4.8’ Gallbladder -3.3’ -1.5 -3.4’ -2.3’ -1.7 -2.3’ Other biliary -1.4 -1.5 -1.4 -4.3’ -4.5’ -4.3’ Pancreas -0.6 -0.5 -0.8 0.0 -0.1 0.0 Retroperitoneum -0.5 1.9 -2.5 -3.1 -3.0 -3.1 Peritoneum, omentum & 10.3’ -3.8 13.8’ 7.8’ -1.8 11.5’ mesentery Other digestive -0.2 -1.3 0.7 9.0 9.1 8.8 system Respiratory System: -1.3’ -2.6’ 0.1 -0.6’ -1.8’ 0.8’ Nose, nasal cavity & -0.9 -1.5 -0.6 -1.2 -0.6 -2.7’ middle ear Larynx -2.7’ -3.6’ -0.3 -1.8’ -2.5’ -0.9 Lung & bronchus -1.2’ -2.5’ 0.2 -0.6’ -1.7’ 0.8’ Pleura -2.1 -2.9’ -1.3 -4.2’ -3.9’ -6.6’ Trachea & other -4.7 -5.9’ -3.5 -4.5’ -6.8’ -1.5 respiratory organs Bones & joints -0.2 -1.3 1.0 -0.5 -0.6 -0.3 Soft tissue (incl heart) 1.1’ 0.6 1.8 0.0 -0.1 -0.2 Skin (ex basal & squam): -0.5 -2.2’ 2.9’ -0.1 0.0 -0.3 Melanomas of skin 3.0’ 2.9’ 3.1’ 0.3 0.6 -0.3 Other non-epithelial -14.6’ -17.1’ 1.0 -1.1 -1.7 -0.3 skin Breast 0.8’ 1.0 1.0’ -2.7’ -0.7 -2.7’
SEER Cancer Statistics Review 1973-1999 National Cancer Institute

The EAPC is the Estimated Annual Percent Change over the time interval.§ SEER 12 areas. Rates are per 100,000 and are age-adjusted to the 2000 U. S.
standard population by 5-year age groups.* NCHS public use data file. Rates are per 100,000 and are age-adjusted to the 2000
U. S. standard population by 5-year age groups.’ The EAPC is significantly different from zero (p<.05).- Statistic could not be calculated.
Table I-9 - continuedSEER INCIDENCE AND U.S. MORTALITY TRENDS BY PRIMARY CANCER SITE AND SEX
Whites, 1992-99
Incidence§ US Mortality*
Total Males Females Total Males FemalesSite EAPC EAPC EAPC EAPC EAPC EAPC Female Genital System: -0.8’ - -0.5’ -1.1’ - -0.9’ Cervix uteri -2.3’ - -2.2’ -2.3’ - -2.1’ Corpus uteri -0.2 - 0.1 -1.6’ - -1.2’ Uterus, NOS 1.9 - 2.7 0.4 - 0.7 Ovary -1.1’ - -0.9’ -1.0’ - -0.8’ Vagina -2.9 - -2.3 -0.9 - -0.4 Vulva 1.8’ - 2.4’ -0.5 - -0.1 Other female -2.2 - -2.1 2.3 - 2.4 genital system Male Genital System: -3.6’ -4.5’ - -3.0’ -3.6’ - Prostate -3.8’ -4.7’ - -3.1’ -3.6’ - Testis 1.1 1.1 - -0.4 -0.6 - Penis -4.8 -5.1 - -0.7 -0.8 - Other male -0.3 -0.6 - 4.5 4.3 - genital system Urinary System: 0.0 -0.3 0.1 -0.2 -0.5’ -0.3 Urinary bladder -0.4 -0.6’ -0.7’ -0.1 -0.6’ -0.2 Kidney & renal pelvis 0.8’ 0.5 1.0’ -0.3 -0.4 -0.4 Ureter -0.6 -1.6 0.9 -0.3 -1.5 0.5 Other urinary system 1.8 0.9 3.8 5.3 9.6’ 1.2 Eye & Orbit -1.5 -2.8 -0.4 -2.4 -3.4 -1.4 Brain & Nervous System: -0.3 -0.6 0.0 -0.4 -0.5’ -0.4 Brain 0.0 -0.4 0.3 -0.4 -0.5’ -0.4 Cranial nerves & other -3.9 -4.6 -3.6 -0.3 0.8 -1.0 nervous system Endocrine System: 3.3’ 1.3 4.1’ -0.1 0.7 -0.6 Thyroid 3.5’ 1.6 4.2’ -0.1 1.7 -0.9 Other endocrine & 0.9 0.4 1.6 -0.2 -0.3 -0.3 thymus Lymphomas: -0.1 -0.7 0.9’ 0.3 0.2 0.4 Hodgkin's disease 0.2 -0.2 0.8 -3.4’ -3.8’ -3.1’ Non-Hodgkin's -0.1 -0.8 0.9’ 0.6 0.5 0.6 lymphomas Multiple myeloma -1.2 -1.3 -1.6 -0.2 -0.2 -0.3 Leukemias: -1.7’ -2.0’ -1.4 -0.5’ -0.7’ -0.3 Lymphocytic: -3.2’ -3.8’ -2.6 -1.0’ -1.2’ -0.9 Acute lymphocytic 0.8 -0.7 2.8 -1.3’ -1.7’ -1.0 Chronic lymphocytic -5.1’ -5.0’ -5.5’ -0.6 -0.9 -0.6 Other lymphocytic 4.3 2.4 6.6 -4.2’ -4.0’ -4.6’ Myeloid: 0.2 0.5 -0.3 0.7’ 0.3 0.9’ Acute myeloid 1.6 1.8’ 1.2 1.8’ 1.6’ 2.0’ Chronic myeloid -2.5’ -1.8 -3.3’ -3.2’ -3.8’ -2.8’ Other myeloid -1.3 -1.1 -2.0 8.3 9.5 6.5 Monocytic: 1.5 0.1 3.2 -6.7’ -6.4’ -7.4’ Acute monocytic 2.4 1.6 3.5 -6.7’ -5.6’ -8.3’ Chronic monocytic -13.8 -17.1’ - -2.9 -5.2 -0.5 Other monocytic - - - -8.7 -11.5’ -6.3 Other: -3.2’ -4.4’ -1.6 -1.4’ -1.6’ -1.5’ Other acute -5.2’ -7.2’ -2.8 -3.2’ -3.2’ -3.5’ Other chronic -5.9 -11.7 2.1 2.2 2.9 0.5 Aleukemic, subleuk & -1.6 -2.3’ -0.8 0.5 -0.1 0.8 NOS Ill-defined & -2.9’ -3.2’ -2.6’ 0.7 0.5 0.7 unspecified
SEER Cancer Statistics Review 1973-1999 National Cancer Institute

The EAPC is the Estimated Annual Percent Change over the time interval.§ SEER 12 areas. Rates are per 100,000 and are age-adjusted to the 2000 U. S.
standard population by 5-year age groups.* NCHS public use data file. Rates are per 100,000 and are age-adjusted to the 2000
U. S. standard population by 5-year age groups.’ The EAPC is significantly different from zero (p<.05).- Statistic could not be calculated.
Table I-10SEER INCIDENCE AND U.S. MORTALITY TRENDS BY PRIMARY CANCER SITE AND SEX
Blacks, 1992-99
Incidence§ US Mortality*
Total Males Females Total Males FemalesSite EAPC EAPC EAPC EAPC EAPC EAPC All Sites -1.3’ -2.7’ 0.1 -1.2’ -1.9’ -0.4’ Oral Cavity & Pharynx: -3.0’ -3.4’ -1.5 -3.7’ -4.2’ -2.0 Lip -3.5 - - - - - Tongue -3.2 -5.5 2.4 -5.3’ -5.7’ -4.1’ Salivary gland -0.4 -1.3 1.2 0.8 -1.5 5.0 Floor of mouth -5.4 -7.5 0.9 -8.1’ -7.7’ -9.0’ Gum & other -3.9 -3.0 -5.0 -5.2’ -5.6’ -3.4 oral cavity Nasopharynx -0.6 -2.1 4.1 0.2 -2.4 5.7 Tonsil 1.1 1.5 1.2 -4.0’ -4.9’ -0.4 Oropharynx -1.5 -1.4 -1.3 -1.6 -1.3 -2.1 Hypopharynx -5.7 -4.6 -8.1 -6.2’ -7.3’ -0.8 Other oral cavity -6.0 -2.3 - -2.8’ -2.6’ -2.9 & pharynx Digestive System: -0.8’ -1.8’ 0.0 -1.0’ -1.5’ -0.6’ Esophagus -5.8’ -7.1’ -3.5’ -4.1’ -4.4’ -3.4’ Stomach -0.7 -2.9 2.1 -2.1’ -2.3’ -1.9’ Small intestine 3.7 0.5 7.6’ 0.2 -0.3 0.6 Colon & Rectum: -0.5 -1.1 0.0 -0.5’ -1.0’ -0.3 Colon -0.6 -1.2 -0.3 -0.4 -0.9’ -0.1 Rectum 0.1 -0.7 0.9 -1.2 -1.0 -1.6 Anus, anal canal & -0.4 -1.0 0.1 -0.6 -2.8 -0.3 anorectum Liver & Intrahep: 3.1 2.6 3.6 1.9’ 1.6 1.7 Liver 3.2’ 3.0’ 3.1 1.4 1.4 0.7 Intrahep bile duct 2.1 -0.1 4.7 5.4’ 3.6 7.3’ Gallbladder 1.5 1.4 1.4 0.0 1.0 -0.2 Other biliary -3.6 -5.5 -2.9 -2.4 0.5 -4.1’ Pancreas -2.3’ -2.1’ -2.5 -0.8 -1.4’ -0.5 Retroperitoneum -3.4 7.3 -10.1 -3.7 3.0 -8.0 Peritoneum, omentum & 11.2’ - 12.2’ 7.4’ 1.9 8.9’ mesentery Other digestive 0.8 0.1 4.2 3.8 6.9 1.0 system Respiratory System: -1.5’ -2.9’ 0.6 -1.3’ -2.4’ 1.0’ Nose, nasal cavity & -1.2 0.7 -3.2 -5.4 -7.6 -3.7 middle ear Larynx -3.2 -4.2’ 0.0 -2.7’ -2.6’ -3.3’ Lung & bronchus -1.4’ -2.8’ 0.7 -1.2’ -2.4’ 1.1’ Pleura -1.7 -2.9 2.0 -5.1 -7.1’ 0.5 Trachea & other 12.3 17.8’ 13.7 -7.6’ -4.8 -11.5’ respiratory organs Bones & joints -3.0 -4.2 -4.5 -3.5 -3.4 -4.6 Soft tissue (incl heart) 0.3 1.3 -0.1 -1.2 2.2 -3.3’ Skin (ex basal & squam): -6.3’ -8.0’ 2.1 -5.0’ -4.7’ -5.1 Melanomas of skin 4.9 9.2 2.7 -1.1 -0.5 -1.0 Other non-epithelial -9.1’ -11.1’ 1.8 -7.4’ -6.2’ -10.4’ skin Breast 0.2 3.6 0.3 -0.7 2.0 -0.7
SEER Cancer Statistics Review 1973-1999 National Cancer Institute

The EAPC is the Estimated Annual Percent Change over the time interval.§ SEER 12 areas. Rates are per 100,000 and are age-adjusted to the 2000 U. S.
standard population by 5-year age groups.* NCHS public use data file. Rates are per 100,000 and are age-adjusted to the 2000
U. S. standard population by 5-year age groups.’ The EAPC is significantly different from zero (p<.05).- Statistic could not be calculated.
Table I-10 - continuedSEER INCIDENCE AND U.S. MORTALITY TRENDS BY PRIMARY CANCER SITE AND SEX
Blacks, 1992-99
Incidence§ US Mortality*
Total Males Females Total Males FemalesSite EAPC EAPC EAPC EAPC EAPC EAPC Female Genital System: -0.9 - -0.7 -2.1’ - -2.0’ Cervix uteri -2.0’ - -1.9’ -4.9’ - -4.9’ Corpus uteri 0.8 - 1.1 -1.3 - -1.3 Uterus, NOS -4.9 - -5.0 0.2 - 0.4 Ovary -1.1 - -1.0 -1.1 - -0.9 Vagina -1.9 - -1.9 -2.8 - -2.7 Vulva -2.6 - -2.6 -3.8 - -3.8 Other female -4.2 - -3.3 3.2 - 3.2 genital system Male Genital System: -2.6’ -3.4’ - -2.1’ -2.3’ - Prostate -2.7’ -3.5’ - -2.1’ -2.3’ - Testis 8.0 8.6’ - 2.4 2.4 - Penis -3.1 -1.8 - -5.3 -6.4 - Other male - - - 3.5 6.1 - genital system Urinary System: 0.7 0.0 1.9 -0.4 -1.1’ 0.0 Urinary bladder 0.3 -0.1 0.8 -1.1’ -2.3’ -0.1 Kidney & renal pelvis 1.5 0.2 3.2 0.4 0.4 0.2 Ureter -4.4 -2.8 - -4.1’ -13.7’ 1.6 Other urinary system -3.3 -2.1 -3.9 -3.8 -7.7 -1.7 Eye & Orbit 2.1 3.0 2.3 3.6 4.1 5.4 Brain & Nervous System: 0.1 0.8 -0.2 -0.1 -0.5 0.2 Brain 0.4 1.5 -0.5 -0.3 -0.6 0.0 Cranial nerves & other -1.5 -4.8 2.2 4.0 2.6 3.4 nervous system Endocrine System: 1.2 -3.2 2.7’ 0.2 1.0 -0.1 Thyroid 1.9 -4.1 3.7’ 1.4 3.9 0.7 Other endocrine & -2.0 -0.3 -3.3 -1.2 -1.2 -1.2 thymus Lymphomas: 0.5 -0.8 2.4 0.6 0.6 0.7 Hodgkin's disease -2.2 -1.3 -3.3 -3.7’ -4.2’ -3.7 Non-Hodgkin's 0.9 -0.8 3.6 1.0 1.0 1.1 lymphomas Multiple myeloma -1.7 -1.5 -1.8 0.0 -0.6 0.5 Leukemias: -2.0’ -1.7 -2.1 -0.7 -1.0 -0.4 Lymphocytic: -2.7 -2.1 -3.1 -1.4 -2.6’ 0.1 Acute lymphocytic -0.9 1.7 -4.3 -1.8 -1.4 -2.2 Chronic lymphocytic -3.7 -3.2 -3.5 -1.2 -2.9’ 1.4 Other lymphocytic 8.2 - - -3.6 0.1 -7.5 Myeloid: 0.0 1.1 -0.9 0.2 0.8 -0.5 Acute myeloid 1.2 4.2’ -1.2 2.1’ 2.3’ 1.8 Chronic myeloid -2.3 -3.0 -0.8 -4.0 -2.5 -6.0’ Other myeloid 2.7 - 11.1 7.3’ 9.4 3.9 Monocytic: 3.6 2.0 - -2.5 -5.5 -0.2 Acute monocytic 3.7 5.2 - -6.1 - -1.4 Chronic monocytic - - - - - - Other monocytic - - - - - - Other: -8.8’ -12.8’ -5.7 -1.3 -1.7 -0.7 Other acute -11.8’ -12.5 -15.1 -2.6 -4.3’ -0.8 Other chronic - - - 0.9 5.3 -6.4 Aleukemic, subleuk & -6.5’ -13.7’ 1.4 -0.4 -0.2 -0.4 NOS Ill-defined & -3.3’ -3.7’ -3.0’ -0.4 -0.9 0.1 unspecified
SEER Cancer Statistics Review 1973-1999 National Cancer Institute
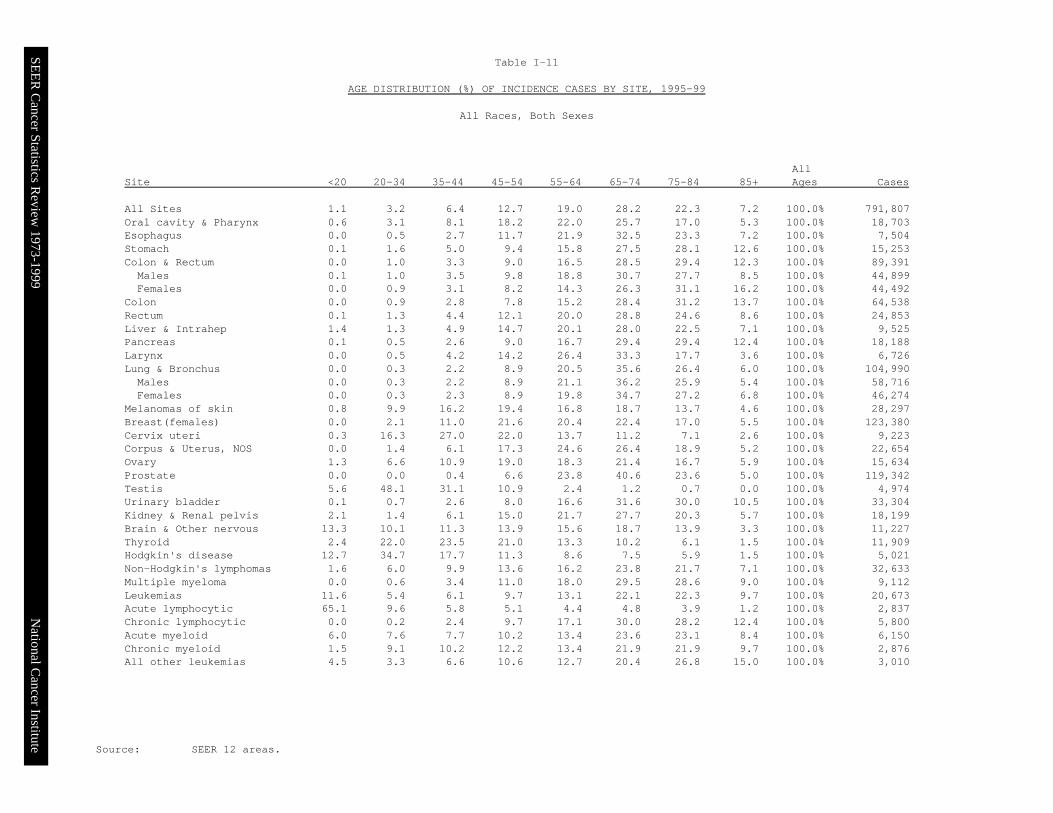
Source: SEER 12 areas.
Table I-11
AGE DISTRIBUTION (%) OF INCIDENCE CASES BY SITE, 1995-99
All Races, Both Sexes
AllSite <20 20-34 35-44 45-54 55-64 65-74 75-84 85+ Ages Cases All Sites 1.1 3.2 6.4 12.7 19.0 28.2 22.3 7.2 100.0% 791,807Oral cavity & Pharynx 0.6 3.1 8.1 18.2 22.0 25.7 17.0 5.3 100.0% 18,703Esophagus 0.0 0.5 2.7 11.7 21.9 32.5 23.3 7.2 100.0% 7,504Stomach 0.1 1.6 5.0 9.4 15.8 27.5 28.1 12.6 100.0% 15,253Colon & Rectum 0.0 1.0 3.3 9.0 16.5 28.5 29.4 12.3 100.0% 89,391 Males 0.1 1.0 3.5 9.8 18.8 30.7 27.7 8.5 100.0% 44,899 Females 0.0 0.9 3.1 8.2 14.3 26.3 31.1 16.2 100.0% 44,492Colon 0.0 0.9 2.8 7.8 15.2 28.4 31.2 13.7 100.0% 64,538Rectum 0.1 1.3 4.4 12.1 20.0 28.8 24.6 8.6 100.0% 24,853Liver & Intrahep 1.4 1.3 4.9 14.7 20.1 28.0 22.5 7.1 100.0% 9,525Pancreas 0.1 0.5 2.6 9.0 16.7 29.4 29.4 12.4 100.0% 18,188Larynx 0.0 0.5 4.2 14.2 26.4 33.3 17.7 3.6 100.0% 6,726Lung & Bronchus 0.0 0.3 2.2 8.9 20.5 35.6 26.4 6.0 100.0% 104,990 Males 0.0 0.3 2.2 8.9 21.1 36.2 25.9 5.4 100.0% 58,716 Females 0.0 0.3 2.3 8.9 19.8 34.7 27.2 6.8 100.0% 46,274Melanomas of skin 0.8 9.9 16.2 19.4 16.8 18.7 13.7 4.6 100.0% 28,297Breast(females) 0.0 2.1 11.0 21.6 20.4 22.4 17.0 5.5 100.0% 123,380Cervix uteri 0.3 16.3 27.0 22.0 13.7 11.2 7.1 2.6 100.0% 9,223Corpus & Uterus, NOS 0.0 1.4 6.1 17.3 24.6 26.4 18.9 5.2 100.0% 22,654Ovary 1.3 6.6 10.9 19.0 18.3 21.4 16.7 5.9 100.0% 15,634Prostate 0.0 0.0 0.4 6.6 23.8 40.6 23.6 5.0 100.0% 119,342Testis 5.6 48.1 31.1 10.9 2.4 1.2 0.7 0.0 100.0% 4,974Urinary bladder 0.1 0.7 2.6 8.0 16.6 31.6 30.0 10.5 100.0% 33,304Kidney & Renal pelvis 2.1 1.4 6.1 15.0 21.7 27.7 20.3 5.7 100.0% 18,199Brain & Other nervous 13.3 10.1 11.3 13.9 15.6 18.7 13.9 3.3 100.0% 11,227Thyroid 2.4 22.0 23.5 21.0 13.3 10.2 6.1 1.5 100.0% 11,909Hodgkin's disease 12.7 34.7 17.7 11.3 8.6 7.5 5.9 1.5 100.0% 5,021Non-Hodgkin's lymphomas 1.6 6.0 9.9 13.6 16.2 23.8 21.7 7.1 100.0% 32,633Multiple myeloma 0.0 0.6 3.4 11.0 18.0 29.5 28.6 9.0 100.0% 9,112Leukemias 11.6 5.4 6.1 9.7 13.1 22.1 22.3 9.7 100.0% 20,673Acute lymphocytic 65.1 9.6 5.8 5.1 4.4 4.8 3.9 1.2 100.0% 2,837Chronic lymphocytic 0.0 0.2 2.4 9.7 17.1 30.0 28.2 12.4 100.0% 5,800Acute myeloid 6.0 7.6 7.7 10.2 13.4 23.6 23.1 8.4 100.0% 6,150Chronic myeloid 1.5 9.1 10.2 12.2 13.4 21.9 21.9 9.7 100.0% 2,876All other leukemias 4.5 3.3 6.6 10.6 12.7 20.4 26.8 15.0 100.0% 3,010
SEER C
ancer Statistics Review
1973-1999N
ational Cancer Institute

§ SEER 12 areas.- Statistic could not be calculated.
Table I-12MEDIAN AGE OF CANCER PATIENTS AT DIAGNOSIS§, 1995-99
By Primary Cancer Site, Race and Sex
All Races Whites BlacksSite Total Males Females Total Males Females Total Males Females All Sites 67.0 68.0 67.0 68.0 68.0 67.0 64.0 65.0 63.0 Oral Cavity & Pharynx: 64.0 62.0 67.0 65.0 64.0 68.0 57.0 57.0 58.0 Lip 69.0 68.0 72.0 69.0 68.0 72.0 66.0 48.0 69.0 Tongue 62.0 61.0 65.0 63.0 62.0 67.0 57.0 57.0 58.0 Salivary gland 64.0 66.0 60.0 66.0 68.0 63.0 56.0 57.0 51.0 Floor of mouth 64.0 61.0 67.0 64.0 62.0 68.0 55.0 54.0 58.0 Gum & other 67.0 64.0 71.0 68.0 65.0 72.0 57.0 57.0 57.0 oral cavity Nasopharynx 53.0 52.0 55.0 60.0 58.0 64.0 50.0 48.0 57.0 Tonsil 59.0 58.0 64.0 59.0 58.0 65.0 56.0 56.0 56.5 Oropharynx 64.0 62.0 68.0 65.0 64.0 69.0 58.0 56.5 63.5 Hypopharynx 66.0 65.0 67.0 67.0 66.0 69.0 61.0 61.0 60.0 Other oral cavity 66.0 65.0 69.0 66.5 65.5 70.0 64.0 63.0 68.0 & pharynx Digestive System: 71.0 70.0 73.0 72.0 70.0 74.0 67.0 65.0 69.0 Esophagus 69.0 67.0 73.0 70.0 68.0 74.0 63.0 63.0 65.0 Stomach 72.0 70.0 74.0 72.0 71.0 75.0 69.0 68.0 73.0 Small intestine 68.0 67.0 69.0 69.0 67.0 70.0 63.0 63.0 63.5 Colon & Rectum: 72.0 70.0 74.0 73.0 71.0 75.0 68.0 67.0 69.0 Colon 73.0 71.0 75.0 74.0 72.0 75.0 69.0 68.0 70.0 Rectum 69.0 68.0 70.0 70.0 69.0 71.0 65.0 63.0 66.0 Anus, anal canal & 63.0 59.0 67.0 65.0 60.0 68.0 52.5 49.0 58.0 anorectum Liver & Intrahep: 67.0 65.0 71.0 69.0 67.0 73.0 62.0 59.0 68.0 Liver 67.0 65.0 71.0 68.0 67.0 72.0 61.5 59.0 68.0 Intrahep bile duct 73.0 71.0 75.0 73.0 71.0 76.0 70.0 70.0 70.0 Gallbladder 73.0 72.0 73.0 73.0 73.0 73.0 69.0 68.5 70.0 Other biliary 73.0 72.0 74.0 73.0 72.0 74.0 69.0 67.0 72.0 Pancreas 72.0 70.0 74.0 73.0 70.0 75.0 69.0 66.0 72.0 Retroperitoneum 60.0 62.0 58.0 61.0 63.0 60.0 47.0 47.0 47.0 Peritoneum, omentum & 67.0 64.0 68.0 67.0 64.0 68.0 67.0 67.0 67.5 mesentery Other digestive 74.0 72.0 76.0 75.0 73.0 77.0 69.0 66.0 69.0 system Respiratory System: 70.0 69.0 70.0 70.0 70.0 71.0 66.0 65.0 66.0 Nose, nasal cavity & 67.0 64.0 69.0 67.0 65.0 70.0 62.5 62.0 64.0 middle ear Larynx 66.0 66.0 66.0 66.0 66.0 66.0 62.0 62.0 61.0 Lung & bronchus 70.0 70.0 70.0 70.0 70.0 71.0 66.0 66.0 66.0 Pleura 72.0 72.0 72.0 73.0 73.0 72.0 67.0 68.0 64.5 Trachea & other 47.0 42.0 54.0 47.0 41.0 55.0 51.0 47.5 61.0 respiratory organs Bones & joints 38.0 34.0 42.0 39.0 35.0 44.0 32.0 28.0 35.0 Soft tissue (incl heart) 56.0 56.0 56.0 58.0 58.0 57.0 47.0 44.0 50.0 Skin (ex basal & squam): 55.0 57.0 53.0 56.0 58.0 54.0 41.0 40.0 46.0 Melanomas of skin 57.0 60.0 52.0 57.0 60.0 52.0 60.0 62.5 56.0 Other non-epithelial 47.0 44.0 65.0 50.0 45.0 68.0 38.0 38.0 42.0 skin Breast 62.0 68.0 62.0 63.0 68.0 63.0 57.0 62.0 57.0
SEER Cancer Statistics Review 1973-1999 National Cancer Institute
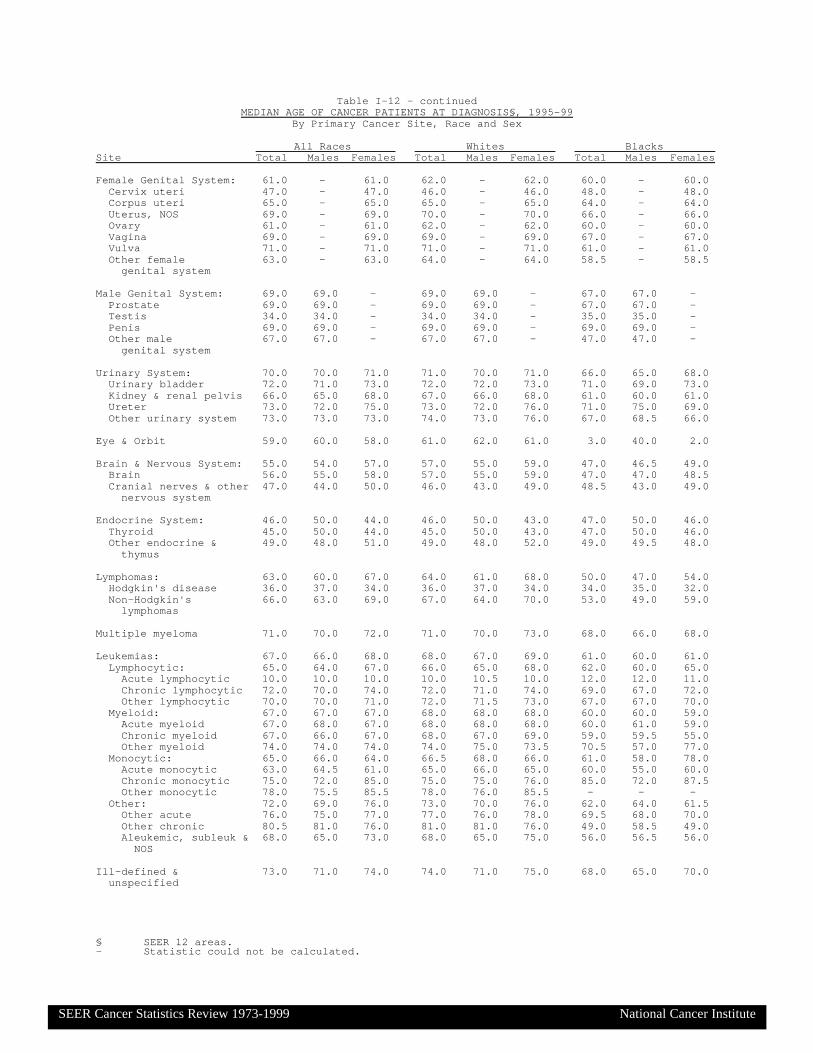
§ SEER 12 areas.- Statistic could not be calculated.
Table I-12 - continuedMEDIAN AGE OF CANCER PATIENTS AT DIAGNOSIS§, 1995-99
By Primary Cancer Site, Race and Sex
All Races Whites BlacksSite Total Males Females Total Males Females Total Males Females Female Genital System: 61.0 - 61.0 62.0 - 62.0 60.0 - 60.0 Cervix uteri 47.0 - 47.0 46.0 - 46.0 48.0 - 48.0 Corpus uteri 65.0 - 65.0 65.0 - 65.0 64.0 - 64.0 Uterus, NOS 69.0 - 69.0 70.0 - 70.0 66.0 - 66.0 Ovary 61.0 - 61.0 62.0 - 62.0 60.0 - 60.0 Vagina 69.0 - 69.0 69.0 - 69.0 67.0 - 67.0 Vulva 71.0 - 71.0 71.0 - 71.0 61.0 - 61.0 Other female 63.0 - 63.0 64.0 - 64.0 58.5 - 58.5 genital system Male Genital System: 69.0 69.0 - 69.0 69.0 - 67.0 67.0 - Prostate 69.0 69.0 - 69.0 69.0 - 67.0 67.0 - Testis 34.0 34.0 - 34.0 34.0 - 35.0 35.0 - Penis 69.0 69.0 - 69.0 69.0 - 69.0 69.0 - Other male 67.0 67.0 - 67.0 67.0 - 47.0 47.0 - genital system Urinary System: 70.0 70.0 71.0 71.0 70.0 71.0 66.0 65.0 68.0 Urinary bladder 72.0 71.0 73.0 72.0 72.0 73.0 71.0 69.0 73.0 Kidney & renal pelvis 66.0 65.0 68.0 67.0 66.0 68.0 61.0 60.0 61.0 Ureter 73.0 72.0 75.0 73.0 72.0 76.0 71.0 75.0 69.0 Other urinary system 73.0 73.0 73.0 74.0 73.0 76.0 67.0 68.5 66.0 Eye & Orbit 59.0 60.0 58.0 61.0 62.0 61.0 3.0 40.0 2.0 Brain & Nervous System: 55.0 54.0 57.0 57.0 55.0 59.0 47.0 46.5 49.0 Brain 56.0 55.0 58.0 57.0 55.0 59.0 47.0 47.0 48.5 Cranial nerves & other 47.0 44.0 50.0 46.0 43.0 49.0 48.5 43.0 49.0 nervous system Endocrine System: 46.0 50.0 44.0 46.0 50.0 43.0 47.0 50.0 46.0 Thyroid 45.0 50.0 44.0 45.0 50.0 43.0 47.0 50.0 46.0 Other endocrine & 49.0 48.0 51.0 49.0 48.0 52.0 49.0 49.5 48.0 thymus Lymphomas: 63.0 60.0 67.0 64.0 61.0 68.0 50.0 47.0 54.0 Hodgkin's disease 36.0 37.0 34.0 36.0 37.0 34.0 34.0 35.0 32.0 Non-Hodgkin's 66.0 63.0 69.0 67.0 64.0 70.0 53.0 49.0 59.0 lymphomas Multiple myeloma 71.0 70.0 72.0 71.0 70.0 73.0 68.0 66.0 68.0 Leukemias: 67.0 66.0 68.0 68.0 67.0 69.0 61.0 60.0 61.0 Lymphocytic: 65.0 64.0 67.0 66.0 65.0 68.0 62.0 60.0 65.0 Acute lymphocytic 10.0 10.0 10.0 10.0 10.5 10.0 12.0 12.0 11.0 Chronic lymphocytic 72.0 70.0 74.0 72.0 71.0 74.0 69.0 67.0 72.0 Other lymphocytic 70.0 70.0 71.0 72.0 71.5 73.0 67.0 67.0 70.0 Myeloid: 67.0 67.0 67.0 68.0 68.0 68.0 60.0 60.0 59.0 Acute myeloid 67.0 68.0 67.0 68.0 68.0 68.0 60.0 61.0 59.0 Chronic myeloid 67.0 66.0 67.0 68.0 67.0 69.0 59.0 59.5 55.0 Other myeloid 74.0 74.0 74.0 74.0 75.0 73.5 70.5 57.0 77.0 Monocytic: 65.0 66.0 64.0 66.5 68.0 66.0 61.0 58.0 78.0 Acute monocytic 63.0 64.5 61.0 65.0 66.0 65.0 60.0 55.0 60.0 Chronic monocytic 75.0 72.0 85.0 75.0 75.0 76.0 85.0 72.0 87.5 Other monocytic 78.0 75.5 85.5 78.0 76.0 85.5 - - - Other: 72.0 69.0 76.0 73.0 70.0 76.0 62.0 64.0 61.5 Other acute 76.0 75.0 77.0 77.0 76.0 78.0 69.5 68.0 70.0 Other chronic 80.5 81.0 76.0 81.0 81.0 76.0 49.0 58.5 49.0 Aleukemic, subleuk & 68.0 65.0 73.0 68.0 65.0 75.0 56.0 56.5 56.0 NOS Ill-defined & 73.0 71.0 74.0 74.0 71.0 75.0 68.0 65.0 70.0 unspecified
SEER Cancer Statistics Review 1973-1999 National Cancer Institute

Source: NCHS public use data file.
Table I-13
AGE DISTRIBUTION (%) OF DEATHS BY SITE, 1995-99
All Races, Both Sexes
AllSite <20 20-34 35-44 45-54 55-64 65-74 75-84 85+ Ages Cases All Sites 0.4 1.0 3.1 8.4 16.1 29.1 28.9 12.9 100.0% 2,709,057Oral cavity & Pharynx 0.2 0.9 4.0 13.1 21.7 28.0 21.9 10.3 100.0% 39,257Esophagus 0.0 0.3 2.3 10.4 21.3 32.4 24.8 8.4 100.0% 57,157Stomach 0.0 1.1 3.7 8.1 14.3 26.2 30.3 16.2 100.0% 65,709Colon & Rectum 0.0 0.6 2.2 6.6 13.7 26.5 31.4 19.0 100.0% 285,287 Males 0.0 0.7 2.3 7.4 16.1 30.0 30.5 12.9 100.0% 140,809 Females 0.0 0.5 2.1 5.7 11.3 23.1 32.3 25.0 100.0% 144,478Colon 0.0 0.5 2.0 6.2 13.3 26.4 32.0 19.5 100.0% 244,680Rectum 0.0 0.9 3.1 8.5 16.3 27.5 27.9 15.7 100.0% 40,607Liver & Intrahep 0.5 0.9 3.5 10.6 16.9 29.5 27.6 10.6 100.0% 59,475Pancreas 0.0 0.2 2.0 7.4 15.7 29.5 31.1 14.1 100.0% 139,112Larynx 0.0 0.1 2.0 10.9 24.1 33.0 23.3 6.5 100.0% 19,280Lung & Bronchus 0.0 0.2 1.8 7.6 19.4 35.7 27.9 7.4 100.0% 762,733 Males 0.0 0.1 1.7 7.7 20.1 36.6 27.3 6.5 100.0% 455,425 Females 0.0 0.2 1.9 7.5 18.5 34.3 28.9 8.8 100.0% 307,308Melanomas of skin 0.2 3.7 9.5 14.9 16.9 23.5 21.8 9.4 100.0% 36,068Breast(females) 0.0 1.2 7.1 15.1 17.6 23.2 22.5 13.1 100.0% 211,756Cervix uteri 0.0 6.5 17.4 20.9 16.9 16.9 13.8 7.5 100.0% 22,086Corpus & Uterus, NOS 0.0 0.4 2.0 6.6 15.1 29.3 30.6 16.0 100.0% 31,624Ovary 0.1 0.9 3.6 10.8 17.4 28.1 27.8 11.4 100.0% 67,026Prostate 0.0 0.0 0.1 1.1 6.4 24.7 42.2 25.4 100.0% 165,417Testis 2.4 35.5 29.4 13.6 7.3 5.8 4.5 1.5 100.0% 1,723Urinary bladder 0.0 0.1 0.9 3.6 9.7 25.4 36.9 23.3 100.0% 57,783Kidney & Renal pelvis 0.6 0.6 3.1 10.4 18.8 28.8 26.8 11.0 100.0% 56,072Brain & Other nervous 4.4 4.5 8.4 14.3 18.9 25.6 19.0 4.9 100.0% 62,342Thyroid 0.2 1.0 2.6 7.5 14.6 27.0 31.3 15.7 100.0% 5,949Hodgkin's disease 2.5 17.8 14.1 11.9 11.5 18.3 17.7 6.2 100.0% 6,996Non-Hodgkin's lymphomas 0.5 2.4 4.4 8.0 13.8 26.4 31.3 13.1 100.0% 115,038Multiple myeloma 0.0 0.2 1.5 6.3 15.3 30.6 33.2 13.0 100.0% 51,601Leukemias 3.5 3.7 4.2 6.7 11.8 24.7 30.1 15.3 100.0% 102,841Acute lymphocytic 23.3 15.7 9.1 9.3 10.3 13.5 13.2 5.5 100.0% 6,962Chronic lymphocytic 0.0 0.1 0.6 3.3 10.2 26.0 35.6 24.3 100.0% 21,445Acute myeloid 3.1 4.3 5.2 8.4 14.0 27.4 28.1 9.5 100.0% 32,284Chronic myeloid 1.4 5.4 7.8 10.9 14.1 23.6 25.2 11.7 100.0% 10,927All other leukemias 2.6 2.5 3.1 5.2 10.3 24.0 33.7 18.5 100.0% 31,223
SEER C
ancer Statistics Review
1973-1999N
ational Cancer Institute
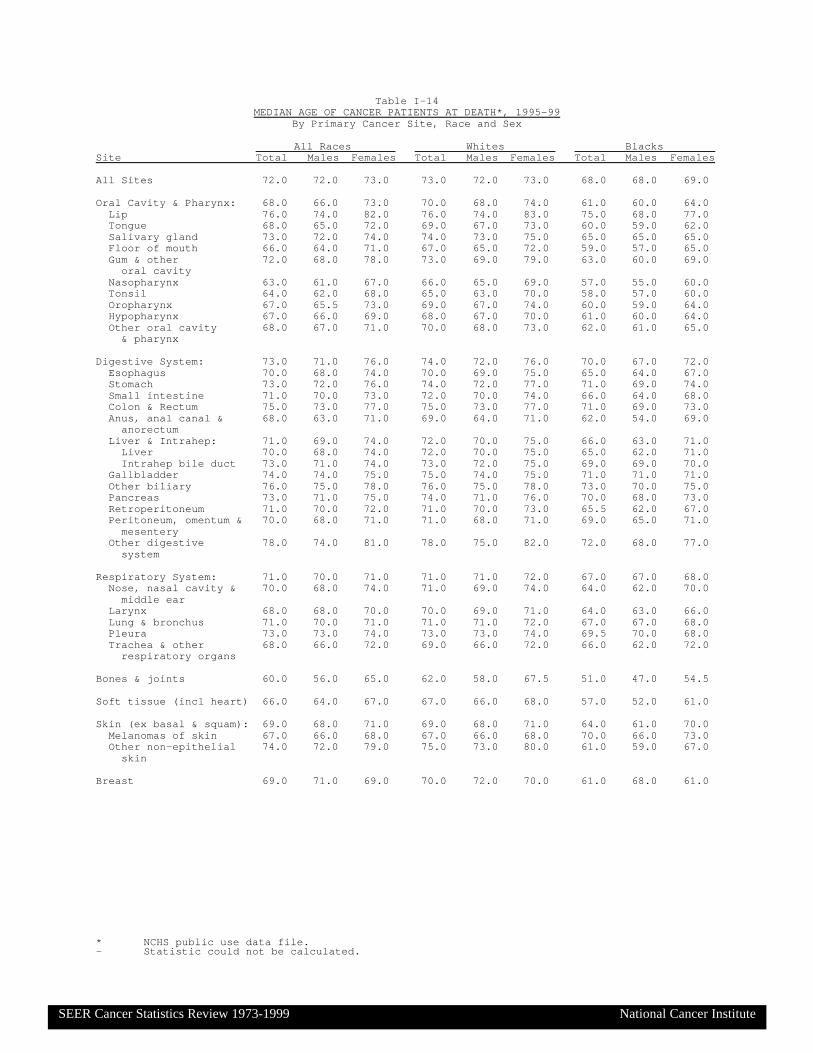
* NCHS public use data file.- Statistic could not be calculated.
Table I-14MEDIAN AGE OF CANCER PATIENTS AT DEATH*, 1995-99
By Primary Cancer Site, Race and Sex
All Races Whites BlacksSite Total Males Females Total Males Females Total Males Females All Sites 72.0 72.0 73.0 73.0 72.0 73.0 68.0 68.0 69.0
Oral Cavity & Pharynx: 68.0 66.0 73.0 70.0 68.0 74.0 61.0 60.0 64.0 Lip 76.0 74.0 82.0 76.0 74.0 83.0 75.0 68.0 77.0 Tongue 68.0 65.0 72.0 69.0 67.0 73.0 60.0 59.0 62.0 Salivary gland 73.0 72.0 74.0 74.0 73.0 75.0 65.0 65.0 65.0 Floor of mouth 66.0 64.0 71.0 67.0 65.0 72.0 59.0 57.0 65.0 Gum & other 72.0 68.0 78.0 73.0 69.0 79.0 63.0 60.0 69.0 oral cavity Nasopharynx 63.0 61.0 67.0 66.0 65.0 69.0 57.0 55.0 60.0 Tonsil 64.0 62.0 68.0 65.0 63.0 70.0 58.0 57.0 60.0 Oropharynx 67.0 65.5 73.0 69.0 67.0 74.0 60.0 59.0 64.0 Hypopharynx 67.0 66.0 69.0 68.0 67.0 70.0 61.0 60.0 64.0 Other oral cavity 68.0 67.0 71.0 70.0 68.0 73.0 62.0 61.0 65.0 & pharynx
Digestive System: 73.0 71.0 76.0 74.0 72.0 76.0 70.0 67.0 72.0 Esophagus 70.0 68.0 74.0 70.0 69.0 75.0 65.0 64.0 67.0 Stomach 73.0 72.0 76.0 74.0 72.0 77.0 71.0 69.0 74.0 Small intestine 71.0 70.0 73.0 72.0 70.0 74.0 66.0 64.0 68.0 Colon & Rectum 75.0 73.0 77.0 75.0 73.0 77.0 71.0 69.0 73.0 Anus, anal canal & 68.0 63.0 71.0 69.0 64.0 71.0 62.0 54.0 69.0 anorectum Liver & Intrahep: 71.0 69.0 74.0 72.0 70.0 75.0 66.0 63.0 71.0 Liver 70.0 68.0 74.0 72.0 70.0 75.0 65.0 62.0 71.0 Intrahep bile duct 73.0 71.0 74.0 73.0 72.0 75.0 69.0 69.0 70.0 Gallbladder 74.0 74.0 75.0 75.0 74.0 75.0 71.0 71.0 71.0 Other biliary 76.0 75.0 78.0 76.0 75.0 78.0 73.0 70.0 75.0 Pancreas 73.0 71.0 75.0 74.0 71.0 76.0 70.0 68.0 73.0 Retroperitoneum 71.0 70.0 72.0 71.0 70.0 73.0 65.5 62.0 67.0 Peritoneum, omentum & 70.0 68.0 71.0 71.0 68.0 71.0 69.0 65.0 71.0 mesentery Other digestive 78.0 74.0 81.0 78.0 75.0 82.0 72.0 68.0 77.0 system
Respiratory System: 71.0 70.0 71.0 71.0 71.0 72.0 67.0 67.0 68.0 Nose, nasal cavity & 70.0 68.0 74.0 71.0 69.0 74.0 64.0 62.0 70.0 middle ear Larynx 68.0 68.0 70.0 70.0 69.0 71.0 64.0 63.0 66.0 Lung & bronchus 71.0 70.0 71.0 71.0 71.0 72.0 67.0 67.0 68.0 Pleura 73.0 73.0 74.0 73.0 73.0 74.0 69.5 70.0 68.0 Trachea & other 68.0 66.0 72.0 69.0 66.0 72.0 66.0 62.0 72.0 respiratory organs
Bones & joints 60.0 56.0 65.0 62.0 58.0 67.5 51.0 47.0 54.5
Soft tissue (incl heart) 66.0 64.0 67.0 67.0 66.0 68.0 57.0 52.0 61.0
Skin (ex basal & squam): 69.0 68.0 71.0 69.0 68.0 71.0 64.0 61.0 70.0 Melanomas of skin 67.0 66.0 68.0 67.0 66.0 68.0 70.0 66.0 73.0 Other non-epithelial 74.0 72.0 79.0 75.0 73.0 80.0 61.0 59.0 67.0 skin
Breast 69.0 71.0 69.0 70.0 72.0 70.0 61.0 68.0 61.0
SEER Cancer Statistics Review 1973-1999 National Cancer Institute

* NCHS public use data file.- Statistic could not be calculated.
Table I-14 - continuedMEDIAN AGE OF CANCER PATIENTS AT DEATH*, 1995-99
By Primary Cancer Site, Race and Sex
All Races Whites BlacksSite Total Males Females Total Males Females Total Males Females Female Genital System: 71.0 - 71.0 71.0 - 71.0 68.0 - 68.0 Cervix uteri 57.0 - 57.0 57.0 - 57.0 58.0 - 58.0 Corpus uteri 73.0 - 73.0 74.0 - 74.0 71.0 - 71.0 Uterus, NOS 74.0 - 74.0 75.0 - 75.0 71.0 - 71.0 Ovary 71.0 - 71.0 71.0 - 71.0 69.0 - 69.0 Vagina 76.0 - 76.0 76.0 - 76.0 72.0 - 72.0 Vulva 79.0 - 79.0 80.0 - 80.0 71.5 - 71.5 Other female 70.0 - 70.0 71.0 - 71.0 66.0 - 66.0 genital system
Male Genital System: 79.0 79.0 - 79.0 79.0 - 77.0 77.0 - Prostate 79.0 79.0 - 79.0 79.0 - 77.0 77.0 - Testis 38.0 38.0 - 38.0 38.0 - 38.0 38.0 - Penis 70.0 70.0 - 71.0 71.0 - 68.0 68.0 - Other male 72.0 72.0 - 73.0 73.0 - 63.0 63.0 - genital system
Urinary System: 74.0 73.0 76.0 75.0 74.0 77.0 71.0 69.0 73.0 Urinary bladder 77.0 76.0 80.0 77.0 76.0 80.0 75.0 74.0 77.0 Kidney & renal pelvis 71.0 69.0 73.0 71.0 69.0 73.0 67.0 65.0 70.0 Ureter 76.0 75.0 78.0 76.0 75.0 78.0 77.0 72.0 78.0 Other urinary system 75.0 75.0 75.0 76.0 75.0 78.0 68.0 68.5 68.0
Eye & Orbit 71.0 69.0 73.0 71.0 70.0 73.0 54.5 52.5 58.0
Brain & Nervous System: 64.0 62.0 66.0 65.0 63.0 67.0 58.0 56.0 60.0 Brain 64.0 62.0 66.0 65.0 63.0 67.0 58.0 56.0 60.0 Cranial nerves & other 65.0 63.0 68.0 66.0 64.0 69.0 59.0 54.0 60.0 nervous system
Endocrine System: 69.0 65.0 72.0 69.0 66.0 72.0 62.0 54.0 67.0 Thyroid 74.0 70.0 76.0 74.0 70.0 76.0 70.5 66.0 73.0 Other endocrine & 57.0 55.0 59.0 58.0 57.0 60.0 47.0 40.5 53.0 thymus
Lymphomas: 72.0 70.0 75.0 73.0 71.0 75.0 62.0 59.0 67.0 Hodgkin's disease 58.0 54.0 63.0 60.0 56.0 66.0 41.0 41.0 41.0 Non-Hodgkin's 73.0 71.0 75.0 73.0 71.0 75.0 64.0 60.0 68.0 lymphomas
Multiple myeloma 73.0 72.0 75.0 74.0 73.0 75.0 71.0 70.0 71.0
Leukemias: 73.0 72.0 75.0 74.0 72.0 75.0 67.0 65.0 69.0 Lymphocytic: 75.0 73.0 77.0 75.0 73.0 78.0 69.0 67.0 71.0 Acute lymphocytic 47.0 41.0 53.0 49.0 44.0 56.0 35.0 31.5 39.0 Chronic lymphocytic 77.0 75.0 80.0 78.0 76.0 81.0 73.0 71.0 76.0 Other lymphocytic 77.0 76.0 80.0 78.0 76.0 80.0 72.0 70.0 74.0 Myeloid: 71.0 70.0 71.0 71.0 71.0 72.0 63.0 61.0 64.5 Acute myeloid 71.0 70.0 71.0 71.0 71.0 72.0 64.0 64.0 65.0 Chronic myeloid 70.0 68.0 71.0 71.0 70.0 72.0 58.0 55.0 62.0 Other myeloid 76.0 75.0 78.0 77.0 76.0 78.0 73.0 71.5 76.0 Monocytic: 75.0 74.0 76.0 75.0 74.0 77.0 65.0 67.0 65.0 Acute monocytic 73.0 72.0 75.0 74.0 73.0 75.0 61.0 64.0 56.5 Chronic monocytic 81.0 81.0 83.0 81.0 81.0 83.0 76.5 63.0 80.0 Other monocytic 77.5 75.0 79.5 78.0 77.0 80.0 73.0 74.0 73.0 Other: 75.0 74.0 77.0 75.0 74.0 77.0 70.0 68.0 72.0 Other acute 74.0 73.0 75.0 74.0 73.0 76.0 70.0 69.0 71.0 Other chronic 79.0 77.0 82.0 80.0 78.0 83.0 73.0 71.0 77.0 Aleukemic, subleuk & 76.0 74.0 78.0 76.0 74.0 78.0 70.0 68.0 72.0 NOS
Ill-defined & 73.0 71.0 75.0 74.0 72.0 76.0 68.0 66.0 71.0 unspecified
SEER Cancer Statistics Review 1973-1999 National Cancer Institute

Note: Invasive cancer only unless specified otherwise.
Table I-15
Lifetime Risk (Percent) of Being Diagnosed with Cancer by Site, Race and Sex
12 SEER Areas, 1997-99
All Races Whites BlacksSite Males Females Males Females Males Females All Sites 43.78 38.42 43.64 39.38 41.24 32.35 Invasive and In Situ 45.26 41.74 45.18 42.79 42.03 34.74Oral cavity and Pharynx 1.41 0.69 1.41 0.70 1.39 0.55Esophagus 0.74 0.26 0.75 0.25 0.78 0.39Stomach 1.26 0.80 1.10 0.65 1.36 1.12Colon and Rectum 5.98 5.64 6.03 5.64 4.90 5.41 Invasive and In Situ 6.34 5.92 6.38 5.91 5.24 5.74Liver and Intrahepatic bile duct 0.83 0.41 0.67 0.35 0.74 0.40Pancreas 1.22 1.25 1.21 1.21 1.23 1.47Larynx 0.66 0.17 0.66 0.17 0.86 0.25 Invasive and In Situ 0.71 0.18 0.71 0.18 0.91 0.27Lung and Bronchus 7.78 5.78 7.74 6.06 8.46 5.18Melanomas of skin 1.76 1.24 2.04 1.45 0.11 0.08 Invasive and In Situ 2.73 1.91 3.12 2.20 0.14 0.12Breast 0.11 13.33 0.11 13.95 0.12 10.21 Invasive and In Situ 0.12 15.66 0.12 16.33 0.14 12.07Cervix uteri - 0.81 - 0.75 - 1.03Corpus and Uterus, NOS - 2.68 - 2.86 - 1.72 Invasive and In Situ - 2.72 - 2.91 - 1.75Ovary - 1.72 - 1.83 - 1.10Prostate 16.61 - 16.15 - 19.18 -Testis 0.35 - 0.41 - 0.09 -Urinary bladder(Invasive and In Situ) 3.46 1.14 3.83 1.21 1.42 0.79Kidney and Renal pelvis 1.39 0.85 1.44 0.88 1.21 0.83Brain and Other nervous system 0.66 0.54 0.73 0.60 0.32 0.30Thyroid 0.29 0.81 0.31 0.83 0.13 0.44Hodgkin's disease 0.23 0.20 0.25 0.23 0.17 0.15Non-Hodgkin's lymphomas 2.11 1.79 2.21 1.89 1.31 1.07Multiple myeloma 0.66 0.54 0.63 0.50 0.93 0.95Leukemias 1.45 1.02 1.54 1.07 0.87 0.71
SEER C
ancer Statistics Review
1973-1999N
ational Cancer Institute
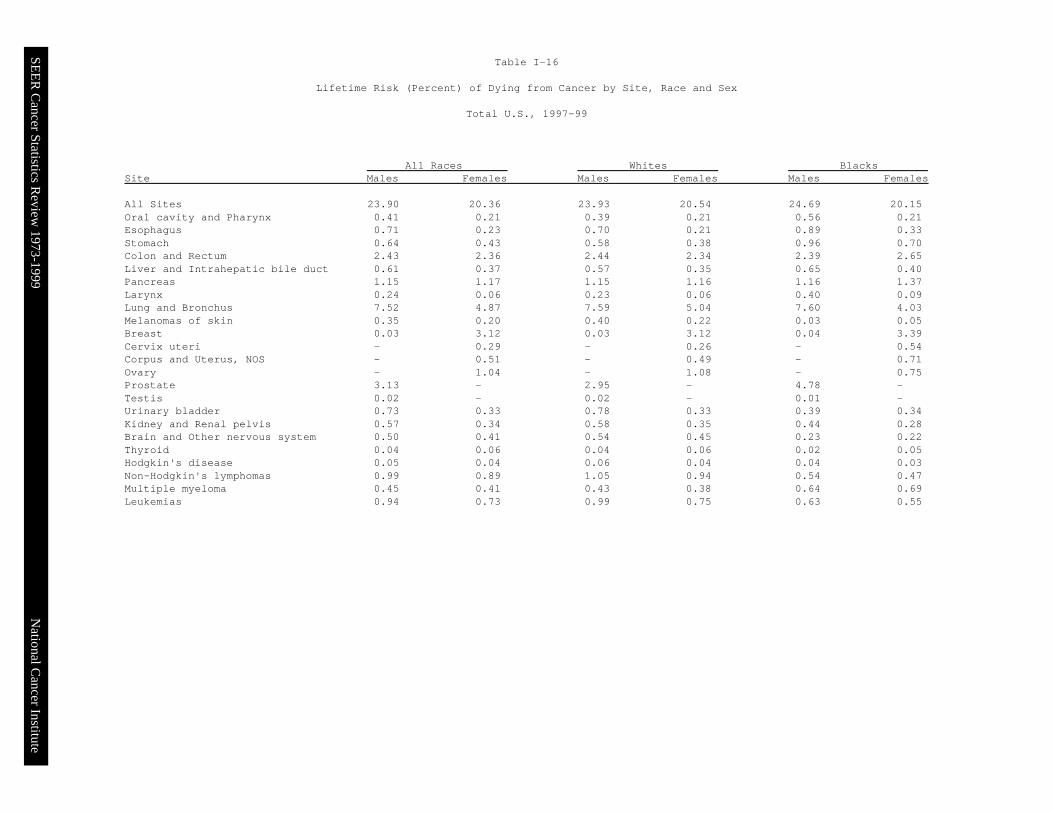
Table I-16
Lifetime Risk (Percent) of Dying from Cancer by Site, Race and Sex
Total U.S., 1997-99
All Races Whites BlacksSite Males Females Males Females Males Females All Sites 23.90 20.36 23.93 20.54 24.69 20.15Oral cavity and Pharynx 0.41 0.21 0.39 0.21 0.56 0.21Esophagus 0.71 0.23 0.70 0.21 0.89 0.33Stomach 0.64 0.43 0.58 0.38 0.96 0.70Colon and Rectum 2.43 2.36 2.44 2.34 2.39 2.65Liver and Intrahepatic bile duct 0.61 0.37 0.57 0.35 0.65 0.40Pancreas 1.15 1.17 1.15 1.16 1.16 1.37Larynx 0.24 0.06 0.23 0.06 0.40 0.09Lung and Bronchus 7.52 4.87 7.59 5.04 7.60 4.03Melanomas of skin 0.35 0.20 0.40 0.22 0.03 0.05Breast 0.03 3.12 0.03 3.12 0.04 3.39Cervix uteri - 0.29 - 0.26 - 0.54Corpus and Uterus, NOS - 0.51 - 0.49 - 0.71Ovary - 1.04 - 1.08 - 0.75Prostate 3.13 - 2.95 - 4.78 -Testis 0.02 - 0.02 - 0.01 -Urinary bladder 0.73 0.33 0.78 0.33 0.39 0.34Kidney and Renal pelvis 0.57 0.34 0.58 0.35 0.44 0.28Brain and Other nervous system 0.50 0.41 0.54 0.45 0.23 0.22Thyroid 0.04 0.06 0.04 0.06 0.02 0.05Hodgkin's disease 0.05 0.04 0.06 0.04 0.04 0.03Non-Hodgkin's lymphomas 0.99 0.89 1.05 0.94 0.54 0.47Multiple myeloma 0.45 0.41 0.43 0.38 0.64 0.69Leukemias 0.94 0.73 0.99 0.75 0.63 0.55
SEER C
ancer Statistics Review
1973-1999N
ational Cancer Institute

Iowa
Seattle/Puget Sound
San Francisco/Oakland
San Jose/Monterey
LosAngeles
NewMexico
Utah
Atlanta
DetroitConnecticut
SEER C
ancer Statistics Review
1973-1999N
ational Cancer Institute
Surveillance, Epidemiology, and End Results Program, 2002National Cancer Institute
U.S.A
http://seer.cancer.gov
Figure I-1
Alaska Hawaii

SEE
R C
ancer Statistics Review
1973-1999
Leading Causes of Death in U.S.Percent of All Causes of Death
1973 vs. 1999
Cancer 17.7%
Cerebrovascular 10.9%
Heart Disease 38.4%
Accidents 5.9%
Other Causes 22.5%
Chronic Lung Disease 1.5%
Pneumonia & Influ. 3.2%
1973 1999
National C
ancer Institute
Cancer 23.0%Cerebrovascular 7.0%
Heart Disease 30.3%
Accidents 4.1%Other Causes 27.7%
Chronic Lung Disease 5.2%
Pneumonia & Influ. 2.7%
NCHS public use data file.

SEE
R C
ancer Statistics Review
1973-1999
U.S. Death Rates1973 - 1999
Ages 65 and Over
1973 1978 1983 1988 1993 1999
Year of Death
40
50
60
70
80
90
100
110Rate per 100,000
1973 1978 1983 1988 1993 1999
Year of Death
500
1000
1500
2000
2500
3000
3500Rate per 100,000
27% of deathsin 1973
Heart Disease
21% of deathsin 1973
Neoplasms
27% of deathsin 1999
20% of deathsin 1999
45% of deathsin 1973
Heart Disease
34% of deathsin 1999
16% of deathsin 1973
Neoplasms 22% of deathsin 1999
National C
ancer Institute
Ages Less Than 65
NCHS public use data file. Rates are per 100,000 and age-adjusted to the 2000 U.S. standard population by 5-year age groups.

SEE
R C
ancer Statistics Review
1973-1999
Trends in SEER Incidence & U.S. Death Ratesby Primary Cancer Site
1992-1999
Trends in SEER Incidence Rates Trends in U.S. Cancer Death Rates
National C
ancer Institute
4.3*
3.2*
2.8*
1.1
1.1*
0.9*
0.5
0.3
0.1
0.1
-0.1
-0.4
-0.4
-0.6
-0.6
-0.8*
-0.9*
-0.9*
-1.1
-1.3*
-1.6*
-2.1*
-2.3*
-2.5*
-2.6*
-4.2*
Liver & IntrahepThyroid
Melanomas of SkinTestis
Breast (Females)Kidney/Renal
EsophagusCorpus & Uterus, NOS
Non-Hodgkin’sLung (Females)
Hodgkin’sUrinary Bladder
Brain & ONSColon/Rectum
PancreasAll Except Lung
All CancersOvary
Multiple MyelomaStomach
LeukemiasOral Cav & Phynx
Cervix UteriLung (Males)
LarynxProstate
0 2 4 6 8 10-2-4-6-8-10
EAPC, 1992-1999
Liver & IntrahepLung (Females)
EsophagusNon-Hodgkin’s
Melanomas of SkinThyroid
PancreasMultiple Myeloma
Kidney/RenalUrinary Bladder
Corpus & Uterus, NOSTestis
Brain & ONSLeukemiasAll Cancers
OvaryAll Except Lung
Colon/RectumLung (Males)
LarynxBreast (Females)Oral Cav & Phynx
Cervix UteriStomach
Hodgkin’sProstate
0 2 4 6 8 10-2-4-6-8-10
EAPC, 1992-1999
2.4*
0.8*
0.7*
0.6
0.1
0.0
-0.1
-0.1
-0.2
-0.3
-0.3
-0.4
-0.5*
-0.5*
-0.9*
-0.9*
-1.0*
-1.7*
-1.8*
-2.0*
-2.4*
-2.5*
-2.7*
-2.8*
-3.5*
-3.5*
The EAPC is the Estimated Annual Percent Change over the time interval.SEER 12 areas and NCHS public use data file. Rates are per 100,000 and age-adjusted to the 2000 U.S. standard population by 5-year age groups.* The EAPC is significantly different from zero (p<.05).

SEE
R C
ancer Statistics Review
1973-1999
Trends in SEER Incidence Ratesby Primary Cancer Site
1992-1999
National C
ancer Institute
Liver & IntrahepThyroid
ProstateMelanomas of Skin
Corpus & Uterus, NOSBreast (Females)
Kidney/RenalTestis
PancreasAll Except Lung
Colon/RectumAll Cancers
Hodgkin’sOvary
Brain & ONSMultiple Myeloma
EsophagusUrinary Bladder
LeukemiasNon-Hodgkin’s
StomachLung (Females)
Cervix UteriOral Cav & Phynx
LarynxLung (Males)
0 2 4 6 8 10-2-4-6-8-10
EAPC, 1992-1999
5.9*
3.7*
3.2*
2.0*
1.8*
1.4*
1.1*
1.1
0.6
0.4*
0.3
0.0
-0.1
-0.6
-0.7
-0.7
-0.9
-0.9*
-0.9
-1.3
-1.6*
-2.1*
-2.1*
-2.2*
-3.1*
-3.7*
Melanomas of SkinLiver & IntrahepLung (Females)
EsophagusThyroid
Non-Hodgkin’sKidney/Renal
Breast (Females)Brain & ONS
TestisUrinary Bladder
Hodgkin’sColon/Rectum
PancreasStomach
OvaryMultiple Myeloma
Corpus & Uterus, NOSAll Cancers
All Except LungOral Cav & Phynx
Lung (Males)Leukemias
LarynxCervix Uteri
Prostate
0 2 4 6 8 10-2-4-6-8-10
EAPC, 1992-1999
4.2*
3.2*
1.4*
1.3*
1.3
1.3*
0.7
0.6
0.1
0.0
-0.2
-0.2
-1.0*
-1.1*
-1.2*
-1.2*
-1.3
-1.3*
-1.5*
-1.7*
-1.9*
-2.0*
-2.2*
-2.3*
-2.9*
-6.6*
Ages Less Than 65 Ages 65 and Over
The EAPC is the Estimated Annual Percent Change over the time interval.SEER 12 areas. Rates are per 100,000 and age-adjusted to the 2000 U.S. standard population by 5-year age groups.* The EAPC is significantly different from zero (p<.05).
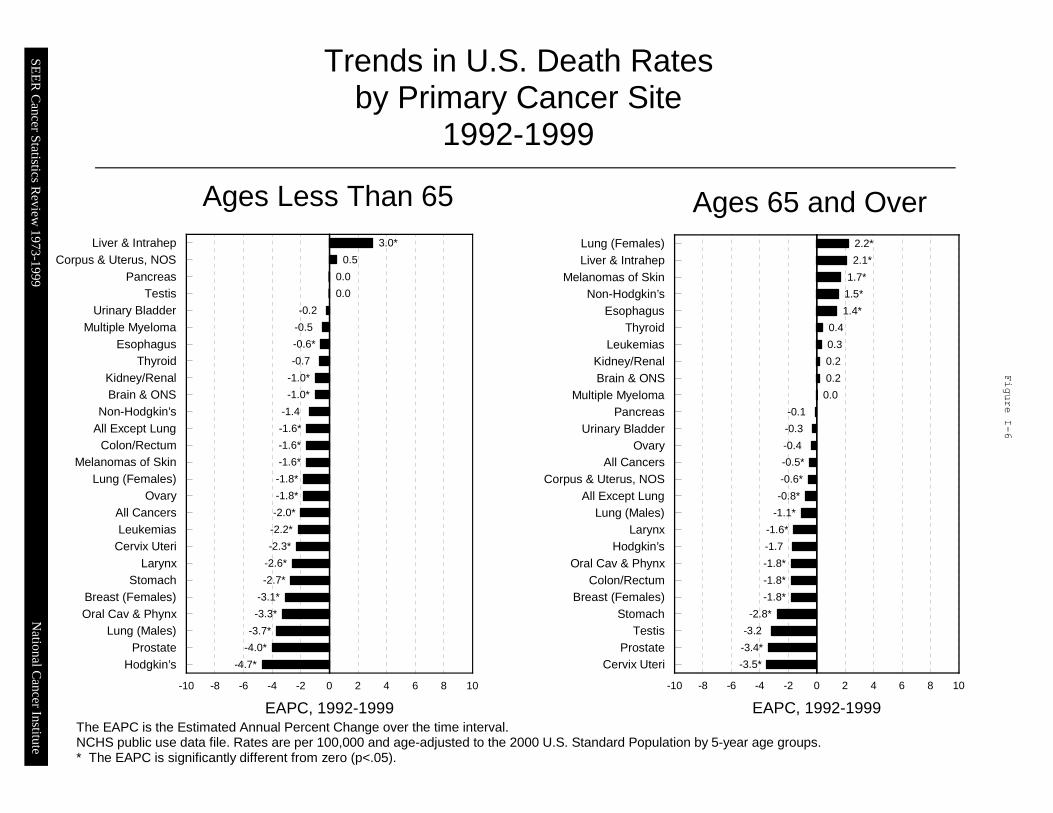
SEE
R C
ancer Statistics Review
1973-1999
Trends in U.S. Death Ratesby Primary Cancer Site
1992-1999
Ages Less Than 653.0*
0.5
0.0
0.0
-0.2
-0.5
-0.6*
-0.7
-1.0*
-1.0*
-1.4
-1.6*
-1.6*
-1.6*
-1.8*
-1.8*
-2.0*
-2.2*
-2.3*
-2.6*
-2.7*
-3.1*
-3.3*
-3.7*
-4.0*
-4.7*
Liver & IntrahepCorpus & Uterus, NOS
PancreasTestis
Urinary BladderMultiple Myeloma
EsophagusThyroid
Kidney/RenalBrain & ONS
Non-Hodgkin’sAll Except Lung
Colon/RectumMelanomas of Skin
Lung (Females)Ovary
All CancersLeukemias
Cervix UteriLarynx
StomachBreast (Females)Oral Cav & Phynx
Lung (Males)Prostate
Hodgkin’s
0 2 4 6 8 10-2-4-6-8-10
EAPC, 1992-1999
Ages 65 and Over2.2*
2.1*
1.7*
1.5*
1.4*
0.4
0.3
0.2
0.2
0.0
-0.1
-0.3
-0.4
-0.5*
-0.6*
-0.8*
-1.1*
-1.6*
-1.7
-1.8*
-1.8*
-1.8*
-2.8*
-3.2
-3.4*
-3.5*
Lung (Females)Liver & Intrahep
Melanomas of SkinNon-Hodgkin’s
EsophagusThyroid
LeukemiasKidney/RenalBrain & ONS
Multiple MyelomaPancreas
Urinary BladderOvary
All CancersCorpus & Uterus, NOS
All Except LungLung (Males)
LarynxHodgkin’s
Oral Cav & PhynxColon/Rectum
Breast (Females)Stomach
TestisProstate
Cervix Uteri
0 2 4 6 8 10-2-4-6-8-10
EAPC, 1992-1999
National C
ancer Institute
The EAPC is the Estimated Annual Percent Change over the time interval.NCHS public use data file. Rates are per 100,000 and age-adjusted to the 2000 U.S. Standard Population by 5-year age groups.* The EAPC is significantly different from zero (p<.05).

SEE
R C
ancer Statistics Review
1973-1999
Trends in SEER Incidence Ratesby Primary Cancer Site
1992-1999
All Races, Males All Races, Females
National C
ancer Institute
3.8*
2.9*
1.2
1.1
0.6
0.5
-0.4
-0.6*
-0.6
-0.7
-0.7
-1.0*
-1.3
-1.7*
-2.1*
-2.2*
-2.3*
-2.5*
-2.6*
-3.5*
-4.2*
Liver & Intrahep
Melanomas of Skin
Thyroid
Testis
Esophagus
Kidney/Renal
Hodgkin’s
Urinary Bladder
Non-Hodgkin’s
Pancreas
Brain & CNS
Colon/Rectum
Multiple Myeloma
Leukemias
Stomach
All Except Lung
All Cancers
Lung (Males)
Oral Cav & Phynx
Larynx
Prostate
0 2 4 6 8 10-2-4-6-8-10
EAPC, 1992-1999
4.5*
3.9*
2.7*
1.1*
1.1*
1.1*
0.4
0.3
0.3
0.1
0.1
-0.1
-0.1
-0.3
-0.4
-0.4
-0.6
-0.7
-0.9*
-1.3
-1.3
-1.5
-2.3*
Liver & Intrahep
Thyroid
Melanomas of Skin
Breast (Females)
Kidney/Renal
Non-Hodgkin’s
All Except Lung
All Cancers
Corpus & Uterus, NOS
Lung (Females)
Hodgkin’s
Larynx
Brain & CNS
Colon/Rectum
Esophagus
Stomach
Urinary Bladder
Pancreas
Ovary
Oral Cav & Phynx
Multiple Myeloma
Leukemias
Cervix Uteri
0 2 4 6 8 10-2-4-6-8-10
EAPC, 1992-1999The EAPC is the Estimated Annual Percent Change over the time interval.SEER 12 areas. Rates are per 100,000 and age-adjusted to the 2000 U.S. Standard Population by 5-year age groups.* The EAPC is significantly different from zero (p<.05).

SEE
R C
ancer Statistics Review
1973-1999
Trends in U.S. Death Ratesby Primary Cancer Site
1992-1999
National C
ancer Institute
2.3*
1.8
0.7*
0.5
0.5
-0.3
-0.3
-0.3
-0.4
-0.5*
-0.7*
-0.8*
-1.3*
-1.5*
-1.8*
-2.1*
-2.5*
-2.8*
-3.2*
-3.5*
-4.0*
Liver & Intrahep
Thyroid
Esophagus
Melanomas of Skin
Non-Hodgkin’s
Pancreas
Kidney/Renal
Multiple Myeloma
Testis
Brain & CNS
Urinary Bladder
Leukemias
All Except Lung
All Cancers
Lung (Males)
Colon/Rectum
Larynx
Oral Cav & Phynx
Stomach
Prostate
Hodgkin’s
0 2 4 6 8 10-2-4-6-8-10
EAPC, 1992-1999
1.9*
0.8*
0.6
0.1
-0.1
-0.1
-0.3
-0.3
-0.4
-0.4
-0.5
-0.5*
-0.6*
-0.8
-0.9*
-1.0*
-1.3*
-1.6*
-2.2*
-2.4*
-2.5*
-2.7*
-3.0*
Liver & Intrahep
Lung (Females)
Non-Hodgkin’s
Esophagus
Pancreas
Multiple Myeloma
Corpus & Uterus, NOS
Urinary Bladder
Kidney/Renal
Leukemias
Melanomas of Skin
Brain & CNS
All Cancers
Thyroid
Ovary
All Except Lung
Larynx
Colon/Rectum
Oral Cav & Phynx
Breast (Females)
Stomach
Cervix Uteri
Hodgkin’s
0 2 4 6 8 10-2-4-6-8-10
EAPC, 1992-1999
All Races, Males All Races, Females
The EAPC is the Estimated Annual Percent Change over the time interval.NCHS public use data file. Rates are per 100,000 and age-adjusted to the 2000 U.S. Standard Population by 5-year age groups.* The EAPC is significantly different from zero (p<.05).

SEE
R C
ancer Statistics Review
1973-1999
SEER Incidence* and U.S. Death Rates# (1995-1999)5-Year Relative Survival Rates^ (1992-1998)
All Cancers Combined, by Race and Sex
SEER Incidence U.S. Mortality 0
50
100
150
200
250
300
350
400
450
500
550
600
650
700Rate per 100,000
Blacks Whites
Males
SEER Incidence U.S. Mortality 0
50
100
150
200
250
300
350
400
450
500
550
600
650
700Rate per 100,000
Blacks Whites
Females
* Incidence rates are from the SEER 12 areas and are age-adjusted to the 2000 U.S. standard population by 5-year age groups. # Death rates are from the NCHS public use data file and are age-adjusted to the 2000 U.S. standard population by 5-year age groups.^ Survival rates are from the SEER 9 areas. Relative survival rates are expressed as percents.
Black White 0
10
20
30
40
50
60
70Percent (%)
Survival, 1992-1998 Survival, 1992-1998
National C
ancer Institute
Black White 0
10
20
30
40
50
60
70Percent (%)
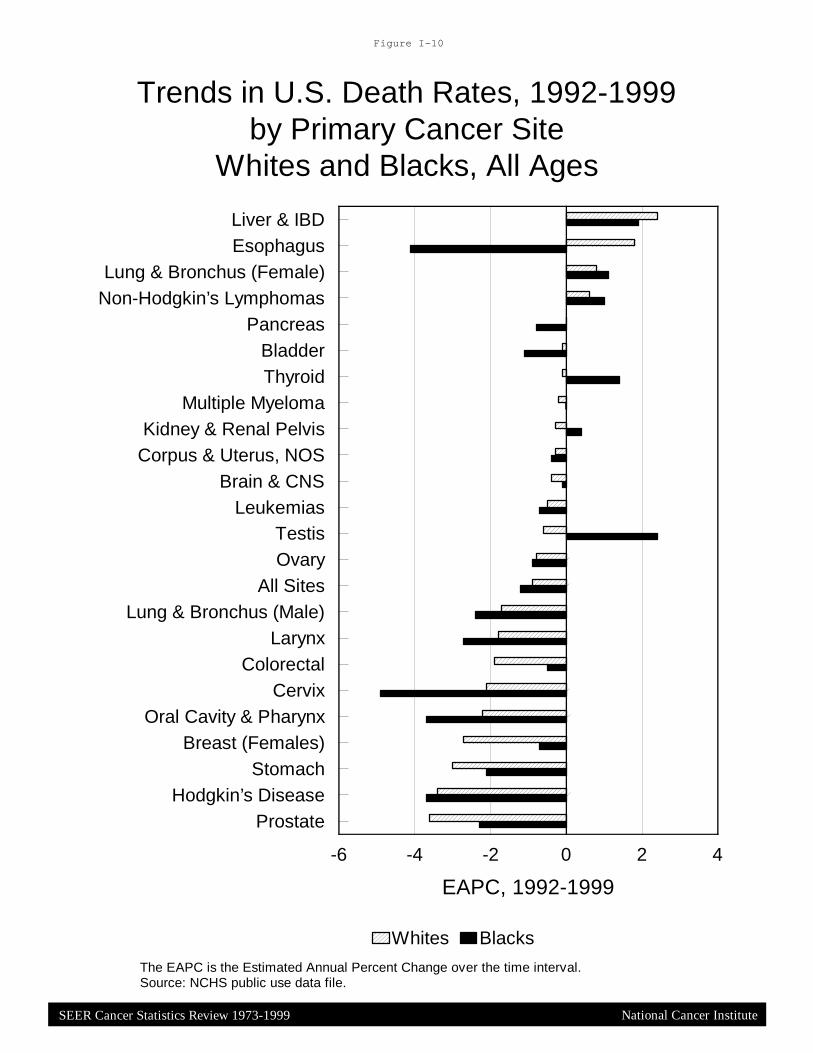
SEER Cancer Statistics Review 1973-1999
Figure I-10
Trends in U.S. Death Rates, 1992-1999by Primary Cancer Site
Whites and Blacks, All Ages
Liver & IBDEsophagus
Lung & Bronchus (Female)Non-Hodgkin’s Lymphomas
PancreasBladderThyroid
Multiple MyelomaKidney & Renal Pelvis
Corpus & Uterus, NOSBrain & CNS
LeukemiasTestisOvary
All SitesLung & Bronchus (Male)
LarynxColorectal
CervixOral Cavity & Pharynx
Breast (Females)Stomach
Hodgkin’s DiseaseProstate
0 2 4-2-4-6
EAPC, 1992-1999
Whites Blacks
National Cancer Institute
The EAPC is the Estimated Annual Percent Change over the time interval.Source: NCHS public use data file.

SEER Cancer Statistics Review 1973-1999
Figure I-11
5-Year Relative Survival RatesSEER Program, 1992-1998
Males and Females
National Cancer Institute
White Patients98
96
96
89
88
86
85
82
72
66
63
62
62
59
56
52
47
31
29
21
15
15
7
4
Larynx
Thyroid
Multiple MyelomaStomach
Oral Cav & Phynx
Corpus & Uterus,NOS
Liver & IntrahepPancreas
Kidney/Renal
Colon
Breast (Females)
Rectum
Prostate
Hodgkin’s
Esophagus
Urinary Bladder
LeukemiasOvary
Non-Hodgkin’s
Brain & ONS
Testis
Melanomas of Skin
Lung & Bronchus
Cervix Uteri
93
85
93
65
73
61
77
65
60
54
53
53
60
35
46
52
38
40
33
20
8
12
4
4
Cancer Site Black Patients
Source: SEER 9 areas.

SEER Cancer Statistics Review 1973-1999
SEER Cancer Incidence and U.S. Death Rates, 1995-1999by Cancer Site and Race
Figure I-12
63.2
81.1
43.6
34.5
30.4
53.2
61.3
47.8
36.3
35.6
139.0
121.5
97.9
59.7
83.5
158.7
257.3
100.9
56.4
120.5
57.5
67.8
29.0
36.2
23.8
21.3
29.0
13.3
13.5
13.0
28.2
37.1
13.0
15.0
17.2
31.2
72.8
14.3
17.5
21.6
Incidence
Source: SEER 12 areas and NCHS public use data file. ^^^ Hispanic is not mutually exclusive from Whites, Blacks, Asian/Pacific Islanders, and American Indians/Alaskan Natives. Incidence data for Hispanics excludes Detroit and Hawaii. Mortality data for Hispanics excludes cases from Connecticut, Oklahoma, New York, and New Hampshire. Rates are per 100,000 and age-adjusted to the 2000 U.S. standard population by 5-year age groups.
National Cancer Institute
Black
Asian/Pacific Islander
Amer. Ind/Alaska Nat.
Hispanic^^^
Colon and RectumWhite
Black
Asian/Pacific Islander
Amer. Ind/Alaska Nat.
Hispanic^^^
Female BreastWhite
Amer. Ind/Alaska Nat.
Black
Asian/Pacific Islander
Hispanic^^^
ProstateWhite
Black
Asian/Pacific Islander
Amer. Ind/Alaska Nat.
Hispanic^^^
WhiteLung and Bronchus
Cancer Site Mortality

SEE
R C
ancer Statistics Review
1973-1999
Prostate Lung Colon & Rectum
Source: SEER 12 areas (San Francisco, Connecticut, Detroit, Hawaii, Iowa, New Mexico, Seattle, Utah, Atlanta, San Jose-Monterey, Los Angeles, and Alaska). Incidence data for Hispanics does not include cases from Detroit and Hawaii. Regression lines are calculated using the Joinpoint Regression Program. ^^^ Hispanic is not mutually exclusive from Whites, Blacks, Asian/Pacific Islanders, and American Indians/Alaskan Natives.
SEER Incidence 1992-1999Males by Race/Ethnicity
National C
ancer Institute
''
'
' '' '
'
##
## #
# # #
)
)
))
) ) ) )
,
,
,
,
, , , ,
"
"
"
"" " " "
1992 1994 1997 1999
Year of Diagnosis
0
50
100
150
200
250
300
350Rate per 100,000
Black, Hispanic ^^^) # Asian/Pacific Islander American Indian/Alaskan Native'" White
' '
''
'' ' '
# ## # # # # #)
)) ) ) ) ) )
,
,,
,,
, , ,
""
" " " " " "
1992 1994 1997 1999
Year of Diagnosis
0
50
100
150
200
250
300
350Rate per 100,000
''' '
''
''
# ## # # # # #) )) ) ) ) ) )
, ,, , , , , ," "" " " " " "
1992 1994 1997 1999
Year of Diagnosis
0
50
100
150
200
250
300
350Rate per 100,000

SEE
R C
ancer Statistics Review
1973-1999
Breast Lung Colon & Rectum
SEER Incidence 1992-1999Females by Race/Ethnicity
National C
ancer Institute
'
''
''
'
''
#
#
# ## #
# #
) ))
) ) ))
)
, ,, , , , , ,
""
" " " "" "
1992 1994 1997 1999
Year of Diagnosis
0
20
40
60
80
100
120
140
160Rate per 100,000
'
''' '
' ' '# ## # # # # #)
))
) ) ) ) )
, ,, ,,
,,
," "" " " " " "
1992 1994 1997 1999
Year of Diagnosis
0
20
40
60
80
100
120
140
160Rate per 100,000
' '
'' ' '
' '# ## # # ##
#
) )) ) ) ) ) )
, ,, , , , , ," "" " " " " "
1992 1994 1997 1999
Year of Diagnosis
0
20
40
60
80
100
120
140
160Rate per 100,000
Source: SEER 12 areas (San Francisco, Connecticut, Detroit, Hawaii, Iowa, New Mexico, Seattle, Utah, Atlanta, San Jose-Monterey, Los Angeles, and Alaska). Incidence data for Hispanics does not include cases from Detroit and Hawaii. Regression lines are calculated using the Joinpoint Regression Program. ^^^ Hispanic is not mutually exclusive from Whites, Blacks, Asian/Pacific Islanders, and American Indians/Alaskan Natives.
Black, Hispanic ^^^) # Asian/Pacific Islander American Indian/Alaskan Native'" White

SEE
R C
ancer Statistics Review
1973-1999
Prostate Lung Colon & Rectum
Source: NCHS public use data file. Mortality data for Hispanics does not include cases from Connecticut, Oklahoma, New York, and New Hampshire. Mortality data for all other races are from all U.S. States. Regression lines are calculated using the Joinpoint Regression Program. ^^^ Hispanic is not mutually exclusive from Whites, Blacks, Asian/Pacific Islanders, and American Indians/Alaskan Natives.
U.S. Mortality 1992-1999Males by Race/Ethnicity
National C
ancer Institute
'
'
' ' ' ' ''# #
# # # # # #
))
) ) ) ) ) )
,
,
, , , ,, ,
""
" " " " " "
1992 1994 1997 1999
Year of Death
0
20
40
60
80
100
120
140Rate per 100,000
Black, Hispanic ^^^) # Asian/Pacific Islander American Indian/Alaskan Native'" White
' '''
' ' ' '
##
# ## # # #)
)) ) ) ) ) )
,
,
,, , , , ,
"
"
" " " " " "
1992 1994 1997 1999
Year of Death
0
20
40
60
80
100
120
140Rate per 100,000
''
'' '
' ''#
## # # # # #) )) ) ) ) ) )
, ,, , , , , ,"
"" " " " " "
1992 1994 1997 1999
Year of Death
0
20
40
60
80
100
120
140Rate per 100,000

SEE
R C
ancer Statistics Review
1973-1999
Breast Lung Colon & Rectum
Source: NCHS public use data file. Mortality data for Hispanics does not include cases from Connecticut, Oklahoma, New York, and New Hampshire. Mortality data for all other races are from all U.S. States. Regression lines are calculated using the Joinpoint Regression Program. ^^^ Hispanic is not mutually exclusive from Whites, Blacks, Asian/Pacific Islanders, and American Indians/Alaskan Natives.
U.S. Mortality 1992-1999Females by Race/Ethnicity
National C
ancer Institute
' ''
' '
'
''
# ### #
# # #
)
)) ) ) ) ) )
,,
, , , , ,,
"
"
" " " "" "
1992 1994 1997 1999
Year of Death
0
10
20
30
40
50Rate per 100,000
Black, Hispanic ^^^) # Asian/Pacific Islander American Indian/Alaskan Native'" White
'
''
'' ' '
'
# ## #
## # #
))) ) ) ) )
)
,,
, , , ,, ,
""
" " " " " "
1992 1994 1997 1999
Year of Death
0
10
20
30
40
50Rate per 100,000
' ''
'
'' ' '#
## #
# # # #) )) ) ) ) ) )
, ,, , , , , ,
""
" " " " " "
1992 1994 1997 1999
Year of Death
0
10
20
30
40
50Rate per 100,000

SEE
R C
ancer Statistics Review
1973-1999
Liver & IBDThyroid
Melanomas of SkinTestis
Kidney & Renal PelvisBreast (Females)
EsophagusNon-Hodgkin’s Lymphomas
Corpus & Uterus, NOSHodgkin’s Disease
BladderBrain & CNS
OvaryColorectalPancreas
All SitesStomach
Lung & BronchusMultiple Myeloma
LeukemiasOral Cavity & Pharynx
LarynxCervix
Prostate
0 5 10 15 20 25 30 35 40 45 50-5-10-15-20-25-30-35-40
Percent change (%)
BURDEN RISK
U.S. Incidence estimates based on SEER age-specific rates applied to U.S. population
Incidence Percent Change, 1992 to 1999Numbers (burden) vs. Rates (risk)
All Ages
National C
ancer Institute

SEE
R C
ancer Statistics Review
1973-1999
Liver & IBDEsophagus
Non-Hodgkin’s LymphomasMultiple Myeloma
TestisPancreas
ThyroidBladder
Melanomas of SkinCorpus & Uterus, NOS
LeukemiasBrain & CNS
Kidney & Renal PelvisLung & Bronchus
All SitesOvary
ColorectalLarynx
Breast (Females)Stomach
Oral Cavity & PharynxCervix
ProstateHodgkin’s Disease
0 5 10 15 20 25 30 35 40 45 50-5-10-15-20-25
Percent change (%)
BURDEN RISK
Mortality Percent Change, 1992 to 1999Numbers (burden) vs. Rates (risk)
All Ages
National C
ancer Institute
U.S. Mortality estimates based on U.S. age-specific rates applied to U.S. population

SEE
R C
ancer Statistics Review
1973-1999
2238.0
764.9
763.0
410.7
351.0
337.7
284.7
283.1
233.2
197.4
184.3
180.8
172.7
142.0
135.6
131.8
124.3
106.0
104.8
97.9
35.1
Lung & Bronchus
Colon/Rectum
Breast
Pancreas
Leukemias
Non-Hodgkin’s
Prostate
Brain & ONS
Ovary
Liver & IBD
Stomach
Esophagus
Kidney/Renal
Multiple Myeloma
Melanomas of Skin
Urinary Bladder
Oral Cav & Pharynx
Cervix
Childhood
Corpus & Uterus, NOS
Hodgkin’s
0 500 1000 1500 2000 2500 3000
Years in Thousands
Person-Years of Life LostDue to Cancer, All Races
Both Sexes, 1999
Estimates produced using 1999 Life Tables
70.035.3
25.225.0
22.218.818.5
17.116.716.615.915.515.215.115.014.814.714.514.113.513.4
11.19.0
ChildhoodTestis
Cervix UteriHodgkin’s
Brain & ONSMelanomas of skin
BreastOvary
LeukemiasOral Cav & Pharynx
Liver & IBDKidney/Renal
EsophagusCorpus & Uterus, NOS
All CancersNon-Hodgkin’s
Lung & BronchusStomachPancreas
Multiple MyelomaColon/Rectum
Urinary BladderProstate
0 10 20 30 40 50 60 70 80
Years
Average Years of Life LostPer Person Dying of CancerAll Races, Both Sexes, 1999
National C
ancer Institute
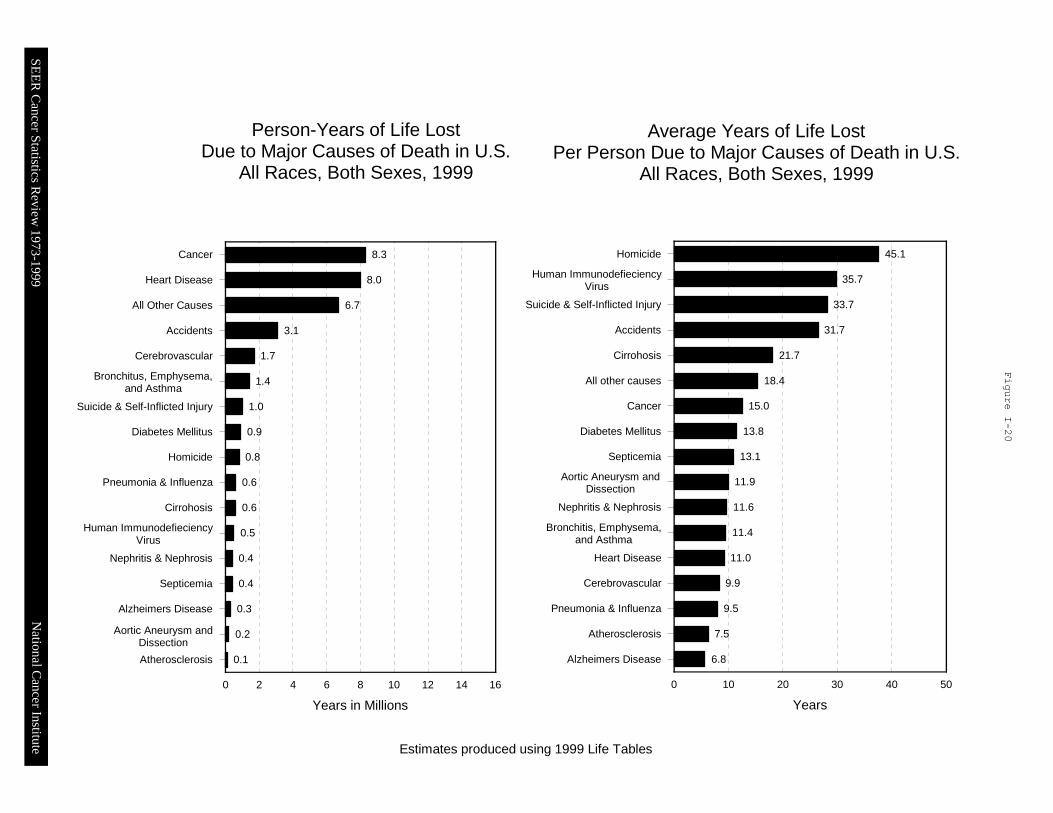
SEE
R C
ancer Statistics Review
1973-1999
8.3
8.0
6.7
3.1
1.7
1.4
1.0
0.9
0.8
0.6
0.6
0.5
0.4
0.4
0.3
0.2
0.1
Cancer
Heart Disease
All Other Causes
Accidents
Cerebrovascular
Bronchitus, Emphysema,and Asthma
Suicide & Self-Inflicted Injury
Diabetes Mellitus
Homicide
Pneumonia & Influenza
Cirrohosis
Human ImmunodefieciencyVirus
Nephritis & Nephrosis
Septicemia
Alzheimers Disease
Aortic Aneurysm andDissection
Atherosclerosis
0 2 4 6 8 10 12 14 16
Years in Millions
Person-Years of Life LostDue to Major Causes of Death in U.S.
All Races, Both Sexes, 1999
Estimates produced using 1999 Life Tables
45.1
35.7
33.7
31.7
21.7
18.4
15.0
13.8
13.1
11.9
11.6
11.4
11.0
9.9
9.5
7.5
6.8
Homicide
Human ImmunodefieciencyVirus
Suicide & Self-Inflicted Injury
Accidents
Cirrohosis
All other causes
Cancer
Diabetes Mellitus
Septicemia
Aortic Aneurysm and Dissection
Nephritis & Nephrosis
Bronchitis, Emphysema,and Asthma
Heart Disease
Cerebrovascular
Pneumonia & Influenza
Atherosclerosis
Alzheimers Disease
0 10 20 30 40 50
Years
Average Years of Life LostPer Person Due to Major Causes of Death in U.S.
All Races, Both Sexes, 1999
National C
ancer Institute