oxidants and antioxidants in - diva...
TRANSCRIPT


1
Oxidants and antioxidants in cardiovascular disease
Kim Ekblom
Department of Medical Biosciences, Clinical Chemistry Umeå University 901 85 Umeå Umeå 2010

2
Copyright© Kim Ekblom ISBN: 978-91-7264-961-3 ISSN: 0346-6612 Tryck/Printed by: Print & Media Umeå, Sweden 2010

3
För mycket är alltid för mycket. Men lagom är definitivt för lite. Karl-August Fagerholm

4
Table of Contents
Table of Contents 4 Abbreviations 6 Abstract 7 List of original papers 8 Introduction 9 Bilirubin 12
Bilirubin in plasma 12 Bilirubin metabolism 14 The UGT1A1*28 polymorphism 15 Cardiovascular disease 16 Effects of bilirubin 16 Effects of UGT1A1*28 17 Peripheral arterial disease 17 The HFE polymorphisms 19 Iron parameters in plasma 20 Cardiovascular disease 24 Iron status and myocardial infarction 24 Iron status and stroke 25 HFE polymorphisms and cardiovascular disease 26
Preanalytical factors 26 Reference intervals and standardization 29 Objectives of the study 34 Material and methods 35
Ethics 35 Study cohorts 35 Study cohort on myocardial infarction, papers 1 and 3 38 Study cohort on stroke, papers 2 and 4 39 Blood sampling 39 Biochemical analyses 39 Bilirubin 39 Markers of iron status in plasma 40 Polymorphism analyses 40 Questionnaires and dietary assessment 43 Statistics 45
Results and discussion 46 Plasma bilirubin and UGT1A1*28 in relation to cardiovascular disease (Papers 1 and 2) 47 Iron metabolism in relation to cardiovascular disease (Papers 3 and 4) 51 Conclusions 54 Implications for the future 55

5
Acknowledgements 56 References 58

6
Abbreviations
ATC Anatomical therapeutic chemical classification system BMI Body Mass Index CI Confidence Interval CT Computerised Tomography CVD Cardiovascular disease Dcytb Duodenal cytochrome b DMT1 Divalent metal transporter 1 FFQ Food frequency questionnaire HFE Abbreviation for a protein mediating iron uptake in
the intestine HLA Human leukocyte antigen HO-1 Heme oxygenase 1 HO-2 Heme oxygenase 2 HLA Human leukocyte antigen IFCC International Federation of Clinical Chemistry and
Laboratory Medicine IRE Iron responsive element IRP Iron regulatory protein ISO International Organization for Standardization IUPAC International Union of Pure and Applied Chemistry MONICA Monitoring of Trends and Determinants in
Cardiovascular Diseases NIST National Institute of Standards and Technology NORIP Nordic Reference Interval Project NPU Nomenclature of properties and units OR Odds Ratio TIBC Total Iron Binding Capacity TF % Transferrin iron saturation SD Standard Deviation SNP Single nucleotide polymorphism UGT1A1 Uridine diphosphate-glucuronosyltransferase 1A1 UGT1A1*28 Uridine diphosphate-glucuronosyltransferase 1A1
promoter mutation UIBC Unbound Iron Binding Capacity VIP Västerbotten Intervention Project

7
Abstract
Background Cardiovascular diseases, including myocardial infarction and stroke, are the main reason of death in Sweden and Western Europe. High iron stores are believed to produce oxygen radicals, which is the presumed putative mechanism behind lipid peroxidation, atherosclerosis and subsequent cardiovascular disease. Iron levels are associated with the hemochromatosis associated HFE single nucleotide polymorphisms C282Y and H63D. Bilirubin is an antioxidant present in relatively high levels in the human body. Several previous studies have found an association between high bilirubin levels and a lower risk for cardiovascular disease. Bilirubin levels are highly influenced by the common promoter polymorphism TA-insertion UGT1A1*28, the main reason for benign hyperbilirubinemia in Caucasians. There is a lack of prospective studies on both the association of iron and bilirubin levels, and the risk for myocardial infarction and ischemic stroke. Material and methods Iron, transferrin iron saturation, TIBC, ferritin and bilirubin were analyzed and HFE C282Y, HFE H63D and UGT1A1*28 were determined in myocardial infarction and stroke cases, and their double matched referents within the Northern Sweden Health and Disease Study Cohort. Results There were no associations between iron levels in the upper normal range and risk for myocardial infarction or stroke. No associations were seen for HFE-genotypes, except for a near fivefold increase in risk for myocardial infarction in HFE H63D homozygous women. Plasma bilirubin was lower in cases vs. referents both in the myocardial infarction and the stroke cohort. Despite a strong gene-dosage effect on bilirubin levels in both cases and referents, the UGT1A1*28 polymorphism did not influence the risk for myocardial infarction or stroke. Conclusion High iron stores are not associated with increased risk for neither myocardial infarction, nor stroke. There was no association between UGT1A1*28 and the risk for myocardial infarction or stroke. Consequently data suggests that other factors, which also may lower bilirubin, are responsible for the elevated risk observed in conjunction with lower bilirubin levels.
8
List of original papers
1.
Ekblom K, Marklund SL, Jansson JH, Osterman P, Hallmans G, Weinehall L; Hultdin J. Bilirubin and UGT1A1*28 are not protective factors against first-time myocardial infarction in a prospective nested case-referent setting. Accepted for publication in Circ Cardiovasc Genet. April 26, 2010.
2.
Ekblom K, Marklund SL, Johansson L, Osterman P, Hallmans G, Weinehall L, Wiklund PG, Hultdin J. Bilirubin and UGT1A1*28, are not associated with lower risk for ischemic stroke in a prospective nested case-referent setting. (Submitted)
3.
Ekblom K, Marklund SL, Jansson JH, Hallmans G, Weinehall L, Hultdin J. Iron stores and HFE genotypes are not related to increased risk of first-time myocardial infarction. A prospective nested case-referent study. Accepted for publication in Int J Cardiol. April 2, 2010, doi:10.1016/j.ijcard.2010.04.001
4. Ekblom K, Hultdin J, Stegmayr B, Johansson I, Van Guelpen B, Hallmans G, Weinehall L, Johansson L, Wiklund PG, Marklund SL. Iron stores and HFE genotypes are not related to increased risk of ischemic stroke. A prospective nested case-referent study. Cerebrovasc Dis. 2007;24(5):405-11.

9
Introduction
Cardiovascular disease (CVD) is the leading cause of death in the Western world. Huge efforts have been made to identify risk factors, and to prevent them. In Sweden and Finland large scale intervention projects have been initiated to change food habits and lifestyle in order to prevent cardiovascular disease.
In 1972 the North Karelia Project in Finland was started in order to prevent cardiovascular disease in an area with exceptionally high disease rates [1]. Focus was on changing food intake into a lower fat diet and to persuade people to stop smoking. In 1979 an effort to reduce salt intake was initiated in order to lower blood pressure [2]. Surveys were conducted every fifth year, 1972-1992. The project was a success: In 1995 the mortality rate of CVD had fallen by 75%, compared with the rate before the project start [3]. The project also changed public policies, promoting low fat, and low salt diet nationwide.
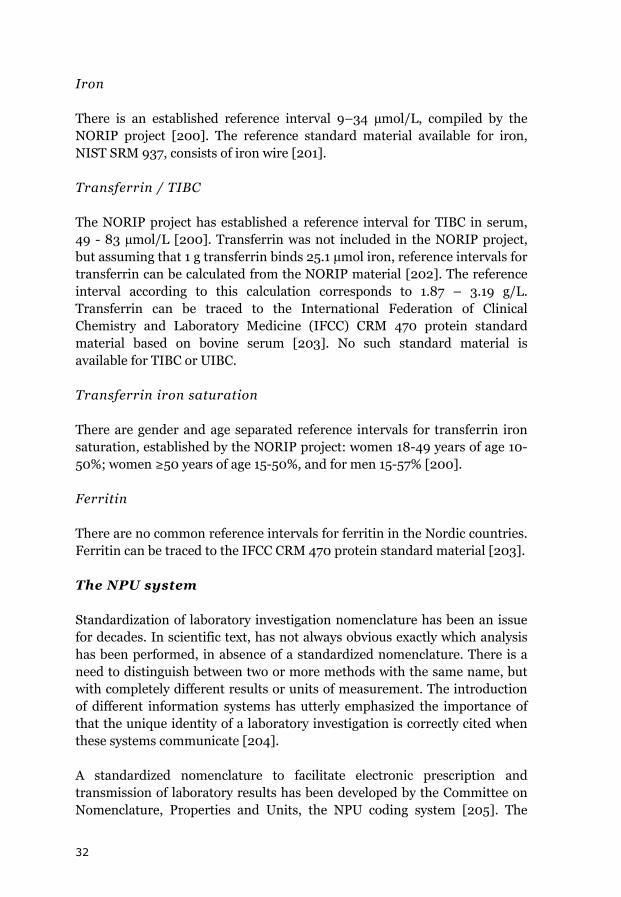
The still ongoing Västerbotten Intervention Project (VIP) was inspired by the North Karelia Project. Västerbotten County had the highest cardiovascular mortality among the Swedish counties. The VIP started with a pilot project in 1985 in the Norsjö municipality, where the cardiovascular mortality rate was exceptionally high at the time. The aims were to lower morbidity and due to cardiovascular disease and diabetes mellitus in Norsjö and the whole of Västerbotten County. This project resulted in a nationwide food labeling system introduced in 1989, to enable the population to choose products with a lower fat content [4-5]. CVD mortality has been reduced in Sweden, and Västerbotten no longer has the highest CVD mortality rates in Sweden (Figure 1).

10
Figure 1. Mortality in cardiovascular diseases per 100.000 inhabitants / year in Swedish counties 1997-2007. Data retrieved from the Swedish National Board of Health and Welfare database.
11
There is a still ongoing discussion on the role of oxidants and antioxidants and their role in cardiovascular disease. One of the antioxidants is the endogenous bilirubin, which relatively abundant, but with huge inter- and intraindiviual variability in concentrations. Many decades ago it was noted that subjects with slightly higher levels of bilirubin had lower incidence of CVD, an effect widely attributed to the antioxidant properties of the substance.
The fear of oxidants has rendered in nationwide interventions in order to diminish food iron content: Iron fortification of flour was discontinued in Denmark (1987) and in Sweden (1994) [6]. Iron deficiency is the most common nutrient deficiency both in the developed and the underdeveloped world. A higher incidence of iron deficiency was reported in Sweden after the discontinuation of iron fortification of flour [7]. One cannot rule out that the discontinuation of iron fortification of flour may have had other adverse effects on the populations. It has not been evaluated if this action has had the desired effect on the CVD mortality and morbidity.
Many risk factors for cardiovascular disease are yet to be discovered. Biobanks enabling prospective studies may be the key to reveal these still unknown risk factors.

12
Bilirubin
Bilirubin (CAS Registry Number 635-65-4) is an abundant anti-oxidant present in plasma in animals and has recently also been found in plants [8]. The substance was formerly known as hematoidin.
Bilirubin in plasma
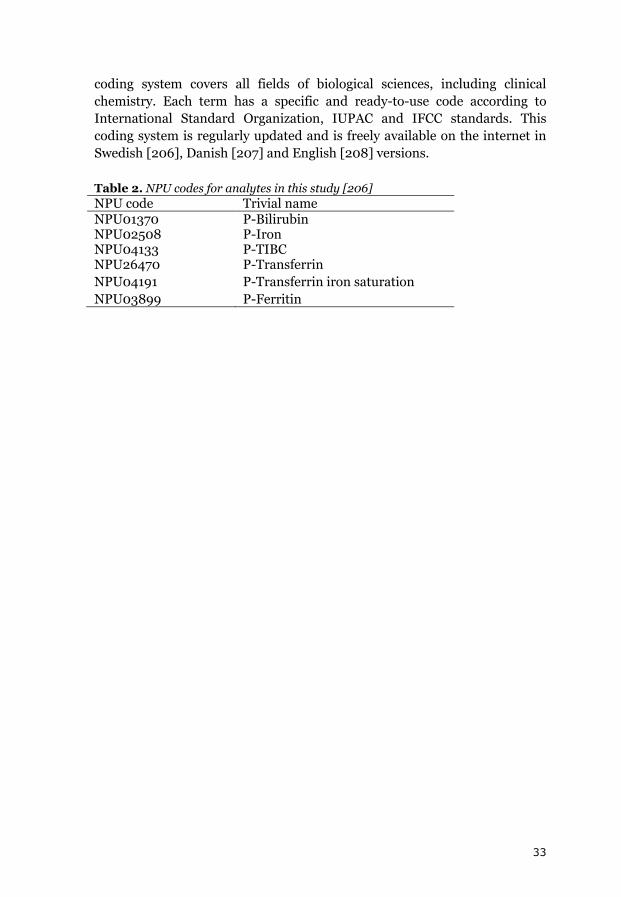
Total bilirubin is one of the most abundant analytes ordered in a clinical chemistry laboratory: In the clinical chemistry laboratory at Umeå University Hospital 45578 analyses of total bilirubin were performed in 2008 (Figure 2). In addition to total bilirubin, direct (unconjugated) bilirubin can be determined. For neonatal use, an assay optimized for higher levels, is used in many hospitals. Most of the bilirubin in plasma is bound to albumin. A lesser proportion remains unbound, so called “free bilirubin”. The unbound bilirubin is believed to be the neurotoxic bilirubin fraction in newborns, and it has been suggested that measurement of this unbound fraction would be more accurate than total bilirubin [9-10].
Figure 2. Number of total bilirubin analyzes ordered at the Clinical Chemistry department of Umeå University Hospital 1999-2008

13
Neonatal hyperbilirubinemia
Neonatal hyperbilirubinemia is a result of a combination of increased bilirubin production, decreased hepatic handling, and low or absent intestinal deconjugation. The enzyme responsible for conjugating, and thus enhancing elimination of bilirubin, is Uridine diphosphate-glucuronosyltransferase 1A1. Common polymorphisms in the UGT1A1 gene, like UGT1A1*28 in Caucasians and G71R in Asians can contribute to the risk [11-12].
Hyperbilirubinemia occurs in more than 60% of healthy newborns during their first week of life, with a peak total bilirubin concentration at 72-120 hours after birth. Usually the hyperbilirubinemia is benign and resolves in 7-10 days. However in 8-9% of the infants severe hyperbilirubinemia, defined as total bilirubin levels above the 95th percentile for age in hours, occurs [13]. The incidence is highly variable, with marked ethnic and geographical differences [14]. Untreated, severe neonatal hyperbilirubinemia can cause neurological damage. The term kernicterus is used by pathologists to describe yellow deposits and brain cell death, but the term is often used interchangeably to describe bilirubin encephalopathy, including extrapyramidal disturbances, hearing loss, delay in motor development and intellectual deficits [15]. Phototherapy is an effective treatment which changes the structure of bilirubin, enabling its excretion even with deficient conjugation [16].
An inherited disease, the Crigler-Najjar syndrome is characterized by pathologically elevated levels of unconjugated bilirubin since birth [17]. The Crigler-Najjar syndrome is divided in to two sub-groups: type 1 which does not respond to phenobarbital therapy and in type 2 in which bilirubin levels can be lowered by phenobarbital treatment [18]. In CNS type 1 very high levels, 425-600 µmol/L are common which leads to a high risk of developing kernicterus [19]. Intensive phototherapy is usually applied on these subjects. In Crigler-Najjar syndrome type 2, total bilirubin levels are usually below 350 µmol/L.
Adult hyperbilirubinemia
Elevated total bilirubin levels have been found in 6-7% of the population [20]. Total bilirubin serves as a marker of disorders in the liver, the bile, and in hemolytic anemia. A common reason for slightly elevated bilirubin is Gilbert’s syndrome, also known as morbus Meulengracht in German literature. The syndrome is characterized by slightly elevated bilirubin, 25-50 µmol/L, and intermittent jaundice episodes, especially when the

14
individual is fasting. A low caloric diet test was earlier used to diagnose Gilbert’s syndrome [21-22]. The most common reason in Caucasians for Gilbert’s syndrome is homozygosity for a TA-insertion in the diphosphate-glucuronosyltransferase 1A1 promoter sequence (UGT1A1*28) [23]. In Asian populations, the main reason for Gilbert’s syndrome is a common heterozygous polymorphism in the coding exon 1 of the UGT1A1 gene, G71R [24]. This polymorphism is uncommon, but not totally absent, in Caucasian populations [25].
Bilirubin metabolism
Production
Bilirubin is produced by heme degradation, the heme mainly emanates from degradation of hemoglobin in red blood cells. The limiting step is the cleavage of the heme ring by heme oxygenase, which exists in two isoforms: the inducible heme oxygenase 1 (HO-1) and the constitutive heme oxygenase 2 (HO-2). This reaction yields biliverdin. The central methene bridge of biliverdin is reduced by biliverdin reductase, producing bilirubin.
Figure 3. The chemical structure of a bilirubin molecule.

15
Degradation
Oxidation of bilirubin primarily produces biliverdin, which is rapidly reduced back to bilirubin. Irreversible oxidation to compounds such as biopyrrins also occurs [26-27]. These compounds are rapidly excreted in the urine [28].
Elimination and re-absorbtion
Bilirubin is a very lipophilic substance. The substance is glucuronidated by the enzyme uridine diphosphate-glucuronosyltransferase 1A1 (UGT1A1) in order to convert it to a more hydrophilic state. Glucuronidated bilirubin is excreted in bile.
Experiments on rats in 1960 concluded that the in intestinal flora is an important factor, which influences the balance between bilirubin deconjugation and re-absorption and reduction to urobilinogen species and elimination through the stools [29]. Further studies have concluded that the intestinal flora is of similar importance for bilirubin deconjugation in humans [30-31]. A recent study on mice concluded that the intestinal flora can be altered by variations in nutritional value of food. [32]
The lack of bacteria, and consequently low or absent bilirubin conjugation in the intestine of newborns, is believed to play a part in the development of neonatal hyperbilirubinemia [33]. Certain bacteria, like Clostridium perfringens, are known for their ability to deconjugate bilirubin [34]. The intestinal flora can vary considerably between individuals. This fact has been suggested to influence human health [35]. However, little is known about the role in vivo of different bacterial species with respect to bilirubin deconjugation in adults.
The UGT1A1*28 polymorphism
The enzyme responsible for glucuronidating bilirubin with two glucuronic units belongs to the UDP-glycosyltransferase 1 family, polypeptide A1, UGT1A1 (EC 2.4.1.17). The conjugated bilirubin, bilirubin diglucuronide, is more hydrophilic and can be excreted with the bile [36]. UGT1A1 is highly inducible: Genetical, lifestyle or environmental factors in may induce higher rates of bilirubin conjugation [37-39]. Animal models have shown that sex hormones can regulate expression of UGT enzyme isoforms, including UGT1A1, at a pre-translational level [39]. There is evidence that UGT1A1 is induced by flavonoids and xenobiotics [38].
16
The UGT1A1 gene is located on chromosome 2q37 [40], coordinates according to HapMap Data Rel 27 PhaseII+III, Feb09, on NCBI B36 assembly, dbSNP b126: chr2: 234333620 – 234333633 for the promoter TA-repeat sequence [41]. Bilirubin levels are affected by a common polymorphism in the promoter region of the UGT1A1 gene, an insertion of a TA sequence resulting in seven TA sequences (UGT1A1*28), instead of the normal six. Homozygotes for (TA)7 produce 70% less enzyme, resulting in higher than average bilirubin levels. This polymorphism is responsible for most of the cases of Gilbert’s syndrome in European, African and South Asian populations. This has also been supported by a genome-wide association study where UGT1A1*28 was the strongest genetic determinant of bilirubin levels, accounting for approximately 18.6% of the variation [42].
Cardiovascular disease
Effects of bilirubin
An abundance of cross-sectional and retrospective [43-57], and prospective [58-60] studies, including meta-analysis of such studies [61], have reported an inverse relationship between bilirubin and cardiovascular disease. The case ascertainment in most of these studies have been questionable, as cardiovascular disease (CVD) has included myocardial infarction cases, ischemic and hemorrhagic stroke cases as well as cases with angina pectoris. Few studies have addressed the issue on the relationship between plasma bilirubin levels and the risk for myocardial infarction.
Very few studies have investigated the association between total bilirubin levels and stroke, most of them retrospective. In a Japanese study involving 1741 subjects, those with carotid plaques (n=330) were found to have lover levels of bilirubin. [50]. A similar, but smaller Czhech study conducted on 111 men without known atherosclerotic disease, showed an inverse relationship between bilirubin and carotid intima-media thickening [53]. The cross sectional American NHANES study (n=13214) with a history of stroke recorded in 453 subjects, found that 1.71 µmol/L increment of bilirubin was associated with 9% reduced odds ratio of incidence of stroke and with 10% reduced odds ratio for adverse stroke outcome [57]. A large prospective Korean study with 1964 stroke cases found an inverse association between bilirubin levels and risk for stroke in men [62].
17
Effects of UGT1A1*28
Two retrospective studies, a French multicenter study [63] and an American study of subjets with European ancestry [64] have failed to find a risk association. An American study with a prospective design found a strong association between (TA)7 genotype and lower risk for cardiovascular disease [65]. Cardiovascular disease in this study was defined as fatal or nonfatal myocardial infarction, angina pectoris, coronary insufficiency, stroke, transientischemic attack, intermittent claudication, or congestive heart failure. A Dutch prospective study found no evidence for an association with risk for coronary heart disease [66].
Peripheral arterial disease
The American cross-sectional NHANES study [67] found a negative association between risk for peripheral arterial disease and bilirubin levels. The Austrian CAVASIC study [68] with a prospective case- control design also found a negative risk association between bilirubin levels and the risk for intermittent claudication, but no such risk association was found for UGT1A1*28.
18
Iron metabolism
The total amount of iron in the human body of an adult male is 3-4 g, but can be elevated 5-10 times in hemochromatosis [69]. Under normal circumstances, about 70% of the iron is utilized for heme synthesis in the erythron, 7% is utilized in the muscle myoglobin and the rest is stored in the liver parenchyma [70].
Too much iron may cause cellular damage due to oxygen radicals formed by the Haber-Weiss-Fenton reaction [71]. Individuals with excess iron may have a higher risk and for some bacterial infections: Yersinia enterocolitica infections can be more fulminant, and when consuming oysters, a higher risk for Vibrio vulnificus infections is present in these individuals [72].
Iron in food is considered to be either in the heme or non-heme form and both forms can be utilized by the intestinal epithelium. Bioavailability for heme iron is about 35% while it is only 5% for non-heme iron [73]. However, the mechanism of heme iron absorption is still not fully understood. Most of the non-heme iron in food is in the Fe3+ form and before absorption can take place the iron must be reduced to Fe2+. The reduction is probably catalyzed by the brush border reductase duodenal cytochrome b (Dcytb), but other enzymes may also be involved [74]. Absorption is subsequently mediated through the divalent metal transporter 1 (DMT1). When iron is needed in the body, the enterocyte brush border expresses high levels of both DMT1 and Dcytb and the enterocyte also expresses high levels of ferroportin and hephaestin [75]. When the demand for iron is reduced, hepcidin originating from the liver, binds to ferroportin on the basolateral membrane of the enterocyte. This causes internalization of iron and degradation of the enterocyte, limiting the amount of iron transport to the plasma. Subsequently the iron rich enterocyte is sequestrated into the intestinal lumen.
Immature erythroid cells have the highest iron demand of all cells in the body [76]. These cells take up iron almost exclusively from transferrin via the transferrin receptor 1. The daily need of iron for erythropoiesis is about 20 mg [69].
Macrophages play an important role in recycling iron in the body [77]. Macrophages phagocytose senescent erythrocytes and break them down. The heme released thereby is a substrate for HO-1 and HO-2 which cleave the proto-porphyrine ring. Iron, carbon monoxide and biliverdin are released in this process. Iron is exported from the cell through ferroportin, a protein
19
produced mainly in macrophages. Macrophages also have the ability to take up transferrin bound iron. When iron is not needed for processes in the body, it can be stored in macrophages as ferritin. Under pathological conditions, macrophages scavenge hemoglobin/haptoglobin and heme/hemopexin complexes.
The hepatocytes in the liver play an important role in iron homeostasis. It serves as the main storage organ for iron, it regulates the iron homeostasis hormonally through hepcidin and synthesizes proteins needed for iron metabolism, like transferrin and ceruloplasmin [78].
The HFE polymorphisms
Feder et al. described in 1996 the two hemochromatosis related missense mutations in the HLA-H gene located on chromosome 6, band 21.3 near the human leukocyte antigen (HLA) region [79]. The gene was later named HFE. It remains unclear exactly what the abbreviation HFE stands for. A theory is that it could either stand for high iron i.e. “High Fe”, “High Ferritin” or “Hemochromatosis Feder” to honor the discoverer of the association between the gene and hereditary hemochromatosis.
The C282Y polymorphism is believed to have occurred around 4000 BC on the European mainland [80]. It has been hypothesized that this mutation evolved as a part of adaptation to an iron deficient grain diet during the Neolithic era [81]. The mutation HFE C282Y probably originates back to an individual in Western Europe, carrying the human leukocyte antigen (HLA)-A3-B7 [80, 82]. The C282Y polymorphism is mainly found in European populations, while some Asian populations are totally devoid of this mutation [83].
This missense mutation alters a disulfide bridge in the HFE protein [84]. This impairs the production of hepcidin, thus increasing ferroportin levels causing macrophages and enterocytes to release more iron, resulting in higher iron saturation and deposition of iron into other tissues [85]. Homozygosity C282Y is the most common reason for hereditary hemochromatosis in Caucasian populations [83].
Homozygosity for the SNP C282Y or compound heterozygosity for C282Y and H63D is the main reason for hereditary hemochromatosis in Caucasians, although compound heterozygotes have lower hemochromatosis related morbidity [86]. The HFE protein is expressed in the whole gastrointestinal canal, but the distribution pattern is different in the small intestine [84].
20
The geographical distribution of H63D is more widespread than that of C282Y and can also be found in the Middle East, Asia and North Africa [83]. Unlike for C282Y, there is a large haplotype diversity in H63D positive subjects, suggesting that this mutation is of older date than C282Y [87]. In Australian native population the H63D mutation is scarce and associated with HLA haplotypes found in Caucasians, suggesting that the mutation has been introduced recently in the population [88].
The H63D mutation is associated with hemochromatosis in a much lesser degree than C282Y: In a Danish study [89], 94% of the C282Y homozygotes had elevated ferritin ≥300 μg/L and 88% had elevation of both ferritin and transferring iron saturation. In 23% of the C282Y/H63D compound heterozygotes transferrin saturation was elevated, 27% had elevated ferritin, and 9% had elevation of both ferritin and transferrin iron saturation. Among H63D/H63D 15% had elevated transferrin saturation, 19% had elevated ferritin, and 5.4% had elevation of both iron status markers.
Iron parameters in plasma
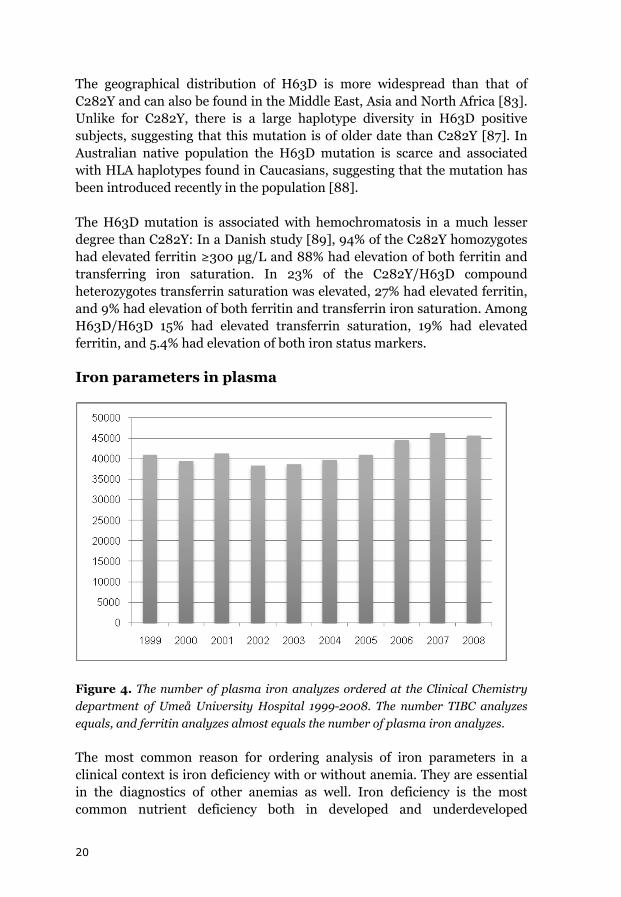
Figure 4. The number of plasma iron analyzes ordered at the Clinical Chemistry department of Umeå University Hospital 1999-2008. The number TIBC analyzes equals, and ferritin analyzes almost equals the number of plasma iron analyzes.
The most common reason for ordering analysis of iron parameters in a clinical context is iron deficiency with or without anemia. They are essential in the diagnostics of other anemias as well. Iron deficiency is the most common nutrient deficiency both in developed and underdeveloped
21
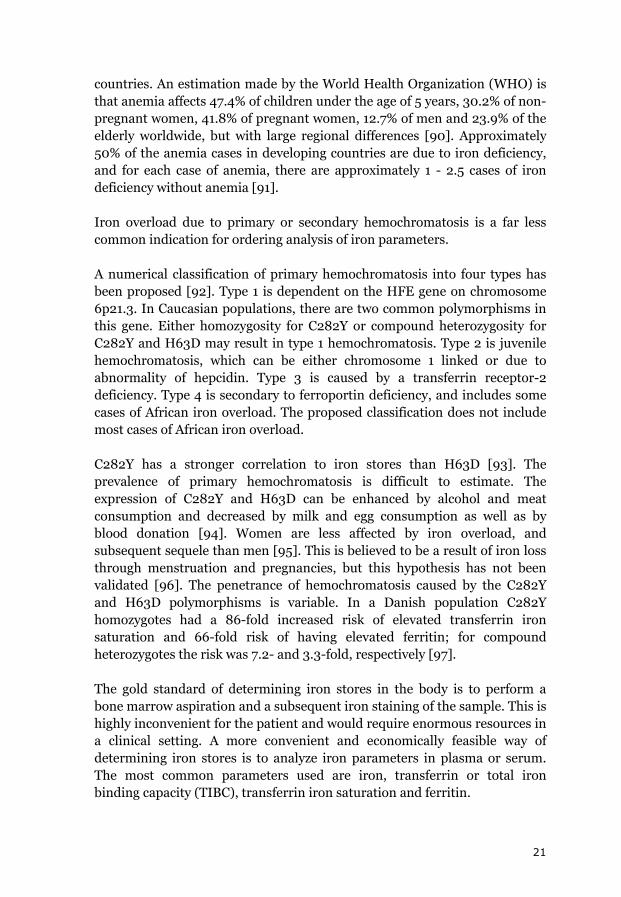
countries. An estimation made by the World Health Organization (WHO) is that anemia affects 47.4% of children under the age of 5 years, 30.2% of non-pregnant women, 41.8% of pregnant women, 12.7% of men and 23.9% of the elderly worldwide, but with large regional differences [90]. Approximately 50% of the anemia cases in developing countries are due to iron deficiency, and for each case of anemia, there are approximately 1 - 2.5 cases of iron deficiency without anemia [91].
Iron overload due to primary or secondary hemochromatosis is a far less common indication for ordering analysis of iron parameters.
A numerical classification of primary hemochromatosis into four types has been proposed [92]. Type 1 is dependent on the HFE gene on chromosome 6p21.3. In Caucasian populations, there are two common polymorphisms in this gene. Either homozygosity for C282Y or compound heterozygosity for C282Y and H63D may result in type 1 hemochromatosis. Type 2 is juvenile hemochromatosis, which can be either chromosome 1 linked or due to abnormality of hepcidin. Type 3 is caused by a transferrin receptor-2 deficiency. Type 4 is secondary to ferroportin deficiency, and includes some cases of African iron overload. The proposed classification does not include most cases of African iron overload.
C282Y has a stronger correlation to iron stores than H63D [93]. The prevalence of primary hemochromatosis is difficult to estimate. The expression of C282Y and H63D can be enhanced by alcohol and meat consumption and decreased by milk and egg consumption as well as by blood donation [94]. Women are less affected by iron overload, and subsequent sequele than men [95]. This is believed to be a result of iron loss through menstruation and pregnancies, but this hypothesis has not been validated [96]. The penetrance of hemochromatosis caused by the C282Y and H63D polymorphisms is variable. In a Danish population C282Y homozygotes had a 86-fold increased risk of elevated transferrin iron saturation and 66-fold risk of having elevated ferritin; for compound heterozygotes the risk was 7.2- and 3.3-fold, respectively [97].
The gold standard of determining iron stores in the body is to perform a bone marrow aspiration and a subsequent iron staining of the sample. This is highly inconvenient for the patient and would require enormous resources in a clinical setting. A more convenient and economically feasible way of determining iron stores is to analyze iron parameters in plasma or serum. The most common parameters used are iron, transferrin or total iron binding capacity (TIBC), transferrin iron saturation and ferritin.

22
Iron
Most of the iron in plasma is bound to transferrin. A lesser proportion is bound to other plasma proteins, mainly albumin. A low serum iron is often associated with iron deficiency. However, many pre-analytical factors influence iron levels in plasma.
Transferrin / TIBC
Transferrin is a glycoprotein which contains 679 amino acids and has a molecular weight of approximately 79 kD [98]. It is mainly synthesized by hepatocytes. Iron is reversely bound to the transferrin molecule. The release of iron is dependent on multiple factors including pH, temperature and receptor binding [99]. Iron is bound in to ferritin in the ferric form (Fe3+). Iron from transferrin is transported into cells via ferroportin. Ferroportin transports the iron in the ferric (Fe2+) form which means that oxidation of iron is required. Ceruloplasmin is the ferrooxidase that is responsible for most of this oxidation. In plasma, iron is to a large extent bound to transferrin. The fraction of transferrin which is not bound to iron is called “unbound iron-binding capacity” (UIBC). S-UIBC + S-Iron = S-TIBC.
High transferrin levels or high TIBC can be used as an indicator of iron deficiency. Transferrin and TIBC are considered equivalent in most clinical settings. However there are some differences: In non-European populations with a marked genetic variation in transferrin, immunochemical determination of transferrin leads to errors. In these cases TIBC is a better choice [100-101].
Transferrin iron saturation
Plasma transferrin iron saturation is calculated from other analytes: S-Transferrin iron saturation (%) = S-Iron / (S-Iron + S-UIBC) × 100 or S-Transferrin iron saturation (%) = S-iron × 100 / S-Transferrin × 25.1.
Transferrin iron saturation is the percentage of transferrin that transports iron. Low levels are associated with iron deficiency. The use of transferrin iron saturation as a marker of iron deficiency is limited, because of the high intra-individual variability of serum iron included in the calculation of this parameter [102].
Transferrin iron saturation is commonly used as a biochemical first-line screening marker for hereditary hemochromatosis before genetic testing.

23
Treshold limits for phenotypic hemochromatosis have varied between 45 and 62% [103]. A lower limit i.e. 45% may reveal non-expressing C282Y homozygotes, which have a prevalence of 1 in 300 among these homozygotes [104]. Lower limits for women (50%), compared to men (60%) have occasionally been applied [105].
Ferritin
Ferritin is a mainly intracellular iron storage protein consisting of two subunits, termed L and H [106]. The ferritin molecule has a iron core of up to 4500 Fe(III) atom as an inorganic complex [107]. The ratio between H and L subunits vary depending on tissue type, with a dominance of H in the heart and kidney and L in the liver and spleen [108]. The H unit catalyzes the oxidation of Fe(II) to Fe (III), and L units are necessary for storage of iron in the core [109]. Proportions between H and L subunits can be altered by inflammatory and infectious conditions, in response to xenobiotic stress, differentiation, developmental transitions a well as by other stimuli [106]. Only trace levels of the H subunit can be found in normal plasma [110]. When a cell becomes highly iron loaded hemosiderin, derived from degradation of ferritin aggregates, can appear [111]. Hemosiderin, like ferritin, can be mobilized from the cells if the demand for iron increases [75].
Small amounts of ferritin can be found in plasma, and is clinically used as a marker for iron status. The exact source of plasma ferritin is still to be determined [112]. Low ferritin levels are indicative of iron deficiency; a ferritin value <15 µg/L indicates absent iron stores [113]. Using a cut-off for ferritin of 30µg/L had a positive predictive value of 92% and a negative predictive value of 98% for iron deficiency anemia [114]. Only two conditions other than iron deficiency lower ferritin levels, i.e. hypothyroidism and ascorbate deficiency [115]. High ferritin values are found in iron overload conditions like hereditary hemochromatosis and hemosiderosis due to excessive transfusions. Other conditions include anemia for other reasons than iron deficiency [113], malignancies [116-119], hyperthyroidism [120], liver damage [121], alcohol abuse [122], insulin resistance [123], and inflammatory conditions [124-125]. A less common reason is the hereditary hyperferritinemia cataract syndrome caused by a ferritin mutation and characterized by iron overload and cataracts [126].

24
Cardiovascular disease
Iron overload is believed to produce oxygen radicals via the Fenton-Haber-Weiss cycle. The cycle begins with the Fenton reaction:
Fe2+ + H2O2 → Fe3+ + HO– + HO•
which is followed by the chain indicated by Haber, Wilstätter and Weiss
HO• + H2O2 → H2O + O2•– + H+
O2•– + H+ + H2O2 → O2 + HO• + H2O
This event chain has been described in detail previously [71].
In 1981 Sullivan et al. hypothesized that that lower iron stores protect premenopausal women from atherosclerosis [127]. Iron ions and oxygen radicals, produced by Fenton-Haber-Weiss chemistry can initiate lipid peroxidation [128] which is believed to be the major factor behind atherosclerosis and subsequent cardiovascular disease [129]. This is known as the “iron hypothesis”.
Iron status and myocardial infarction
A great number of studies have tested the iron hypothesis, but the results have been contradictive. A lesser proportion of these have a prospective design.
A Finnish nested case control study on 215 cases of myocardial infarction or coronary death, and 215 control subjects, low serum iron was associated with higher risk for myocardial infarction [130]. A Finnish 10-year-follow-up-study on 361 men and 394 women and 130 accumulated cases of myocardial infarction came to the same conclusion [131]. The highest serum iron quartile was associated with a higher risk for fatal myocardial infarction in a study on 140 cases of fatal myocardial infarctions in Canada [132].
Transferrin iron saturation and the risk for myocardial infarction has been has been evaluated in three studies; in an American study on subjects on the prepaid Kaiser-Permanente health plan (cases n=1840) [133], and in two studies on the American NHANES project [134-135]. No risk association
25
between risk for myocardial infarction and transferrin iron saturation was found.
For total iron binding capacity (TIBC) and the equivalent transferrin, a positive risk association was found in a Finnish study already mentioned above [131]. An inverse risk association was found in an Icelandic cohort study with 81 cases [136] and no risk association was found in the NHANES project [134].
Only one study, including 51 Finnish male myocardial infarction cases, found a risk association between ferritin and myocardial infarction [137]. In an American study with 32 myocardial infarction cases [138], another American follow up study with 235 cases ≥ 62 years of age [139], and a Finnish coronary prevention trial in dyslipidemic men comprising 84 cases of myocardial infarction or cardiac death [140] no risk association between ferritin and myocardial infarction was found.
A low ratio between soluble transferrin receptor and ferritin, indicating large iron stores, has been reported to increase the risk for myocardial infarction in a Finnish study with 99 cases. [141]. This ratio was used to eliminate the effect of ferritin as an acute phase protein.
Another approach to test the iron hypothesis is by testing blood donors. These subjects lose 200 to 250 mg iron per each donated unit [142]. Three prospective studies ended up with divergent conclusions: A Finnish study on middle aged men found a protective effect for myocardial infarction [143], an American study on both men and women found the protective effect against cardiovascular events limited to non-smoking men [144], and an American study on men found no association between risk for coronary heart disease and the frequency of blood donation [145]. Last, an American retrospective study found frequent long-term blood donation to be associated with lower risk for cardiovascular disease [146]. There is still a controversy about the possible benefit of blood donation on the risk for myocardial infarction.
Iron status and stroke
There are very few prospective studies that have assessed iron status parameters and the risk for stroke. In a Dutch study, an increased risk of ischemic stroke for the highest versus lowest tertile of ferritin in postmenopausal women was seen [147]. In a Finnish study on elderly subjects, a reduced risk of stroke was found for the middle tertile of serum iron concentrations [131]. An Italian study reported that ferritin was the

26
greatest risk factor for progression of carotid atherosclerosis, although no direct association with stroke was observed [148].
HFE polymorphisms and cardiovascular disease
Prospective studies on the risk of HFE-genotypes and the risk of myocardial infarction are scarce. A Danish group performed a prospective study in addition to a case-control study, and found no risk association between HFE genotypes and ischemic heart disease in neither of the studies [149]. A Dutch study found an association between C282Y heterozogosity and cardiovascular death [150].
Three studies have studied the relationship between HFE genotypes and the risk of stroke [150-152]. In the two previous prospective studies, one found a strong association between heterozygosity for C282Y and cerebrovascular death in women [150], while the other found no association between C282Y and H63D genotypes and the risk of stroke [151]. There is no previous study in which iron stores, HFE genotypes, and the risk of stroke have been studied in combination.
Preanalytical factors
Bilirubin
There are several preanalytical factors which can produce erroneous analysis results: Transport [153] and storage [154] of samples before analysis reduce bilirubin in the sample. Storage of frozen samples may decrease total bilirubin to some extent [155]. Delayed separation of plasma from cells in samples for three days significantly reduced bilirubin values [156]. A common error source is light exposure, as bilirubin degrades fast when exposed to light [157]. Hemolysis in samples is another common error source reducing bilirubin level in samples.
Bilirubin has a statistically significant circannual rhythm with the highest levels in spring and summer among male subjects. In women no changes are seen throughout the seasons [158-159]. As previously described in relation to Gilbert´s syndrome, fasting is known to elevate bilirubin levels [160].
There is an abundance of pharmacologically used substances that elevate and diminish bilirubin levels [161], many of them include inducers and inhibitors of UGT1A1 [162]. Oral contraceptives users have lower bilirubin levels [163]. Inducers, lowering bilirubin, include Phenobarbital and some

27
statins. Inhibitors, elevating bilirubin, include paracetamol, benzodiazepines and diclofenac.
Iron
Plasma iron has a seasonal variation; in a study on about 500 women followed for four years iron levels were highest in the winter and lowest in the summer [164]. Non-fasting samples can have twice the iron concentration compared with fasting samples [165]. The levels also vary over the day with the highest values early in the morning and the lowest values in afternoon [166-167]. However, the intra-individual variation is huge, and exceeds the diurnal variation to such extent that the time period of sampling is of limited importance [33]. Training decreases iron levels [168] due to increased demand of iron and concomitant increased losses and not uncommonly inadequate intake in relation to energy expenditure. Other explanations for iron depletion in athletes include mainly gastrointestinal blood loss, increased loss of iron in sweat and urine is negligible [169]. Exercise has also been shown to temporarily elevate plasma iron [170], probably due to dehydration. Ingestion of alcohol increases iron levels in men, but not in women [171].
Storage of whole blood for prolonged time without separation of serum or plasma renders falsely elevated iron levels [172].
Transferrin/TIBC
Transferrin levels are higher in women than in men [173]. Concentration decrease by age [173]. Transferrin has a large diurnal variation, ranging from 17 to 70% [174]. Levels are lowest in the morning and highest in the afternoon [166]. High estrogen or progesterone levels i.e. during pregnancy [175] and use of oral contraceptives [174] have been reported to elevate transferrin. Pregnancy can increase transferrin levels by up to 40% and oral contraceptive by up to 15% [176]. Exercise has also been reported to elevate transferrin [177]. Inflammation [178] and a low calorie intake [179] decrease transferrin. Premature children also have decreased levels [180].
Transferrin samples are rather stable, but exposing samples to excessive heat (56°C) lowers the concentration [181]. Alcoholism [182] and malnutrition [183] lowers TIBC as does being in the luteal phase of the menstrual cycle [184].
28
Transferrin iron saturation
As transferrin iron saturation is calculated from plasma iron and TIBC or transferrin, factors influencing these parameters will also affect transferrin iron saturation.
Ferritin
Men have higher ferritin levels than women [185-186]. Ferritin levels vary with age, both elevation [171] and decrease [187] have been reported with higher ages. In women levels fluctuate over the menstrual cycle with the highest levels during the luteal phase [184]. In the third trimester of pregnancy, levels are significantly decreased compared with the first trimester [188]. Postmenopausal women have higher levels than younger women [189]. Alcohol intake [171, 190], alcoholism [182] and smoking [191] significantly elevate ferritin levels. Space travels elevate ferritin levels; a significant increase was observed after eight days in the Spacelab 1 mission [192].
Ferritin is a fairly stable protein. Storage of samples in 32°C for 24 hours before separation from blood cells resulted in elevated ferritin levels, storage in 11°C did not affect the serum ferritin levels [193].

29
Reference intervals and standardization
Reference intervals for laboratory investigations can differ markedly between laboratories due to different methods, calibrations, or even if different units are used for the same method [194]. Previously, reference intervals were often established locally. As establishing valid reference intervals takes a great effort, the level of the reference intervals were often only re-calculated when a new method was introduced. Sometimes differences in reference intervals result in severe difficulties for the clinician to interpret results from patient samples analyzed in another hospital laboratory, with a risk for wrong conclusions. This is still the case for many unstandardized methods.
The Nordic Reference Interval Project (NORIP) was launched in an attempt to establish common reference values for 25 of the most common quantities used in clinical chemistry, including total bilirubin. In 102 laboratories, a total number of 3002 reference individuals, 18-91 years of age, were recruited [195].
Bilirubin
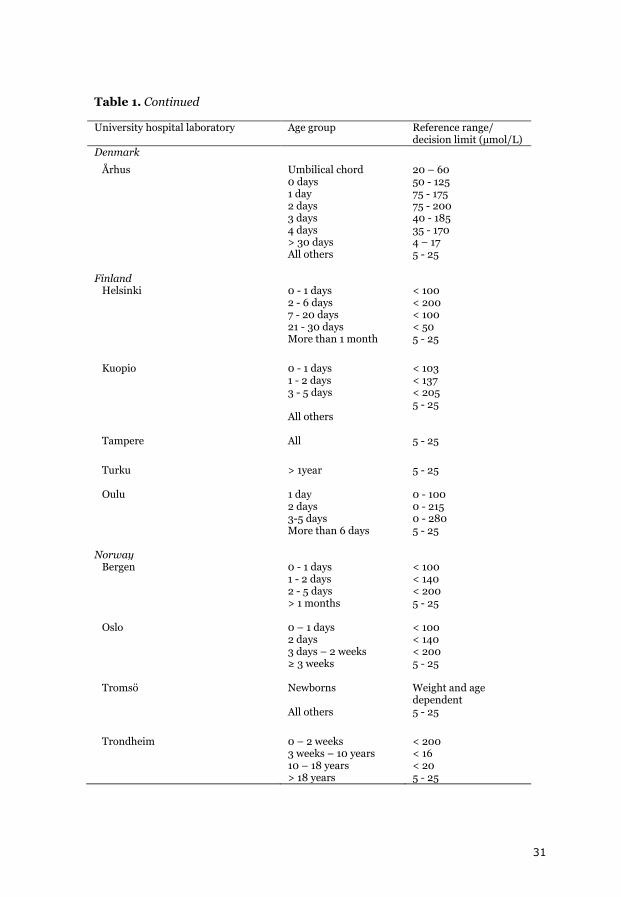
A reference interval for total bilirubin, 5 – 25 µmol/L, was established for the Nordic populations through the NORIP project [196]. While most of the clinical chemistry laboratories in the Nordic countries seem to have adopted the NORIP reference intervals for adults, there seems to be no consensus yet for individuals under 18 years of age. Various decision limits and reference intervals are used throughout the clinical chemistry laboratories in the Nordic countries (Table 1).
In 1962 a joint committee of scientist defined the principles of determination of a bilirubin standard by means of molar absorptivity, recommending that bilirubin should have a molar absorptivity between 59100 and 62300 L × mol-1 × cm-1 at 453 nm in chloroform at 25°C for clinical use [197]. In 1971 the National Bureau of Standards, now National Institute of Standards and Technology (NIST), issued the first bilirubin Standard Reference Material (SRM) 916 containing bilirubin with a purity of 99.0%. In 1989, a new standard reference material was issued: SRM 916a [198]. Total bilirubin analytic methods are standardized against this NIST standard on the candidate reference method, the Doumas method [199].

30
Table 1. Reference ranges/ decision limits for total bilirubin at university hospital laboratories in Sweden, Denmark, Finland, and Norway. University hospital laboratory Age group Reference range/
decision limit (µmol/L) Sweden Gothenburg < 30 days
> 17 years Age dependent 5 - 25
Linköping < 30 days > 30 days
Determined by the treating physician < 26
Lund < 2 days 2 – 3 days 3 – 6 days > 6 days
< 140 < 210 < 280 < 20
Malmö < 2 days 2 – 3 days 3 – 6 days > 6 days – 18 years > 18years
< 140 < 210 < 280 < 20 < 26
Stockholm < 2 days 2 – 6 days 7 – 20 days 21 - 29 days 1 month -17 years ≥ 17 years
< 100 < 200 < 100 < 50 < 22 < 26
Umeå Newborns All others
Dependent on age and weight 5 - 25
Uppsala 1 – 2 weeks 3 – 4 weeks 1 month – 15 years Adults
< 100 < 50 < 26 5 - 25
Örebro Newborns All others
Dependent on age and weight < 25
Denmark Copenhagen 0 - 1 days
1 - 2 days 2 - 3 days 3 - 4 days 4 - 5 days 1 month – 14 years > 14 years
50 - 125 75 - 175 75 - 200 40 - 185 35 - 170 4 - 17 4 - 22
31
Table 1. Continued
University hospital laboratory Age group Reference range/ decision limit (µmol/L)
Denmark
Århus Umbilical chord 0 days 1 day 2 days 3 days 4 days > 30 days All others
20 – 60 50 - 125 75 - 175 75 - 200 40 - 185 35 - 170 4 – 17 5 - 25
Finland Helsinki 0 - 1 days
2 - 6 days 7 - 20 days 21 - 30 days More than 1 month
< 100 < 200 < 100 < 50 5 - 25
Kuopio 0 - 1 days 1 - 2 days 3 - 5 days All others
< 103 < 137 < 205 5 - 25
Tampere All
5 - 25
Turku > 1year
5 - 25
Oulu 1 day 2 days 3-5 days More than 6 days
0 - 100 0 - 215 0 - 280 5 - 25
Norway Bergen 0 - 1 days
1 - 2 days 2 - 5 days > 1 months
< 100 < 140 < 200 5 - 25
Oslo 0 – 1 days 2 days 3 days – 2 weeks ≥ 3 weeks
< 100 < 140 < 200 5 - 25
Tromsö Newborns All others
Weight and age dependent 5 - 25
Trondheim 0 – 2 weeks 3 weeks – 10 years 10 – 18 years > 18 years
< 200 < 16 < 20 5 - 25
32
Iron
There is an established reference interval 9–34 µmol/L, compiled by the NORIP project [200]. The reference standard material available for iron, NIST SRM 937, consists of iron wire [201].
Transferrin / TIBC
The NORIP project has established a reference interval for TIBC in serum, 49 - 83 µmol/L [200]. Transferrin was not included in the NORIP project, but assuming that 1 g transferrin binds 25.1 µmol iron, reference intervals for transferrin can be calculated from the NORIP material [202]. The reference interval according to this calculation corresponds to 1.87 – 3.19 g/L. Transferrin can be traced to the International Federation of Clinical Chemistry and Laboratory Medicine (IFCC) CRM 470 protein standard material based on bovine serum [203]. No such standard material is available for TIBC or UIBC.
Transferrin iron saturation
There are gender and age separated reference intervals for transferrin iron saturation, established by the NORIP project: women 18-49 years of age 10-50%; women ≥50 years of age 15-50%, and for men 15-57% [200].
Ferritin
There are no common reference intervals for ferritin in the Nordic countries. Ferritin can be traced to the IFCC CRM 470 protein standard material [203].
The NPU system
Standardization of laboratory investigation nomenclature has been an issue for decades. In scientific text, has not always obvious exactly which analysis has been performed, in absence of a standardized nomenclature. There is a need to distinguish between two or more methods with the same name, but with completely different results or units of measurement. The introduction of different information systems has utterly emphasized the importance of that the unique identity of a laboratory investigation is correctly cited when these systems communicate [204].
A standardized nomenclature to facilitate electronic prescription and transmission of laboratory results has been developed by the Committee on Nomenclature, Properties and Units, the NPU coding system [205]. The
33
coding system covers all fields of biological sciences, including clinical chemistry. Each term has a specific and ready-to-use code according to International Standard Organization, IUPAC and IFCC standards. This coding system is regularly updated and is freely available on the internet in Swedish [206], Danish [207] and English [208] versions.
Table 2. NPU codes for analytes in this study [206] NPU code Trivial name NPU01370 P-Bilirubin NPU02508 P-Iron NPU04133 P-TIBC NPU26470 P-Transferrin NPU04191 P-Transferrin iron saturation NPU03899 P-Ferritin
34
Objectives of the study
To evaluate if the antioxidant bilirubin is associated with the risk for first-ever myocardial infarction and first-ever stroke in a prospective nested case-referent settings.
To evaluate if UGT1A1*28 promoter insertion polymorphism, the main genetic determinant of bilirubin, is related to risk for myocardial infarction and stroke and whether this may validate or invalidate bilirubin as a causative factor.
To investigate possible determinants of plasma bilirubin levels in the study cohorts.
To assess if the oxidant iron, as mirrored by iron status, is associated with the risk for first-ever myocardial infarction and first-ever stroke in prospective nested case-referent settings.
To study if the hemochromatosis related HFE genotypes, that are hemochromatosis related, are associated with risk for myocardial infarction and stroke in these cohorts.
To assess the hypothesis that high iron levels are associated with higher risk for cardiovascular disease.
35
Material and methods
Ethics
The study protocols for all papers in this thesis were approved by the Research Ethics Committee of Umeå University, Umeå. The data handling procedures were approved by the National Computer Data Inspection Board.
Study cohorts
The Northern Sweden Health and Disease Study Cohort
Individuals participating in The Northern Sweden Health and Disease Study Cohort are recruited through several projects. For Papers 1 and 3 subjects from the Västerbotten Intervention Project (VIP), Northern Sweden Multinational MONItoring of trends and determinants in CArdiovascular disease (MONICA), and the Mammography Sceening Project (MSP) were included. In papers 2 and 4 only subjects from VIP and MONICA are included.
Västerbotten Intervention Program (VIP)
VIP is a population based intervention program which was started in 1985 in order to prevent cardiovascular diseases and diabetes in Västerbotten County. It was inspired by the North Karelia Project. Every inhabitant in Västerbotten County is invited to participate in a health survey when they turn 30, 40, 50 and 60 years old [209]. Invitation of 30 year old subjects was discontinued in by the end of 1995. By December 2002, 74000 individuals were included of who 67,000 had donated blood samples, frozen down for future research. From 1994 a second sample and questionnaire is taken with a 10-year interval of the individuals within the cohort.
The health survey is performed at the local health care center. It includes a questionnaire concerning various lifestyle factors including questions of diet. A 2-hour oral glucose tolerance test was performed with 75 mg glucose dissolved in 300 mL water ingested within 5 minutes was performed on most subjects. Plasma cholesterol is measured in conjunction to the survey on bench a bench top analyzer. An interview is performed by a trained nurse, including questions on medication. The participation rate has been 57%. Social characteristics have been investigated between participants and non-participants; little evidence for selection bias was found [210].

36
MONICA
The World Health Organization (WHO) established the MONICA project in the early 1980’s to monitor trends in risk factors for cardiovascular disease over time [211]. Totally 39 populations in 26 countries were included by the end of 1986. The Västerbotten and Norrbotten Counties joined the MONICA project in 1985, and the first survey was conducted in 1986. Subsequent surveys have been conducted in 1990, 1994, 1999, 2004 and 2009. The eligible population in this area has varied between 306279 persons in 1986 to a maximum of 318359 persons in 1999, according to Statistics Sweden. At each survey, 2000-2500 randomly selected inhabitants aged 25-74 years were invited for a health survey. These surveys use the same questionnaires and collection of information on medication as VIP. Measurements of systolic and diastolic blood pressure and body mass index are performed the same way as VIP. The participants are also asked to donate a blood sample donation for future research. In 65% randomly selected participants, a 2-hour goral glucose tolerance test was performed, as described for the VIP cohort. The participation rate for the surveys 1986-2009 has varied between 69.2 - 81.3%.
Figure 5. A sign in Mariehem, Umeå, pointing at a MONICA screening station during the 6th MONICA screening in spring 2009.

37
Mammography Screening Project
The MSP was founded in 1995 and recruitment is done through mammography screenings in Västerbotten County. All women within the range of about 40-70 years are invited to undergo mammography every two or three years. The frequency and the age range have varied over time due to variability in public funds. Women undergoing screening are invited to complete a questionnaire concerning reproductive history and to donate a blood sample for future research. The participation rate in screening was 85% and 57% for donation of blood sample.
Identification of cases
First-ever acute myocardial infarction and first-ever acute stroke events between 1985 and 2000 were identified by linking the NSHDSC with the Northern Sweden MONICA registry. Linkage was performed using Swedish personal numbers. This MONICA registry contains strokes in subjects 25-64 years of age and myocardial infarction cases 25-64 years of age in Västerbotten and Norrbotten counties. Myocardial infarction cases in subjects up to 75 years of age have been registered since year 2000. Hospital records, general practitioners’ reports, death certificates and when available, necropsy reports, have been screened for possible events. These events were validated using WHO MONICA criteria.
Subjects with previous stroke, myocardial infarction or cancer diagnosis 5 years prior to or 1 year after diagnosis with stroke or myocardial infarction, were excluded from the study. Data enabling exclusion of such cases was obtained from the MONICA registry and the National Cancer Registry. Questionnaire data and patient records suggesting presence of exclusion criteria were validated. Subjects with insufficient blood samples were also excluded at baseline.
The stroke cohort was classified according to TOAST criteria [212-213], which is a classification of etiology. The subgroups are atherotrombotic, lacunar and cardioembolic stroke. In this study, a majority of the stroke cases (55%) were classified as undetermined.
In Paper 4, subjects with unclassifiable strokes (n=6) were excluded. In Paper 2 hemorrhagic strokes (n=41) in addition to the unclassifiable stroke cases were excluded.

38
Study cohort on myocardial infarction, papers 1 and 3
618 subjects with a first-ever myocardial and 1184 matched referents were studied. For each case, two referents were selected, matched for sex, age, date of health survey, subcohort and geographic area. Exclusion criteria for cases were previous myocardial infarction, stroke or cancer diagnosis in the 5 years prior to, or stroke or cancer 1 year after diagnosis with myocardial infarction. Exclusion criteria for referents were myocardial infarction, stroke, cancer or death prior to the time of diagnosis of the index case.
The myocardial infarction cohort comprised an early compilation of 77 cases and double referents [214]. From this material DNA was available from 67 cases, but no plasma. In some 20 other cases plasma was insufficient in volume or missing.
Two subjects showed very high bilirubin levels (179 and 366 µmol/L) were regarded as outliers and excluded from calculations in Paper 1.
Table 3. Use of antithrombotic agents, antihypertensive medication and lipid lowering drugs, classified according to the Anatomical Therapeutic Chemical Classification System (ATC), in the combined FIA I and II cohort (referents: n=1184, cases n=618). Some subjects are on medication with more than one drug. Drug (ATC-code) Referents
n (%) Cases n (%)
Antithrombotic agents (B01A) 16 (1.4) 15 (2.4)
Vitamin K antagonists (B01AA) 4 (0.3) 3 (0.5)
Heparin group(B01AB) 0 (0.0) 0 (0.0)
Platelet aggregation inhibitors (B01AC) 12 (1.0) 11 (1.8)
Acetylsalicylic acid (B01AC06) 9 (0.8) 8 (1.3)
Antihypertensives (C02) 19 (1.6) 27 (4.4)
Diuretics (C03) 39 (3.2) 32 (5.2)
Beta blocking agents (C07) 69 (5.8) 69 (11.2)
Calcium channel blockers (C08) 27 (2.3) 31 (5.0)
Agents acting on the renin-angiotensin system (C09) 23 (2.0) 21 (3.4)
Lipid lowering drugs (C10) 4 (0.3) 2 (0.3)

39
Study cohort on stroke, papers 2 and 4
427 subjects met the criteria for a first acute stroke. After exclusion of subjects with previous myocardial infarction (n=55), a cancer diagnosis (n=29) and insufficient amount of blood in the sample at baseline (n=67), 276 cases remained (231 ischemic and 41 hemorrhagic). The cases were matched with two matched referents without known cardiovascular disease or cancer were selected from the two cohorts as previously detailed [215]. The referents were matched by sex, age (±2 years), cohort (MONICA or VIP), date (±1 year) of health survey, and geographical area.
In paper 2, the 41 cases of hemorrhagic stroke were excluded.
Blood sampling
In the VIP and MONICA projects, subjects are asked to fast for at least 4 hours. Blood samples are collected after 5 minutes rest in seated position in two evacuated 10 mL glass tubes, one heparinized and one containing EDTA. The blood samples are separated by centrifugation at 1500 g. Plasma, buffy coat and packed red cells are aliquoted in smaller plastic tubes. The samples are stored frozen at -80°C until analysis or DNA preparation.
Biochemical analyses
Plasma samples were analyzed in triplets with the position of the case and the referents randomly varied to avoid systematic bias and interassay variability.
Bilirubin
Total plasma bilirubin in Paper 1 was analyzed on a Hitachi 911 multianalyzer with BIL-T kit Cat. No. 11489429216 (Roche Diagnostics GmbH, Mannheim, Germany). The intra-assay coefficient of variation bilirubin was 3.63% at the level 18 mmol/L and 3.72% at 88 mmol/L.
Total plasma bilirubin in Paper 2 was analyzed with a Vitros 5,1 automated analyzer, using the TBIL slide, Code 8159931 (Ortho-Clinical Diagnostics, Inc., Rochester, NY, USA). The total coefficient of variation was for 3.3% at the level 18.4 µmol/L and 1.27 % at the level 239.8 µmol/L.

40
Markers of iron status in plasma
A Hitachi 911 multianalyzer with reagents from the manufacturer (Roche Diagnostics GmbH, Mannheim Germany) were used to analyze iron, UIBC and ferritin:
For iron FE, Iron kit Cat. No. 1970704 was used. The intra-assay coefficients of variation were 2.2% at the level 19.4 µmol/L and 1.8% at the level 45.9 µmol/L.
UIBC was analyzed with the Unsaturated Iron Binding Capacity (UIBC) kit Cat. No. 12146282. Intra-assay coefficients were 5.6% and 5.7% at levels 23.7 and 37.5 µmol/L, respectively.
Tina-quant® Ferritin kit, Cat. No. 11661400 was used to determine ferritin. The intra assay coefficients of variation were 5.1% and 3.7% at levels 70.3 and 301.7 µg/L, respectively.
TIBC and transferrin iron saturation were calculated:
TIBC = UIBC + iron
transferrin iron saturation = iron / (iron + UIBC) × 100
Polymorphism analyses
DNA prepared from buffy coat using the chloroform/phenol method was provided from the Medical Biobank, Umeå. From each sample, 10 ng DNA was dispensed in wells of 96-well plates.
UGT1A1*28
Fragment analysis was used to genotype the UGT1A1*28 promoter polymorphism lengths using a method first described by Adegoke et al. [216], which was slightly modified.
The primers for the PCR reaction were: 5’- FAM-CAACAGTATCTTCCCAGC-3’ and 5’-GTGTCCACGTGACACAGTCAAAC-3’ (MWG-Biotech, Ebersberg, Germany). A GeneAmp PCR System 9700 was used to run the PCR reactions: The 10 µL reactions included 0.5 U AmpliTaq GOLD polymerase, 1× Gene Amp buff II, 2.5 mmol/L MgCl2, 0,25 mmol/L dNTP, 335 nmol/L of each primer and 15 ng DNA. Thermal cycling was carried out as follows: 95
41
°C for 10 minutes followed by 10 cycles of 94 °C for 15 seconds, 55 °C for 15 seconds, and 72 °C for 30 seconds. This was followed by 20 cycles of 89 °C for 15 seconds, 55 °C for 15 seconds and 72 °C for 30 seconds. Finally 72 °C was applied for 10 minutes followed by a cooling step of 4 °C.
The PCR product was diluted 7x with distilled water. For fragment analysis 16 µL GS500(-250)LIZ size standard was added to 1100 µL HiDi-Formamide. To 10 µL of the formamide –LIZ mixture, 1 µL of the diluted PCR product was added. Samples were denatured at 95 °C for 5 minutes, put on ice and subsequently analysed on an ABI 3730 xl automated DNA sequencer. Fragment analysis was performed using GeneMapper v3.0 software. All equipment and reagents, except for the primers, were from Applied Biosystems, Foster City, CA, USA.
In Paper 1 and 2, 59 and 27 heterozygote controls, respectively, were analyzed with consistent results. The call rate was 97.3% in Paper 1 and 93.2% in Paper 2.

42
Figure 6. Plots illustrating different UGT1A1 promoter polymorphism genotypes. From above: (TA)6/(TA)6, (TA)5/(TA)6, (TA)7/(TA)7, and (TA)6/(TA)7
HFE C282Y and HFE H63D
Both HFE C282Y and H63D was analyzed using TaqMan allelic discrimination using Minor Groove Binder probes. The TaqMan assays were from Applied Biosystems (Foster City, CA, USA). PCR reactions were performed at the Center for Genome Research, Umeå University.
HFE C282Y was ordered using the Assay-by-Design concept. The following primer sequences were used: GGCTGGATAACCTTGGCTGTAC and

43
GTCACATACCCCAGATCACAATGAG. The probe sequences were VIC-AGAGATATACGTGCCAGGTG and FAM-CAGAGATATACGTACCAGGTG.
For HFE H63D, an Assay-on-Demand kit, assay ID c___1085600_10 was used. The primer sequences are proprietary by the manufacturer.
The PCR reactions were run on a GeneAmp PCR System 9700. PCR products were analyzed on the ABI PRISM 7900 HT Sequence Detection System using SDS v2.1 software according to the manufacturer’s instructions.
We also sequenced a number of individuals with different genotypes to ensure the accuracy of the results.
Questionnaires and dietary assessment
A questionnaire on several lifestyle factors, including social background, drug consumption, heredity and history for cardiovascular diseases, social support, demand and control at work, unemployment, migration, and when applicable hormonal therapy and menopause. A validation of data collected with these questionnaires has been performed [217].
Information from a food frequency questionnaire (FFQ) was used to determine iron intake in Paper 1. The FFQ estimates food intake on a nine-level scale. The levels are never, up to once a month, 1-3 times a week, once per day, 2-3 times per day, and 4 or more times a day. 55% of the subjects in Paper 4 had completed a FFQ. Of these, 84% completed an 82- or 84- item FFQ and 16% completed a 65- or 66-item version of the same questionnaire. Data on iron intake and alcohol use were retrieved from these questionnaires.

44
Figure 7. Taqman allelic discrimination plot for a HFE C282Y assay. Wild type subjects are found in the right lower corner, heterozygote mutants in the middle, and homozygote mutants are found in the upper left corner. Blank samples with no DNA are found in the lower left corner.
45
Statistics
SPSS Statistics versions 12.0-17.0.2, were used for most of the calculations (SPSS Inc. Chicago, Ill. USA). To determine Hardy-Weinberg equilibrium on UGT promoter polymorphisms, which have more than two degrees of freedom, a java applet [218] was used.
Mann-Whitney test was used for comparing baseline characteristics for referents and cases. Odds ratios and 95% confidence intervals for risk for disease were calculated for quartiles of plasma variables and genotypes. The quartile limits were based on referent subjects calculated separately for men and women. HFE genotypes were coded as 1-3 (wild type, heterozygote mutant, and homozygote mutant). UGT promoter polymorphism genotypes were coded binary with (TA)6/(TA)6 and (TA)6/(TA)7 coded as 1 and (TA)7/(TA)7 coded as 2. Test for trend was performed as testing quartiles or genotypes as continuous variables in regression analysis. Missing values were treated as missing throughout the calculations, except for in Paper 4 where they were assigned a separate category in categorical variables and the median value of referent subjects in continuous variables. All statistical tests and corresponding p-values were two-sided.

46
Results and discussion
Baseline characteristics, myocardial infarction, Papers 1 and 3
The median lag time to from sampling to myocardial infarction was 3.5 years. Previously established risk factors/risk markers for myocardial infarction, i.e. BMI, hypertension, diabetes mellitus and smoking were significantly higher or more abundant in cases.
A significantly greater proportion of the cases were on medication with at least one drug, compared to the referents. Medication with at least one drug was associated with a significantly higher risk for myocardial infarction.
Baseline characteristics, ischemic stroke, Papers 2 and 4
Cases with ischemic stroke (n=231) were included in Paper 2. In Paper 4, an addition of 41 hemorrhagic stroke cases was also included. The median time from sampling to ischemic stroke was 4.9 years, and for ischemic stroke 5.3 years. BMI was higher, and smoking, hypertension and diabetes was more common in cases, compared to referents. Medication with one or more drugs was more common in cases.
Medication with at least one drug increased the risk for ischemic stroke. However, no significant association was seen for medication and hemorrhagic stroke. (data not shown)
47
Plasma bilirubin and UGT1A1*28 in relation to cardiovascular disease (Papers 1 and 2)
The aim was to investigate if bilirubin levels, and the UGT1A1*28 promoter insertion polymorphisms were associated with risk for cardiovascular disease. We performed a nested case-referent study on a cohort of first myocardial infarction cases and a cohort of first ischemic stroke cases.
There was a negative risk association between bilirubin levels and both myocardial infarction and ischemic stroke. In the myocardial infarction cohort, cases with medication with one or more drugs had lower bilirubin levels than referents. In the stroke cohort, there was no significant difference in bilirubin levels between subjects with one or more drugs, and subjects without medication. Medication with one or more drugs was associated with higher risk for myocardial infarction and ischemic stroke.
Both referents and cases were in Hardy-Weinberg equilibrium for the UGT1*28 polymorphism in both studies, with no differences in the distribution between cases and referents. In the myocardial infarction cohort, we found four referents with a (TA)5 allele and one referent with a (TA)8 allele, and in the stroke cohort three referents and once case had a (TA)5 allele. Subjects with these uncommon genotypes were excluded from further calculations. Cases had lower bilirubin levels, regardless of genotype (Paper 1, Figure 1; Paper 2, Figure 1)), but the difference was only significant among men in the myocardial infarction cohort. No risk association between the UGT1A1*28 promoter polymorphism and risk for disease in either of the two cohorts was found. For myocardial infarction this is in agreement with previous prospective studies [65-66]. For stroke there are no previous prospective studies to compare with.
In both the myocardial infarction and stroke cohorts we could see an inverse relationship between bilirubin levels and risk for disease endpoint using conditional logistic regression. The case ascertainments in previous studies have not been as meticulously well performed in previous studies as they are in the Northern Sweden Health and Disease Study Cohort. In the myocardial infarction cohort, the findings were more prominent in men and in the stroke cohort an association was only seen in women. In a large Korean study, this inverse relationship was seen in men, not in women [62].

48
In both the myocardial infarction and stroke cohorts a negative association between high bilirubin levels and disease could be seen. No association was found for UGT1A1*28. Due to the fact that as much as 18% of the variability of bilirubin can be explained by UGT1A1*28 [42], and that the polymorphism is abundant (allele frequency about 30%), the concept of Mendelian randomization can be applied. When applying Mendelian randomization both bilirubin and UGT1A1*28 strongly influencing bilirubin should affect risk, if there was a causal relationship between bilirubin and risk (Figure 8). In the presence of a phenotypic association with risk, but in the absence of an association between genetic factors influencing the phenotype and risk, other possibilities should be considered.
Figure 8. Risk associations according to the Mendelian randomization concept for bilirubin and cardiovascular disease. Adapted from N Engl J Med 2008 359 1897-908 [219].
One possibility is reverse causation. This would imply that cardiovascular disease itself or its predecessors, atherosclerosis or factors promoting atherosclerosis, lower bilirubin levels. Another possible explanation is the presence of a confounder. A confounder could influence the risk, and simultaneously be involved in one or more of processes affecting bilirubin levels, i.e. production, degradation, elimination and re-absorption of bilirubin. Several genome wide association (GWA) studies have been performed on cases with coronary artery disease [220-227] and on stroke

49
cases [228-237]. None of them has found polymorphisms associated with risk in the proximity of the UGT1A1 gene on 2q37.
With respect to bilirubin production, an interesting study on bilirubin production and risk was performed on HO-1 promoter polymorphisms which regulate the transcription of HO-1, the limiting enzyme step in bilirubin production [238]. In that study different promoter polymorphism lengths affected bilirubin levels and, also risk for coronary heart disease in a retrospective study on diabetic subjects.
Little is known about the direct degradation of bilirubin and factors influencing this process. Biopyrrins, substances emanating from direct bilirubin degradation, are known to promote vasospasm [27], but they are rapidly excreted from the body through urine [28].
The gut bacterial flora is highly variable between individuals and it might affect health [35]. It has been shown in an animal model that gut flora can be altered by diet changes [239]. It has been hypothesized alterations in gut flora may promote adiposity and atherosclerotic disease [240]. Speculatively, alterations of gut flora might also change the balance between bilirubin deconjugation and re-absorption vs. reduction to urobilinogen species and elimination through the stools.
A possible confounder may be hiding behind the interesting finding that there was a strong co-variation between bilirubin and iron in plasma. We could also see that for myocardial infarction, both the negative risk associations for bilirubin and plasma iron were limited to men. These findings suggest that the relationship between bilirubin, iron and risk for myocardial infarction should be investigated more in detail in the future.
A weakness of our studies on bilirubin and risk for myocardial infarction and stroke was that the samples had been thawed up to five times before analysis of bilirubin. Bilirubin levels in these studies are therefore lower due to degradation than in fresh samples from a normal population. The samples were, however always handled in triplets with the position of the case and the two referents randomly varied. The case and the two referents were matched for sampling time and place, which minimizes differences in logistics, such as handling and storage time. When calculating risk, conditional logistic regression analysis was used, also keeping the triplets together. Thus, the inter-relationship, and subsequently the risk estimates, should not have been affected, despite the freeze-thaw cycles.
50
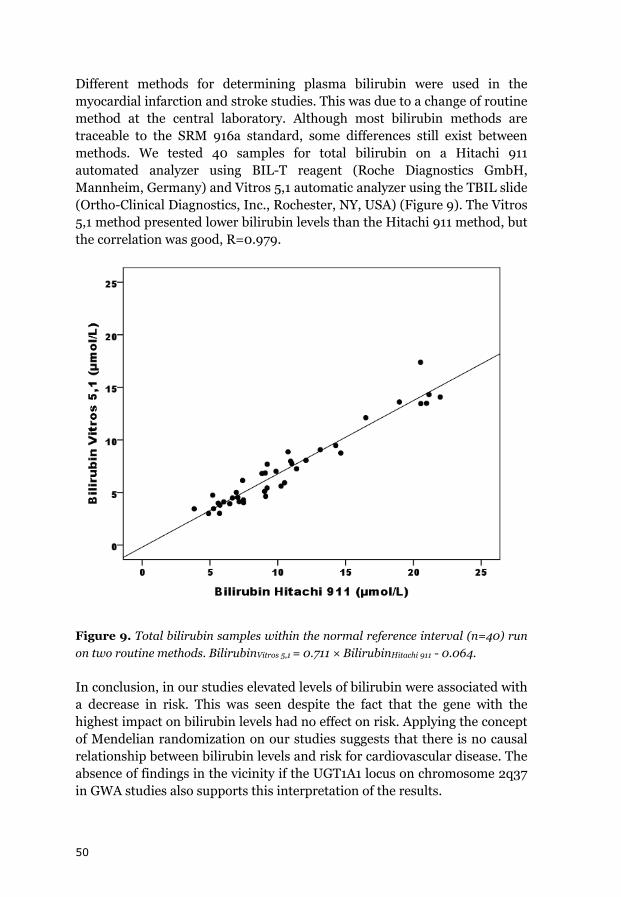
Different methods for determining plasma bilirubin were used in the myocardial infarction and stroke studies. This was due to a change of routine method at the central laboratory. Although most bilirubin methods are traceable to the SRM 916a standard, some differences still exist between methods. We tested 40 samples for total bilirubin on a Hitachi 911 automated analyzer using BIL-T reagent (Roche Diagnostics GmbH, Mannheim, Germany) and Vitros 5,1 automatic analyzer using the TBIL slide (Ortho-Clinical Diagnostics, Inc., Rochester, NY, USA) (Figure 9). The Vitros 5,1 method presented lower bilirubin levels than the Hitachi 911 method, but the correlation was good, R=0.979.
Figure 9. Total bilirubin samples within the normal reference interval (n=40) run on two routine methods. BilirubinVitros 5,1 = 0.711 × BilirubinHitachi 911 - 0.064.
In conclusion, in our studies elevated levels of bilirubin were associated with a decrease in risk. This was seen despite the fact that the gene with the highest impact on bilirubin levels had no effect on risk. Applying the concept of Mendelian randomization on our studies suggests that there is no causal relationship between bilirubin levels and risk for cardiovascular disease. The absence of findings in the vicinity if the UGT1A1 locus on chromosome 2q37 in GWA studies also supports this interpretation of the results.

51
Iron metabolism in relation to cardiovascular disease (Papers 3 and 4)
The aim for these papers was to determine if iron status markers and polymorphisms affecting iron status were independently associated with risk for cardiovascular disease. Risk for disease was assessed for iron status markers and HFE genotypes in one cohort with myocardial infarction as endpoint and a cohort with of stroke as endpoint.
Iron, TIBC, transferrin iron saturation and ferritin were compared between cases than referents with Mann-Whitney U-test. A significant difference was seen for transferrin iron saturation in men only in both the myocardial infarction and stroke cohort. Risk for myocardial infarction in quartiles of iron, TIBC, transferrin iron saturation and ferritin in plasma, was determined. The highest quartile of iron and transferrin iron saturation was negatively associated with risk. The risk reduction was confined to men. In Paper 3, significance was lost when adjusting for hsCRP. In Paper 4, adjusting for hsCRP did not change the risk estimates. No risk associations were found for TIBC and ferritin. Both HFE polymorphisms HFE (C282Y and HFE H63D) were in Hardy-Weinberg equilibrium. There was no risk association between HFE C282Y and myocardial infarction or stroke. For HFE H63D the only association with disease was an almost fivefold increase in risk for myocardial infarction in women. An association between HFE H63D and stroke has not been reported before.
Our findings on plasma iron and myocardial infarction are in agreement with two Finnish studies [130-131] and the American NHANES I follow-up study [134], although our findings were limited to men only. Our findings were contradictory to a Canadian study, which only included cases with fatal myocardial infarction [132]. For TIBC, our findings confirm the findings of the NHANES project [134], but in contrast to a Finnish study finding of a positive risk association [131] and an Icelandic study which found a negative risk association [136]. For transferrin iron saturation, our findings confirm earlier studies with no risk associations [133-135]. The absence of a risk association for ferritin in our study is in agreement with an American [138] and a Finnish [137] study, but in disagreement with another Finnish study which found a positive risk association with myocardial infarction [137].

52
For ischemic stroke plasma iron was not associated with risk for neither ischemic nor hemorrhagic stroke. We could not replicate the findings of a previous study reporting a reduced risk of stroke in the middle tertile of serum iron concentrations [131]. As that study had relatively few cases, it might have been a chance finding. There was an increased risk for ischemic stroke in the highest quartile of TIBC in univariate analysis. After adjustment with BMI, hypertension, smoking, diabetes, cholesterol, hsCRP, HFE C282Y and HFE H63D, the risk estimates were not longer significant. As for myocardial infarction, the highest quartile for transferrin iron saturation was associated with lower risk in men only. The findings on ferritin are in disagreement with a study reporting increased risk of ischemic stroke for the highest versus lowest tertile of ferritin in postmenopausal women [147], and another study which found no direct association with stroke [148].
The findings in iron status markers in our studies all point in the same direction in both the myocardial infarction study and the stroke study. Iron in the upper normal range is not associated with higher risk. When significant risk associations were found, high iron seems to be associated with decreased risk.
Dietary data for the stroke cohort was examined. The only finding was a significant negative association (p=0.026) between food iron intake and TIBC. There was a problem with power shortage, as data for only 55% of the subjects was available.
We also studied a smaller subset of hemorrhagic stroke cases. There was a positive association between hemorrhagic stroke the 2nd and 3rd ferritin quartile. Although this is the largest number of hemorrhagic strokes described until today, the number is still relatively small. Therefore caution should be taken interpreting these results. Our findings on ferritin may indeed be a chance finding.
This finding that HFE H63D is associated with myocardial infarction in women is quite surprising, and has not been previously described. It is probably not related to iron metabolism. This is supported by the findings in quartiles of iron parameters: Sufficient levels of iron in the upper normal range are not associated with risk for myocardial infarction. The HFE H63D is a hemochromatosis associated polymorphism, but its impact on iron levels is considered far weaker than that of HFE C282Y. Homozygosity for HFE H63D alone will probably not elevate iron levels to levels causing clinical hemochromatosis. The finding is also contradictory to the findings for iron status markers, which suggest that higher iron levels are at least not harmful, and could even be beneficial with respect to risk for cardiovascular disease.

53
Speculatively, the proximity of this polymorphism to the HLA region may suggest that HFE H63D is linked with other polymorphisms in this area, affecting the risk for myocardial infarction.
In conclusion, transferrin iron saturation was associated with lower risk for disease in men in both the myocardial infarction cohort and the stroke cohort. The results do not support the iron hypothesis as described by Sullivan et al [127]. On the contrary, iron levels in the upper normal range may even be beneficial, with respect to risk for myocardial infarction.

54
Conclusions
Bilirubin levels in the upper normal range were associated with lower risk for myocardial infarction in both men and women, and with a lower risk for ischemic stroke in women only.
The UGT1A1*28 polymorphism is not associated with risk for neither myocardial infarction nor ischemic stroke, suggesting that bilirubin is not a true protective factor for these diseases.
UGT1A1*28 was the strongest determinant of plasma bilirubin. Another strong determinant was plasma iron. Medication with one or more drugs may also influence bilirubin levels.
Iron stores were not independently associated with the risk for myocardial infarction or stroke.
The HFE C282Y polymorphism is not associated with risk for myocardial infarction and stroke. The H63D polymorphism is not associated with the risk for stroke, but is associated with higher risk for myocardial infarction in women only. This effect is probably not related to the effect of iron stores.
There was no support for the hypothesis that high iron levels increase the risk for cardiovascular disease.

55
Implications for the future
The influence of medication on bilirubin levels need to be investigated in more detail. Stratification on ATC codes in larger materials is needed.
The mechanisms behind the strong association of plasma iron with bilirubin levels needs to be explored further.
Further factors which also affect bilirubin levels need to be identified.
Further prospective studies on iron levels and the risk for cardiovascular disease are needed.
The discontinuation of iron fortification of flour in Sweden, and other countries, needs to be re-assessed when more data on iron levels and risk for cardiovascular diseases and cancer is available.
Further studies on bilirubin levels and iron stores and risk for cancer are needed.

56
Acknowledgements Jag vill framför allt tacka mina handledare: Johan Hultdin, för att ha lärt mig klinisk kemi från grunden, introducerat mig i forskningens hemligheter samt för allt stöd och god vänskap. Du sade att du skulle lära mig allt du kunde, och att det skulle gå fort. Tio år senare är jag fortfarande osäker på hur det gick. Stefan Marklund vill jag tacka för alla kloka råd, nya idéer och uppslag, både inom forskningen och i verkliga livet. Ett särskilt tack vill jag rikta till mina medförfattare: P-G Wiklund, Jan-Håkan Jansson, Göran Hallmans, Pia Osterman, Lars Johansson Lars Weinehall, Birgitta Stegmayr, Ingegerd Johansson samt Bethany Van Guelpen. Era synpunkter och förbättringsförslag har varit ovärderliga! Utan Medicinska Biobanken och dess hjälpsamma och trevliga personal hade denna studie aldrig kunnat genomföras. Ett stort tack riktas därför till Åsa Ågren, Kerstin Enquist, Sara Nilsson, Thore Johansson, Hubert Sjödin och alla andra på biobanken. Birgitta Nilsson på Laboratoriemedicin, klinisk kemi, vill jag tacka för ett gott samarbete genom åren. Ditt unika kunnande och historiska perspektiv på ämnet klinisk kemi har lärt mig mycket. Stig Karlsson. Tack för alla intressanta och givande diskussioner vid fikat! Jag kommer att sakna dem i Småland. Mina arbetskamrater på Klinisk kemi vill jag tacka för gott samarbete och trevlig samvaro: Kjell Grankvist, Göran Brattsand, Kurt Karlsson, Andreas Jonsson, Jörn Schneede, Sofie Nilsson-Ardnor, Aihong Li, Lars-Gunnar Gunnarsson, Risto Järvi, Susanna Hermansson, Ann-Britt Lindström, Jenny Ekman, Håkan Jakobsson samt alla andra. Erik Jidell, Birgitta Nilsson-Sojka, Maria Remes, Eva Lassén, Nikolas Malliotis och Steve Tallander. Tack för att jag fått ta del av era kunskaper inom transfusionsmedicin och mycket annat!

57
Tack Veronica Jansson, Richard Palmqvist, Paul Franks, Karin Hjertkvist, Birgitta Nilsson, Terry Persson och Åsa Lundsten för trevlig samvaro, all hjälp och allt stöd! Innebandygänget. Måndagarna har inte känts så tunga då man haft förmånen att börja veckan med en hård match med er! Mina vänner Tom och Ina samt Anders och Bettan vill jag tacka för att ni alltid finns där trots att avståndet är långt och det därför blivit långt mellan gångerna. Jag vill tacka min mor Ulla för att ha gett mig alla viktiga verktyg man behöver i livet och för att du alltid stöttat mig. Min far Hans vill jag tacka för stöd och goda råd. Min syster Maria. Vad du och Magnus betyder går inte att förklara på en rad. Tack!
Släkten. Vi träffas sällan, men ni betyder mer än ni anar. Jan-Åke och Edith, Adam och Ida, David, Cecilia, Frida, Mollie samt Göran. Tack för att ni introducerat mig i den småländska gemenskapen! Sist, men inte minst, vill jag tacka Erica, Lukas och Mikaela. Ni är mitt allt.

58
References
1. Puska, P., K. Koskela, H. Pakarinen, P. Puumalainen, V. Soininen, and J. Tuomilehto, The North Karelia Project: a programme for community control of cardiovascular diseases. Scand J Soc Med, 1976. 4(2): p. 57-60.
2. Tuomilehto, J., P. Puska, A. Tanskanen, H. Karppanen, P. Pietinen, A. Nissinen, H. Enlund, and P. Ruotsalainen, A community-based intervention study on the feasibility and effects of the reduction of salt intake in North Karelia, Finland. Acta Cardiol, 1981. 36(2): p. 83-104.
3. The North Karelia Project. [cited 2009 12 08]; Available from: http://www.ktl.fi/portal/english/research__people___programs/health_promotion_and_chronic_disease_prevention/projects/cindi/north__karelia_project/.
4. Jenkins, P.L., L. Weinehall, T.A. Erb, C. Lewis, A.N. Nafziger, T.A. Pearson, and S. Wall, The Norsjo-Cooperstown healthy heart project: a case study combining data from different studies without the use of meta-analysis. Scand J Public Health Suppl, 2001. 56: p. 40-5.
5. Roos, G., M. Lean, and A. Anderson, Dietary interventions in Finland, Norway and Sweden: nutrition policies and strategies. J Hum Nutr Diet, 2002. 15(2): p. 99-110.
6. Lynch, S.R., The impact of iron fortification on nutritional anaemia. Best Pract Res Clin Haematol, 2005. 18(2): p. 333-46.
7. Hallberg, L. and L. Hulthen, Perspectives on iron absorption. Blood Cells Mol Dis, 2002. 29(3): p. 562-73.
8. Pirone, C., J.M. Quirke, H.A. Priestap, and D.W. Lee, Animal Pigment Bilirubin Discovered in Plants. J Am Chem Soc, 2009.
9. Ahlfors, C.E., R.P. Wennberg, J.D. Ostrow, and C. Tiribelli, Unbound (free) bilirubin: improving the paradigm for evaluating neonatal jaundice. Clin Chem, 2009. 55(7): p. 1288-99.
10. Ahlfors, C.E., S.B. Amin, and A.E. Parker, Unbound bilirubin predicts abnormal automated auditory brainstem response in a diverse newborn population. J Perinatol, 2009. 29(4): p. 305-9.

59
11. Kaplan, M., P. Renbaum, H.J. Vreman, R.J. Wong, E. Levy-Lahad, C. Hammerman, and D.K. Stevenson, (TA)n UGT 1A1 promoter polymorphism: a crucial factor in the pathophysiology of jaundice in G-6-PD deficient neonates. Pediatr Res, 2007. 61(6): p. 727-31.
12. Maruo, Y., K. Nishizawa, H. Sato, Y. Doida, and M. Shimada, Association of neonatal hyperbilirubinemia with bilirubin UDP-glucuronosyltransferase polymorphism. Pediatrics, 1999. 103(6 Pt 1): p. 1224-7.
13. Smitherman, H., A.R. Stark, and V.K. Bhutani, Early recognition of neonatal hyperbilirubinemia and its emergent management. Semin Fetal Neonatal Med, 2006. 11(3): p. 214-24.
14. Stevenson, D.K., A.A. Fanaroff, M.J. Maisels, B.W. Young, R.J. Wong, H.J. Vreman, J.R. MacMahon, C.Y. Yeung, D.S. Seidman, R. Gale, W. Oh, V.K. Bhutani, L.H. Johnson, M. Kaplan, C. Hammerman, and H. Nakamura, Prediction of hyperbilirubinemia in near-term and term infants. J Perinatol, 2001. 21 Suppl 1: p. S63-72; discussion S83-7.
15. Maimburg, R.D., B.H. Bech, J.V. Bjerre, J. Olsen, and B. Moller-Madsen, Obstetric outcome in Danish children with a validated diagnosis of kernicterus. Acta Obstet Gynecol Scand, 2009. 88(9): p. 1011-6.
16. McDonagh, A.F. and D.A. Lightner, 'Like a shrivelled blood orange'--bilirubin, jaundice, and phototherapy. Pediatrics, 1985. 75(3): p. 443-55.
17. Crigler, J.F., Jr. and V.A. Najjar, Congenital familial nonhemolytic jaundice with kernicterus. Pediatrics, 1952. 10(2): p. 169-80.
18. Jansen, P.L., Diagnosis and management of Crigler-Najjar syndrome. Eur J Pediatr, 1999. 158 Suppl 2: p. S89-94.
19. Pashankar, F.D., J. Carbonella, A. Bazzy-Asaad, and A. Friedman, Prevalence and risk factors of elevated pulmonary artery pressures in children with sickle cell disease. Pediatrics, 2008. 121(4): p. 777-82.
20. Owens, D. and J. Evans, Population studies on Gilbert's syndrome. J Med Genet, 1975. 12(2): p. 152-6.
60
21. Thomsen, H.F., F. Hardt, and E. Juhl, Diagnosis of Gilbert's syndrome. Reliability of the caloric restriction and phenobarbital stimulation tests. Scand J Gastroenterol, 1981. 16(5): p. 699-703.
22. Lammli, J., B. Cueni, P. Mohr, and M. Schmid, [Fasting hyperbilirubinemia. A test for diagnosis of Gilbert's syndrome or a physiological phenomenon?]. Dtsch Med Wochenschr, 1973. 98(37): p. 1704-6 passim.
23. Bosma, P.J., J.R. Chowdhury, C. Bakker, S. Gantla, A. de Boer, B.A. Oostra, D. Lindhout, G.N. Tytgat, P.L. Jansen, R.P. Oude Elferink, and et al., The genetic basis of the reduced expression of bilirubin UDP-glucuronosyltransferase 1 in Gilbert's syndrome. N Engl J Med, 1995. 333(18): p. 1171-5.
24. Akaba, K., T. Kimura, A. Sasaki, S. Tanabe, T. Ikegami, M. Hashimoto, H. Umeda, H. Yoshida, K. Umetsu, H. Chiba, I. Yuasa, and K. Hayasaka, Neonatal hyperbilirubinemia and mutation of the bilirubin uridine diphosphate-glucuronosyltransferase gene: a common missense mutation among Japanese, Koreans and Chinese. Biochem Mol Biol Int, 1998. 46(1): p. 21-6.
25. Sava, M. and D.M. Kraemer, Heterozygous G71R-mutation causing Gilbert's syndrome in one of 103 random persons of German descent. J Hepatol, 2005. 42(5): p. 778-9.
26. Kranc, K.R., G.J. Pyne, L. Tao, T.D. Claridge, D.A. Harris, T.A. Cadoux-Hudson, J.J. Turnbull, C.J. Schofield, and J.F. Clark, Oxidative degradation of bilirubin produces vasoactive compounds. Eur J Biochem, 2000. 267(24): p. 7094-101.
27. Clark, J.F. and F.R. Sharp, Bilirubin oxidation products (BOXes) and their role in cerebral vasospasm after subarachnoid hemorrhage. J Cereb Blood Flow Metab, 2006. 26(10): p. 1223-33.
28. Yamamoto, M., H. Maeda, N. Hirose, G. Radhakrishnan, R.G. Katare, Y. Hayashi, P. Rao, G.H. Lee, T. Yamaguchi, and S. Sasaguri, Bilirubin oxidation provoked by nitric oxide radicals predicts the progression of acute cardiac allograft rejection. Am J Transplant, 2007. 7(8): p. 1897-906.
29. Gustafsson, B.E. and L.S. Lanke, Bilirubin and urobilins in germfree, ex-germfree, and conventional rats. J Exp Med, 1960. 112: p. 975-81.

61
30. Fevery, J., Bilirubin in clinical practice: a review. Liver Int, 2008. 28(5): p. 592-605.
31. Leung, J.W., Y.L. Liu, P.S. Leung, R.C. Chan, J.F. Inciardi, and A.F. Cheng, Expression of bacterial beta-glucuronidase in human bile: an in vitro study. Gastrointest Endosc, 2001. 54(3): p. 346-50.
32. Turnbaugh, P.J., V.K. Ridaura, J.J. Faith, F.E. Rey, R. Knight, and J.I. Gordon, The effect of diet on the human gut microbiome: a metagenomic analysis in humanized gnotobiotic mice. Sci Transl Med, 2009. 1(6): p. 6ra14.
33. Vitek, L., P. Kotal, M. Jirsa, J. Malina, M. Cerna, D. Chmelar, and J. Fevery, Intestinal colonization leading to fecal urobilinoid excretion may play a role in the pathogenesis of neonatal jaundice. J Pediatr Gastroenterol Nutr, 2000. 30(3): p. 294-8.
34. Vitek, L., F. Majer, L. Muchova, J. Zelenka, A. Jiraskova, P. Branny, J. Malina, and K. Ubik, Identification of bilirubin reduction products formed by Clostridium perfringens isolated from human neonatal fecal flora. J Chromatogr B Analyt Technol Biomed Life Sci, 2006. 833(2): p. 149-57.
35. Qin, J., R. Li, J. Raes, M. Arumugam, K.S. Burgdorf, C. Manichanh, T. Nielsen, N. Pons, F. Levenez, T. Yamada, D.R. Mende, J. Li, J. Xu, S. Li, D. Li, J. Cao, B. Wang, H. Liang, H. Zheng, Y. Xie, J. Tap, P. Lepage, M. Bertalan, J.M. Batto, T. Hansen, D. Le Paslier, A. Linneberg, H.B. Nielsen, E. Pelletier, P. Renault, T. Sicheritz-Ponten, K. Turner, H. Zhu, C. Yu, M. Jian, Y. Zhou, Y. Li, X. Zhang, N. Qin, H. Yang, J. Wang, S. Brunak, J. Dore, F. Guarner, K. Kristiansen, O. Pedersen, J. Parkhill, J. Weissenbach, P. Bork, and S.D. Ehrlich, A human gut microbial gene catalogue established by metagenomic sequencing. Nature, 2010. 464(7285): p. 59-65.
36. Kamisako, T., What is Gilbert's syndrome? Lesson from genetic polymorphisms of UGT1A1 in Gilbert's syndrome from Asia. J Gastroenterol Hepatol, 2004. 19(9): p. 955-7.
37. Clementi, M., E. Di Gianantonio, L. Fabris, P. Forabosco, M. Strazzabosco, R. Tenconi, and L. Okolicsanyi, Inheritance of hyperbilirubinemia: evidence for a major autosomal recessive gene. Dig Liver Dis, 2007. 39(4): p. 351-5.
38. Sugatani, J., K. Yamakawa, E. Tonda, S. Nishitani, K. Yoshinari, M. Degawa, I. Abe, H. Noguchi, and M. Miwa, The induction of human UDP-glucuronosyltransferase 1A1 mediated through a distal

62
enhancer module by flavonoids and xenobiotics. Biochem Pharmacol, 2004. 67(5): p. 989-1000.
39. Strasser, S.I., S.A. Smid, M.L. Mashford, and P.V. Desmond, Sex hormones differentially regulate isoforms of UDP-glucuronosyltransferase. Pharm Res, 1997. 14(9): p. 1115-21.
40. Ritter, J.K., M.T. Yeatman, P. Ferreira, and I.S. Owens, Identification of a genetic alteration in the code for bilirubin UDP-glucuronosyltransferase in the UGT1 gene complex of a Crigler-Najjar type I patient. J Clin Invest, 1992. 90(1): p. 150-5.
41. HapMap. [cited 2010 04 01]; Available from: http://hapmap.ncbi.nlm.nih.gov/.
42. Lin, J.P., J.P. Schwaiger, L.A. Cupples, C.J. O'Donnell, G. Zheng, V. Schoenborn, S.C. Hunt, J. Joo, and F. Kronenberg, Conditional linkage and genome-wide association studies identify UGT1A1 as a major gene for anti-atherogenic serum bilirubin levels--the Framingham Heart Study. Atherosclerosis, 2009. 206(1): p. 228-33.
43. Breimer, L.H., K.A. Spyropolous, A.F. Winder, D.P. Mikhailidis, and G. Hamilton, Is bilirubin protective against coronary artery disease? Clin Chem, 1994. 40(10): p. 1987-8.
44. Schwertner, H.A., W.G. Jackson, and G. Tolan, Association of low serum concentration of bilirubin with increased risk of coronary artery disease. Clin Chem, 1994. 40(1): p. 18-23.
45. Hopkins, P.N., L.L. Wu, S.C. Hunt, B.C. James, G.M. Vincent, and R.R. Williams, Higher serum bilirubin is associated with decreased risk for early familial coronary artery disease. Arterioscler Thromb Vasc Biol, 1996. 16(2): p. 250-5.
46. Hunt, S.C., L.L. Wu, P.N. Hopkins, and R.R. Williams, Evidence for a major gene elevating serum bilirubin concentration in Utah pedigrees. Arterioscler Thromb Vasc Biol, 1996. 16(8): p. 912-7.
47. Levinson, S.S., Relationship between bilirubin, apolipoprotein B, and coronary artery disease. Ann Clin Lab Sci, 1997. 27(3): p. 185-92.
48. Cerne, D., G. Ledinski, G. Kager, J. Greilberger, X. Wang, and G. Jurgens, Comparison of laboratory parameters as risk factors for

63
the presence and the extent of coronary or carotid atherosclerosis: the significance of apolipoprotein B to apolipoprotein all ratio. Clin Chem Lab Med, 2000. 38(6): p. 529-38.
49. Hunt, S.C., F. Kronenberg, J.H. Eckfeldt, P.N. Hopkins, R.H. Myers, and G. Heiss, Association of plasma bilirubin with coronary heart disease and segregation of bilirubin as a major gene trait: the NHLBI family heart study. Atherosclerosis, 2001. 154(3): p. 747-54.
50. Ishizaka, N., Y. Ishizaka, E. Takahashi, M. Yamakado, and H. Hashimoto, High serum bilirubin level is inversely associated with the presence of carotid plaque. Stroke, 2001. 32(2): p. 580-3.
51. Kronenberg, F., H. Coon, A. Gutin, V. Abkevich, M.E. Samuels, D.G. Ballinger, P.N. Hopkins, and S.C. Hunt, A genome scan for loci influencing anti-atherogenic serum bilirubin levels. Eur J Hum Genet, 2002. 10(9): p. 539-46.
52. Endler, G., A. Hamwi, R. Sunder-Plassmann, M. Exner, T. Vukovich, C. Mannhalter, J. Wojta, K. Huber, and O. Wagner, Is low serum bilirubin an independent risk factor for coronary artery disease in men but not in women? Clin Chem, 2003. 49(7): p. 1201-4.
53. Vitek, L., L. Novotny, M. Sperl, R. Holaj, and J. Spacil, The inverse association of elevated serum bilirubin levels with subclinical carotid atherosclerosis. Cerebrovasc Dis, 2006. 21(5-6): p. 408-14.
54. Yilmaz, N., H.K. Cicek, A. Celik, and V. Davutoglu, Diagnostic value of bilirubin concentrations compared with novel and traditional biomarkers in atherosclerosis with coronary artery disease. Saudi Med J, 2006. 27(8): p. 1262-4.
55. Erdogan, D., H. Gullu, E. Yildirim, D. Tok, I. Kirbas, O. Ciftci, S.T. Baycan, and H. Muderrisoglu, Low serum bilirubin levels are independently and inversely related to impaired flow-mediated vasodilation and increased carotid intima-media thickness in both men and women. Atherosclerosis, 2006. 184(2): p. 431-7.
56. Yilmaz, N., H.K. Cicek, A. Celik, I. Meram, R. Kocabas, and V. Davutoglu, Diagnostic value of homocysteine, C-reactive protein and bilirubin for coronary artery disease. East Mediterr Health J, 2007. 13(3): p. 522-35.
57. Perlstein, T.S., R.L. Pande, M.A. Creager, J. Weuve, and J.A. Beckman, Serum total bilirubin level, prevalent stroke, and stroke

64
outcomes: NHANES 1999-2004. Am J Med, 2008. 121(9): p. 781-788.
58. Djousse, L., D. Levy, L.A. Cupples, J.C. Evans, R.B. D'Agostino, and R.C. Ellison, Total serum bilirubin and risk of cardiovascular disease in the Framingham offspring study. Am J Cardiol, 2001. 87(10): p. 1196-200.
59. Djousse, L., K.J. Rothman, L.A. Cupples, D. Levy, and R.C. Ellison, Effect of serum albumin and bilirubin on the risk of myocardial infarction (the Framingham Offspring Study). Am J Cardiol, 2003. 91(4): p. 485-8.
60. Troughton, J.A., J.V. Woodside, I.S. Young, D. Arveiler, P. Amouyel, J. Ferrieres, P. Ducimetiere, C.C. Patterson, F. Kee, J.W. Yarnell, and A. Evans, Bilirubin and coronary heart disease risk in the Prospective Epidemiological Study of Myocardial Infarction (PRIME). Eur J Cardiovasc Prev Rehabil, 2007. 14(1): p. 79-84.
61. Novotny, L. and L. Vitek, Inverse relationship between serum bilirubin and atherosclerosis in men: a meta-analysis of published studies. Exp Biol Med (Maywood), 2003. 228(5): p. 568-71.
62. Kimm, H., J.E. Yun, J. Jo, and S.H. Jee, Low serum bilirubin level as an independent predictor of stroke incidence: a prospective study in Korean men and women. Stroke, 2009. 40(11): p. 3422-7.
63. Gajdos, V., F.M. Petit, C. Perret, A. Mollet-Boudjemline, P. Colin, L. Capel, V. Nicaud, A. Evans, D. Arveiler, F. Parisot, J. Francoual, E. Genin, F. Cambien, and P. Labrune, Further Evidence That the UGT1A1*28 Allele Is Not Associated with Coronary Heart Disease: The ECTIM Study. Clin Chem, 2006. 52(12): p. 2313-4.
64. Lingenhel, A., B. Kollerits, J.P. Schwaiger, S.C. Hunt, R. Gress, P.N. Hopkins, V. Schoenborn, I.M. Heid, and F. Kronenberg, Serum bilirubin levels, UGT1A1 polymorphisms and risk for coronary artery disease. Exp Gerontol, 2008. 43(12): p. 1102-7.
65. Lin, J.P., C.J. O'Donnell, J.P. Schwaiger, L.A. Cupples, A. Lingenhel, S.C. Hunt, S. Yang, and F. Kronenberg, Association between the UGT1A1*28 allele, bilirubin levels, and coronary heart disease in the Framingham Heart Study. Circulation, 2006. 114(14): p. 1476-81.
66. Bosma, P.J., I.M. van der Meer, C.T. Bakker, A. Hofman, M. Paul-Abrahamse, and J.C. Witteman, UGT1A1*28 allele and coronary
65
heart disease: the Rotterdam Study. Clin Chem, 2003. 49(7): p. 1180-1.
67. Perlstein, T.S., R.L. Pande, J.A. Beckman, and M.A. Creager, Serum total bilirubin level and prevalent lower-extremity peripheral arterial disease: National Health and Nutrition Examination Survey (NHANES) 1999 to 2004. Arterioscler Thromb Vasc Biol, 2008. 28(1): p. 166-72.
68. Rantner, B., B. Kollerits, M. Anderwald-Stadler, P. Klein-Weigel, I. Gruber, A. Gehringer, M. Haak, M. Schnapka-Kopf, G. Fraedrich, and F. Kronenberg, Association between the UGT1A1 TA-repeat polymorphism and bilirubin concentration in patients with intermittent claudication: results from the CAVASIC study. Clin Chem, 2008. 54(5): p. 851-7.
69. Ganz, T., Hepcidin, a key regulator of iron metabolism and mediator of anemia of inflammation. Blood, 2003. 102(3): p. 783-8.
70. Galaris, D. and K. Pantopoulos, Oxidative stress and iron homeostasis: mechanistic and health aspects. Crit Rev Clin Lab Sci, 2008. 45(1): p. 1-23.
71. Koppenol, W.H., The Haber-Weiss cycle--70 years later. Redox Rep, 2001. 6(4): p. 229-34.
72. Weinberg, E.D., Microbial pathogens with impaired ability to acquire host iron. Biometals, 2000. 13(1): p. 85-9.
73. Kwon, O.H., S. Kim, D.H. Hahm, S.Y. Lee, and P. Kim, Potential application of the recombinant Escherichia coli-synthesized heme as a bioavailable iron source. J Microbiol Biotechnol, 2009. 19(6): p. 604-9.
74. McKie, A.T., The role of Dcytb in iron metabolism: an update. Biochem Soc Trans, 2008. 36(Pt 6): p. 1239-41.
75. Anderson, G.J. and C.D. Vulpe, Mammalian iron transport. Cell Mol Life Sci, 2009. 66(20): p. 3241-61.
76. Wrighting, D.M. and N.C. Andrews, Iron homeostasis and erythropoiesis. Curr Top Dev Biol, 2008. 82: p. 141-67.

66
77. Knutson, M. and M. Wessling-Resnick, Iron metabolism in the reticuloendothelial system. Crit Rev Biochem Mol Biol, 2003. 38(1): p. 61-88.
78. Anderson, G.J. and D.M. Frazer, Hepatic iron metabolism. Semin Liver Dis, 2005. 25(4): p. 420-32.
79. Feder, J.N., A. Gnirke, W. Thomas, Z. Tsuchihashi, D.A. Ruddy, A. Basava, F. Dormishian, R. Domingo, Jr., M.C. Ellis, A. Fullan, L.M. Hinton, N.L. Jones, B.E. Kimmel, G.S. Kronmal, P. Lauer, V.K. Lee, D.B. Loeb, F.A. Mapa, E. McClelland, N.C. Meyer, G.A. Mintier, N. Moeller, T. Moore, E. Morikang, R.K. Wolff, and et al., A novel MHC class I-like gene is mutated in patients with hereditary haemochromatosis. Nat Genet, 1996. 13(4): p. 399-408.
80. Distante, S., K.J. Robson, J. Graham-Campbell, A. Arnaiz-Villena, P. Brissot, and M. Worwood, The origin and spread of the HFE-C282Y haemochromatosis mutation. Hum Genet, 2004. 115(4): p. 269-79.
81. Naugler, C., Hemochromatosis: a Neolithic adaptation to cereal grain diets. Med Hypotheses, 2008. 70(3): p. 691-2.
82. Olsson, K.S., B. Ritter, N. Hansson, and R.R. Chowdhury, HLA haplotype map of river valley populations with hemochromatosis traced through five centuries in Central Sweden. Eur J Haematol, 2008. 81(1): p. 36-46.
83. Merryweather-Clarke, A.T., J.J. Pointon, A.M. Jouanolle, J. Rochette, and K.J. Robson, Geography of HFE C282Y and H63D mutations. Genet Test, 2000. 4(2): p. 183-98.
84. Parkkila, S., A. Waheed, R.S. Britton, J.N. Feder, Z. Tsuchihashi, R.C. Schatzman, B.R. Bacon, and W.S. Sly, Immunohistochemistry of HLA-H, the protein defective in patients with hereditary hemochromatosis, reveals unique pattern of expression in gastrointestinal tract. Proc Natl Acad Sci U S A, 1997. 94(6): p. 2534-9.
85. Olynyk, J.K., D. Trinder, G.A. Ramm, R.S. Britton, and B.R. Bacon, Hereditary hemochromatosis in the post-HFE era. Hepatology, 2008. 48(3): p. 991-1001.
86. Gurrin, L.C., N.A. Bertalli, G.W. Dalton, N.J. Osborne, C.C. Constantine, C.E. McLaren, D.R. English, D.M. Gertig, M.B. Delatycki, A.J. Nicoll, M.C. Southey, J.L. Hopper, G.G. Giles, G.J. Anderson, J.K. Olynyk, L.W. Powell, and K.J. Allen, HFE
67
C282Y/H63D compound heterozygotes are at low risk of hemochromatosis-related morbidity. Hepatology, 2009. 50(1): p. 94-101.
87. Risch, N., Haemochromatosis, HFE and genetic complexity. Nat Genet, 1997. 17(4): p. 375-6.
88. Cullen, L.M., X. Gao, S. Easteal, and E.C. Jazwinska, The hemochromatosis 845 G-->A and 187 C-->G mutations: prevalence in non-Caucasian populations. Am J Hum Genet, 1998. 62(6): p. 1403-7.
89. Pedersen, P., G.V. Melsen, and N. Milman, Frequencies of the haemochromatosis gene (HFE) variants C282Y, H63D and S65C in 6,020 ethnic Danish men. Ann Hematol, 2008. 87(9): p. 735-40.
90. World Health Organization., Worldwide prevalence of anaemia 1993-2005 : WHO global database on anaemia. 2008, Geneva: World Health Organization. 40 p.
91. Boy, E., V. Mannar, C. Pandav, B. de Benoist, F. Viteri, O. Fontaine, and C. Hotz, Achievements, challenges, and promising new approaches in vitamin and mineral deficiency control. Nutr Rev, 2009. 67 Suppl 1: p. S24-30.
92. Swinkels, D.W., M.C. Janssen, J. Bergmans, and J.J. Marx, Hereditary hemochromatosis: genetic complexity and new diagnostic approaches. Clin Chem, 2006. 52(6): p. 950-68.
93. Adams, P.C., D.M. Reboussin, J.C. Barton, C.E. McLaren, J.H. Eckfeldt, G.D. McLaren, F.W. Dawkins, R.T. Acton, E.L. Harris, V.R. Gordeuk, C. Leiendecker-Foster, M. Speechley, B.M. Snively, J.L. Holup, E. Thomson, and P. Sholinsky, Hemochromatosis and iron-overload screening in a racially diverse population. N Engl J Med, 2005. 352(17): p. 1769-78.
94. Pedersen, P. and N. Milman, Extrinsic factors modifying expressivity of the HFE variant C282Y, H63D, S65C phenotypes in 1,294 Danish men. Ann Hematol, 2009. 88(10): p. 957-65.
95. Deugnier, Y., A.M. Jouanolle, J. Chaperon, R. Moirand, C. Pithois, J.F. Meyer, M. Pouchard, B. Lafraise, A. Brigand, C. Caserio-Schoenemann, J. Mosser, P. Adams, J.Y. Le Gall, and V. David, Gender-specific phenotypic expression and screening strategies in C282Y-linked haemochromatosis: a study of 9396 French people. Br J Haematol, 2002. 118(4): p. 1170-8.
68
96. Moirand, R., P.C. Adams, V. Bicheler, P. Brissot, and Y. Deugnier, Clinical features of genetic hemochromatosis in women compared with men. Ann Intern Med, 1997. 127(2): p. 105-10.
97. Pedersen, P. and N. Milman, Genetic screening for HFE hemochromatosis in 6,020 Danish men: penetrance of C282Y, H63D, and S65C variants. Ann Hematol, 2009. 88(8): p. 775-84.
98. Parkkinen, J., L. von Bonsdorff, F. Ebeling, and L. Sahlstedt, Function and therapeutic development of apotransferrin. Vox Sang, 2002. 83 Suppl 1: p. 321-6.
99. He, Q.Y., A.B. Mason, V. Nguyen, R.T. MacGillivray, and R.C. Woodworth, The chloride effect is related to anion binding in determining the rate of iron release from the human transferrin N-lobe. Biochem J, 2000. 350 Pt 3: p. 909-15.
100. Kasvosve, I. and J. Delanghe, Total iron binding capacity and transferrin concentration in the assessment of iron status. Clin Chem Lab Med, 2002. 40(10): p. 1014-8.
101. Kasvosve, I., J.R. Delanghe, Z.A. Gomo, I.T. Gangaidzo, H. Khumalo, B. Wuyts, E. Mvundura, T. Saungweme, V.M. Moyo, J.R. Boelaert, and V.R. Gordeuk, Transferrin polymorphism influences iron status in blacks. Clin Chem, 2000. 46(10): p. 1535-9.
102. Cook, J.D., Diagnosis and management of iron-deficiency anaemia. Best Pract Res Clin Haematol, 2005. 18(2): p. 319-32.
103. Adams, P.C., Population screening for haemochromatosis. Gut, 2000. 46(3): p. 301-3.
104. Adams, P.C., Nonexpressing homozygotes for C282Y hemochromatosis: minority or majority of cases? Mol Genet Metab, 2000. 71(1-2): p. 81-6.
105. Adams, P.C., J.C. Gregor, A.E. Kertesz, and L.S. Valberg, Screening blood donors for hereditary hemochromatosis: decision analysis model based on a 30-year database. Gastroenterology, 1995. 109(1): p. 177-88.
106. Torti, F.M. and S.V. Torti, Regulation of ferritin genes and protein. Blood, 2002. 99(10): p. 3505-16.

69
107. Harrison, P.M. and P. Arosio, The ferritins: molecular properties, iron storage function and cellular regulation. Biochim Biophys Acta, 1996. 1275(3): p. 161-203.
108. Arosio, P., M. Yokota, and J.W. Drysdale, Structural and immunological relationships of isoferritins in normal and malignant cells. Cancer Res, 1976. 36(5): p. 1735-9.
109. Levi, S., S.J. Yewdall, P.M. Harrison, P. Santambrogio, A. Cozzi, E. Rovida, A. Albertini, and P. Arosio, Evidence of H- and L-chains have co-operative roles in the iron-uptake mechanism of human ferritin. Biochem J, 1992. 288 ( Pt 2): p. 591-6.
110. Yamanishi, H., S. Kimura, N. Hata, S. Iyama, Y. Kanakura, and Y. Iwatani, Evaluation of a model of latent pathologic factors in relation to serum ferritin elevation. Clin Biochem, 2007. 40(5-6): p. 359-64.
111. Iancu, T.C., Y. Deugnier, J.W. Halliday, L.W. Powell, and P. Brissot, Ultrastructural sequences during liver iron overload in genetic hemochromatosis. J Hepatol, 1997. 27(4): p. 628-38.
112. Knovich, M.A., J.A. Storey, L.G. Coffman, S.V. Torti, and F.M. Torti, Ferritin for the clinician. Blood Rev, 2009. 23(3): p. 95-104.
113. Lipschitz, D.A., J.D. Cook, and C.A. Finch, A clinical evaluation of serum ferritin as an index of iron stores. N Engl J Med, 1974. 290(22): p. 1213-6.
114. Mast, A.E., M.A. Blinder, A.M. Gronowski, C. Chumley, and M.G. Scott, Clinical utility of the soluble transferrin receptor and comparison with serum ferritin in several populations. Clin Chem, 1998. 44(1): p. 45-51.
115. Finch, C.A., V. Bellotti, S. Stray, D.A. Lipschitz, J.D. Cook, M.J. Pippard, and H.A. Huebers, Plasma ferritin determination as a diagnostic tool. West J Med, 1986. 145(5): p. 657-63.
116. Kukulj, S., M. Jaganjac, M. Boranic, S. Krizanac, Z. Santic, and M. Poljak-Blazi, Altered iron metabolism, inflammation, transferrin receptors, and ferritin expression in non-small-cell lung cancer. Med Oncol, 2009.
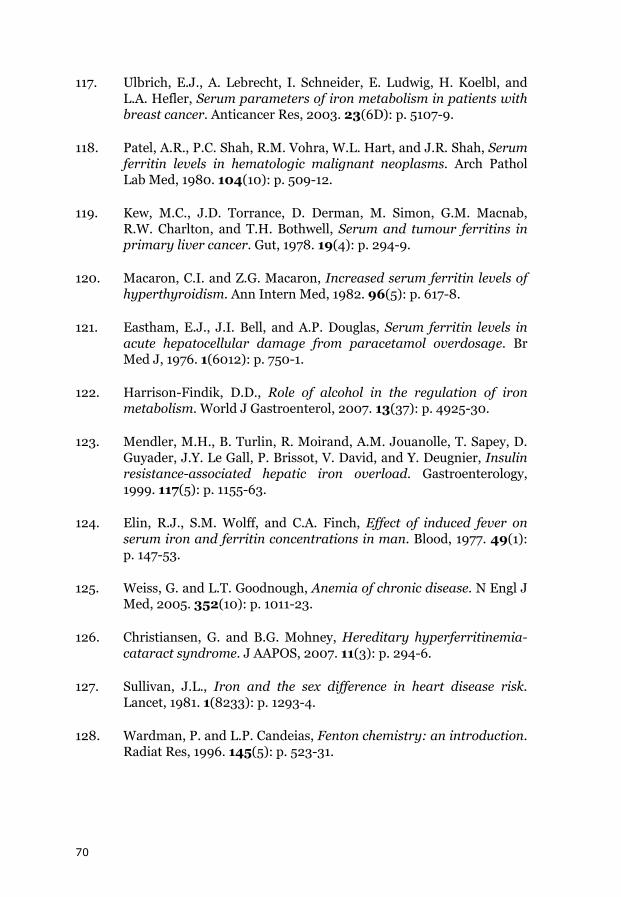
70
117. Ulbrich, E.J., A. Lebrecht, I. Schneider, E. Ludwig, H. Koelbl, and L.A. Hefler, Serum parameters of iron metabolism in patients with breast cancer. Anticancer Res, 2003. 23(6D): p. 5107-9.
118. Patel, A.R., P.C. Shah, R.M. Vohra, W.L. Hart, and J.R. Shah, Serum ferritin levels in hematologic malignant neoplasms. Arch Pathol Lab Med, 1980. 104(10): p. 509-12.
119. Kew, M.C., J.D. Torrance, D. Derman, M. Simon, G.M. Macnab, R.W. Charlton, and T.H. Bothwell, Serum and tumour ferritins in primary liver cancer. Gut, 1978. 19(4): p. 294-9.
120. Macaron, C.I. and Z.G. Macaron, Increased serum ferritin levels of hyperthyroidism. Ann Intern Med, 1982. 96(5): p. 617-8.
121. Eastham, E.J., J.I. Bell, and A.P. Douglas, Serum ferritin levels in acute hepatocellular damage from paracetamol overdosage. Br Med J, 1976. 1(6012): p. 750-1.
122. Harrison-Findik, D.D., Role of alcohol in the regulation of iron metabolism. World J Gastroenterol, 2007. 13(37): p. 4925-30.
123. Mendler, M.H., B. Turlin, R. Moirand, A.M. Jouanolle, T. Sapey, D. Guyader, J.Y. Le Gall, P. Brissot, V. David, and Y. Deugnier, Insulin resistance-associated hepatic iron overload. Gastroenterology, 1999. 117(5): p. 1155-63.
124. Elin, R.J., S.M. Wolff, and C.A. Finch, Effect of induced fever on serum iron and ferritin concentrations in man. Blood, 1977. 49(1): p. 147-53.
125. Weiss, G. and L.T. Goodnough, Anemia of chronic disease. N Engl J Med, 2005. 352(10): p. 1011-23.
126. Christiansen, G. and B.G. Mohney, Hereditary hyperferritinemia-cataract syndrome. J AAPOS, 2007. 11(3): p. 294-6.
127. Sullivan, J.L., Iron and the sex difference in heart disease risk. Lancet, 1981. 1(8233): p. 1293-4.
128. Wardman, P. and L.P. Candeias, Fenton chemistry: an introduction. Radiat Res, 1996. 145(5): p. 523-31.
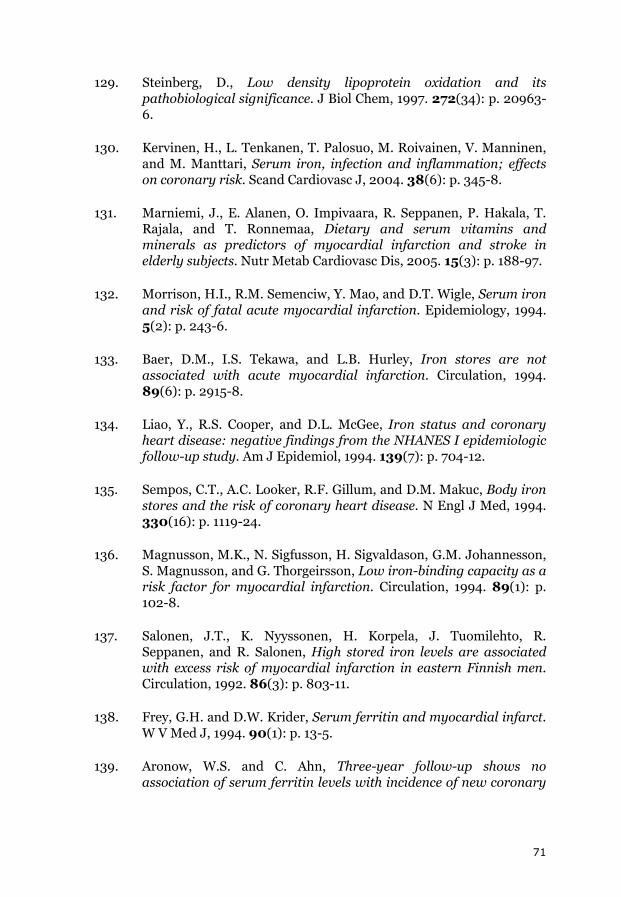
71
129. Steinberg, D., Low density lipoprotein oxidation and its pathobiological significance. J Biol Chem, 1997. 272(34): p. 20963-6.
130. Kervinen, H., L. Tenkanen, T. Palosuo, M. Roivainen, V. Manninen, and M. Manttari, Serum iron, infection and inflammation; effects on coronary risk. Scand Cardiovasc J, 2004. 38(6): p. 345-8.
131. Marniemi, J., E. Alanen, O. Impivaara, R. Seppanen, P. Hakala, T. Rajala, and T. Ronnemaa, Dietary and serum vitamins and minerals as predictors of myocardial infarction and stroke in elderly subjects. Nutr Metab Cardiovasc Dis, 2005. 15(3): p. 188-97.
132. Morrison, H.I., R.M. Semenciw, Y. Mao, and D.T. Wigle, Serum iron and risk of fatal acute myocardial infarction. Epidemiology, 1994. 5(2): p. 243-6.
133. Baer, D.M., I.S. Tekawa, and L.B. Hurley, Iron stores are not associated with acute myocardial infarction. Circulation, 1994. 89(6): p. 2915-8.
134. Liao, Y., R.S. Cooper, and D.L. McGee, Iron status and coronary heart disease: negative findings from the NHANES I epidemiologic follow-up study. Am J Epidemiol, 1994. 139(7): p. 704-12.
135. Sempos, C.T., A.C. Looker, R.F. Gillum, and D.M. Makuc, Body iron stores and the risk of coronary heart disease. N Engl J Med, 1994. 330(16): p. 1119-24.
136. Magnusson, M.K., N. Sigfusson, H. Sigvaldason, G.M. Johannesson, S. Magnusson, and G. Thorgeirsson, Low iron-binding capacity as a risk factor for myocardial infarction. Circulation, 1994. 89(1): p. 102-8.
137. Salonen, J.T., K. Nyyssonen, H. Korpela, J. Tuomilehto, R. Seppanen, and R. Salonen, High stored iron levels are associated with excess risk of myocardial infarction in eastern Finnish men. Circulation, 1992. 86(3): p. 803-11.
138. Frey, G.H. and D.W. Krider, Serum ferritin and myocardial infarct. W V Med J, 1994. 90(1): p. 13-5.
139. Aronow, W.S. and C. Ahn, Three-year follow-up shows no association of serum ferritin levels with incidence of new coronary

72
events in 577 persons aged > or = 62 years. Am J Cardiol, 1996. 78(6): p. 678-9.
140. Manttari, M., V. Manninen, J.K. Huttunen, T. Palosuo, C. Ehnholm, O.P. Heinonen, and M.H. Frick, Serum ferritin and ceruloplasmin as coronary risk factors. Eur Heart J, 1994. 15(12): p. 1599-603.
141. Tuomainen, T.P., K. Punnonen, K. Nyyssonen, and J.T. Salonen, Association between body iron stores and the risk of acute myocardial infarction in men. Circulation, 1998. 97(15): p. 1461-6.
142. Brittenham, G.M., H.G. Klein, J.P. Kushner, and R.S. Ajioka, Preserving the national blood supply. Hematology Am Soc Hematol Educ Program, 2001: p. 422-32.
143. Salonen, J.T., T.P. Tuomainen, R. Salonen, T.A. Lakka, and K. Nyyssonen, Donation of blood is associated with reduced risk of myocardial infarction. The Kuopio Ischaemic Heart Disease Risk Factor Study. Am J Epidemiol, 1998. 148(5): p. 445-51.
144. Meyers, D.G., D. Strickland, P.A. Maloley, J.K. Seburg, J.E. Wilson, and B.F. McManus, Possible association of a reduction in cardiovascular events with blood donation. Heart, 1997. 78(2): p. 188-93.
145. Ascherio, A., E.B. Rimm, E. Giovannucci, W.C. Willett, and M.J. Stampfer, Blood donations and risk of coronary heart disease in men. Circulation, 2001. 103(1): p. 52-7.
146. Meyers, D.G., K.C. Jensen, and J.E. Menitove, A historical cohort study of the effect of lowering body iron through blood donation on incident cardiac events. Transfusion, 2002. 42(9): p. 1135-9.
147. van der, A.D., D.E. Grobbee, M. Roest, J.J. Marx, H.A. Voorbij, and Y.T. van der Schouw, Serum ferritin is a risk factor for stroke in postmenopausal women. Stroke, 2005. 36(8): p. 1637-41.
148. Kiechl, S., J. Willeit, G. Egger, W. Poewe, and F. Oberhollenzer, Body iron stores and the risk of carotid atherosclerosis: prospective results from the Bruneck study. Circulation, 1997. 96(10): p. 3300-7.
149. Ellervik, C., A. Tybjaerg-Hansen, P. Grande, M. Appleyard, and B.G. Nordestgaard, Hereditary hemochromatosis and risk of ischemic
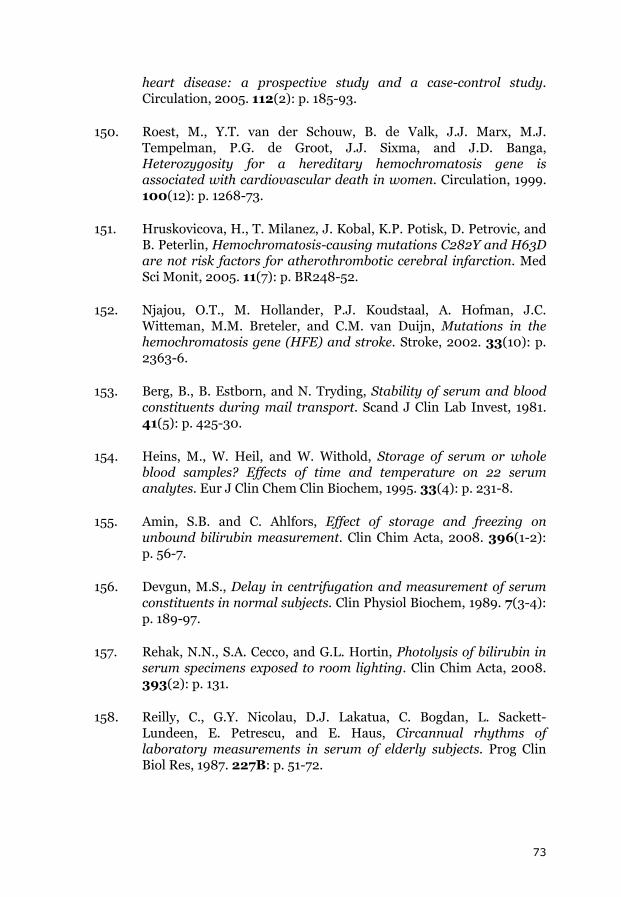
73
heart disease: a prospective study and a case-control study. Circulation, 2005. 112(2): p. 185-93.
150. Roest, M., Y.T. van der Schouw, B. de Valk, J.J. Marx, M.J. Tempelman, P.G. de Groot, J.J. Sixma, and J.D. Banga, Heterozygosity for a hereditary hemochromatosis gene is associated with cardiovascular death in women. Circulation, 1999. 100(12): p. 1268-73.
151. Hruskovicova, H., T. Milanez, J. Kobal, K.P. Potisk, D. Petrovic, and B. Peterlin, Hemochromatosis-causing mutations C282Y and H63D are not risk factors for atherothrombotic cerebral infarction. Med Sci Monit, 2005. 11(7): p. BR248-52.
152. Njajou, O.T., M. Hollander, P.J. Koudstaal, A. Hofman, J.C. Witteman, M.M. Breteler, and C.M. van Duijn, Mutations in the hemochromatosis gene (HFE) and stroke. Stroke, 2002. 33(10): p. 2363-6.
153. Berg, B., B. Estborn, and N. Tryding, Stability of serum and blood constituents during mail transport. Scand J Clin Lab Invest, 1981. 41(5): p. 425-30.
154. Heins, M., W. Heil, and W. Withold, Storage of serum or whole blood samples? Effects of time and temperature on 22 serum analytes. Eur J Clin Chem Clin Biochem, 1995. 33(4): p. 231-8.
155. Amin, S.B. and C. Ahlfors, Effect of storage and freezing on unbound bilirubin measurement. Clin Chim Acta, 2008. 396(1-2): p. 56-7.
156. Devgun, M.S., Delay in centrifugation and measurement of serum constituents in normal subjects. Clin Physiol Biochem, 1989. 7(3-4): p. 189-97.
157. Rehak, N.N., S.A. Cecco, and G.L. Hortin, Photolysis of bilirubin in serum specimens exposed to room lighting. Clin Chim Acta, 2008. 393(2): p. 131.
158. Reilly, C., G.Y. Nicolau, D.J. Lakatua, C. Bogdan, L. Sackett-Lundeen, E. Petrescu, and E. Haus, Circannual rhythms of laboratory measurements in serum of elderly subjects. Prog Clin Biol Res, 1987. 227B: p. 51-72.

74
159. Miyake, K., N. Miyake, S. Kondo, Y. Tabe, A. Ohsaka, and T. Miida, Seasonal variation in liver function tests: a time-series analysis of outpatient data. Ann Clin Biochem, 2009. 46(Pt 5): p. 377-84.
160. Meyer, B.H., H.E. Scholtz, R. Schall, F.O. Muller, H.K. Hundt, and J.S. Maree, The effect of fasting on total serum bilirubin concentrations. Br J Clin Pharmacol, 1995. 39(2): p. 169-71.
161. Young, D.S., Effects of drugs on clinical laboratory tests. 4th ed. 1995, Washington, DC: AACC Press. 1 v. (various pagings).
162. Kiang, T.K., M.H. Ensom, and T.K. Chang, UDP-glucuronosyltransferases and clinical drug-drug interactions. Pharmacol Ther, 2005. 106(1): p. 97-132.
163. Corson, S.L., Contraceptive steroid effects on nonreproductive organ systems. J Reprod Med, 1986. 31(9 Suppl): p. 865-78.
164. Letellier, G. and F. Desjarlais, Study of seasonal variations for eighteen biochemical parameters over a four-year period. Clin Biochem, 1982. 15(4): p. 206-11.
165. Statland, B.E. and P. Winkel, Relationship of day-to-day variation of serum iron concentrations to iron-binding capacity in healthy young women. Am J Clin Pathol, 1977. 67(1): p. 84-90.
166. Wiltink, W.F., J. Kruithof, C. Mol, M.G. Bos, and H.G. van Eijk, Diurnal and nocturnal variations of the serum iron in normal subjects. Clin Chim Acta, 1973. 49(1): p. 99-104.
167. Favier, A. and D. Ruffieux, Physiological variations of serum levels of copper, zinc, iron and manganese. Biomed Pharmacother, 1983. 37(9-10): p. 462-6.
168. Magnusson, B., L. Hallberg, L. Rossander, and B. Swolin, Iron metabolism and "sports anemia". II. A hematological comparison of elite runners and control subjects. Acta Med Scand, 1984. 216(2): p. 157-64.
169. Nielsen, P. and D. Nachtigall, Iron supplementation in athletes. Current recommendations. Sports Med, 1998. 26(4): p. 207-16.
170. Lehmann, M., M. Huonker, F. Dimeo, N. Heinz, U. Gastmann, N. Treis, J.M. Steinacker, J. Keul, R. Kajewski, and D. Haussinger, Serum amino acid concentrations in nine athletes before and after

75
the 1993 Colmar ultra triathlon. Int J Sports Med, 1995. 16(3): p. 155-9.
171. Porto, G., C. Vicente, J. Fraga, B.M. da Silva, and M. de Sousa, Importance of establishing appropriate local reference values for the screening of hemochromatosis: a study of three different control populations and 136 hemochromatosis family members. Hemochromatosis Clinical and Research Group. J Lab Clin Med, 1992. 119(3): p. 295-305.
172. Wilding, P., J.F. Zilva, and C.E. Wilde, Transport of specimens for clinical chemistry analysis. Ann Clin Biochem, 1977. 14(6): p. 301-6.
173. Driscoll, M.J., Specific protein determinations using immunoelectrophoresis. Ann Clin Biochem, 1973. 10: p. 4.
174. Coyne, D., Iron indices: what do they really mean? Kidney Int Suppl, 2006(101): p. S4-8.
175. McQueen, E.G., Hormonal steroid contraceptives. IV. Adverse reactions and management of the patient. Drugs, 1971. 2(2): p. 138-64.
176. Song, C.S., I.R. Merkatz, A.B. Rifkind, P.N. Gillette, and A. Kappas, The influence of pregnancy and oral contraceptive steroids on the concentration of plasma proteins. Studies with a quantitative immunodiffusion method. Am J Obstet Gynecol, 1970. 108(2): p. 227-31.
177. Poortmans, J.R., Serum protein determination during short exhaustive physical activity. J Appl Physiol, 1971. 30(2): p. 190-2.
178. Ledue, T.B., L.M. Neveux, G.E. Palomaki, R.F. Ritchie, and W.Y. Craig, The relationship between serum levels of lipoprotein(a) and proteins associated with the acute phase response. Clin Chim Acta, 1993. 223(1-2): p. 73-82.
179. Sommariva, D., M. Tirrito, C. Ottomano, D. Bonfiglioli, L. Bellintani, I. Pogliaghi, and A. Fasoli, Serum lipoprotein subfractions before and during low-calorie diet in obese women. Ric Clin Lab, 1985. 15(3): p. 259-66.
180. Lentjes, E.G., J.H. Lindeman, W. van de Bent, and H.M. Berger, Measured versus calculated latent iron binding capacity in plasma of newborns. Ann Clin Biochem, 1995. 32 ( Pt 5): p. 478-81.

76
181. Gleeson, M., L. Herd, and C. Burns, Effect of heat inactivation of HIV on specific serum proteins and tumour markers. Ann Clin Biochem, 1990. 27 ( Pt 6): p. 592-4.
182. Ford, C., F.E. Wells, and J.N. Rogers, Assessment of iron status in association with excess alcohol consumption. Ann Clin Biochem, 1995. 32 ( Pt 6): p. 527-31.
183. Tulikoura, I. and K. Huikuri, Haematological changes during parenteral nutrition of malnourished patients with an enteral disease. Scand J Clin Lab Invest, 1988. 48(2): p. 123-30.
184. Kim, I., E.A. Yetley, and M.S. Calvo, Variations in iron-status measures during the menstrual cycle. Am J Clin Nutr, 1993. 58(5): p. 705-9.
185. Lowik, M.R., J. Schrijver, J. Odink, H. van den Berg, and M. Wedel, Long-term effects of a vegetarian diet on the nutritional status of elderly people (Dutch Nutrition Surveillance System). J Am Coll Nutr, 1990. 9(6): p. 600-9.
186. Mattila, K.S., V. Kuusela, T.T. Pelliniemi, A. Rajamaki, H.L. Kaihola, and K. Juva, Haematological laboratory findings in the elderly: influence of age and sex. Scand J Clin Lab Invest, 1986. 46(5): p. 411-5.
187. Marie, B., M.J. Cals, C. De Jaeger, W. Lowenstein, H. Durand, and O.G. Ekindjian, Indicators of iron status in nonanemic elderly subjects: influence of sex and age. Clin Chem, 1994. 40(9): p. 1779-81.
188. Zamorano, A.F., F. Arnalich, E. Sanchez Casas, A. Sicilia, C. Solis, J.J. Vazquez, and R. Gasalla, Levels of iron, vitamin B12, folic acid and their binding proteins during pregnancy. Acta Haematol, 1985. 74(2): p. 92-6.
189. Custer, E.M., C.A. Finch, R.E. Sobel, and A. Zettner, Population norms for serum ferritin. J Lab Clin Med, 1995. 126(1): p. 88-94.
190. Leggett, B.A., N.N. Brown, S.J. Bryant, L. Duplock, L.W. Powell, and J.W. Halliday, Factors affecting the concentrations of ferritin in serum in a healthy Australian population. Clin Chem, 1990. 36(7): p. 1350-5.

77
191. Stosic, G., R. Vrzic, and L. Kandic, The ferritin reference values determined by DELFIA method. Diag Lab., 1991. 27: p. 59.
192. Leach, C.S., N.M. Cintron, and J.M. Krauhs, Metabolic changes observed in astronauts. J Clin Pharmacol, 1991. 31(10): p. 921-7.
193. Drammeh, B.S., R.L. Schleicher, C.M. Pfeiffer, R.B. Jain, M. Zhang, and P.H. Nguyen, Effects of delayed sample processing and freezing on serum concentrations of selected nutritional indicators. Clin Chem, 2008. 54(11): p. 1883-91.
194. Grasbeck, R., The evolution of the reference value concept. Clin Chem Lab Med, 2004. 42(7): p. 692-7.
195. Felding, P., P. Rustad, A. Martensson, V. Kairisto, L. Franzson, P. Hyltoft Petersen, and A. Uldall, Reference individuals, blood collection, treatment of samples and descriptive data from the questionnaire in the Nordic Reference Interval Project 2000. Scand J Clin Lab Invest, 2004. 64(4): p. 327-42.
196. Rustad, P., P. Felding, A. Lahti, and P. Hyltoft Petersen, Descriptive analytical data and consequences for calculation of common reference intervals in the Nordic Reference Interval Project 2000. Scand J Clin Lab Invest, 2004. 64(4): p. 343-70.
197. Cohen, A., E. White, B. Coxon, R.G. Christensen, M.J. Welch, R.C. Paule, and D.A. Becker, Certification of Bilirubin Srm-916a. Fresenius Journal of Analytical Chemistry, 1990. 338(4): p. 426-429.
198. Technology, N.I.o.S.a. Certificate of Analysis Standard Reference Material 916a. [cited 2009 09/12]; Available from: https://www-s.nist.gov/srmors/certificates/view_cert2gif.cfm?certificate=916a
199. Lo, S.F., H.J. Kytzia, G. Schumann, M. Swartzentruber, H.L. Vader, F. Weber, and B.T. Doumas, Interlaboratory comparison of the Doumas bilirubin reference method. Clin Biochem, 2009. 42(12): p. 1328-30.
200. Urdal, P., B. Bolann, S. Marstein, P. Rustad, H. Steensland, and A. Asberg, [Updated reference intervals for clinical chemical components]. Tidsskr Nor Laegeforen, 2004. 124(11): p. 1515-7.
201. Valcour, A.A., G. Krzymowski, M. Onoroski, G.N. Bowers, Jr., and R.B. McComb, Proposed reference method for iron in serum used to
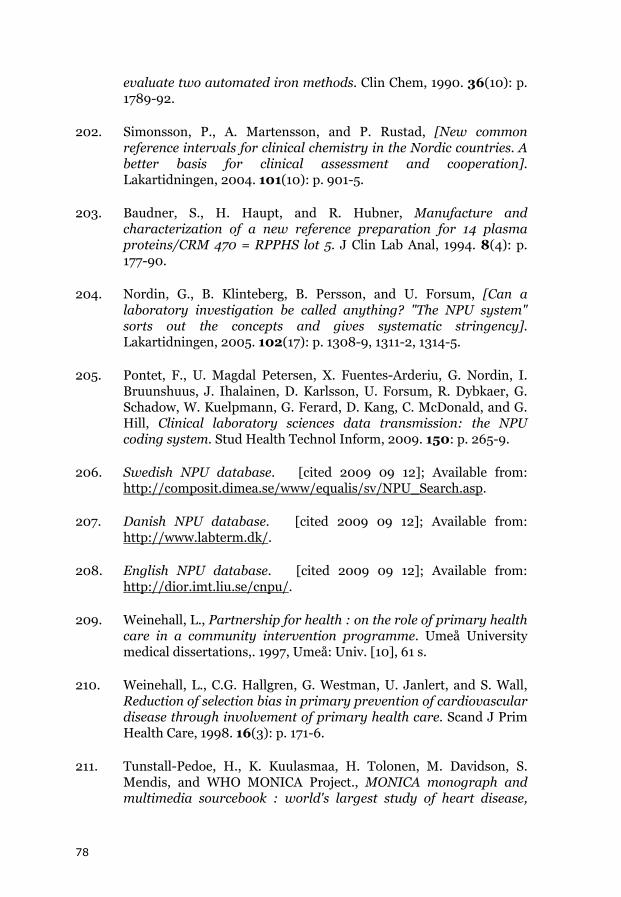
78
evaluate two automated iron methods. Clin Chem, 1990. 36(10): p. 1789-92.
202. Simonsson, P., A. Martensson, and P. Rustad, [New common reference intervals for clinical chemistry in the Nordic countries. A better basis for clinical assessment and cooperation]. Lakartidningen, 2004. 101(10): p. 901-5.
203. Baudner, S., H. Haupt, and R. Hubner, Manufacture and characterization of a new reference preparation for 14 plasma proteins/CRM 470 = RPPHS lot 5. J Clin Lab Anal, 1994. 8(4): p. 177-90.
204. Nordin, G., B. Klinteberg, B. Persson, and U. Forsum, [Can a laboratory investigation be called anything? "The NPU system" sorts out the concepts and gives systematic stringency]. Lakartidningen, 2005. 102(17): p. 1308-9, 1311-2, 1314-5.
205. Pontet, F., U. Magdal Petersen, X. Fuentes-Arderiu, G. Nordin, I. Bruunshuus, J. Ihalainen, D. Karlsson, U. Forsum, R. Dybkaer, G. Schadow, W. Kuelpmann, G. Ferard, D. Kang, C. McDonald, and G. Hill, Clinical laboratory sciences data transmission: the NPU coding system. Stud Health Technol Inform, 2009. 150: p. 265-9.
206. Swedish NPU database. [cited 2009 09 12]; Available from: http://composit.dimea.se/www/equalis/sv/NPU_Search.asp.
207. Danish NPU database. [cited 2009 09 12]; Available from: http://www.labterm.dk/.
208. English NPU database. [cited 2009 09 12]; Available from: http://dior.imt.liu.se/cnpu/.
209. Weinehall, L., Partnership for health : on the role of primary health care in a community intervention programme. Umeå University medical dissertations,. 1997, Umeå: Univ. [10], 61 s.
210. Weinehall, L., C.G. Hallgren, G. Westman, U. Janlert, and S. Wall, Reduction of selection bias in primary prevention of cardiovascular disease through involvement of primary health care. Scand J Prim Health Care, 1998. 16(3): p. 171-6.
211. Tunstall-Pedoe, H., K. Kuulasmaa, H. Tolonen, M. Davidson, S. Mendis, and WHO MONICA Project., MONICA monograph and multimedia sourcebook : world's largest study of heart disease,

79
stroke, risk factors, and population trends 1979-2002. 2003, Geneva: World Health Organization. 244 p. + 2 CD-ROMS.
212. Meschia, J.F., Addressing the heterogeneity of the ischemic stroke phenotype in human genetics research. Stroke, 2002. 33(12): p. 2770-4.
213. Adams, H.P., Jr., B.H. Bendixen, L.J. Kappelle, J. Biller, B.B. Love, D.L. Gordon, and E.E. Marsh, 3rd, Classification of subtype of acute ischemic stroke. Definitions for use in a multicenter clinical trial. TOAST. Trial of Org 10172 in Acute Stroke Treatment. Stroke, 1993. 24(1): p. 35-41.
214. Weinehall, L., O. Johnson, J.H. Jansson, K. Boman, F. Huhtasaari, G. Hallmans, G.H. Dahlen, and S. Wall, Perceived health modifies the effect of biomedical risk factors in the prediction of acute myocardial infarction. An incident case-control study from northern Sweden. J Intern Med, 1998. 243(2): p. 99-107.
215. Johansson, L., J.H. Jansson, B. Stegmayr, T.K. Nilsson, G. Hallmans, and K. Boman, Hemostatic factors as risk markers for intracerebral hemorrhage: a prospective incident case-referent study. Stroke, 2004. 35(4): p. 826-30.
216. Adegoke, O.J., X.O. Shu, Y.T. Gao, Q. Cai, J. Breyer, J. Smith, and W. Zheng, Genetic polymorphisms in uridine diphospho-glucuronosyltransferase 1A1 (UGT1A1) and risk of breast cancer. Breast Cancer Res Treat, 2004. 85(3): p. 239-45.
217. Eriksson, M., B. Stegmayr, and V. Lundberg, MONICA quality assessments. Scand J Public Health Suppl, 2003. 61: p. 25-30.
218. Calculation of Chi-square test for deviation from Hardy-Weinberg equilibrium. [cited 2009 09 12]; Available from: http://www.husdyr.kvl.dk/htm/kc/popgen/genetik/applets/kitest.htm.
219. Zacho, J., A. Tybjaerg-Hansen, J.S. Jensen, P. Grande, H. Sillesen, and B.G. Nordestgaard, Genetically elevated C-reactive protein and ischemic vascular disease. N Engl J Med, 2008. 359(18): p. 1897-908.
220. Genome-wide association study of 14,000 cases of seven common diseases and 3,000 shared controls. Nature, 2007. 447(7145): p. 661-78.

80
221. Erdmann, J., A. Grosshennig, P.S. Braund, I.R. Konig, C. Hengstenberg, A.S. Hall, P. Linsel-Nitschke, S. Kathiresan, B. Wright, D.A. Tregouet, F. Cambien, P. Bruse, Z. Aherrahrou, A.K. Wagner, K. Stark, S.M. Schwartz, V. Salomaa, R. Elosua, O. Melander, B.F. Voight, C.J. O'Donnell, L. Peltonen, D.S. Siscovick, D. Altshuler, P.A. Merlini, F. Peyvandi, L. Bernardinelli, D. Ardissino, A. Schillert, S. Blankenberg, T. Zeller, P. Wild, D.F. Schwarz, L. Tiret, C. Perret, S. Schreiber, N.E. El Mokhtari, A. Schafer, W. Marz, W. Renner, P. Bugert, H. Kluter, J. Schrezenmeir, D. Rubin, S.G. Ball, A.J. Balmforth, H.E. Wichmann, T. Meitinger, M. Fischer, C. Meisinger, J. Baumert, A. Peters, W.H. Ouwehand, P. Deloukas, J.R. Thompson, A. Ziegler, N.J. Samani, and H. Schunkert, New susceptibility locus for coronary artery disease on chromosome 3q22.3. Nat Genet, 2009. 41(3): p. 280-2.
222. Kathiresan, S., B.F. Voight, S. Purcell, K. Musunuru, D. Ardissino, P.M. Mannucci, S. Anand, J.C. Engert, N.J. Samani, H. Schunkert, J. Erdmann, M.P. Reilly, D.J. Rader, T. Morgan, J.A. Spertus, M. Stoll, D. Girelli, P.P. McKeown, C.C. Patterson, D.S. Siscovick, C.J. O'Donnell, R. Elosua, L. Peltonen, V. Salomaa, S.M. Schwartz, O. Melander, D. Altshuler, P.A. Merlini, C. Berzuini, L. Bernardinelli, F. Peyvandi, M. Tubaro, P. Celli, M. Ferrario, R. Fetiveau, N. Marziliano, G. Casari, M. Galli, F. Ribichini, M. Rossi, F. Bernardi, P. Zonzin, A. Piazza, J. Yee, Y. Friedlander, J. Marrugat, G. Lucas, I. Subirana, J. Sala, R. Ramos, J.B. Meigs, G. Williams, D.M. Nathan, C.A. MacRae, A.S. Havulinna, G. Berglund, J.N. Hirschhorn, R. Asselta, S. Duga, M. Spreafico, M.J. Daly, J. Nemesh, J.M. Korn, S.A. McCarroll, A. Surti, C. Guiducci, L. Gianniny, D. Mirel, M. Parkin, N. Burtt, S.B. Gabriel, J.R. Thompson, P.S. Braund, B.J. Wright, A.J. Balmforth, S.G. Ball, A.S. Hall, P. Linsel-Nitschke, W. Lieb, A. Ziegler, I. Konig, C. Hengstenberg, M. Fischer, K. Stark, A. Grosshennig, M. Preuss, H.E. Wichmann, S. Schreiber, W. Ouwehand, P. Deloukas, M. Scholz, F. Cambien, M. Li, Z. Chen, R. Wilensky, W. Matthai, A. Qasim, H.H. Hakonarson, J. Devaney, M.S. Burnett, A.D. Pichard, K.M. Kent, L. Satler, J.M. Lindsay, R. Waksman, S.E. Epstein, T. Scheffold, K. Berger, A. Huge, N. Martinelli, O. Olivieri, R. Corrocher, P. McKeown, E. Erdmann, I.R. Konig, H. Holm, G. Thorleifsson, U. Thorsteinsdottir, K. Stefansson, R. Do, C. Xie and D. Siscovick, Genome-wide association of early-onset myocardial infarction with single nucleotide polymorphisms and copy number variants. Nat Genet, 2009. 41(3): p. 334-41.
223. Karvanen, J., K. Silander, F. Kee, L. Tiret, V. Salomaa, K. Kuulasmaa, P.G. Wiklund, J. Virtamo, O. Saarela, C. Perret, M. Perola, L. Peltonen, F. Cambien, J. Erdmann, N.J. Samani, H. Schunkert, and A. Evans, The impact of newly identified loci on

81
coronary heart disease, stroke and total mortality in the MORGAM prospective cohorts. Genet Epidemiol, 2009. 33(3): p. 237-46.
224. Samani, N.J., J. Erdmann, A.S. Hall, C. Hengstenberg, M. Mangino, B. Mayer, R.J. Dixon, T. Meitinger, P. Braund, H.E. Wichmann, J.H. Barrett, I.R. Konig, S.E. Stevens, S. Szymczak, D.A. Tregouet, M.M. Iles, F. Pahlke, H. Pollard, W. Lieb, F. Cambien, M. Fischer, W. Ouwehand, S. Blankenberg, A.J. Balmforth, A. Baessler, S.G. Ball, T.M. Strom, I. Braenne, C. Gieger, P. Deloukas, M.D. Tobin, A. Ziegler, J.R. Thompson, and H. Schunkert, Genomewide association analysis of coronary artery disease. N Engl J Med, 2007. 357(5): p. 443-53.
225. Samani, N.J., P. Deloukas, J. Erdmann, C. Hengstenberg, K. Kuulasmaa, R. McGinnis, H. Schunkert, N. Soranzo, J. Thompson, L. Tiret, and A. Ziegler, Large scale association analysis of novel genetic loci for coronary artery disease. Arterioscler Thromb Vasc Biol, 2009. 29(5): p. 774-80.
226. Helgadottir, A., G. Thorleifsson, K.P. Magnusson, S. Gretarsdottir, V. Steinthorsdottir, A. Manolescu, G.T. Jones, G.J. Rinkel, J.D. Blankensteijn, A. Ronkainen, J.E. Jaaskelainen, Y. Kyo, G.M. Lenk, N. Sakalihasan, K. Kostulas, A. Gottsater, A. Flex, H. Stefansson, T. Hansen, G. Andersen, S. Weinsheimer, K. Borch-Johnsen, T. Jorgensen, S.H. Shah, A.A. Quyyumi, C.B. Granger, M.P. Reilly, H. Austin, A.I. Levey, V. Vaccarino, E. Palsdottir, G.B. Walters, T. Jonsdottir, S. Snorradottir, D. Magnusdottir, G. Gudmundsson, R.E. Ferrell, S. Sveinbjornsdottir, J. Hernesniemi, M. Niemela, R. Limet, K. Andersen, G. Sigurdsson, R. Benediktsson, E.L. Verhoeven, J.A. Teijink, D.E. Grobbee, D.J. Rader, D.A. Collier, O. Pedersen, R. Pola, J. Hillert, B. Lindblad, E.M. Valdimarsson, H.B. Magnadottir, C. Wijmenga, G. Tromp, A.F. Baas, Y.M. Ruigrok, A.M. van Rij, H. Kuivaniemi, J.T. Powell, S.E. Matthiasson, J.R. Gulcher, G. Thorgeirsson, A. Kong, U. Thorsteinsdottir, and K. Stefansson, The same sequence variant on 9p21 associates with myocardial infarction, abdominal aortic aneurysm and intracranial aneurysm. Nat Genet, 2008. 40(2): p. 217-24.
227. Tregouet, D.A., I.R. Konig, J. Erdmann, A. Munteanu, P.S. Braund, A.S. Hall, A. Grosshennig, P. Linsel-Nitschke, C. Perret, M. DeSuremain, T. Meitinger, B.J. Wright, M. Preuss, A.J. Balmforth, S.G. Ball, C. Meisinger, C. Germain, A. Evans, D. Arveiler, G. Luc, J.B. Ruidavets, C. Morrison, P. van der Harst, S. Schreiber, K. Neureuther, A. Schafer, P. Bugert, N.E. El Mokhtari, J. Schrezenmeir, K. Stark, D. Rubin, H.E. Wichmann, C. Hengstenberg, W. Ouwehand, A. Ziegler, L. Tiret, J.R. Thompson, F.

82
Cambien, H. Schunkert, and N.J. Samani, Genome-wide haplotype association study identifies the SLC22A3-LPAL2-LPA gene cluster as a risk locus for coronary artery disease. Nat Genet, 2009. 41(3): p. 283-5.
228. Kubo, M., J. Hata, T. Ninomiya, K. Matsuda, K. Yonemoto, T. Nakano, T. Matsushita, K. Yamazaki, Y. Ohnishi, S. Saito, T. Kitazono, S. Ibayashi, K. Sueishi, M. Iida, Y. Nakamura, and Y. Kiyohara, A nonsynonymous SNP in PRKCH (protein kinase C eta) increases the risk of cerebral infarction. Nat Genet, 2007. 39(2): p. 212-7.
229. Pruissen, D.M., L.J. Kappelle, F.R. Rosendaal, and A. Algra, Genetic association studies in ischaemic stroke: replication failure and prospects. Cerebrovasc Dis, 2009. 27(3): p. 290-4.
230. Lanktree, M.B., M. Dichgans, and R.A. Hegele, Advances in genomic analysis of stroke: what have we learned and where are we headed? Stroke, 2010. 41(4): p. 825-32.
231. Yamada, Y., N. Fuku, M. Tanaka, Y. Aoyagi, M. Sawabe, N. Metoki, H. Yoshida, K. Satoh, K. Kato, S. Watanabe, Y. Nozawa, A. Hasegawa, and T. Kojima, Identification of CELSR1 as a susceptibility gene for ischemic stroke in Japanese individuals by a genome-wide association study. Atherosclerosis, 2009. 207(1): p. 144-9.
232. Matarin, M., W.M. Brown, S. Scholz, J. Simon-Sanchez, H.C. Fung, D. Hernandez, J.R. Gibbs, F.W. De Vrieze, C. Crews, A. Britton, C.D. Langefeld, T.G. Brott, R.D. Brown, Jr., B.B. Worrall, M. Frankel, S. Silliman, L.D. Case, A. Singleton, J.A. Hardy, S.S. Rich, and J.F. Meschia, A genome-wide genotyping study in patients with ischaemic stroke: initial analysis and data release. Lancet Neurol, 2007. 6(5): p. 414-20.
233. Ikram, M.A., S. Seshadri, J.C. Bis, M. Fornage, A.L. DeStefano, Y.S. Aulchenko, S. Debette, T. Lumley, A.R. Folsom, E.G. van den Herik, M.J. Bos, A. Beiser, M. Cushman, L.J. Launer, E. Shahar, M. Struchalin, Y. Du, N.L. Glazer, W.D. Rosamond, F. Rivadeneira, M. Kelly-Hayes, O.L. Lopez, J. Coresh, A. Hofman, C. DeCarli, S.R. Heckbert, P.J. Koudstaal, Q. Yang, N.L. Smith, C.S. Kase, K. Rice, T. Haritunians, G. Roks, P.L. de Kort, K.D. Taylor, L.M. de Lau, B.A. Oostra, A.G. Uitterlinden, J.I. Rotter, E. Boerwinkle, B.M. Psaty, T.H. Mosley, C.M. van Duijn, M.M. Breteler, W.T. Longstreth, Jr., and P.A. Wolf, Genomewide association studies of stroke. N Engl J Med, 2009. 360(17): p. 1718-28.

83
234. Hata, J., K. Matsuda, T. Ninomiya, K. Yonemoto, T. Matsushita, Y. Ohnishi, S. Saito, T. Kitazono, S. Ibayashi, M. Iida, Y. Kiyohara, Y. Nakamura, and M. Kubo, Functional SNP in an Sp1-binding site of AGTRL1 gene is associated with susceptibility to brain infarction. Hum Mol Genet, 2007. 16(6): p. 630-9.
235. Gudbjartsson, D.F., H. Holm, S. Gretarsdottir, G. Thorleifsson, G.B. Walters, G. Thorgeirsson, J. Gulcher, E.B. Mathiesen, I. Njolstad, A. Nyrnes, T. Wilsgaard, E.M. Hald, K. Hveem, C. Stoltenberg, G. Kucera, T. Stubblefield, S. Carter, D. Roden, M.C. Ng, L. Baum, W.Y. So, K.S. Wong, J.C. Chan, C. Gieger, H.E. Wichmann, A. Gschwendtner, M. Dichgans, G. Kuhlenbaumer, K. Berger, E.B. Ringelstein, S. Bevan, H.S. Markus, K. Kostulas, J. Hillert, S. Sveinbjornsdottir, E.M. Valdimarsson, M.L. Lochen, R.C. Ma, D. Darbar, A. Kong, D.O. Arnar, U. Thorsteinsdottir, and K. Stefansson, A sequence variant in ZFHX3 on 16q22 associates with atrial fibrillation and ischemic stroke. Nat Genet, 2009. 41(8): p. 876-8.
236. Gretarsdottir, S., G. Thorleifsson, A. Manolescu, U. Styrkarsdottir, A. Helgadottir, A. Gschwendtner, K. Kostulas, G. Kuhlenbaumer, S. Bevan, T. Jonsdottir, H. Bjarnason, J. Saemundsdottir, S. Palsson, D.O. Arnar, H. Holm, G. Thorgeirsson, E.M. Valdimarsson, S. Sveinbjornsdottir, C. Gieger, K. Berger, H.E. Wichmann, J. Hillert, H. Markus, J.R. Gulcher, E.B. Ringelstein, A. Kong, M. Dichgans, D.F. Gudbjartsson, U. Thorsteinsdottir, and K. Stefansson, Risk variants for atrial fibrillation on chromosome 4q25 associate with ischemic stroke. Ann Neurol, 2008. 64(4): p. 402-9.
237. Liu, Y., H.K. Sanoff, H. Cho, C.E. Burd, C. Torrice, K.L. Mohlke, J.G. Ibrahim, N.E. Thomas, and N.E. Sharpless, INK4/ARF transcript expression is associated with chromosome 9p21 variants linked to atherosclerosis. PLoS ONE, 2009. 4(4): p. e5027.
238. Chen, Y.H., L.Y. Chau, J.W. Chen, and S.J. Lin, Serum bilirubin and ferritin levels link heme oxygenase-1 gene promoter polymorphism and susceptibility to coronary artery disease in diabetic patients. Diabetes Care, 2008. 31(8): p. 1615-20.
239. Bäckhed, F., H. Ding, T. Wang, L.V. Hooper, G.Y. Koh, A. Nagy, C.F. Semenkovich, and J.I. Gordon, The gut microbiota as an environmental factor that regulates fat storage. Proceedings of the National Academy of Sciences of the United States of America, 2004. 101(44): p. 15718-15723.
240. He, Z.Q., Y. Zhen, C. Liang, H. Wang, and Z.G. Wu, Vicious cycle composed of gut flora and visceral fat: a novel explanation of the

84
initiation and progression of atherosclerosis. Med Hypotheses, 2008. 70(4): p. 808-11.