panelbook 2016 - tolunacorporate.com · panelbook 2016. contents. toluna panel in 49 countries 5...
TRANSCRIPT

PanelBook 2016


Contents
Toluna Panel in 49 Countries 5
Toluna Partners in 85 Countries 6
Panel Communities - The Americas 7
Argentina 8
Brazil 9
Canada 10
Chile 11
Colombia 12
Ecuador 13
Mexico 14
Peru 15
United States 16
Venezuela 17
Panel Communities - EMEA 18
Austria 19
Belgium 20
Czech Republic 21
Denmark 22
Egypt 23
Finland 24
France 25
Germany 26
Greece 27
Hungary 28
Ireland 29
Italy 30
Netherlands 31
Norway 32
Poland 33
Portugal 34
Romania 35
Russian Federation 36
South Africa 37
Spain 38
Sweden 39
Switzerland 40
Turkey 41
Ukraine 42
United Kingdom 43
Panel Communities - APAC 44
Australia 45
China 46
Hong Kong 47
India 48
Indonesia 49
Japan 50
Korea 51
Malaysia 52
New Zealand 53
Philippines 54
Singapore 55
Taiwan 56
Thailand 57
Vietnam 58
Example profile data
gathered by Toluna 59
Basic 60
Automotive 60
Beauty 61
B2B 61
Finance 61
Health 62
Home & Family 62
Internet 62
Medical Professionals 63
Media 63
Mobile Phone 63
Shopping 64
Sports 64
Travel 65
Video Games 65
Get in touch 66

Data pulled January 2016 | 5
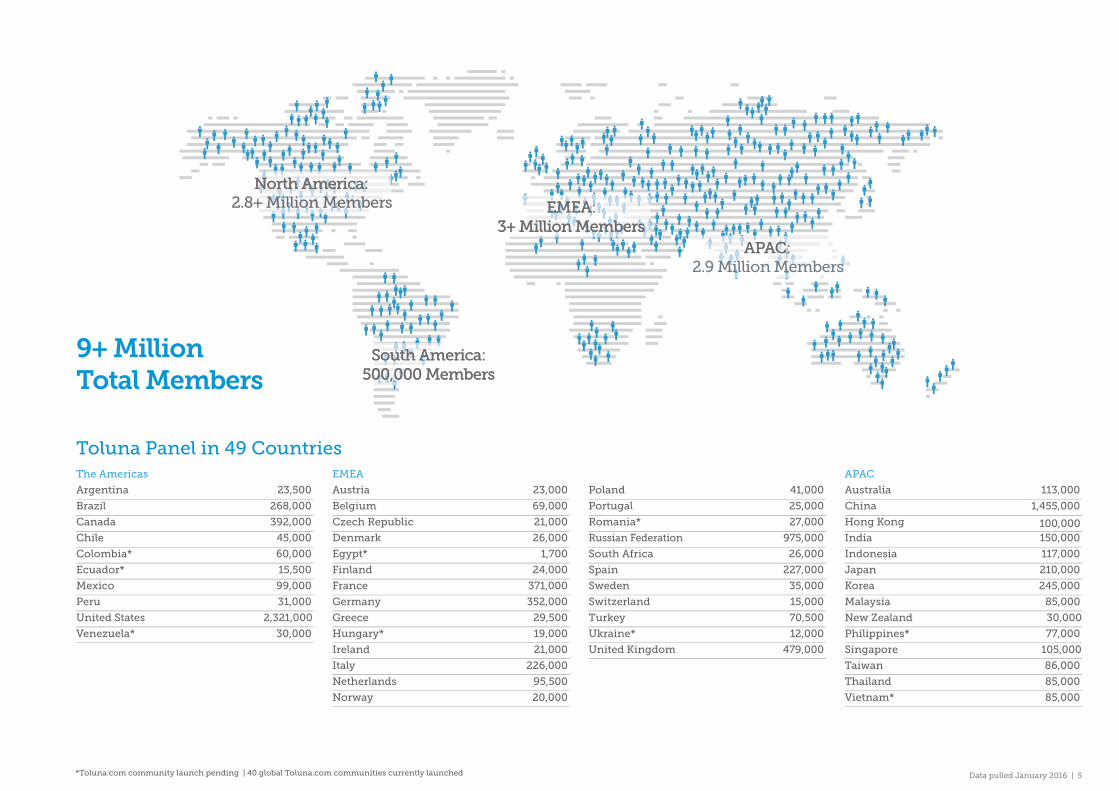
9+ Million Total Members
South America:South America:South America:South America:South America:South America:South America:South America:South America:South America:South America:South America:500,000 Members500,000 Members500,000 Members500,000 Members500,000 Members500,000 Members500,000 Members500,000 Members500,000 Members500,000 Members
EMEA:EMEA:EMEA:EMEA:EMEA:EMEA:EMEA:EMEA:EMEA:EMEA:EMEA:EMEA:EMEA:EMEA:EMEA:3+ Million Members3+ Million Members3+ Million Members3+ Million Members3+ Million Members3+ Million Members3+ Million Members3+ Million Members3+ Million Members3+ Million Members3+ Million Members3+ Million Members3+ Million Members3+ Million Members3+ Million Members3+ Million Members3+ Million Members3+ Million Members3+ Million Members3+ Million Members3+ Million Members3+ Million Members
South America:500,000 Members
EMEA:3+ Million Members
North America:North America:North America:North America:North America:North America:North America:North America:North America:North America:North America:North America:North America:North America:North America:North America:North America:North America:North America:North America:North America:North America:North America:North America:2.5+ Million M2.5+ Millio2.5+ Millio2.5+ Millio2.5+ Millio embers2.5+ Millio emberson Members2.5+ Mi on Memberslion Members2.5+ Millio embers2.5+ Millio embers2.5+ Milli embers2.5+ Milli embers2.5+ Mil n Members2.5+ Mil n Membersllion Memberslion Membersllion Membersllion Membersllion Members2.5+ Million M2.5+ Million M2.5+ Millio embers2.5+ Millio embers2.5+ Million M2.5+ Million M2.5+ Million M
APAC:APAC:APAC:APAC:APAC:APAC:2.7 Million Mon Memberson Membersllion Membersllion Members2.7 Millio2.7 Millio2.7 Millio embers2.7 Million M
North America:2.8+ Million Members
APAC:
Toluna Panel in 49 CountriesThe Americas
Argentina 23,500
Brazil 268,000
Canada 392,000
Chile 45,000
Colombia* 60,000
Ecuador* 15,500
Mexico 99,000
Peru 31,000
United States 2,321,000
Venezuela* 30,000
EMEA
Austria 23,000
Belgium 69,000
Czech Republic 21,000
Denmark 26,000
Egypt* 1,700
Finland 24,000
France 371,000
Germany 352,000
Greece 29,500
Hungary* 19,000
Ireland 21,000
Italy 226,000
Netherlands 95,500
Norway 20,000
Poland 41,000
Portugal 25,000
Romania* 27,000
Russian Federation 975,000
South Africa 26,000
Spain 227,000
Sweden 35,000
Switzerland 15,000
Turkey 70,500
Ukraine* 12,000
United Kingdom 479,000
APAC
Australia 113,000
China 1,455,000
Hong Kong 100,000India 150,000
Indonesia 117,000
Japan 210,000
Korea 245,000
Malaysia 85,000
New Zealand 30,000
Philippines* 77,000
Singapore 105,000
Taiwan 86,000
Thailand 85,000
Vietnam* 85,000
*Toluna.com community launch pending | 40 global Toluna.com communities currently launched
2.9 Million Members

Toluna Partners in 85 CountriesThe Americas
Anguilla
Antiguaand Barbuda
Barbados
Bolivia
BritishVirgin Islands
Cayman Islands
Costa Rica
Cuba
Dominican Republic
El Salvador
Grenada
Guatemala
Guyana
Haiti
Honduras
Jamaica
Montserrat
Nicaragua
Panama
Paraguay
Puerto Rico
St. Kitts and Nevis
St. Lucia
St. VincentGrenadines
Suriname
Trinidad and Tobago
Turks and Caicos
Uruguay
EMEA
Algeria
Bahrain
Belarus
Benin
Bulgaria
Burkina Faso
Burundi
Cameroon
Central AfricanRepublic
Congo
Croatia
Cyprus
Estonia
Ghana
Guinea
Guinea Bissau
Iraq
Ivory Coast
Jordan
Kazakhstan
Kenya
Kuwait
Latvia
Lebanon
Liberia
Lithuania
Madagascar
Mali
Morocco
Mozambique
Niger
Nigeria
Oman
Palestine
Qatar
Rwanda
Senegal
Slovakia
Slovenia
Somalia
Sudan
Swaziland
Syria
Tanzania
Uganda
Yemen
Zambia
Zimbabwe
APAC
Bangladesh
Cambodia
Fiji
Laos
Nepal
Pakistan
Sri Lanka
Data pulled January 2016 | 6
9+ Million Total Members
South America:South America:South America:South America:South America:South America:South America:South America:South America:South America:South America:South America:500,000 Members500,000 Members500,000 Members500,000 Members500,000 Members500,000 Members500,000 Members500,000 Members500,000 Members500,000 Members
EMEA:EMEA:EMEA:EMEA:EMEA:EMEA:EMEA:EMEA:EMEA:EMEA:EMEA:EMEA:EMEA:EMEA:EMEA:3+ Million Members3+ Million Members3+ Million Members3+ Million Members3+ Million Members3+ Million Members3+ Million Members3+ Million Members3+ Million Members3+ Million Members3+ Million Members3+ Million Members3+ Million Members3+ Million Members3+ Million Members3+ Million Members3+ Million Members3+ Million Members3+ Million Members3+ Million Members3+ Million Members3+ Million Members
South America:500,000 Members
EMEA:3+ Million Members
North America:North America:North America:North America:North America:North America:North America:North America:North America:North America:North America:North America:North America:North America:North America:North America:North America:North America:North America:North America:North America:North America:North America:North America:2.5+ Million M2.5+ Millio2.5+ Millio2.5+ Millio2.5+ Millio embers2.5+ Millio emberson Members2.5+ Mi on Memberslion Members2.5+ Millio embers2.5+ Millio embers2.5+ Milli embers2.5+ Milli embers2.5+ Mil n Members2.5+ Mil n Membersllion Memberslion Membersllion Membersllion Membersllion Members2.5+ Million M2.5+ Million M2.5+ Millio embers2.5+ Millio embers2.5+ Million M2.5+ Million M2.5+ Million M
APAC:APAC:APAC:APAC:APAC:APAC:2.7 Million Mon Memberson Membersllion Membersllion Members2.7 Millio2.7 Millio2.7 Millio embers2.7 Million M
North America:
APAC:
2.8+ Million Members
2.9 Million Members

Panel CommunitiesThe Americas

Data pulled January 2016 | 8
Argentina Panel Size: 23,500Language: SpanishSmartphone Penetration: 31%*
Age
Panel Count Nat Rep
18-24 29% 16%
25-34 37% 22%
35-44 19% 18%
45-54 9% 15%
55-99 6% 29%
Gender
Panel Count Nat Rep
Female 57% 52%
Male 43% 48%
Household Income
Panel Count
Less than 25.000 ARS 28%
25.000 to 50.000 ARS 21%
50.000 to 100.000 ARS 18%
100.000 to 200.000 ARS 10%
200.000 to 300.000 ARS 3%
300.000 to 400.000 ARS 4%
400.000 to 500.000 ARS 1%
500.000 to 600.000 ARS 1%
600.000 to 750.000 ARS 0%
750.000 to 1.000.000 ARS 0%
1.000.000 ARS or more 0%
Prefer not to say 14%
Subtotal selection 100%
According to data from December 2015, +/-8% of respondents complete Toluna
surveys via a mobile device*Data pulled from 2015 rankings

Data pulled January 2016 | 9
Age
Panel Count Nat Rep
18-24 24% 18%
25-34 30% 27%
35-44 21% 22%
45-54 14% 17%
55-99 11% 16%
Gender
Panel Count Nat Rep
Female 58% 51%
Male 42% 49%
Household Income
Panel Count
Less than 4600 BRL 33%
4600 to 9299 BRL 11%
9300 to 13 999 BRL 5%
14 000 to 18 999 BRL 4%
19 000 to 22 999 BRL 3%
23 000 to 27 999 BRL 3%
28 000 to 32 999 BRL 2%
33 000 to 36 999 BRL 2%
37 000 to 41 999 BRL 3%
42 000 to 46 999 BRL 2%
47 000 to 69 999 BRL 4%
70 000 to 93 999 BRL 3%
94 000 to 116 999 BRL 2%
117 000 to 175 999 BRL 2%
176 000 to 234 999 BRL 1%
235 000 to 349 999 BRL 1%
350 000 to 469 999 BRL 0%
470 000 BRL or more 1%
Prefer not to say 18%
Subtotal selection 100%
Brazil
Geographic Region
Panel Count
Acre 0%
Alagoas 1%
Amapa 0%
Amazonas 3%
Bahia 4%
Ceara 3%
Espirito Santo 2%
Federal District 2%
Goias 2%
Maranhao 1%
Mato Grosso 1%
Mato Grosso do Sul 1%
Minas Gerais 8%
Para 1%
Paraiba 1%
Parana 5%
Pernambuco 3%
Piaui 1%
Rio Grande do Norte 1%
Rio Grande do Sul 5%
Rio de Janeiro 13%
Rondonia 0%
Roraima 0%
Santa Catarina 3%
Sao Paulo 38%
Sergipe 1%
Tocantins 0%
Panel Size: 268,000Language: PortugueseSmartphone Penetration: 26%*
According to data from December 2015, +/-20% of respondents complete Toluna
surveys via a mobile device*Data pulled from 2015 rankings

Data pulled January 2016 | 10
Age
Panel Count Nat Rep
18-24 33% 12%
25-34 25% 17%
35-44 17% 22%
45-54 13% 20%
55-99 12% 29%
Gender
Panel Count Nat Rep
Female 67% 51%
Male 33% 49%
Household Income
Panel Count
Less than $15,000 12%
$15,000 to $24,999 14%
$25,000 to $34,999 12%
$35,000 to $44,999 10%
$45,000 to $54,999 10%
$55,000 to $64,999 6%
$65,000 to $74,999 6%
$75,000 to $84,999 4%
$85,000 to $94,999 3%
$95,000 to $124,999 6%
$125,000 to $199,999 3%
$200,000 or more 1%
Prefer not to say 13%
Subtotal selection 100%
Geographic Region
Panel Count
Atlantic Canada 7%
British Columbia 10%
Ontario 34%
Prairie Provinces 15%
Quebec 34%
Canada Panel Size: 392,000Language: English, FrenchSmartphone Penetration: 56%*
According to data from December 2015, +/-20% of respondents complete Toluna
surveys via a mobile device*Data pulled from 2015 rankings

Data pulled January 2016 | 11
Age
Panel Count Nat Rep
18-24 17% 17%
25-34 33% 19%
35-44 25% 19%
45-54 13% 19%
55-99 12% 26%
Gender
Panel Count Nat Rep
Female 58% 52%
Male 42% 48%
Household Income
Panel Count
Less than 1 million CLP 27%
1.000.001 to 3.000.000 CLP 17%
3.000.001 to 5.000.000 CLP 9%
5.000.001 to 7.000.000 CLP 6%
7.000.001 to 9.000.000 CLP 5%
9.000.001 to 15.000.000 CLP 9%
15.000.001 to 25.000.000 CLP 7%
25.000.001 to 35.000.000 CLP 3%
35.000.001 to 45.000.000 CLP 2%
45.000.001 to 50.000.000 CLP 1%
50.000.001 CLP or more 1%
Prefer not to say 13%
Subtotal selection 100%
Chile Panel Size: 45,000Language: Spanish
According to data from December 2015, +/-20% of respondents complete Toluna
surveys via a mobile device

Data pulled January 2016 | 12
Age
Panel Count Nat Rep
18-24 21% 19%
25-34 36% 23%
35-44 25% 20%
45-54 13% 18%
55-99 5% 21%
Gender
Panel Count
Female 54%
Male 46%
Household Income
Panel Count
Low Annual Income 15%
Average Annual Income 52%
High Annual Income 7%
Prefer not to say 26%
Subtotal selection 100%
Colombia Panel Size: 60,500Language: Spanish
Data pulled January 2016 | 13
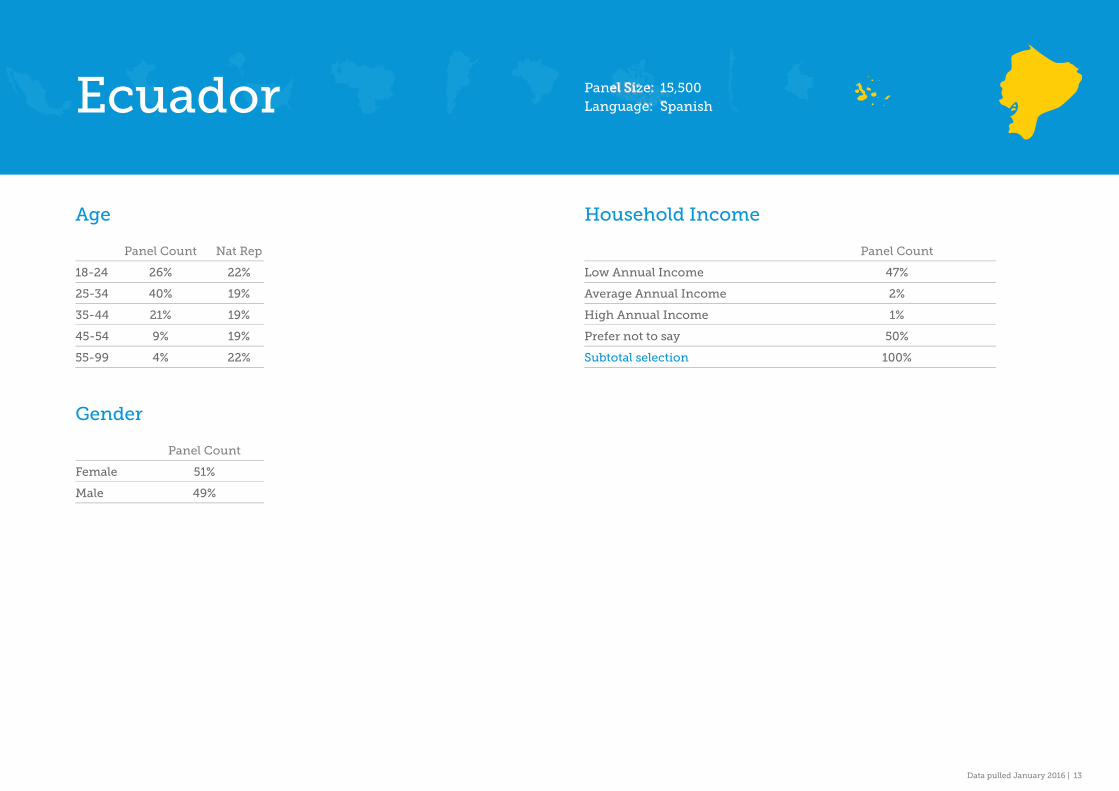
Age
Panel Count Nat Rep
18-24 26% 22%
25-34 40% 19%
35-44 21% 19%
45-54 9% 19%
55-99 4% 22%
Gender
Panel Count
Female 51%
Male 49%
Ecuador
Household Income
Panel Count
Low Annual Income 47%
Average Annual Income 2%
High Annual Income 1%
Prefer not to say 50%
Subtotal selection 100%
Panel Size: 15,500 Language: Spanish

Data pulled January 2016 | 14
Age
Panel Count Nat Rep
18-24 38% 19%
25-34 35% 24%
35-44 15% 21%
45-54 8% 16%
55-99 4% 21%
Gender
Panel Count Nat Rep
Female 48% 52%
Male 52% 48%
Household Income
Panel Count
Less than 20.000 Pesos 21%
20.000 to 39.999 Pesos 9%
40.000 to 59.999 Pesos 6%
60.000 to 79.999 Pesos 6%
80.000 to 99.999 Pesos 8%
100.000 to 119.999 Pesos 5%
120.000 to 139.999 Pesos 4%
140.000 to 159.999 Pesos 3%
160.000 to 179.999 Pesos 2%
180.000 to 199.999 Pesos 3%
200.000 to 299.999 Pesos 4%
300.000 to 399.999 Pesos 4%
400.000 to 499.999 Pesos 2%
500.000 to 749.999 Pesos 2%
750.000 to 999.999 Pesos 1%
1.000.000 to 1.499.999 Pesos 1%
1.500.000 to 2.000.000 Pesos 1%
2.000.000 Pesos or more 1%
Prefer not to say 17%
Subtotal selection 100%
Mexico
Geographic Region
Panel Count
Center 54%
East 14%
North 12%
South 11%
West 9%
Panel Size: 99,000Language: SpanishSmartphone Penetration: 37%*
According to data from December 2015, +/-14% of respondents complete Toluna
surveys via a mobile device*Data pulled from 2015 rankings

Data pulled January 2016 | 15
Age
Panel Count Nat Rep
18-24 42% 20%
25-34 31% 24%
35-44 15% 20%
45-54 8% 16%
55-99 4% 21%
Gender
Panel Count Nat Rep
Female 42% 51%
Male 58% 49%
Household Income
Panel Count
Less than 20.000 PEN 33%
20.000 to 45.000 PEN 19%
45.000 to 85.000 PEN 8%
85.000 to 170.000 PEN 6%
170.000 to 260.000 PEN 3%
260.000 to 350.000 PEN 3%
350.000 to 440.000 PEN 2%
440.000 to 520.000 PEN 1%
520.000 to 650.000 PEN 1%
650.000 to 870.000 PEN 1%
870.000 PEN or more 1%
Prefer not to say 22%
Subtotal selection 100%
Peru Panel Size: 31,000Language: Spanish
According to data from December 2015, +/-13% of respondents complete Toluna
surveys via a mobile device

Data pulled January 2016 | 16
Age
Panel Count Nat Rep
18-24 31% 13%
25-34 27% 19%
35-44 18% 22%
45-54 12% 18%
55-99 12% 28%
Gender
Panel Count Nat Rep
Female 71% 51%
Male 29% 49%
Household Income
Panel Count
Less than $15,000 11%
$15,000 to $24,999 36%
$25,000 to $34,999 7%
$35,000 to $44,999 12%
$45,000 to $54,999 5%
$55,000 to $64,999 6%
$65,000 to $74,999 2%
$75,000 to $84,999 5%
$85,000 to $94,999 2%
$95,000 to $124,999 5%
$125,000 to $199,999 2%
$200,000 or more 1%
Prefer not to say 6%
Subtotal selection 100%
United States
Ethnicity
Panel Count
White 69%
Black or 14%African-American
Native American or 2%Alaska Native
Asian 3%
Native Hawaiian or 1%Other Pacifi c Islander
Other Ethnicity 6%
Don’t know/prefer 5%not to answer
Geographic Region
Panel Count
MidWest 20%
NorthEast 15%
Other 1%
South 40%
West 24%
Panel Size: 2,321,000 Language: English
Smartphone Penetration: 56%*
According to data from December 2015, +/-20% of respondents complete Toluna
surveys via a mobile device*Data pulled from 2015 rankings

Data pulled January 2016 | 17
Age
Panel Count Nat Rep
18-24 25% 22%
25-34 37% 19%
35-44 22% 19%
45-54 11% 19%
55-99 5% 19%
Gender
Panel Count
Female 48%
Male 52%
Venezuela Panel Size: 30,000Language: Spanish
Household Income
Panel Count
Low Annual Income 34%
Average Annual Income 22%
High Annual Income 4%
Prefer not to say 40%
Subtotal selection 100%

Panel CommunitiesEMEA

Data pulled January 2016 | 19
Age
Panel Count Nat Rep
18-24 35% 10%
25-34 25% 15%
35-44 15% 16%
45-54 11% 20%
55-99 14% 38%
Gender
Panel Count Nat Rep
Female 57% 52%
Male 43% 48%
Household Income
Panel Count
Less than 15.000 EUR 25%
15.000 to 19.999 EUR 14%
20.000 to 29.999 EUR 17%
30.000 to 39.999 EUR 10%
40.000 to 49.999 EUR 6%
50.000 to 59.999 EUR 3%
60.000 to 69.999 EUR 2%
70.000 to 79.999 EUR 3%
80.000 to 89.999 EUR 1%
90.000 to 99.999 EUR 1%
100.000 to 149.999 EUR 1%
150.000 to 199.999 EUR 0%
200.000 to 249.999 EUR 0%
250.000 EUR or more 0%
Prefer not to say 17%
Subtotal selection 100%
Austria
Geographic Region
Panel Count
Burgenland 3%
Carinthia 6%
Lower Austria 19%
Salzburg 6%
Styria 14%
Tyrol 7%
Upper Austria 15%
Vienna 26%
Vorarlberg 4%
Panel Size: 23,000Language: GermanSmartphone Penetration: 48%*
According to data from December 2015, +/-25% of respondents complete Toluna
surveys via a mobile device*Data pulled from 2015 rankings

Data pulled January 2016 | 20
Age
Panel Count Nat Rep
18-24 30% 14%
25-34 26% 21%
35-44 18% 25%
45-54 14% 21%
55-99 12% 20%
Gender
Panel Count Nat Rep
Female 59% 52%
Male 41% 48%
Household Income
Panel Count
Less than 15.000 EUR 20%
15.000 to 19.999 EUR 12%
20.000 to 29.999 EUR 16%
30.000 to 39.999 EUR 12%
40.000 to 49.999 EUR 6%
50.000 to 59.999 EUR 3%
60.000 to 69.999 EUR 2%
70.000 to 79.999 EUR 2%
80.000 to 89.999 EUR 1%
90.000 to 99.999 EUR 1%
100.000 to 149.999 EUR 1%
150.000 to 199.999 EUR 0%
200.000 to 249.999 EUR 0%
250.000 EUR or more 0%
Prefer not to say 24%
Subtotal selection 100%
Belgium
Geographic Region
Panel Count
Center 10%
North 56%
South 34%
Panel Size: 69,000Language: Dutch, French, GermanSmartphone Penetration: 34%*
According to data from December 2015, +/-14% of respondents complete Toluna
surveys via a mobile device*Data pulled from 2015 rankings
Data pulled January 2016 | 21
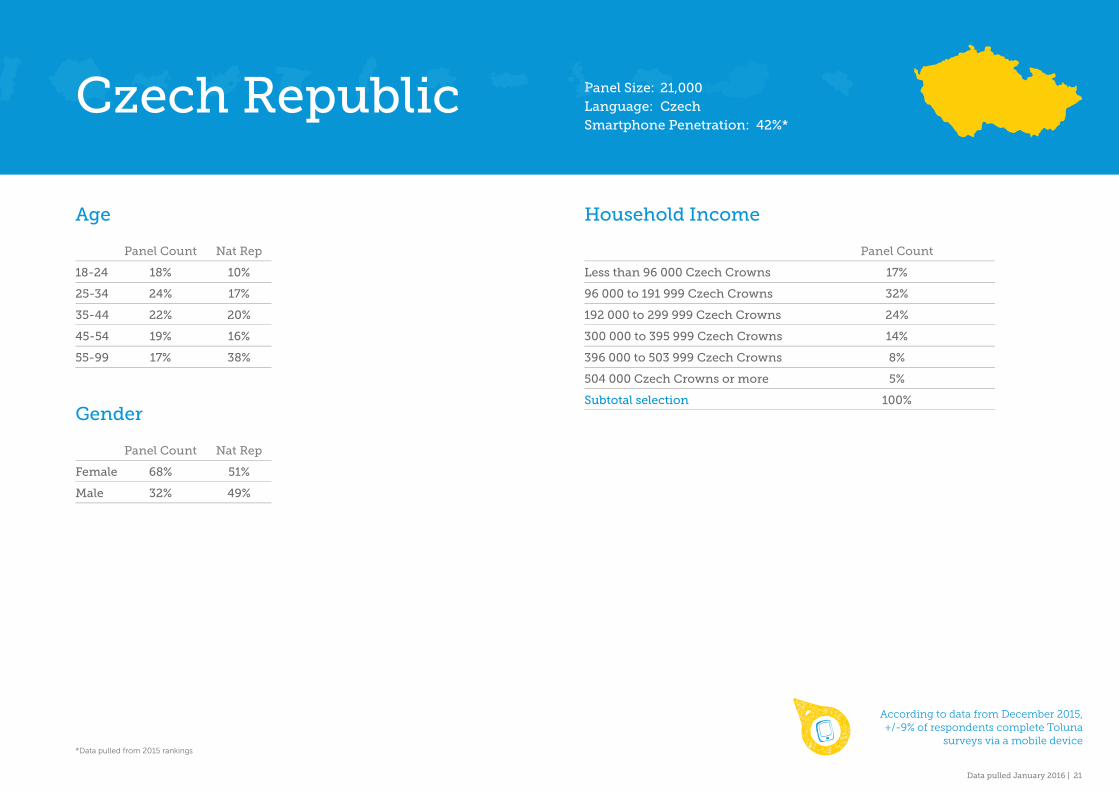
Age
Panel Count Nat Rep
18-24 18% 10%
25-34 24% 17%
35-44 22% 20%
45-54 19% 16%
55-99 17% 38%
Gender
Panel Count Nat Rep
Female 68% 51%
Male 32% 49%
Household Income
Panel Count
Less than 96 000 Czech Crowns 17%
96 000 to 191 999 Czech Crowns 32%
192 000 to 299 999 Czech Crowns 24%
300 000 to 395 999 Czech Crowns 14%
396 000 to 503 999 Czech Crowns 8%
504 000 Czech Crowns or more 5%
Subtotal selection 100%
Czech Republic Panel Size: 21,000Language: CzechSmartphone Penetration: 42%*
According to data from December 2015, +/-9% of respondents complete Toluna
surveys via a mobile device*Data pulled from 2015 rankings

Data pulled January 2016 | 22
Age
Panel Count Nat Rep
18-24 40% 14%
25-34 19% 17%
35-44 15% 18%
45-54 13% 17%
55-99 13% 34%
Gender
Panel Count Nat Rep
Female 50% 51%
Male 50% 49%
Household Income
Panel Count
Less than 110,000 DKK 16%
110,000 to 149,000 DKK 8%
150,000 to 219,000 DKK 10%
220,000 to 299,000 DKK 9%
300,000 to 374,000 DKK 8%
375,000 to 449,000 DKK 6%
450,000 to 519,000 DKK 5%
520,000 to 594,000 DKK 3%
595,000 to 669,000 DKK 3%
670,000 to 744,000 DKK 3%
745,000 to 999 999 DKK 3%
1 to 1,5 million DKK 1%
1,6 to 1,8 million DKK 0%
1,9 million DKK or more 1%
Prefer not to say 24%
Subtotal selection 100%
Denmark
Geographic Region
Panel Count
Copenhagen Capital 30%
Region Central Jutland 25%
Region North Jutland 11%
Region South Denmark 19%
Region Zealand 15%
Panel Size: 26,000Language: DanishSmartphone Penetration: 59%*
According to data from December 2015, +/-26% of respondents complete Toluna
surveys via a mobile device*Data pulled from 2015 rankings

Data pulled January 2016 | 23
Age
Panel Count Nat Rep
18-24 23% 22%
25-34 41% 20%
35-44 21% 20%
45-54 10% 20%
55-99 5% 18%
Gender
Panel Count
Female 15%
Male 85%
Egypt Panel Size: 1,700Language: Arabic
Household Income
Panel Count
Low Annual Income 14%
Average Annual Income 37%
High Annual Income 3%
Prefer not to say 46%
Subtotal selection 100%

Data pulled January 2016 | 24
Age
Panel Count Nat Rep
18-24 29% 11%
25-34 25% 15%
35-44 16% 15%
45-54 14% 17%
55-99 16% 42%
Gender
Panel Count Nat Rep
Female 52% 51%
Male 48% 49%
Household Income
Panel Count
Less than 15.000 EUR 19%
15.000 to 19.999 EUR 8%
20.000 to 29.999 EUR 12%
30.000 to 39.999 EUR 10%
40.000 to 49.999 EUR 7%
50.000 to 59.999 EUR 5%
60.000 to 69.999 EUR 4%
70.000 to 79.999 EUR 3%
80.000 to 89.999 EUR 2%
90.000 to 99.999 EUR 2%
100.000 to 149.999 EUR 2%
150.000 to 199.999 EUR 0%
200.000 to 249.999 EUR 1%
250.000 EUR or more 2%
Prefer not to say 23%
Subtotal selection 100%
Finland
Geographic Region
Panel Count
Aland Islands 0%
Central Finland 5%
Central Ostrobothnia 1%
Eastern Uusimaa 9%
Kainuu 1%
Kymenlaakso 3%
Lapland 3%
North Karelia 2%
Northern Ostrobothnia 7%
Northern Savonia 5%
Ostrobothnia 2%
Paijanne Tavastia 7%
Pirkanmaa 9%
Satakunta 3%
South Karelia 2%
Southern Ostrobothnia 3%
Southern Savonia 2%
Southwest Finland 10%
Tavastia Proper 1%
Uusimaa 25%
Panel Size: 24,000Language: FinnishSmartphone Penetration: 46%*
According to data from December 2015, +/-27% of respondents complete Toluna
surveys via a mobile device*Data pulled from 2015 rankings

Data pulled January 2016 | 25
Age
Panel Count Nat Rep
18-24 26% 12%
25-34 27% 17%
35-44 20% 19%
45-54 14% 18%
55-99 13% 34%
Gender
Panel Count Nat Rep
Female 59% 52%
Male 41% 48%
Household Income
Panel Count
Less than 15.000 EUR 26%
15.000 to 19.999 EUR 14%
20.000 to 29.999 EUR 19%
30.000 to 39.999 EUR 12%
40.000 to 49.999 EUR 6%
50.000 to 59.999 EUR 3%
60.000 to 69.999 EUR 2%
70.000 to 79.999 EUR 1%
80.000 to 89.999 EUR 1%
90.000 to 99.999 EUR 0%
100.000 to 149.999 EUR 1%
150.000 to 199.999 EUR 0%
200.000 to 249.999 EUR 0%
250.000 EUR or more 0%
Prefer not to say 15%
Subtotal selection 100%
France
Geographic Region
Panel Count
BP EST 9%
BP OUEST 10%
CENTRE EST 11%
EST 8%
ILE DE FRANCE 17%
MEDITERRANEE 12%
NORD 8%
OTHER 0%
OUEST 14%
SUD OUEST 11%
Panel Size: 371,000Language: FrenchSmartphone Penetration: 42%*
According to data from December 2015, +/-12% of respondents complete Toluna
surveys via a mobile device*Data pulled from 2015 rankings
Data pulled January 2016 | 26
Age
Panel Count Nat Rep
18-24 32% 9%
25-34 31% 15%
35-44 16% 15%
45-54 13% 20%
55-99 8% 41%
Gender
Panel Count Nat Rep
Female 59% 51%
Male 41% 49%
Household Income
Panel Count
Less than 15.000 EUR 26%
15.000 to 19.999 EUR 10%
20.000 to 29.999 EUR 14%
30.000 to 39.999 EUR 12%
40.000 to 49.999 EUR 7%
50.000 to 59.999 EUR 5%
60.000 to 69.999 EUR 3%
70.000 to 79.999 EUR 2%
80.000 to 89.999 EUR 1%
90.000 to 99.999 EUR 1%
100.000 to 149.999 EUR 1%
150.000 to 199.999 EUR 0%
200.000 to 249.999 EUR 0%
250.000 EUR or more 0%
Prefer not to say 18%
Subtotal selection 100%
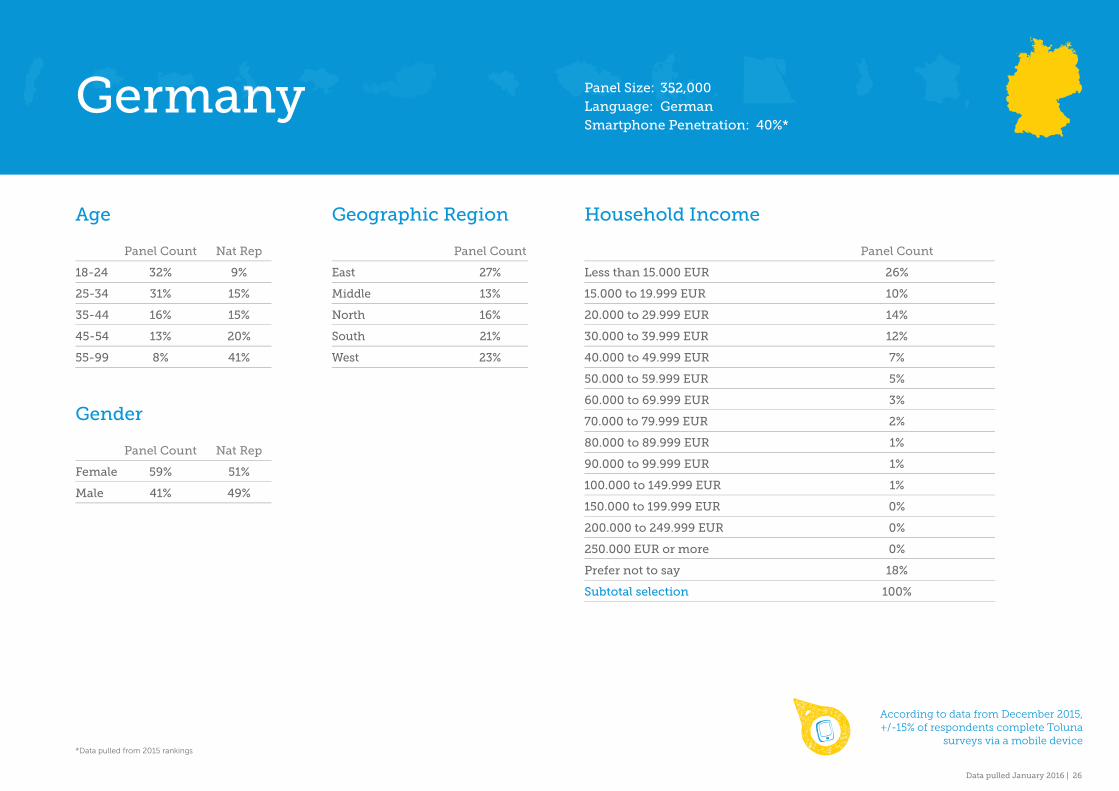
Germany
Geographic Region
Panel Count
East 27%
Middle 13%
North 16%
South 21%
West 23%
According to data from December 2015, +/-15% of respondents complete Toluna
surveys via a mobile device*Data pulled from 2015 rankings
Panel Size: 352,000 Language: German Smartphone Penetration: 40%*

Data pulled January 2016 | 27
Age
Panel Count Nat Rep
18-24 17% 8%
25-34 33% 16%
35-44 31% 19%
45-54 15% 18%
55-99 4% 39%
Gender
Panel Count Nat Rep
Female 69% 52%
Male 31% 48%
Household Income
Panel Count
Less than 15.000 EUR 44%
15.000 to 19.999 EUR 15%
20.000 to 29.999 EUR 11%
30.000 to 39.999 EUR 4%
40.000 to 49.999 EUR 2%
50.000 to 59.999 EUR 1%
60.000 to 69.999 EUR 0%
70.000 to 79.999 EUR 0%
80.000 to 89.999 EUR 0%
90.000 to 99.999 EUR 0%
100.000 to 149.999 EUR 0%
150.000 to 199.999 EUR 0%
200.000 to 249.999 EUR 0%
250.000 EUR or more 0%
Prefer not to say 23%
Subtotal selection 100%
Greece Panel Size: 29,500Language: GreekSmartphone Penetration: 33%*
According to data from December 2015, +/-21% of respondents complete Toluna
surveys via a mobile device*Data pulled from 2015 rankings

Data pulled January 2016 | 28
Age
Panel Count Nat Rep
18-24 9% 11%
25-34 18% 17%
35-44 24% 17%
45-54 21% 17%
55-99 28% 39%
Gender
Panel Count
Female 43%
Male 57%
Hungary Panel Size: 19,000Language: HungarianSmartphone Penetration: 34%*
Household Income
Panel Count
Low Annual Income 28%
Average Annual Income 47%
High Annual Income 3%
Prefer not to say 22%
Subtotal selection 100%
*Data pulled from 2015 rankings
Data pulled January 2016 | 29
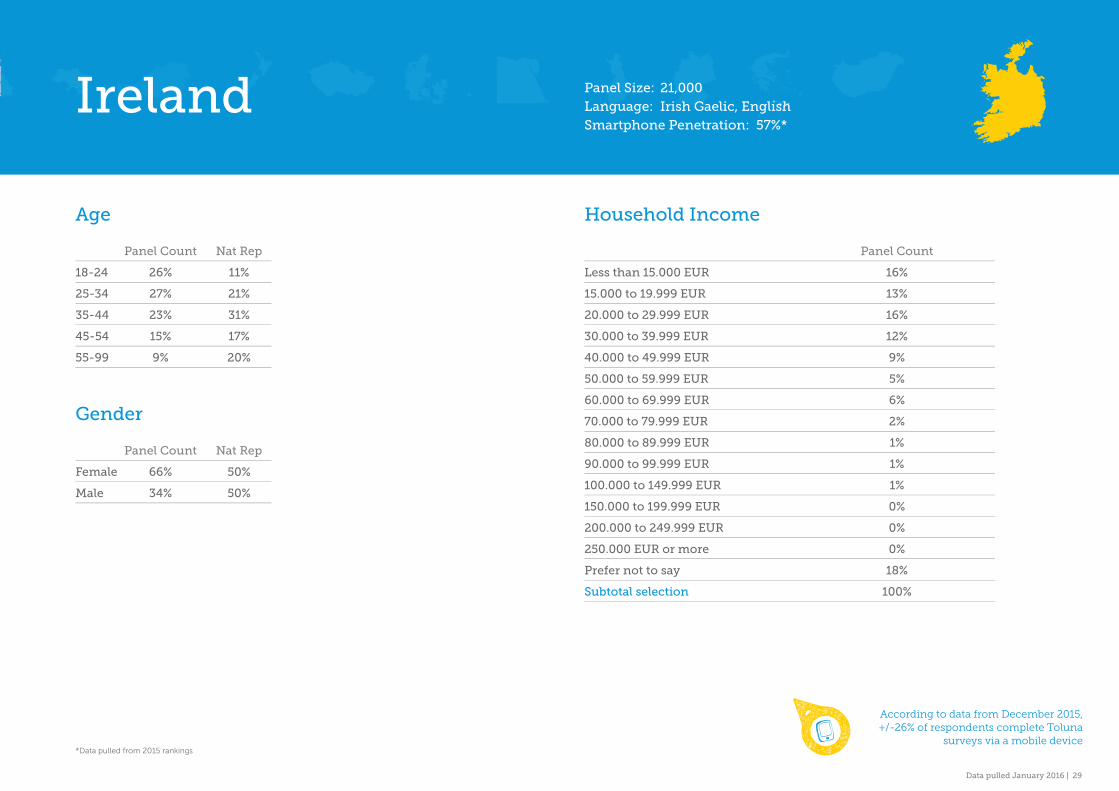
Age
Panel Count Nat Rep
18-24 26% 11%
25-34 27% 21%
35-44 23% 31%
45-54 15% 17%
55-99 9% 20%
Gender
Panel Count Nat Rep
Female 66% 50%
Male 34% 50%
Household Income
Panel Count
Less than 15.000 EUR 16%
15.000 to 19.999 EUR 13%
20.000 to 29.999 EUR 16%
30.000 to 39.999 EUR 12%
40.000 to 49.999 EUR 9%
50.000 to 59.999 EUR 5%
60.000 to 69.999 EUR 6%
70.000 to 79.999 EUR 2%
80.000 to 89.999 EUR 1%
90.000 to 99.999 EUR 1%
100.000 to 149.999 EUR 1%
150.000 to 199.999 EUR 0%
200.000 to 249.999 EUR 0%
250.000 EUR or more 0%
Prefer not to say 18%
Subtotal selection 100%
Ireland Panel Size: 21,000Language: Irish Gaelic, EnglishSmartphone Penetration: 57%*
According to data from December 2015, +/-26% of respondents complete Toluna
surveys via a mobile device*Data pulled from 2015 rankings
Data pulled January 2016 | 30
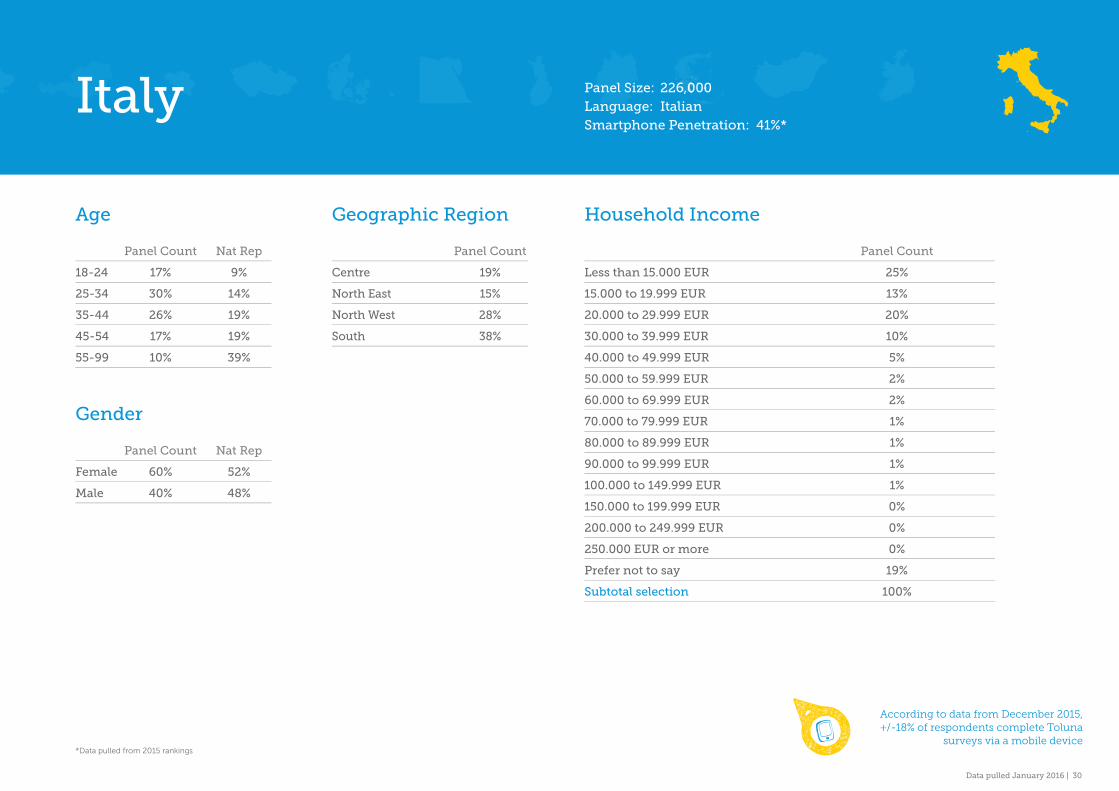
Age
Panel Count Nat Rep
18-24 17% 9%
25-34 30% 14%
35-44 26% 19%
45-54 17% 19%
55-99 10% 39%
Gender
Panel Count Nat Rep
Female 60% 52%
Male 40% 48%
Household Income
Panel Count
Less than 15.000 EUR 25%
15.000 to 19.999 EUR 13%
20.000 to 29.999 EUR 20%
30.000 to 39.999 EUR 10%
40.000 to 49.999 EUR 5%
50.000 to 59.999 EUR 2%
60.000 to 69.999 EUR 2%
70.000 to 79.999 EUR 1%
80.000 to 89.999 EUR 1%
90.000 to 99.999 EUR 1%
100.000 to 149.999 EUR 1%
150.000 to 199.999 EUR 0%
200.000 to 249.999 EUR 0%
250.000 EUR or more 0%
Prefer not to say 19%
Subtotal selection 100%
Italy
Geographic Region
Panel Count
Centre 19%
North East 15%
North West 28%
South 38%
According to data from December 2015, +/-18% of respondents complete Toluna
surveys via a mobile device*Data pulled from 2015 rankings
Panel Size: 226,000 Language: Italian Smartphone Penetration: 41%*

Data pulled January 2016 | 31
Age
Panel Count Nat Rep
18-24 40% 11%
25-34 19% 18%
35-44 14% 21%
45-54 13% 19%
55-99 14% 31%
Gender
Panel Count Nat Rep
Female 61% 51%
Male 39% 49%
Household Income
Panel Count
Less than 15.000 EUR 22%
15.000 to 19.999 EUR 8%
20.000 to 29.999 EUR 14%
30.000 to 39.999 EUR 13%
40.000 to 49.999 EUR 7%
50.000 to 59.999 EUR 3%
60.000 to 69.999 EUR 3%
70.000 to 79.999 EUR 2%
80.000 to 89.999 EUR 1%
90.000 to 99.999 EUR 1%
100.000 to 149.999 EUR 1%
150.000 to 199.999 EUR 0%
200.000 to 249.999 EUR 0%
250.000 EUR or more 0%
Prefer not to say 25%
Subtotal selection 100%
Netherlands
Geographic Region
Panel Count
Centre-Regio Randstad 9%
East 20%
North 13%
South 20%
West-Regio Randstad 38%
Panel Size: 95,500Language: DutchSmartphone Penetration: 52%*
According to data from December 2015, +/-15% of respondents complete Toluna
surveys via a mobile device*Data pulled from 2015 rankings

Data pulled January 2016 | 32
Age
Panel Count Nat Rep
18-24 40% 12%
25-34 24% 17%
35-44 16% 18%
45-54 11% 18%
55-99 9% 36%
Gender
Panel Count Nat Rep
Female 52% 50%
Male 48% 50%
Household Income
Panel Count
Less than 120.000 NOK 13%
120.000 to 159.999 NOK 6%
160.000 to 249.999 NOK 8%
250.000 to 329.999 NOK 7%
330.000 to 399.999 NOK 8%
400.000 to 489.999 NOK 7%
490.000 to 569.999 NOK 5%
570.000 to 649.999 NOK 5%
650.000 to 739.999 NOK 4%
740.000 to 819.999 NOK 4%
820.000 to 1.229.999 NOK 6%
1.230.000 to 1.639.999 NOK 1%
1.640.000 to 2.049.999 NOK 1%
2.050.000 NOK or more 2%
Prefer not to say 24%
Subtotal selection 100%
Norway
Geographic Region
Panel Count
Akerhus County 11%
Aust-Agder County 2%
Buskerud County 6%
Finnmark County 1%
Hedmark County 4%
Hordaland County 10%
Møre og Romsdal County 4%
Nord-Trøndelag County 2%
Nordland County 4%
Oppland County 3%
Oslo County 15%
Rogaland County 8%
Sogn og Fjordane County 2%
Svalbard County 0%
Sør-Trøndelag County 6%
Telemark County 4%
Troms County 3%
Vest-Agder County 3%
Vestfold County 5%
Østfold County 7%
Panel Size: 20,000Language: NorwegianSmartphone Penetration: 68%*
According to data from December 2015, +/-22% of respondents complete Toluna
surveys via a mobile device*Data pulled from 2015 rankings
Data pulled January 2016 | 33
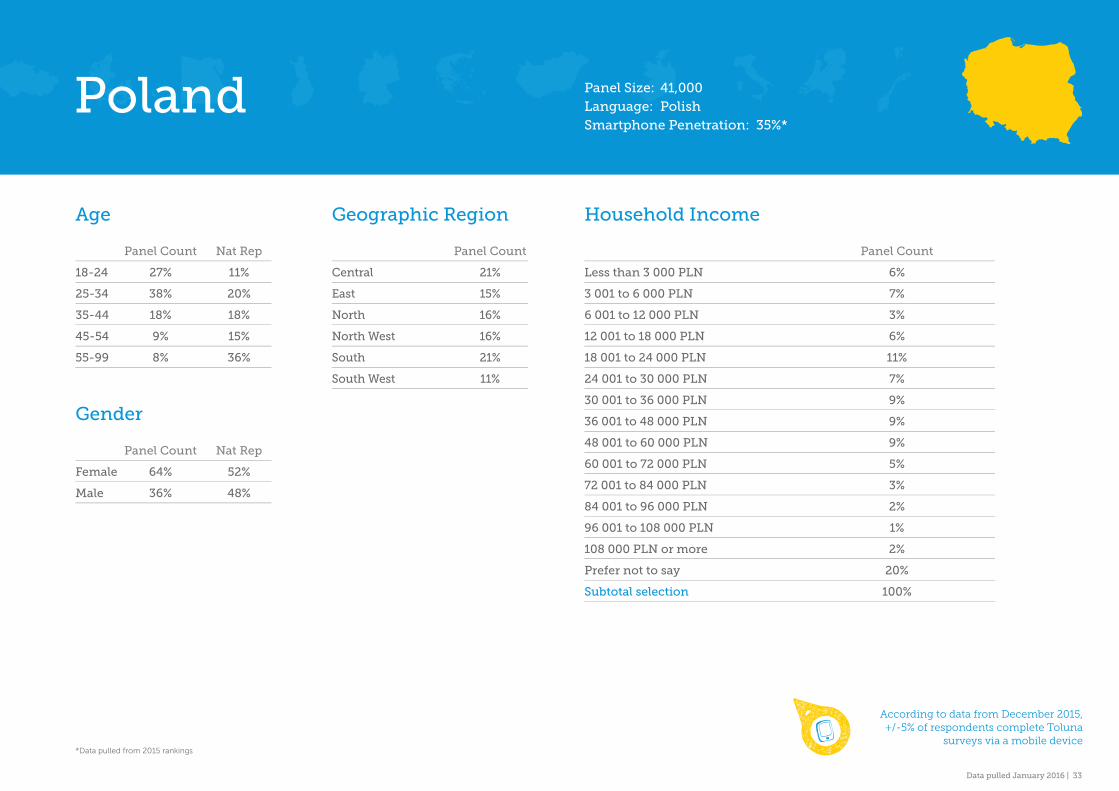
Age
Panel Count Nat Rep
18-24 27% 11%
25-34 38% 20%
35-44 18% 18%
45-54 9% 15%
55-99 8% 36%
Gender
Panel Count Nat Rep
Female 64% 52%
Male 36% 48%
Household Income
Panel Count
Less than 3 000 PLN 6%
3 001 to 6 000 PLN 7%
6 001 to 12 000 PLN 3%
12 001 to 18 000 PLN 6%
18 001 to 24 000 PLN 11%
24 001 to 30 000 PLN 7%
30 001 to 36 000 PLN 9%
36 001 to 48 000 PLN 9%
48 001 to 60 000 PLN 9%
60 001 to 72 000 PLN 5%
72 001 to 84 000 PLN 3%
84 001 to 96 000 PLN 2%
96 001 to 108 000 PLN 1%
108 000 PLN or more 2%
Prefer not to say 20%
Subtotal selection 100%
Poland
Geographic Region
Panel Count
Central 21%
East 15%
North 16%
North West 16%
South 21%
South West 11%
Panel Size: 41,000Language: PolishSmartphone Penetration: 35%*
According to data from December 2015, +/-5% of respondents complete Toluna
surveys via a mobile device*Data pulled from 2015 rankings

Data pulled January 2016 | 34
Age
Panel Count Nat Rep
18-24 28% 10%
25-34 31% 16%
35-44 25% 19%
45-54 11% 17%
55-99 5% 38%
Gender
Panel Count Nat Rep
Female 63% 52%
Male 37% 48%
Household Income
Panel Count
Less than 15.000 EUR 40%
15.000 to 19.999 EUR 14%
20.000 to 29.999 EUR 10%
30.000 to 39.999 EUR 5%
40.000 to 49.999 EUR 2%
50.000 to 59.999 EUR 2%
60.000 to 69.999 EUR 1%
70.000 to 79.999 EUR 1%
80.000 to 89.999 EUR 1%
90.000 to 99.999 EUR 0%
100.000 to 149.999 EUR 1%
Prefer not to say 23%
Subtotal selection 100%
Portugal
Geographic Region
Panel Count
Aveiro 7%
Beja 1%
Braga 4%
Braganca 1%
Castelo Branco 2%
Coimbra 4%
Evora 1%
Faro 4%
Guarda 1%
Ilha de Madeira 3%
Ilhas dos Amores 2%
Leiria 5%
Lisboa 27%
Portalegre 1%
Porto 19%
Santarem 4%
Setubal 10%
Viano do Castelo 1%
Vila Real 1%
Viseu 2%
Panel Size: 25,000Language: PortugueseSmartphone Penetration: 32%*
According to data from December 2015, +/-17% of respondents complete Toluna
surveys via a mobile device*Data pulled from 2015 rankings

Data pulled January 2016 | 35
Romania Panel Size: 27,000Language: RomanianSmartphone Penetration: 28%*
Age
Panel Count Nat Rep
18-24 18% 11%
25-34 41% 18%
35-44 23% 18%
45-54 13% 18%
55-99 5% 34%
Gender
Panel Count
Female 58%
Male 42%
Household Income
Panel Count
Less than 6,000 Lei 30%
6,000 - 11,999 Lei 19%
12,000 - 17,999 Lei 15%
18,000 - 29,999 Lei 18%
30,000 - 47,999 Lei 12%
48,000 Lei or more 6%
Subtotal selection 100%
*Data pulled from 2015 rankings

Data pulled January 2016 | 36
Russian Federation Panel Size: 975,000Language: RussianSmartphone Penetration: 36%*
Age
Panel Count Nat Rep
18-24 29% 10%
25-34 43% 21%
35-44 17% 18%
45-54 7% 18%
55-99 4% 33%
Gender
Panel Count Nat Rep
Female 58% 55%
Male 42% 45%
Household Income
Panel Count
Less than 100 000 RUB 46%
100 001 RUB to 200 000 RUB 12%
200 001 RUB to 300 000 RUB 7%
300 001 RUB to 400 000 RUB 7%
400 001 RUB to 500 000 RUB 6%
500 001 RUB to 1 000 000 RUB 10%
1 000 000 RUB or more 4%
Prefer not to say 8%
Subtotal selection 100%
According to data from December 2015, +/-9% of respondents complete Toluna
surveys via a mobile device*Data pulled from 2015 rankings
Data pulled January 2016 | 37
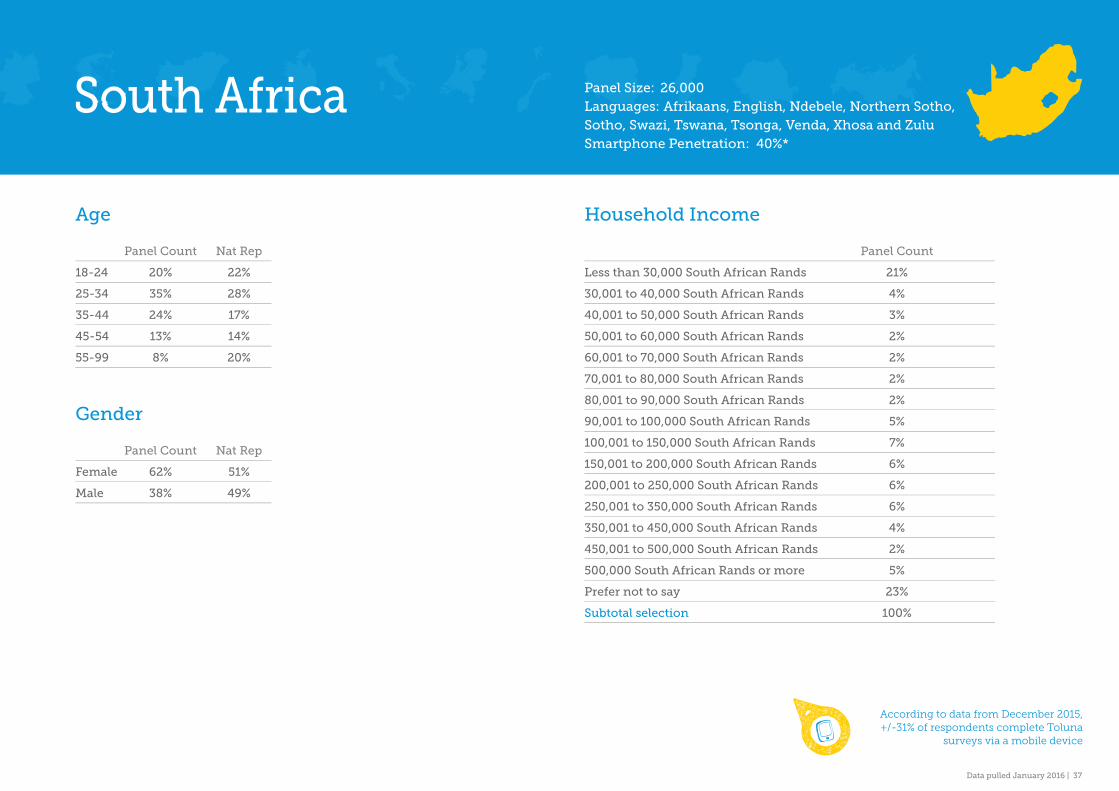
Age
Panel Count Nat Rep
18-24 20% 22%
25-34 35% 28%
35-44 24% 17%
45-54 13% 14%
55-99 8% 20%
Gender
Panel Count Nat Rep
Female 62% 51%
Male 38% 49%
Household Income
Panel Count
Less than 30,000 South African Rands 21%
30,001 to 40,000 South African Rands 4%
40,001 to 50,000 South African Rands 3%
50,001 to 60,000 South African Rands 2%
60,001 to 70,000 South African Rands 2%
70,001 to 80,000 South African Rands 2%
80,001 to 90,000 South African Rands 2%
90,001 to 100,000 South African Rands 5%
100,001 to 150,000 South African Rands 7%
150,001 to 200,000 South African Rands 6%
200,001 to 250,000 South African Rands 6%
250,001 to 350,000 South African Rands 6%
350,001 to 450,000 South African Rands 4%
450,001 to 500,000 South African Rands 2%
500,000 South African Rands or more 5%
Prefer not to say 23%
Subtotal selection 100%
South Africa Panel Size: 26,000Languages: Afrikaans, English, Ndebele, Northern Sotho, Sotho, Swazi, Tswana, Tsonga, Venda, Xhosa and Zulu Smartphone Penetration: 40%*
According to data from December 2015, +/-31% of respondents complete Toluna
surveys via a mobile device
Data pulled January 2016 | 38
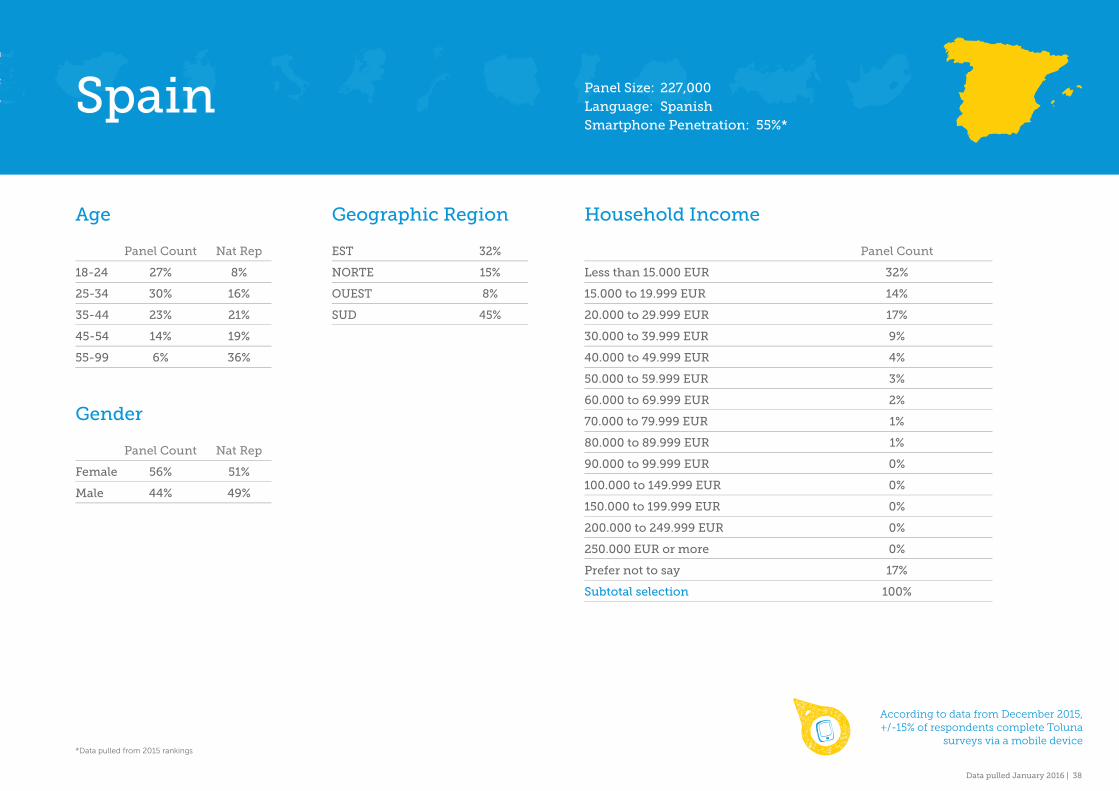
Spain Panel Size: 227,000Language: SpanishSmartphone Penetration: 55%*
Age
Panel Count Nat Rep
18-24 27% 8%
25-34 30% 16%
35-44 23% 21%
45-54 14% 19%
55-99 6% 36%
Gender
Panel Count Nat Rep
Female 56% 51%
Male 44% 49%
Household Income
Panel Count
Less than 15.000 EUR 32%
15.000 to 19.999 EUR 14%
20.000 to 29.999 EUR 17%
30.000 to 39.999 EUR 9%
40.000 to 49.999 EUR 4%
50.000 to 59.999 EUR 3%
60.000 to 69.999 EUR 2%
70.000 to 79.999 EUR 1%
80.000 to 89.999 EUR 1%
90.000 to 99.999 EUR 0%
100.000 to 149.999 EUR 0%
150.000 to 199.999 EUR 0%
200.000 to 249.999 EUR 0%
250.000 EUR or more 0%
Prefer not to say 17%
Subtotal selection 100%
Geographic Region
EST 32%
NORTE 15%
OUEST 8%
SUD 45%
According to data from December 2015, +/-15% of respondents complete Toluna
surveys via a mobile device*Data pulled from 2015 rankings

Data pulled January 2016 | 39
Sweden Panel Size: 35,000Language: SwedishSmartphone Penetration: 63%*
Age
Panel Count Nat Rep
18-24 31% 12%
25-34 26% 16%
35-44 16% 16%
45-54 13% 17%
55-99 14% 39%
Gender
Panel Count Nat Rep
Female 52% 50%
Male 48% 50%
Household Income
Panel Count
Less than 65 000 SEK 11%
65 000 to 129 999 SEK 8%
130 000 to 194 999 SEK 9%
195 000 to 259 999 SEK 14%
260 000 to 324 999 SEK 10%
325 000 to 389 999 SEK 7%
390 000 to 519 999 SEK 8%
520 000 to 649 999 SEK 5%
650 000 to 779 999 SEK 3%
780 000 to 1 039 999 SEK 2%
1 040 000 to 1 299 999 SEK 2%
1 300 000 or more 1%
Prefer not to say 20%
Subtotal selection 100%
Geographic Region
Panel Count
East Middle 19%
Middle Norrland 4%
North Middle 9%
Smaland and Islands 6%
South 15%
Stockholm 23%
Upper Norrland 5%
West Sweden 19%
According to data from December 2015, +/-12% of respondents complete Toluna
surveys via a mobile device*Data pulled from 2015 rankings
Data pulled January 2016 | 40
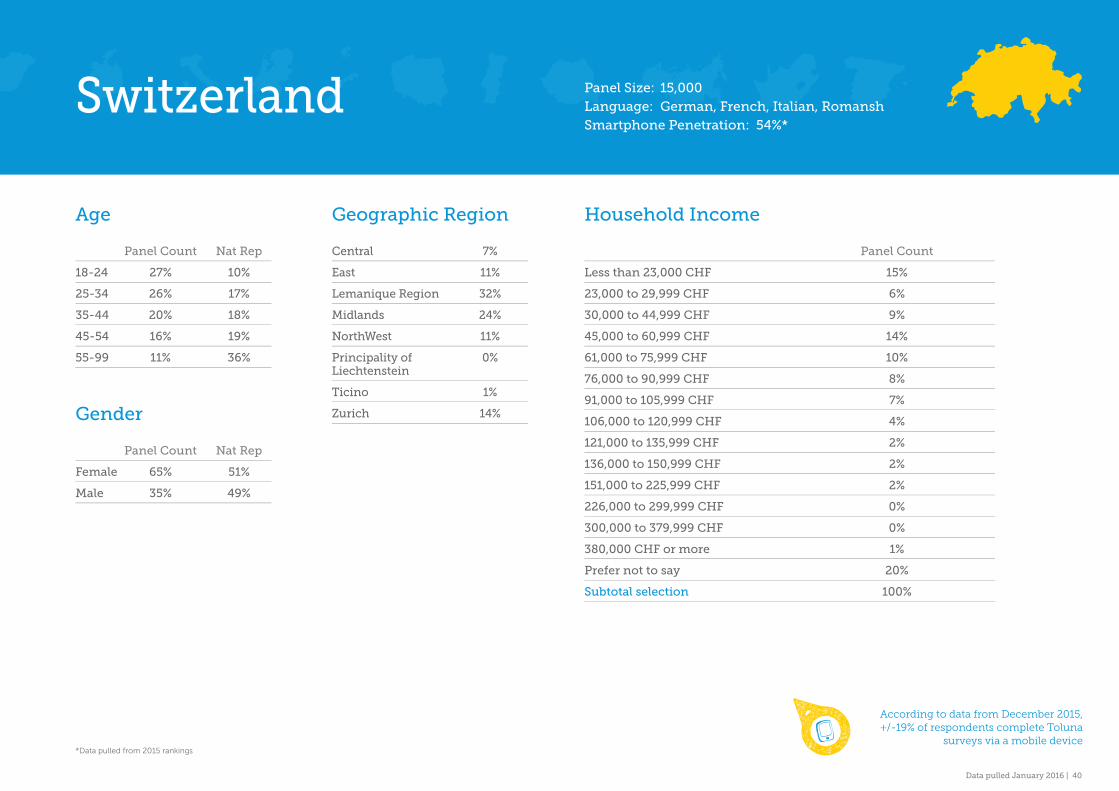
Switzerland Panel Size: 15,000Language: German, French, Italian, RomanshSmartphone Penetration: 54%*
Age
Panel Count Nat Rep
18-24 27% 10%
25-34 26% 17%
35-44 20% 18%
45-54 16% 19%
55-99 11% 36%
Gender
Panel Count Nat Rep
Female 65% 51%
Male 35% 49%
Household Income
Panel Count
Less than 23,000 CHF 15%
23,000 to 29,999 CHF 6%
30,000 to 44,999 CHF 9%
45,000 to 60,999 CHF 14%
61,000 to 75,999 CHF 10%
76,000 to 90,999 CHF 8%
91,000 to 105,999 CHF 7%
106,000 to 120,999 CHF 4%
121,000 to 135,999 CHF 2%
136,000 to 150,999 CHF 2%
151,000 to 225,999 CHF 2%
226,000 to 299,999 CHF 0%
300,000 to 379,999 CHF 0%
380,000 CHF or more 1%
Prefer not to say 20%
Subtotal selection 100%
Geographic Region
Central 7%
East 11%
Lemanique Region 32%
Midlands 24%
NorthWest 11%
Principality of 0%Liechtenstein
Ticino 1%
Zurich 14%
According to data from December 2015, +/-19% of respondents complete Toluna
surveys via a mobile device*Data pulled from 2015 rankings

Data pulled January 2016 | 41
Turkey Panel Size: 70,500Language: TurkishSmartphone Penetration: 30%*
Age
Panel Count Nat Rep
18-24 41% 17%
25-34 36% 24%
35-44 16% 21%
45-54 5% 17%
55-99 2% 21%
Gender
Panel Count Nat Rep
Female 35% 50%
Male 65% 50%
Household Income
Panel Count
Less than 5000 YTL 38%
5000 YTL to 9999 YTL 11%
10.000 YTL to 19.999 YTL 12%
20.000 YTL to 39.999 YTL 12%
40.000 YTL to 59.999 YTL 6%
60.0000 YTL to 79.999 YTL 2%
80.000 YTL or more 2%
Prefer not to say 18%
Subtotal selection 100%
Geographic Region
Panel Count
Akdeniz Bölgesi 7%
Dogu Anadolu 4%Bölgesi
Ege Bölgesi 19%
Güneydogu 5%Anadolu Bölgesi
Iç Anadolu Bölgesi 10%
Karadeniz Bölgesi 10%
Marmara Bölgesi 45%
According to data from December 2015, +/-24% of respondents complete Toluna
surveys via a mobile device*Data pulled from 2015 rankings

Data pulled January 2016 | 42
Ukraine Panel Size: 12,000Language: Ukrainian, RussianSmartphone Penetration: 14%*
Age
Panel Count Nat Rep
18-24 23% 11%
25-34 44% 20%
35-44 25% 17%
45-54 6% 17%
55-99 2% 35%
Gender
Panel Count
Female 42%
Male 58%
*Data pulled from 2015 rankings

Data pulled January 2016 | 43
United Kingdom Panel Size: 479,000Language: EnglishSmartphone Penetration: 62%*
Age
Panel Count Nat Rep
18-24 34% 12%
25-34 24% 17%
35-44 17% 16%
45-54 13% 19%
55-99 12% 37%
Gender
Panel Count Nat Rep
Female 61% 51%
Male 39% 49%
Household Income
Panel Count
Less than £10,000 17%
£10,000 to £14,999 20%
£15,000 to £19,999 8%
£20,000 to £29,999 15%
£30,000 to £39,999 10%
£40,000 to £49,999 6%
£50,000 to £59,999 4%
£60,000 to £69,999 3%
£70,000 to £79,999 2%
£80,000 to £89,999 1%
£90,000 to £99,999 1%
£100,000 to £149,999 1%
£150,000 to £199,999 0%
£200,000 or more 1%
Prefer not to say 11%
Subtotal selection 100%
Geographic Region
Panel Count
Midlands and Wales 21%
North and Scotland 32%
Northern Ireland 2%
South 45%
According to data from December 2015, +/-19% of respondents complete Toluna
surveys via a mobile device*Data pulled from 2015 rankings

Panel CommunitiesAPAC
Data pulled January 2016 | 45
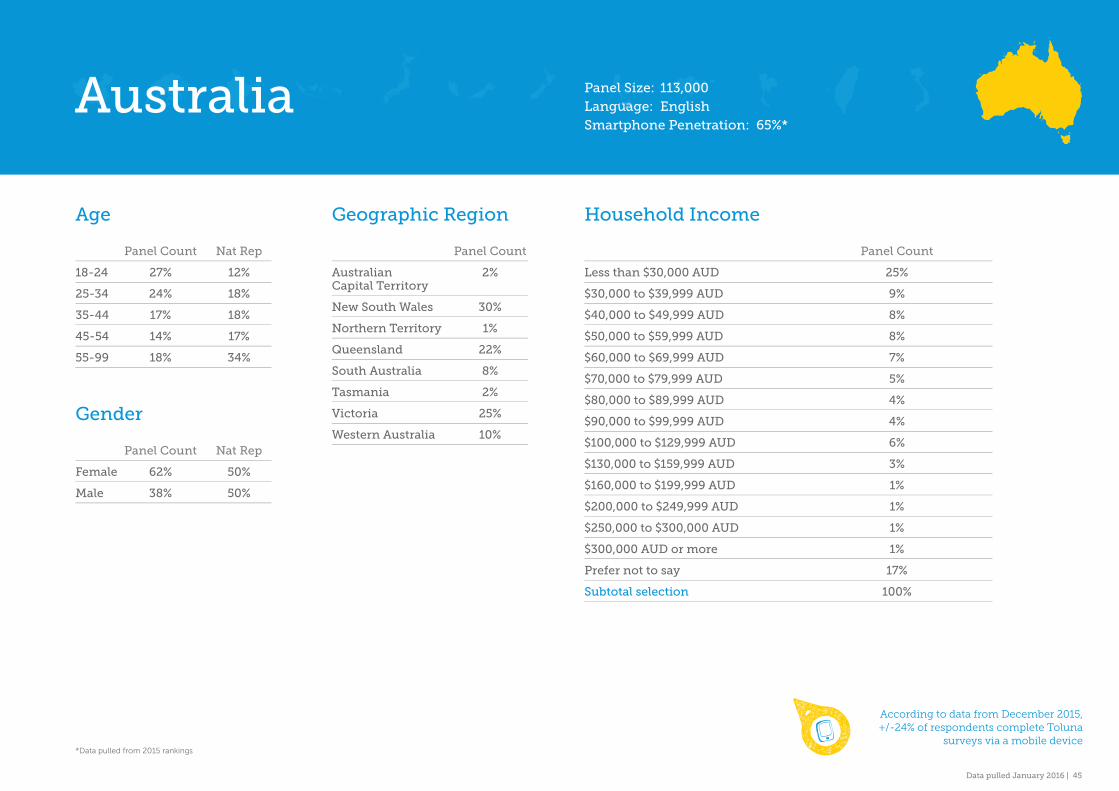
Age
Panel Count Nat Rep
18-24 27% 12%
25-34 24% 18%
35-44 17% 18%
45-54 14% 17%
55-99 18% 34%
Gender
Panel Count Nat Rep
Female 62% 50%
Male 38% 50%
Geographic Region
Panel Count
Australian 2%Capital Territory
New South Wales 30%
Northern Territory 1%
Queensland 22%
South Australia 8%
Tasmania 2%
Victoria 25%
Western Australia 10%
Household Income
Panel Count
Less than $30,000 AUD 25%
$30,000 to $39,999 AUD 9%
$40,000 to $49,999 AUD 8%
$50,000 to $59,999 AUD 8%
$60,000 to $69,999 AUD 7%
$70,000 to $79,999 AUD 5%
$80,000 to $89,999 AUD 4%
$90,000 to $99,999 AUD 4%
$100,000 to $129,999 AUD 6%
$130,000 to $159,999 AUD 3%
$160,000 to $199,999 AUD 1%
$200,000 to $249,999 AUD 1%
$250,000 to $300,000 AUD 1%
$300,000 AUD or more 1%
Prefer not to say 17%
Subtotal selection 100%
Australia Panel Size: 113,000Language: EnglishSmartphone Penetration: 65%*
According to data from December 2015, +/-24% of respondents complete Toluna
surveys via a mobile device*Data pulled from 2015 rankings

Data pulled January 2016 | 46
Age
Panel Count Nat Rep
18-24 28% 14%
25-34 44% 20%
35-44 20% 20%
45-54 6% 19%
55-99 2% 27%
Gender
Panel Count Nat Rep
Female 40% 49%
Male 60% 51%
Geographic Region
Panel Count
East China 37%
North China 16%
North East China 11%
South Central China 36%
Household Income
Panel Count
Less than 20’000 CNY 14%
20’000 to 29’999 CNY 6%
30’000 to 49’999 CNY 9%
50’000 to 69’999 CNY 11%
70’000 to 99’999 CNY 8%
100’000 to 119’999 CNY 7%
120’000 to 129’999 CNY 3%
130’000 to 149’999 CNY 3%
150’000 to 179’999 CNY 3%
180’000 to 199’999 CNY 2%
200’000 to 219’000 CNY 3%
220’000 to 239’999 CNY 1%
240’000 to 269’999 CNY 2%
270’000 to 299’999 CNY 1%
300’000 CNY or more 3%
Prefer not to say 24%
Subtotal selection 100%
China Panel Size: 1,455,000Language: Mandarin (Simplifi ed Chinese)Smartphone Penetration: 47%*
According to data from December 2015, +/-20% of respondents complete Toluna
surveys via a mobile device*Data pulled from 2015 rankings

Data pulled January 2016 | 47
Age
Panel Count Nat Rep
18-24 39% 9%
25-34 37% 16%
35-44 16% 18%
45-54 6% 23%
55-99 2% 33%
Gender
Panel Count Nat Rep
Female 57% 55%
Male 43% 45%
Geographic Region
Panel Count
Hong Kong Island 15%
Kowloon 31%
New Territories 51%
Outlying Islands 3%
Household Income
Panel Count
Less than 125 000 HKD 13%
125 000 to 159 999 HKD 7%
160 000 to 189 999 HKD 4%
190 000 to 254 999 HKD 8%
255 000 to 319 999 HKD 8%
320 000 to 379 999 HKD 8%
380 000 to 444 999 HKD 6%
445 000 to 508 499 HKD 8%
508 500 to 569 999 HKD 5%
570 000 to 634 999 HKD 6%
635 000 HKD or more 14%
Prefer not to say 13%
Subtotal selection 100%
Hong Kong Panel Size: 100,000Language: Cantonese (Traditional Chinese), English
Smartphone Penetration: 63%*
According to data from December 2015, +/-28% of respondents complete Toluna
surveys via a mobile device*Data pulled from 2015 rankings

Data pulled January 2016 | 48
Age
Panel Count Nat Rep
18-24 39% 19%
25-34 40% 24%
35-44 13% 21%
45-54 5% 16%
55-99 3% 19%
Gender
Panel Count Nat Rep
Female 26% 49%
Male 74% 51%
Geographic Region
Panel Count
Eastern India 9%
North India 18%
North Central 13%
North Eastern 2%
Southern India 37%
Western 21%
Household Income
Panel Count
Less than Rs 30,000 13%
Rs 30,000 to Rs 49,999 8%
Rs 50,000 to Rs 99,999 8%
Rs 1,00,000 to Rs 1,49,999 9%
Rs 1,50,000 to Rs 1,99,999 7%
Rs 2,00,000 to Rs 2,99,999 10%
Rs 3,00,000 to Rs 4,99,999 14%
Rs 5,00,000 to Rs 6,99,999 9%
Rs 7,00,000 to Rs 9,99,999 6%
Rs 10,00,000 to Rs 15,99,999 4%
Rs 16,00,000 to Rs 19,99,999 1%
Rs 20,00,000 to Rs 29,99,999 1%
Rs 30,00,000 or more 1%
Prefer not to say 9%
Subtotal selection 100%
India Panel Size: 150,000Language: Hindi, EnglishSmartphone Penetration: 59%*
According to data from December 2015, +/-13% of respondents complete Toluna
surveys via a mobile device
Data pulled January 2016 | 49
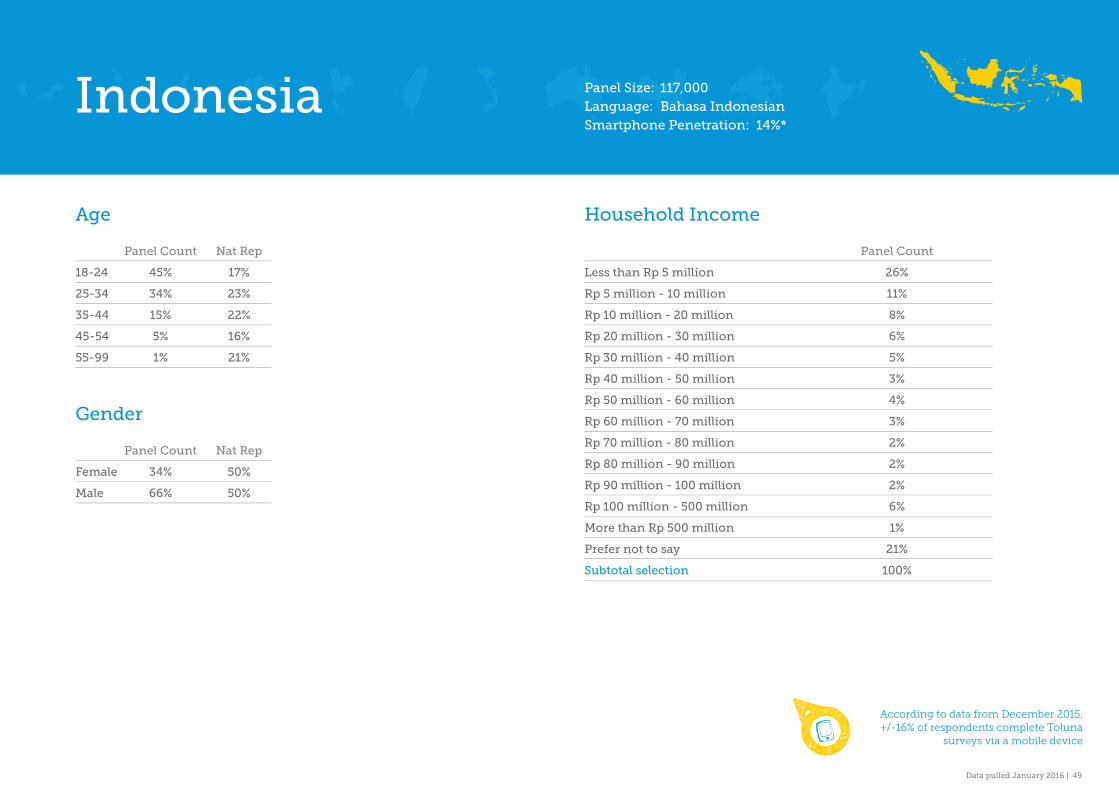
Age
Panel Count Nat Rep
18-24 45% 17%
25-34 34% 23%
35-44 15% 22%
45-54 5% 16%
55-99 1% 21%
Household Income
Panel Count
Less than Rp 5 million 26%
Rp 5 million - 10 million 11%
Rp 10 million - 20 million 8%
Rp 20 million - 30 million 6%
Rp 30 million - 40 million 5%
Rp 40 million - 50 million 3%
Rp 50 million - 60 million 4%
Rp 60 million - 70 million 3%
Rp 70 million - 80 million 2%
Rp 80 million - 90 million 2%
Rp 90 million - 100 million 2%
Rp 100 million - 500 million 6%
More than Rp 500 million 1%
Prefer not to say 21%
Subtotal selection 100%
Gender
Panel Count Nat Rep
Female 34% 50%
Male 66% 50%
Indonesia Panel Size: 117,000Language: Bahasa IndonesianSmartphone Penetration: 14%*
According to data from December 2015, +/-16% of respondents complete Toluna
surveys via a mobile device
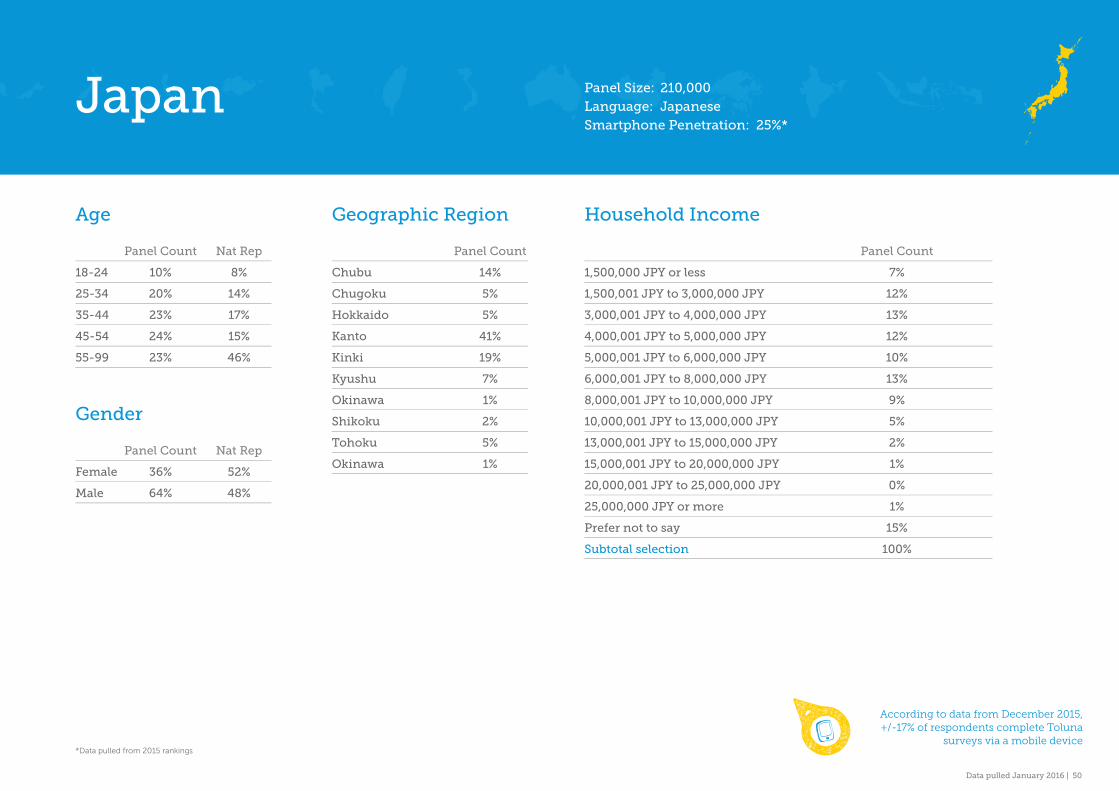
Data pulled January 2016 | 50
Age
Panel Count Nat Rep
18-24 10% 8%
25-34 20% 14%
35-44 23% 17%
45-54 24% 15%
55-99 23% 46%
Gender
Panel Count Nat Rep
Female 36% 52%
Male 64% 48%
Geographic Region
Panel Count
Chubu 14%
Chugoku 5%
Hokkaido 5%
Kanto 41%
Kinki 19%
Kyushu 7%
Okinawa 1%
Shikoku 2%
Tohoku 5%
Okinawa 1%
Household Income
Panel Count
1,500,000 JPY or less 7%
1,500,001 JPY to 3,000,000 JPY 12%
3,000,001 JPY to 4,000,000 JPY 13%
4,000,001 JPY to 5,000,000 JPY 12%
5,000,001 JPY to 6,000,000 JPY 10%
6,000,001 JPY to 8,000,000 JPY 13%
8,000,001 JPY to 10,000,000 JPY 9%
10,000,001 JPY to 13,000,000 JPY 5%
13,000,001 JPY to 15,000,000 JPY 2%
15,000,001 JPY to 20,000,000 JPY 1%
20,000,001 JPY to 25,000,000 JPY 0%
25,000,000 JPY or more 1%
Prefer not to say 15%
Subtotal selection 100%
Japan Panel Size: 210,000Language: JapaneseSmartphone Penetration: 25%*
According to data from December 2015, +/-17% of respondents complete Toluna
surveys via a mobile device*Data pulled from 2015 rankings

Data pulled January 2016 | 51
Age
Panel Count Nat Rep
18-24 34% 12%
25-34 31% 18%
35-44 21% 20%
45-54 10% 21%
55-99 4% 29%
Gender
Panel Count Nat Rep
Female 48% 51%
Male 52% 49%
Geographic Region
Panel Count
Seoul 31%
Incheon 6%Metropolitan City
Busan 7%Metropolitan City
Gwangju 3%Metropolitan City
Daegu 4%Metropolitan City
Daejeon 3%Metropolitan City
Ulsan 2%
Gangwon-do 2%
Gyeonggi-do 22%
Kyungnam 4%
Gyeongbuk 4%
Jeollanam 2%
Chonbuk 4%
Chungnam 2%
Chungbuk 3%
Jeju 1%
Household Income
Panel Count
Less than 20 Million Won 20%
20 to 30 Million Won 13%
30 to 40 Million Won 14%
40 to 50 Million Won 12%
50 to 60 Million Won 9%
60 to 70 Million Won 6%
70 to 80 Million Won 4%
80 to 90 Million Won 2%
90 to 1 Billion Won 2%
1 Billion Won or more 3%
Prefer not to say 15%
Subtotal selection 100%
Korea Panel Size: 245,000Language: KoreanSmartphone Penetration: 73%*
According to data from December 2015, +/-15% of respondents complete Toluna
surveys via a mobile device
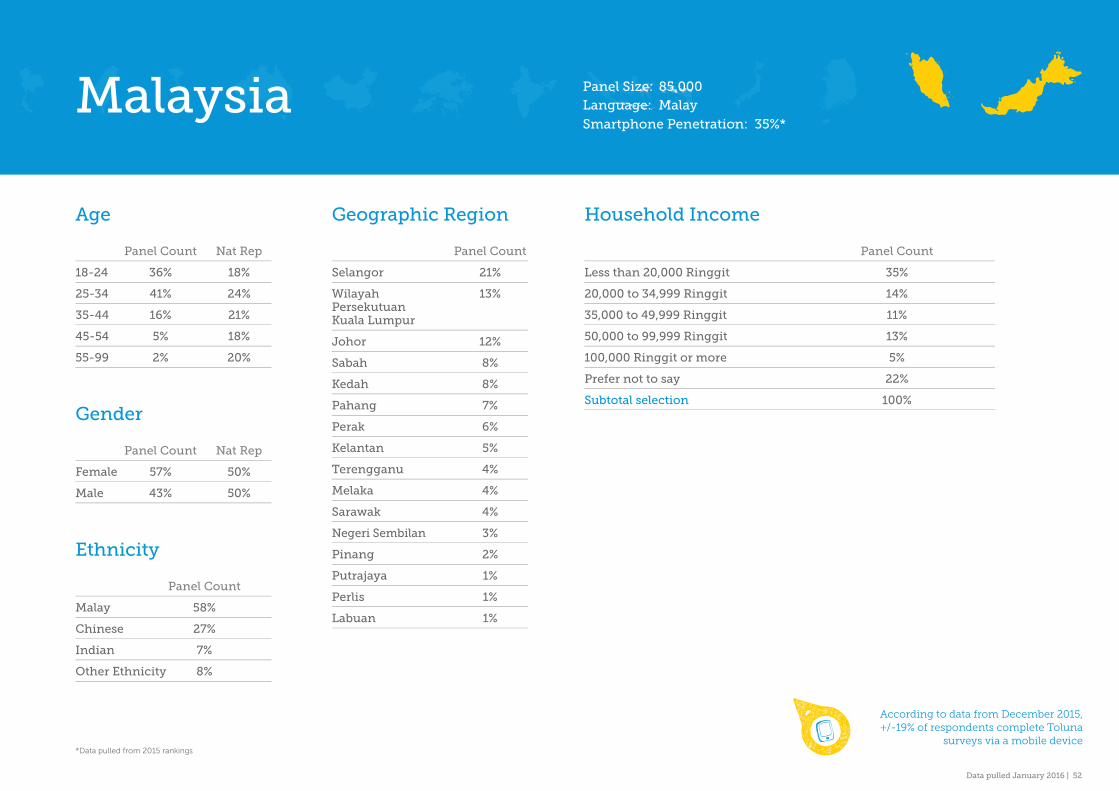
Data pulled January 2016 | 52
Age
Panel Count Nat Rep
18-24 36% 18%
25-34 41% 24%
35-44 16% 21%
45-54 5% 18%
55-99 2% 20%
Gender
Panel Count Nat Rep
Female 57% 50%
Male 43% 50%
Ethnicity
Panel Count
Malay 58%
Chinese 27%
Indian 7%
Other Ethnicity 8%
Geographic Region
Panel Count
Selangor 21%
Wilayah 13%Persekutuan Kuala Lumpur
Johor 12%
Sabah 8%
Kedah 8%
Pahang 7%
Perak 6%
Kelantan 5%
Terengganu 4%
Melaka 4%
Sarawak 4%
Negeri Sembilan 3%
Pinang 2%
Putrajaya 1%
Perlis 1%
Labuan 1%
Household Income
Panel Count
Less than 20,000 Ringgit 35%
20,000 to 34,999 Ringgit 14%
35,000 to 49,999 Ringgit 11%
50,000 to 99,999 Ringgit 13%
100,000 Ringgit or more 5%
Prefer not to say 22%
Subtotal selection 100%
Malaysia
According to data from December 2015, +/-19% of respondents complete Toluna
surveys via a mobile device*Data pulled from 2015 rankings
Panel Size: 85,000Language: Malay
Smartphone Penetration: 35%*

Data pulled January 2016 | 53
Age
Panel Count Nat Rep
18-24 28% 13%
25-34 21% 17%
35-44 16% 18%
45-54 15% 19%
55-99 20% 34%
Gender
Panel Count Nat Rep
Female 61% 51%
Male 39% 49%
Geographic Region
Panel Count
Auckland 35%
Bay of Plenty 7%
Canterbury/West Coast 11%
Gisborne 1%
Nelson/Marlborough 3%
Northland 4%
Otago/Southland 6%
Taranaki/Wanganui 4%
Hawkes Bay 4%
Waikato 10%
Wellington/Manawatu 15%
Household Income
Panel Count
Less than $20,000 NZD 22%
$20,000 to $30,000 NZD 11%
$30,000 to $40,000 NZD 9%
$40,000 to $50,000 NZD 8%
$50,000 to $60,000 NZD 8%
$60,000 to $70,000 NZD 10%
$70,000 to$ 80,000 NZD 3%
$80,000 to $90,000 NZD 2%
$90,000 to $100,000 NZD 2%
$100,000 to $150,000 NZD 4%
$150,000 NZD or more 1%
Prefer not to say 20%
Subtotal selection 100%
New Zealand
According to data from December 2015, +/-23% of respondents complete Toluna
surveys via a mobile device*Data pulled from 2015 rankings
Panel Size: 30,000Language: English, Māori, New Zealand Si gn Language
Smartphone Penetration: 54%*

Data pulled January 2016 | 54
Age
Panel Count Nat Rep
18-24 30% 22%
25-34 43% 25%
35-44 17% 21%
45-54 6% 15%
55-99 4% 17%
Gender
Panel Count
Female 63%
Male 37%
Geographic Region
Panel Count
Metro Manila 30%
Luzon 35%
Visayas 19%
Mindanao 16%
Household Income
Panel Count
Low Annual Income 23%
Average Annual Income 18%
High Annual Income 14%
Prefer not to say 45%
Subtotal selection 100%
Philippines Panel Size: 77,000Language: Filipino, EnglishSmartphone Penetration: 39%*

Data pulled January 2016 | 55
Age
Panel Count Nat Rep
18-24 25% 17%
25-34 36% 26%
35-44 23% 19%
45-54 11% 16%
55-99 5% 22%
Gender
Panel Count Nat Rep
Female 53% 51%
Male 47% 49%
Ethnicity
Panel Count
Chinese 68%
Malay 12%
Indian 10%
Other Ethnicity 10%
Citizenship Status
Panel Count
I am a citizen 47%of the country
I am a permanent 6%resident of the country
I am a non-resident 47%with a working visa
Household Income
Panel Count
Less than 30,000 SGD 25%
30,000 to 39,999 SGD 11%
40,000 to 49,999 SGD 8%
50,000 to 59,999 SGD 7%
60,000 to 69,999 SGD 7%
70,000 to 79,999 SGD 5%
80,000 to 89,999 SGD 5%
90,000 to 99,999 SGD 3%
100,000 to 129,999 SGD 7%
130,000 to 159,999 SGD 3%
160,000 or more 3%
Prefer not to say 15%
Subtotal selection 100%
Singapore Panel Size: 105,000Language: English, Mandarin, Malay, Tamil
Smartphone Penetration: 72%*
According to data from December 2015, +/-26% of respondents complete Toluna
surveys via a mobile device*Data pulled from 2015 rankings

Data pulled January 2016 | 56
Age
Panel Count Nat Rep
18-24 18% 14%
25-34 33% 20%
35-44 30% 20%
45-54 15% 20%
55-99 4% 26%
Gender
Panel Count
Female 58%
Male 42%
Household Income
Panel Count
Less than 180.000 NTD 12%
180.000 to 269.999 NTD 9%
270.000 to 314.999 NTD 8%
315.000 to 429.999 NTD 8%
430.000 to 539.999 NTD 8%
540.000 to 674.999 NTD 8%
675.000 to 809.999 NTD 9%
810.000 to 1.099.999 NTD 8%
1.100.000 to 1.349.999 NTD 9%
1.350.000 to 1.619.999 NTD 5%
1.620.000 to 1.899.999 NTD 5%
1.900.000 to 2.159.999 NTD 4%
2.160.000 to 2.429.999 NTD 2%
2.430.000 to 2.699.999 NTD 1%
2.700.000 NTD or more 4%
Subtotal selection 100%
Taiwan
*Our reach includes our growing Toluna panel plus our trusted partner in this market
Panel Size: 86,000*Language: Mandarin (Traditional Chinese)Smartphone Penetration: 31%*

Data pulled January 2016 | 57
Age
Panel Count Nat Rep
18-24 44% 14%
25-34 36% 20%
35-44 15% 21%
45-54 4% 20%
55-99 1% 26%
Gender
Panel Count Nat Rep
Female 62% 51%
Male 38% 49%
Geographic Region
Panel Count
Central Thailand 48%
Eastern Thailand 8%
Northeastern Thailand 18%
Northern Thailand 26%
Household Income
Panel Count
Less than 70,000 Baht 32%
70,001 to 135,000 Baht 15%
135,001 to 200,000 Baht 9%
200,001 to 265,000 Baht 6%
265,001 to 330,000 Baht 5%
330,001 to 395,000 Baht 6%
395,001 to 460,000 Baht 3%
460,001 to 525,000 Baht 3%
525,001 to 590,000 Baht 2%
590,001 to 655,000 Baht 2%
655,001 to 900,000 Baht 3%
900,001 Baht or more 7%
Prefer not to say 7%
Subtotal selection 100%
Thailand Panel Size: 85,000Language: ThaiSmartphone Penetration: 51%*
According to data from December 2015, +/-20% of respondents complete Toluna
surveys via a mobile device
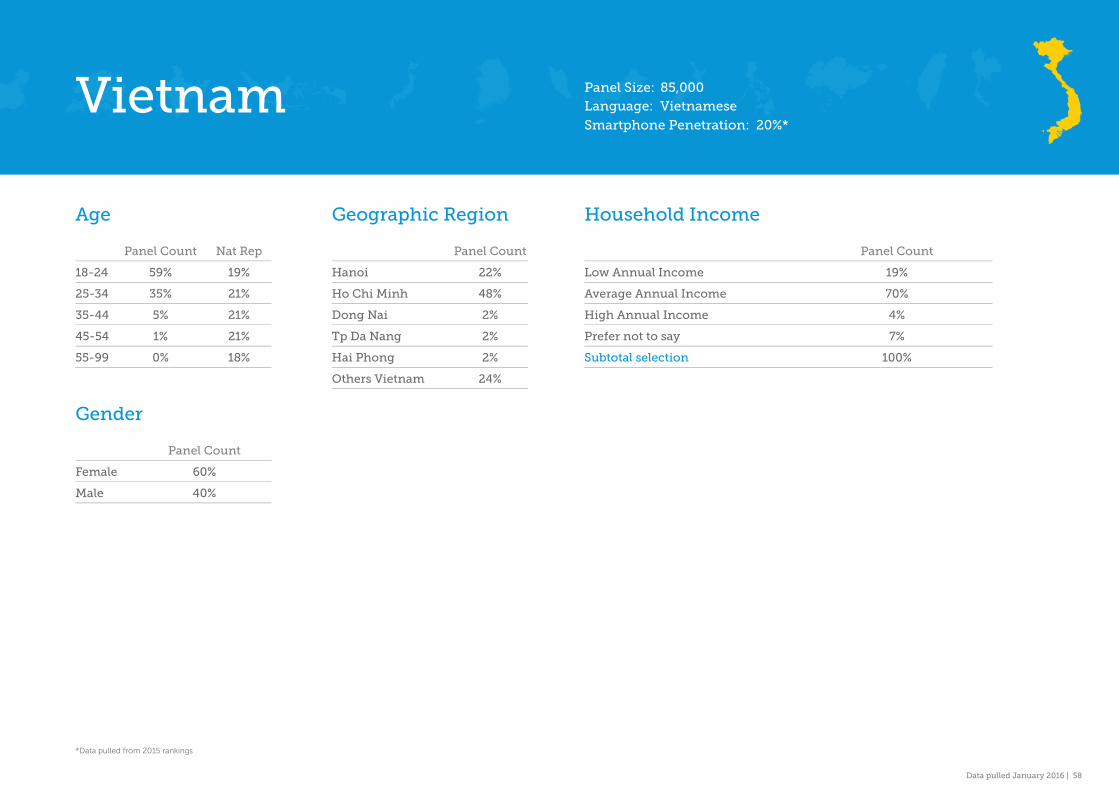
Data pulled January 2016 | 58
Vietnam
Age
Panel Count Nat Rep
18-24 59% 19%
25-34 35% 21%
35-44 5% 21%
45-54 1% 21%
55-99 0% 18%
Gender
Panel Count
Female 60%
Male 40%
Geographic Region
Panel Count
Hanoi 22%
Ho Chi Minh 48%
Dong Nai 2%
Tp Da Nang 2%
Hai Phong 2%
Others Vietnam 24%
Household Income
Panel Count
Low Annual Income 19%
Average Annual Income 70%
High Annual Income 4%
Prefer not to say 7%
Subtotal selection 100%
Panel Size: 85,000Language: Vietnamese
Smartphone Penetration: 20%*
*Data pulled from 2015 rankings
Example profi le data gathered by Toluna2016

Geographically customized U.S.A. only
60
AutomotiveNumber of Cars in your household
Main car you drive - Year
Main car you drive - Make
Main car you drive - Model
Main car you drive - Style
Main car you drive - Own or lease
Main car you drive - Year purchased
Main car you drive - Purchased new or secondhand
Main car you drive - Fuel
Main car you drive - Owner
Second car in household - Year
Second car in household - Make
Second car in household - Model
Second car in household - Style
Second car in household - Own or lease
Second car in household - Year purchased
Second car in household - Purchased new or secondhand
Second car in household - Fuel
Second car in household - Owner
Car maintenance decision maker
Next car - Purchase date
Next car - New or secondhand
Next car - Price
Next car - Make
Next car - Style
Other vehicles own or plan to buy in next 12 months - Own
Other vehicles own or plan to buy in next 12 months - Plan to buy
Scooter - Make
Scooter - Engine size
Motorbike - Make
Motorbike - Engine size
BasicFirst Name
Last Name
Gender
Password
User Name
Birthdate
Address1
Address2
City
Postal Code Validation
Race
Education
Income
Number of people living in the household
Children Under 18
Primary grocery shopper
Work Position
Ethnicity
Citizenship Status
Geographically customized U.S.A. only
61
B2BEmployment status
Sector where you work
Type of fi rm you work for
Main sector of activity of your company
Specifi c area of manufacturing worked in
Specifi c area of retailing worked in
Specifi c area of the public sector worked in
Department worked in
IT areas involved in
Position in the company
Number of employees in your offi ce
Number of total employees in your company
Number of computers your organization uses globally
Company revenue globally
Approximate yearly global turnover of your organization
Number of people you manage
Decision Maker, Infl uencer or None - Advertising/Marketing
Decision Maker, Infl uencer or None - Computer hardware
Decision Maker, Infl uencer or None - Computer networks
Decision Maker, Infl uencer or None - Employe benefi ts/Mutual insurance
Decision Maker, Infl uencer or None - Finance
Decision Maker, Infl uencer or None - General offi ce supplies
Decision Maker, Infl uencer or None - Human resources
Decision Maker, Infl uencer or None - Logistics/Strategic planning
Decision Maker, Infl uencer or None - Manufacturing/Production
Decision Maker, Infl uencer or None - Motor pool
Decision Maker, Infl uencer or None - Shipping/Mail services
Decision Maker, Infl uencer or None - Software/Application development
Decision Maker, Infl uencer or None - Telecommunications/Mobile
Decision Maker, Infl uencer or None - Travel and transport arrangements
What year did you start working fory our current organization
BeautyLuxury products purchased in last 12 months
Personal care products used at least once per week
Types of stores where personal care products are purchased
FinanceFinancial Institutions where you have an account
Credit cards - Personal
Credit cards - Business
Loan types
Financial assets owned
Permanent overdraft/revolving credit access
Financial decision maker in household
Mortgage loan types
Stocks/bonds securities owned
Security trades made in the last 12 months
Investable assets amount

Geographically customized U.S.A. only
62
HealthHealth and medical areas that aff ect you
Health and medical areas that aff ect someone in your household
Health and medical areas that you provide care for
Allergies
Food allergies
Breathing and respiratory conditions
Cancer conditions
Diabetes types
Digestive conditions
Eye/Ear/Nose/Throat conditions
Heart/Blood conditions
Immunological conditions
Men’s health conditions
Mental health and behavior conditions
Neurological/Brain-related conditions
Bone/Joint/Muscle conditions
Physical appearance conditions
Sexual health conditions
Skin conditions
Sleep conditions
Weight conditions
Women’s health conditions
Medical devices you use
Medical devices used by someone in your household
Medical devices used by someone you provide care for
Vision/Eye conditions
Home & FamilyMain salary earner in the household
Education level of main salary earner, if not you
Position of main salary earner, if not you
Monthly net income - you
Estimated household yearly income
Marital Status
Children Date of Birth (up to 10)
Children Gender (up to 10)
Expecting a baby in the household
Pregnancy planning in the next 3 months
City population
Residential status
Date of plans to move to a new residence
Secondary residence or vacation home owned
Number of dogs in household
Number of cats in household
Number of other pets in household
Additional languages spoken
Ethnic heritage
InternetInternet service provider at home
Internet connection speed at home
Places where you access the internet
Internet usage frequency - business purposes
Internet usage frequency - personal purposes
Computer systems you own in the next 12 months
Computer systems you plan to buy in the next 12 months
Frequency of online shopping done in the last 12 months
Items purchased online in the last 12 months
Online social network websites
Online social network frequency

Geographically customized U.S.A. only
63
Medical ProfessionalsAge
Gender
Graduation Year
MD/DO
ICD9 data
Prescribing behavior
Primary & secondary areas of specialty
Empanelled
Type of Practice
Type of Physician
Health and Medical Areas
Non-Physician Specialties
MediaHours spent per day watching TV - week day
Hours spent per day listening to the radio - week day
Hours spent per day reading magazines - week day
Hours spent per day reading newspapers - week day
Hours spent per day watching TV - weekend
Hours spent per day listening to the radio - weekend
Hours spent per day reading magazines - weekend
Hours spent per day reading newspapers - weekend
TV services
Cable/Satellite provider
Television networks
Frequence of attending the cinema/movies
Movie types enjoyed
Magazine types
Newspapers regularly read
Magazines regularly read
Website types
Media technology devices
Mobile PhoneMobile phone service provider - personal
Mobile phone brand - personal
Mobile phone smartphone - personal
Moble operating system - personal
Plan to change provider - personal
Mobile phone contract type - personal
Mobile phone monthly bill amount - personal
Mobile phone decision maker - business
Mobile phone service provider - business
Mobile phone brand - business
Mobile phone smartphone - business
Moble operating system - business
Plan to change provider - business
Mobile phone contract type - business
Mobile phone monthly bill amount - business
Interested in taking mobile phone surveys?
Mobile phone number

Geographically customized U.S.A. only
64
ShoppingType of store where you buy groceries
Main supermarket where you shop
Other supermarkets where you shop
Main online supermarkets where you shop
Other online supermarkets where you shop
CPG products purchased in the past 6 months
Alcohol types you’ve drank in the past 6 months
Alcohol brands you’ve drank in the past 6 months
Types of beer you drink
Beer brands
Do you smoke?
Which brand of cigarettes do you usually smoke?
Are you currently on a diet or have you been in the last 6 months?
Frequency of going to restaurants for lunch
Frequency of going to restaurants for dinner
Frequency of going to bars/coff ee shops
Frequency of going out clubbing/dancing
Frequency of buying take-out food for lunch
Frequency of buying take-out food for dinner
Frequency of going to fast-food restaurants
Frequency of cooking meals at home
Fast Food restaurants visited in the last 3 months
Types of stores shopped at in the last 6 months
Wholesale warehouses shopped at in the last 6 months
SportsSports played
Do you have a gym membership?
Frequency of practicing sports
Sports watched on TV
Hobbies/Interests
Types of online gambling activities engaged in

Geographically customized U.S.A. only
65
TravelTravel abroad in the past 12 months - Liesure
Travel abroad in the past 12 months - Business
Take a plane when travelling abroad in last 12 months - Liesure
Take a train when travelling abroad in last 12 months - Liesure
Rent a car when travelling abroad in last 12 months - Liesure
Stay in a hotel when travelling abroad in last 12 months - Liesure
Travel destinations in last 12 months - Liesure
Travel websites used to book trips abroad in past 12 months - Liesure
Airline companies used in past 12 months - Liesure
Airline class - Liesure
Hotel category - Liesure
Taken a cruise in the last 2 years - Liesure
Disney parks you plan to visit in the next 12 months
Take a plane when travelling abroad in last 12 months - Business
Take a train when travelling abroad in last 12 months - Business
Rent a car when travelling abroad in last 12 months - Business
Stay in a hotel when travelling abroad in last 12 months - Business
Travel destinations in last 12 months - Business
Travel websites used to book trips abroad in past 12 months - Business
Airline companies used in past 12 months - Business
Airline class - Business
Hotel category - Business
Video GamesGame systems you own
How often do you play per week
On average, how many hours per week do you play?
Type of game systems played
Do you play video games online?
Who else in the household plays video games?
Game systems used by other members of household
Intention to buy a game console in next 12 months
Which system to you intend to buy in the next 12 months?


18 Offi ces Worldwide | Get In TouchNorth AmericaWilton, CT (NA Headquarters) +1 203 834 8585
Dallas, TX +1 972 732 7323
North Andover, MA+1 978 983 2500
Toronto, Canada+ 1 416 733 7562
EMEAParis, France (Global Headquarters)+33 (0) 1 40 89 71 00
London, UK+44 (0) 20 8832 1700
Amsterdam, Netherlands+31 (0)20 846 67 43
Frankfurt, Germany+49(0) 69 8700 199-00
Haifa, Israel+972 4 8501586
Madrid, Spain+34 91 436 73 90
Timisoara, Romania+40 256 406 900
APACSydney, Australia+61 2 8249 1927
Gurgaon, India+91 124 412 6700
Hong Kong+852 3512 0600
Kuala Lumpur, Malaysia+603 2298 7323
Seoul, South Korea+82-2-6004-1342
Singapore+65 6818 9741
Tokyo, Japan+81 3 5459-1067
North America:North America:North America:North America:North America:North America:North America:North America:North America:North America:North America:North America:North America:North America:North America:North America:North America:North America:North America:4 Offi ces4 Offi ces4 Offi ces4 Offi ces4 Offi ces4 Offi ces4 Offi ces4 Offi ces4 Offi ces4 Offi ces4 Offi ces4 Offi ces4 Offi ces4 Offi ces4 Offi ces4 Offi ces4 Offi ces4 Offi ces4 Offi ces4 Offi ces
APAC:APAC:APAC:APAC:APAC:APAC:7 Offi ces7 Offi ces7 Offi ces7 Offi ces7 Offi ces7 Offi ces7 Offi ces
EMEA:EMEA:EMEA:EMEA:EMEA:EMEA:EMEA:EMEA:EMEA:EMEA:EMEA:EMEA:EMEA:EMEA:EMEA:EMEA:EMEA:7 Offi ces7 Offi ces7 Offi ces7 Offi ces7 Offi ces7 Offi ces7 Offi ces7 Offi ces7 Offi ces7 Offi ces
67
EMEA:7 Offi ces
APAC:7 Offi ces
North America:4 Offi ces
