pccs diabetes and the heart kdm ndm ifg igt ngt ausdiab = australian diabetes, obesity, and...
TRANSCRIPT
PCCS Diabetes and the Heart
Professor Mike Kirby FRCP
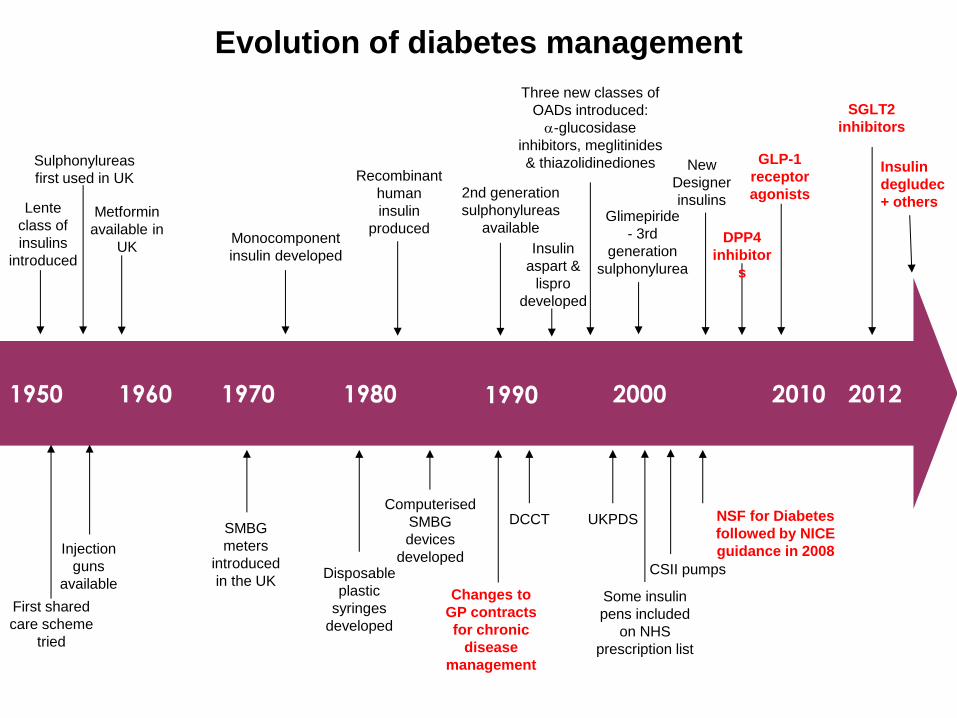
Evolution of diabetes management
1950 1960 1970 1980 1990 2000
Lente
class of
insulins
introduced
Sulphonylureas
first used in UK
Metformin
available in
UK
Injection
guns
available
SMBG
meters
introduced
in the UK
Monocomponent
insulin developed
Disposable
plastic
syringes
developed
Recombinant
human
insulin
produced
Computerised
SMBG
devices
developed
Changes to
GP contracts
for chronic
disease
management
DCCT UKPDS
2nd generation
sulphonylureas
available
Some insulin
pens included
on NHS
prescription list
NSF for Diabetes
followed by NICE
guidance in 2008
CSII pumps
Insulin
aspart &
lispro
developed
Three new classes of
OADs introduced:
-glucosidase
inhibitors, meglitinides
& thiazolidinediones
Glimepiride
- 3rd
generation
sulphonylurea
New
Designer
insulins
First shared
care scheme
tried
GLP-1
receptor
agonists
2010
DPP4
inhibitor
s
2012
SGLT2
inhibitors
Insulin
degludec
+ others
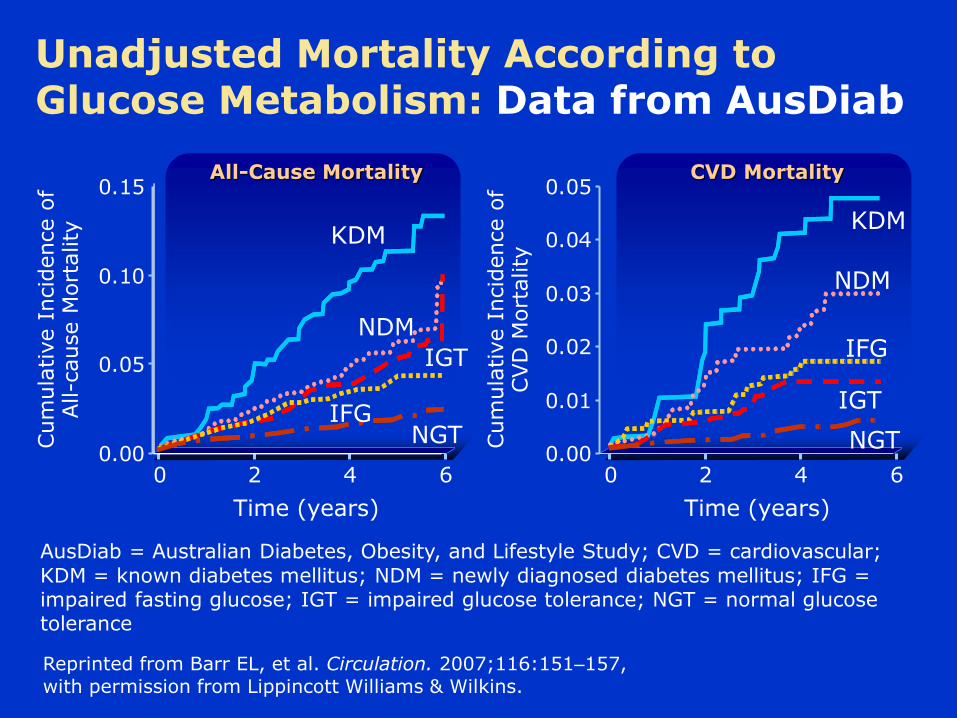
Unadjusted Mortality According to Glucose Metabolism: Data from AusDiab
Cum
ula
tive I
ncid
ence o
f All-c
ause M
ort
ality
Time (years)
Reprinted from Barr EL, et al. Circulation. 2007;116:151–157, with permission from Lippincott Williams & Wilkins.
0.00
0.05
0.10
0.15
0 2 6 4
All-Cause Mortality
KDM
Cum
ula
tive I
ncid
ence o
f CVD
Mort
ality
Time (years)
0.00
0.01
0.02
0.03
0.04
0.05
0 2 6 4
CVD Mortality
NDM
IGT
IFG NGT
KDM
NDM
IFG
IGT
NGT
AusDiab = Australian Diabetes, Obesity, and Lifestyle Study; CVD = cardiovascular;
KDM = known diabetes mellitus; NDM = newly diagnosed diabetes mellitus; IFG = impaired fasting glucose; IGT = impaired glucose tolerance; NGT = normal glucose tolerance

Multifactorial intervention benefits diabetes and CV outcomes: STENO-2 study
Gaede P et al. New Eng J Med 2003; 348: 383–93
0
20
40
60
Pati
en
t w
ith
pri
mary
co
mp
osit
e e
nd
po
int
(%)
Conventional therapy Multifactorial intervention
96 72 48 24 0
Follow-up (months)
p=0.007
Multifactorial intervention = stepwise implementation of behaviour modification,
pharmacological therapy targeting hyperglycaemia, hypertension, dyslipidaemia and
microalbuminuria
20% Absolute risk reduction in CVD
53% RR reduction in CVD 60% RR reduction in
microvascular complications
N=160
Kaplan-Meier estimates of the composite end points Death from CV causes: non-fatal MI, CABG, angioplasty, non-fatal stroke, amputation or surgery for PVD

How do we modify CV risk in T2D?1–3
Lifestyle modification
Glycaemic control
Multifactorial approach
Blood pressure control
Platelet inhibition
Management of dyslipidaemia
CV, cardiovascular; T2D, type 2 diabetes.
1. Rydén L et al; Eur Heart J. 2013; 34: 3035–3087; 2. Fox CS et al; Diabetes Care. 2015; 38: 1777–1803; 3. Piepoli MF et al; Eur Heart J. 2016; 37: 2315–2381.
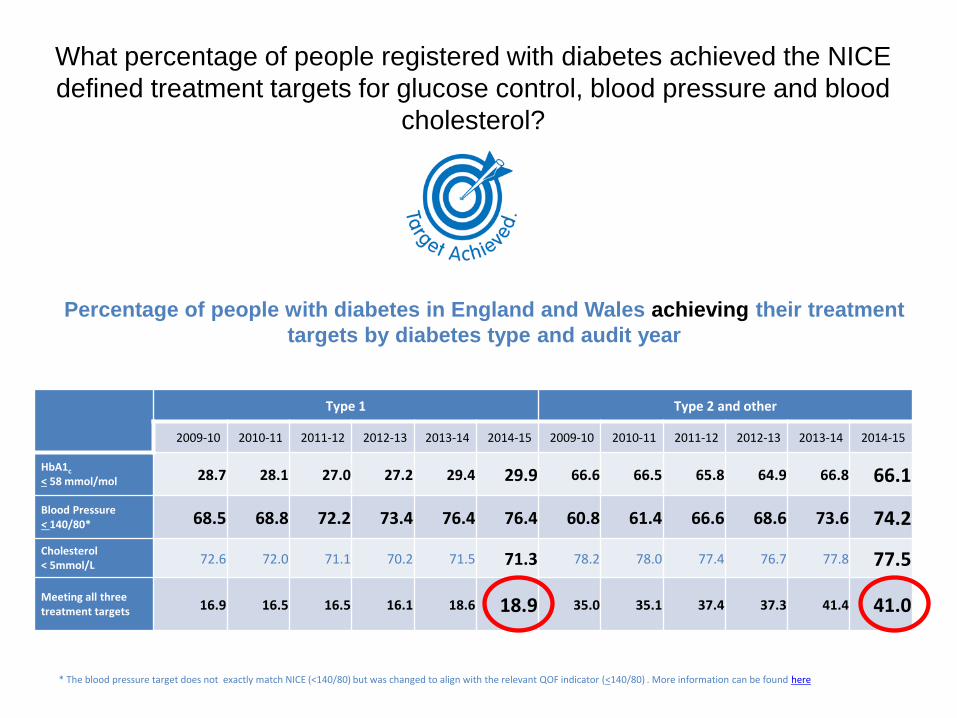
What percentage of people registered with diabetes achieved the NICE
defined treatment targets for glucose control, blood pressure and blood
cholesterol?
Type 1 Type 2 and other
2009-10 2010-11 2011-12 2012-13 2013-14 2014-15 2009-10 2010-11 2011-12 2012-13 2013-14 2014-15
HbA1c < 58 mmol/mol 28.7 28.1 27.0 27.2 29.4 29.9 66.6 66.5 65.8 64.9 66.8 66.1
Blood Pressure < 140/80* 68.5 68.8 72.2 73.4 76.4 76.4 60.8 61.4 66.6 68.6 73.6 74.2
Cholesterol < 5mmol/L 72.6 72.0 71.1 70.2 71.5 71.3 78.2 78.0 77.4 76.7 77.8 77.5
Meeting all three treatment targets 16.9 16.5 16.5 16.1 18.6 18.9 35.0 35.1 37.4 37.3 41.4 41.0
Percentage of people with diabetes in England and Wales achieving their treatment
targets by diabetes type and audit year
* The blood pressure target does not exactly match NICE (<140/80) but was changed to align with the relevant QOF indicator (<140/80) . More information can be found here
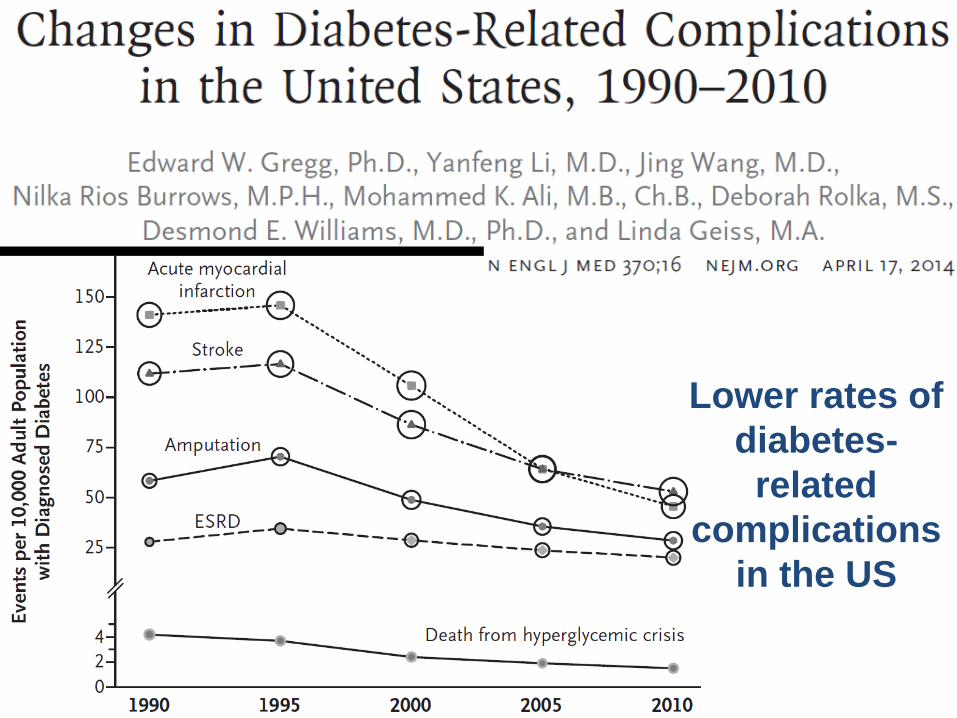
Lower rates of
diabetes-
related
complications
in the US
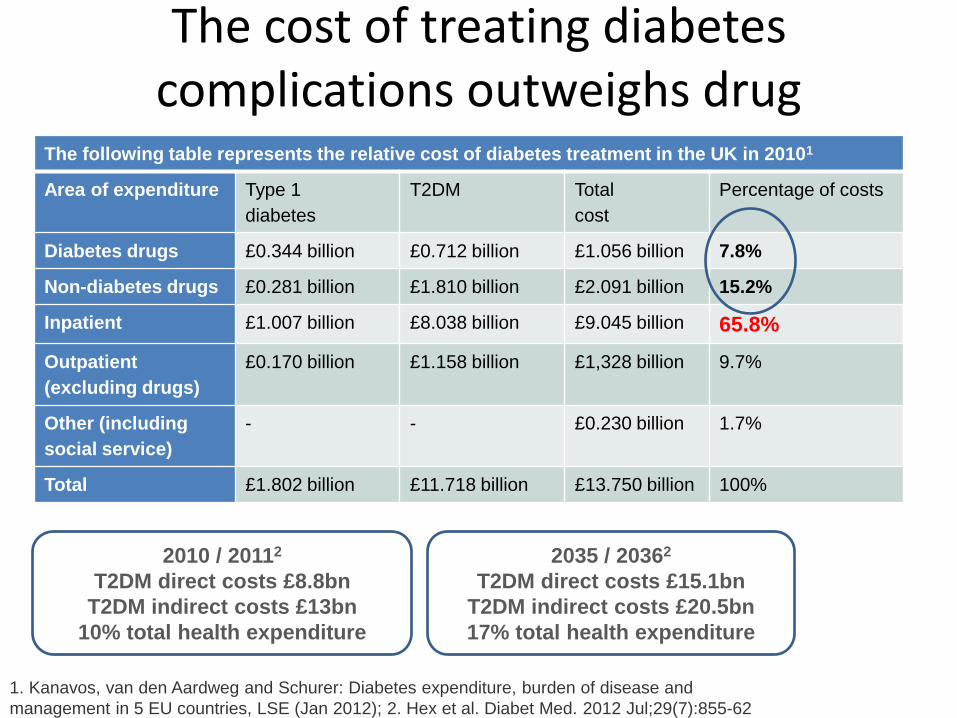
The cost of treating diabetes complications outweighs drug
acquisition costs The following table represents the relative cost of diabetes treatment in the UK in 20101
Area of expenditure Type 1
diabetes
T2DM Total
cost
Percentage of costs
Diabetes drugs £0.344 billion £0.712 billion £1.056 billion 7.8%
Non-diabetes drugs £0.281 billion £1.810 billion £2.091 billion 15.2%
Inpatient £1.007 billion £8.038 billion £9.045 billion 65.8%
Outpatient
(excluding drugs)
£0.170 billion £1.158 billion £1,328 billion 9.7%
Other (including
social service)
- - £0.230 billion 1.7%
Total £1.802 billion £11.718 billion £13.750 billion 100%
1. Kanavos, van den Aardweg and Schurer: Diabetes expenditure, burden of disease and
management in 5 EU countries, LSE (Jan 2012); 2. Hex et al. Diabet Med. 2012 Jul;29(7):855-62
2035 / 20362
T2DM direct costs £15.1bn
T2DM indirect costs £20.5bn
17% total health expenditure
2010 / 20112
T2DM direct costs £8.8bn
T2DM indirect costs £13bn
10% total health expenditure
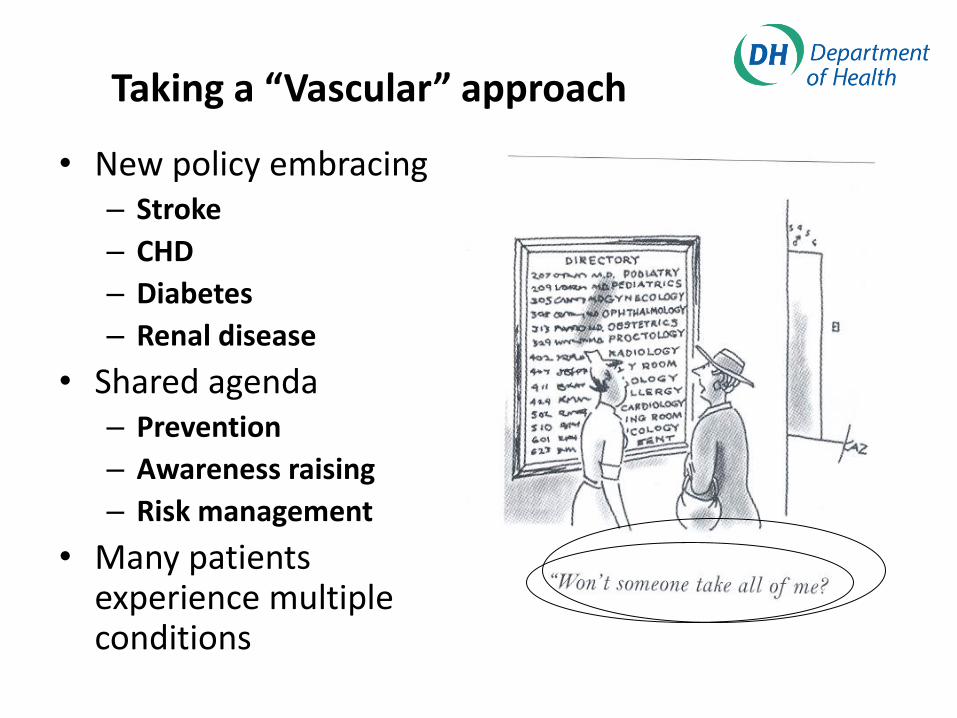
Taking a “Vascular” approach
• New policy embracing – Stroke
– CHD
– Diabetes
– Renal disease
• Shared agenda – Prevention
– Awareness raising
– Risk management
• Many patients experience multiple conditions
Outline
• So what’s new?
• 2016/17 guidelines
• How & why to combine therapies
• Emerging cardiovascular benefits of newer
diabetes therapies

CVD is the leading cause of death in people with diabetes*
CI, confidence interval; CV, cardiovascular; CVD, cardiovascular disease; MI, myocardial infarction; T1D, type 1 diabetes; T2D, type 2 diabetes.
1. Emerging Risk Factors Collaboration; N Engl J Med. 2011; 364: 829–841; 2. Centers for Disease Control and Prevention. National diabetes fact sheet, 2011. CDC website; 2011. Available from: http://www.cdc.gov/diabetes/pubs/pdf/ndfs_2011.pdf [Accessed March 2017]; 3. International Diabetes Federation. IDF Diabetes Atlas, 7th edn. Brussels, Belgium: IDF, 2015. Available from: http://www.diabetesatlas.org [Accessed March 2017]; 4. Burgess DC et al; Eur Heart J. 2010; 31: 92–99.
0
1
2
3
CV death All-cause mortality
Haz
ard
rat
io (
95
% C
I) (
dia
bet
es v
s. n
o
dia
bet
es)
Mortality risk associated with diabetes* (n=820,900)1
0
7
6
5
4
3
2
1
0
40 50 60 70 80 90
Age (years)
Year
s o
f lif
e lo
st
Men
7
6
5
4
3
2
1
0
40 50 60 70 80 90 0
Age (years)
Women
Non-vascular deaths
Vascular deaths Heart disease was noted in more than two-thirds of diabetes-related deaths among
people aged 65 years or older (T1D and T2D data combined)2
Years of life lost in people with diabetes* compared with non-diabetes peers1
In high-income countries, up to 91% of adults with diabetes have T2D3
36.8% of all MIs in patients with T2D were found to be silent in the FIELD study (n=9,795), which is within the reported range of silent MIs (22–40%)4
*Information on diabetes type (i.e., type 1 or 2) was not available, although the age of the participants suggests that the large majority with diabetes would have type 2.
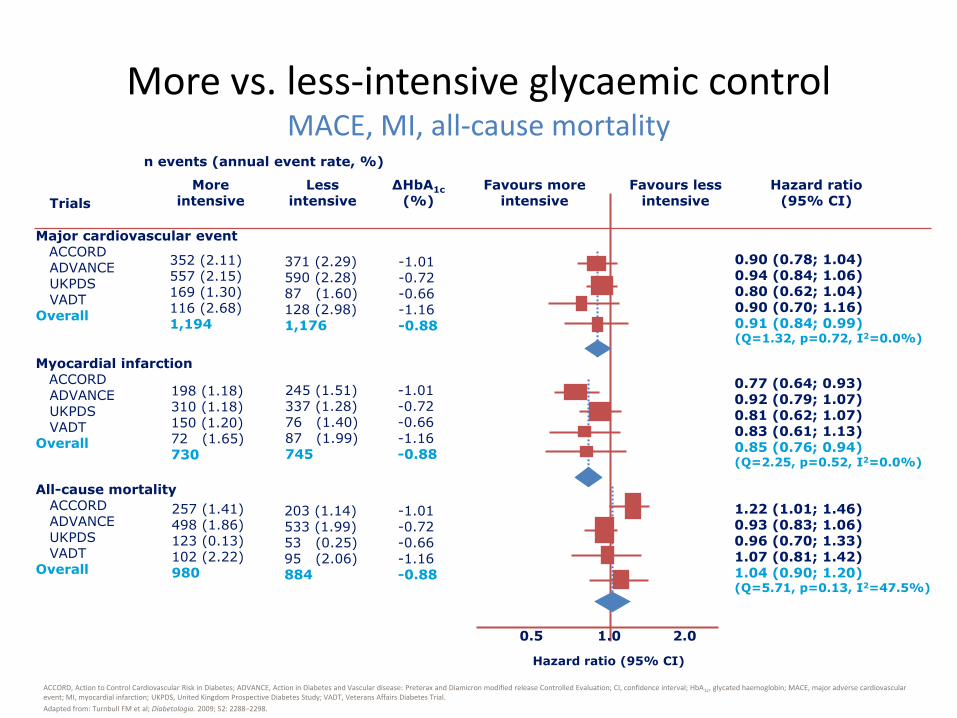
More vs. less-intensive glycaemic control MACE, MI, all-cause mortality
ACCORD, Action to Control Cardiovascular Risk in Diabetes; ADVANCE, Action in Diabetes and Vascular disease: Preterax and Diamicron modified release Controlled Evaluation; CI, confidence interval; HbA1c, glycated haemoglobin; MACE, major adverse cardiovascular event; MI, myocardial infarction; UKPDS, United Kingdom Prospective Diabetes Study; VADT, Veterans Affairs Diabetes Trial.
Adapted from: Turnbull FM et al; Diabetologia. 2009; 52: 2288–2298.
n events (annual event rate, %)
0.5 2.0 1.0
Hazard ratio (95% CI)
Hazard ratio (95% CI) Trials
More intensive
Less intensive
ΔHbA1c
(%)
Favours more intensive
Favours less intensive
Myocardial infarction ACCORD ADVANCE UKPDS VADT Overall
198 (1.18) 310 (1.18) 150 (1.20) 72 (1.65) 730
245 (1.51) 337 (1.28) 76 (1.40) 87 (1.99) 745
-1.01 -0.72 -0.66 -1.16 -0.88
0.77 (0.64; 0.93) 0.92 (0.79; 1.07) 0.81 (0.62; 1.07) 0.83 (0.61; 1.13) 0.85 (0.76; 0.94) (Q=2.25, p=0.52, I2=0.0%)
0.90 (0.78; 1.04) 0.94 (0.84; 1.06) 0.80 (0.62; 1.04) 0.90 (0.70; 1.16) 0.91 (0.84; 0.99) (Q=1.32, p=0.72, I2=0.0%)
Major cardiovascular event ACCORD ADVANCE UKPDS VADT Overall
352 (2.11) 557 (2.15) 169 (1.30) 116 (2.68) 1,194
371 (2.29) 590 (2.28) 87 (1.60) 128 (2.98) 1,176
-1.01 -0.72 -0.66 -1.16 -0.88
1.22 (1.01; 1.46) 0.93 (0.83; 1.06) 0.96 (0.70; 1.33) 1.07 (0.81; 1.42) 1.04 (0.90; 1.20) (Q=5.71, p=0.13, I2=47.5%)
All-cause mortality ACCORD ADVANCE UKPDS VADT Overall
257 (1.41) 498 (1.86) 123 (0.13) 102 (2.22) 980
203 (1.14) 533 (1.99) 53 (0.25) 95 (2.06) 884
-1.01 -0.72 -0.66 -1.16 -0.88
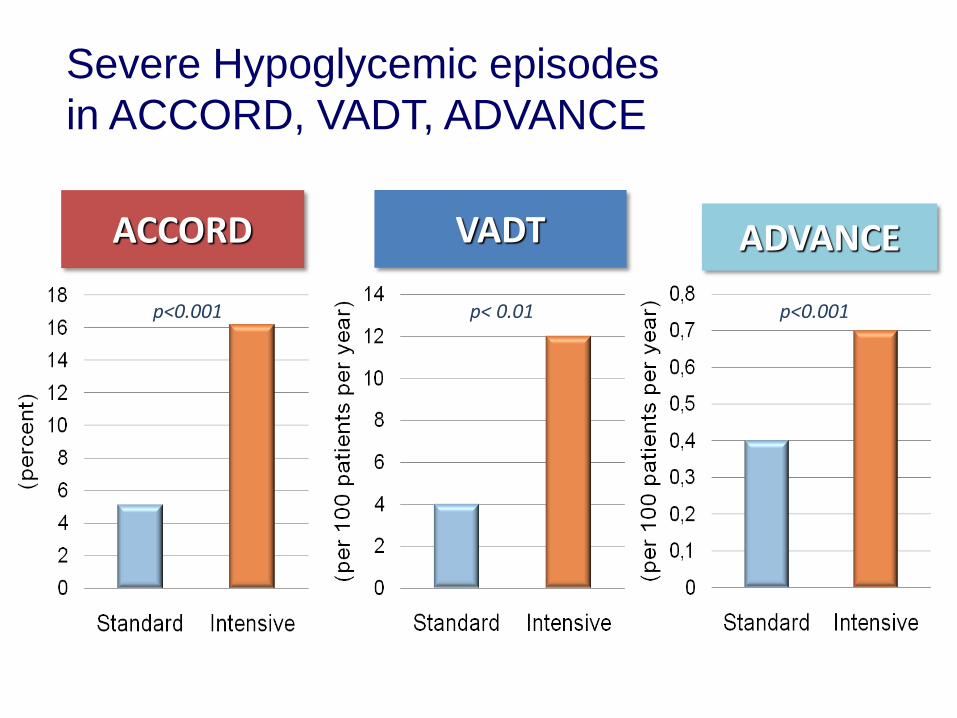
ACCORD VADT ADVANCE
p< 0.01 p<0.001 p<0.001
Severe Hypoglycemic episodes
in ACCORD, VADT, ADVANCE
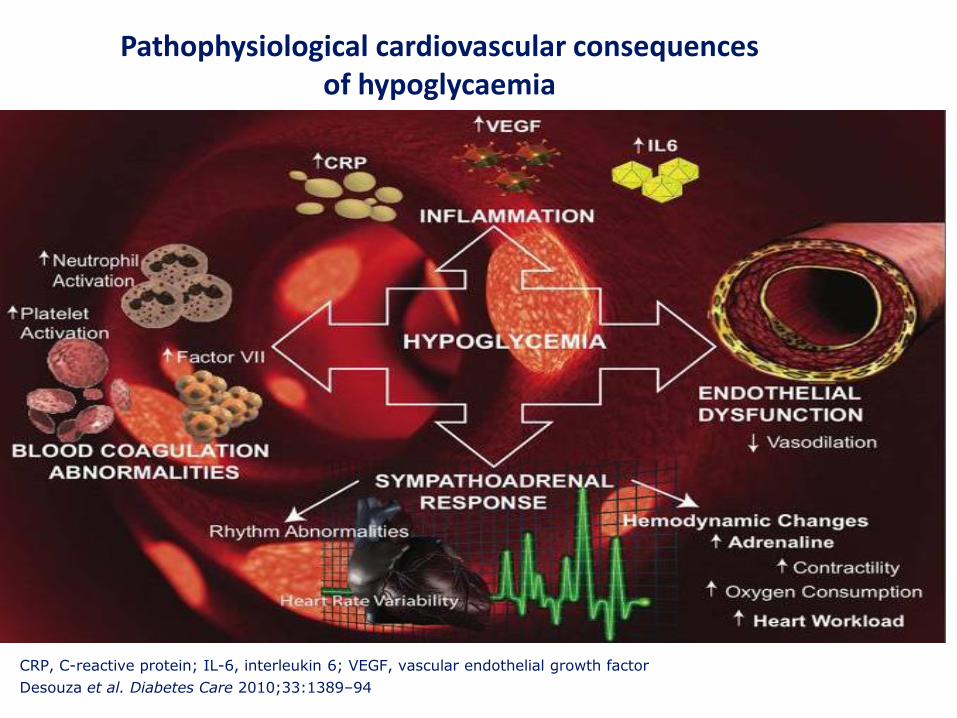
CRP, C-reactive protein; IL-6, interleukin 6; VEGF, vascular endothelial growth factor
Desouza et al. Diabetes Care 2010;33:1389–94
Pathophysiological cardiovascular consequences of hypoglycaemia
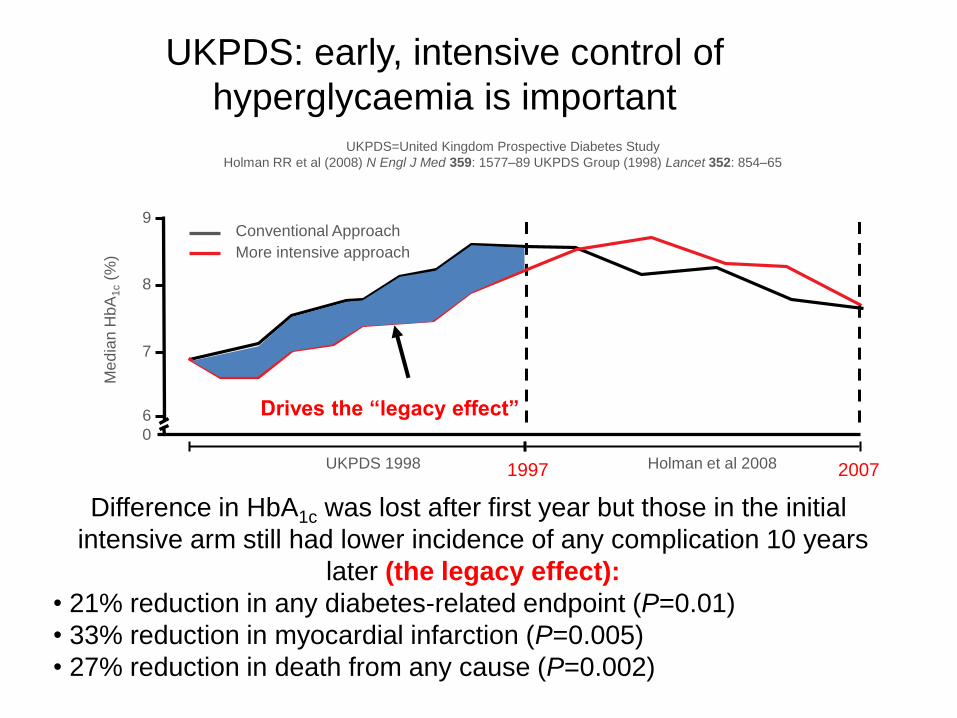
UKPDS=United Kingdom Prospective Diabetes Study
Holman RR et al (2008) N Engl J Med 359: 1577–89 UKPDS Group (1998) Lancet 352: 854–65
Me
dia
n H
bA
1c (
%)
0
6
7
8
9
UKPDS 1998
Conventional Approach
More intensive approach
Holman et al 2008
Drives the “legacy effect”
1997
Difference in HbA1c was lost after first year but those in the initial
intensive arm still had lower incidence of any complication 10 years
later (the legacy effect):
• 21% reduction in any diabetes-related endpoint (P=0.01)
• 33% reduction in myocardial infarction (P=0.005)
• 27% reduction in death from any cause (P=0.002)
2007
UKPDS: early, intensive control of
hyperglycaemia is important
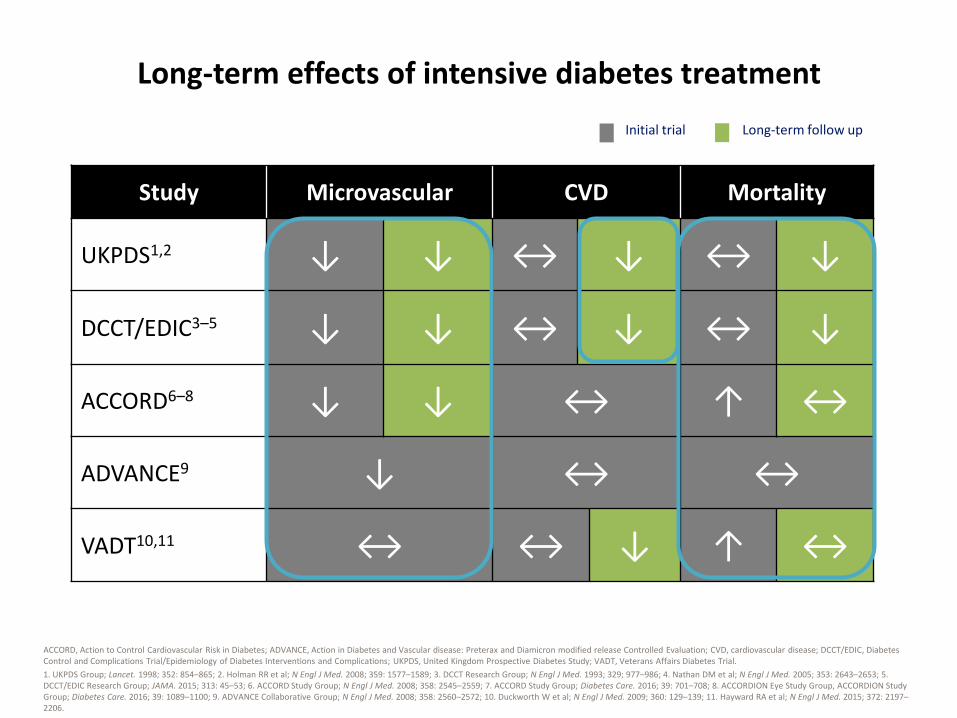
Long-term effects of intensive diabetes treatment
ACCORD, Action to Control Cardiovascular Risk in Diabetes; ADVANCE, Action in Diabetes and Vascular disease: Preterax and Diamicron modified release Controlled Evaluation; CVD, cardiovascular disease; DCCT/EDIC, Diabetes Control and Complications Trial/Epidemiology of Diabetes Interventions and Complications; UKPDS, United Kingdom Prospective Diabetes Study; VADT, Veterans Affairs Diabetes Trial.
1. UKPDS Group; Lancet. 1998; 352: 854–865; 2. Holman RR et al; N Engl J Med. 2008; 359: 1577–1589; 3. DCCT Research Group; N Engl J Med. 1993; 329; 977–986; 4. Nathan DM et al; N Engl J Med. 2005; 353: 2643–2653; 5. DCCT/EDIC Research Group; JAMA. 2015; 313: 45–53; 6. ACCORD Study Group; N Engl J Med. 2008; 358: 2545–2559; 7. ACCORD Study Group; Diabetes Care. 2016; 39: 701–708; 8. ACCORDION Eye Study Group, ACCORDION Study Group; Diabetes Care. 2016; 39: 1089–1100; 9. ADVANCE Collaborative Group; N Engl J Med. 2008; 358: 2560–2572; 10. Duckworth W et al; N Engl J Med. 2009; 360: 129–139; 11. Hayward RA et al; N Engl J Med. 2015; 372: 2197–2206.
Study Microvascular CVD Mortality
UKPDS1,2 ↓ ↓ ↔ ↓ ↔ ↓
DCCT/EDIC3–5 ↓ ↓ ↔ ↓ ↔ ↓
ACCORD6–8 ↓ ↓ ↔ ↑ ↔
ADVANCE9 ↓ ↔ ↔
VADT10,11 ↔ ↔ ↓ ↑ ↔
Initial trial Long-term follow up
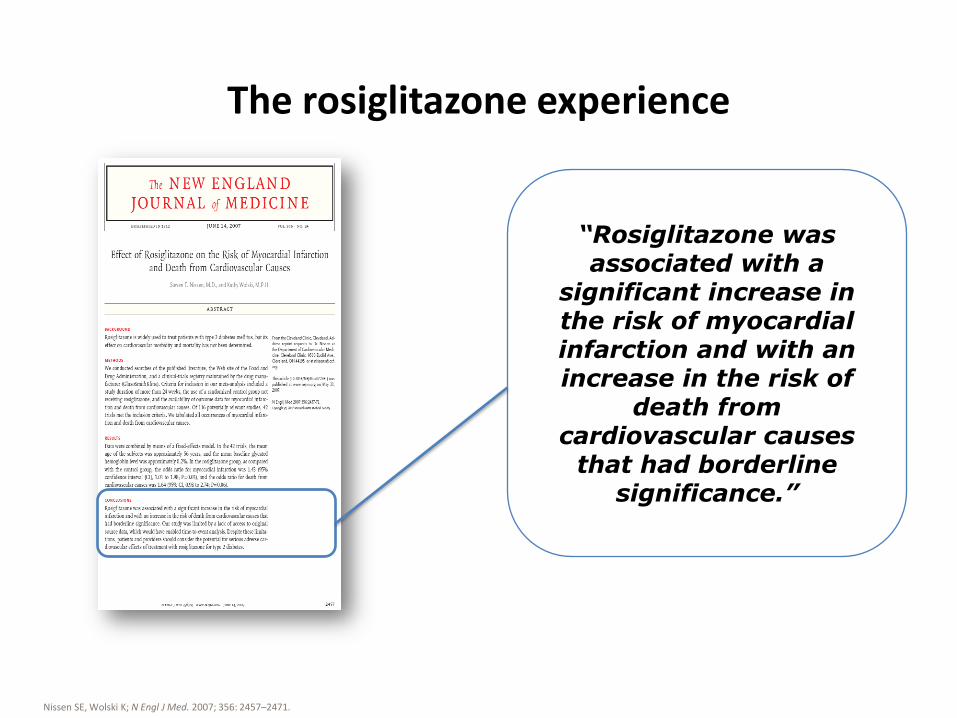
The rosiglitazone experience
Nissen SE, Wolski K; N Engl J Med. 2007; 356: 2457–2471.
“Rosiglitazone was associated with a
significant increase in the risk of myocardial infarction and with an increase in the risk of
death from cardiovascular causes
that had borderline significance.”
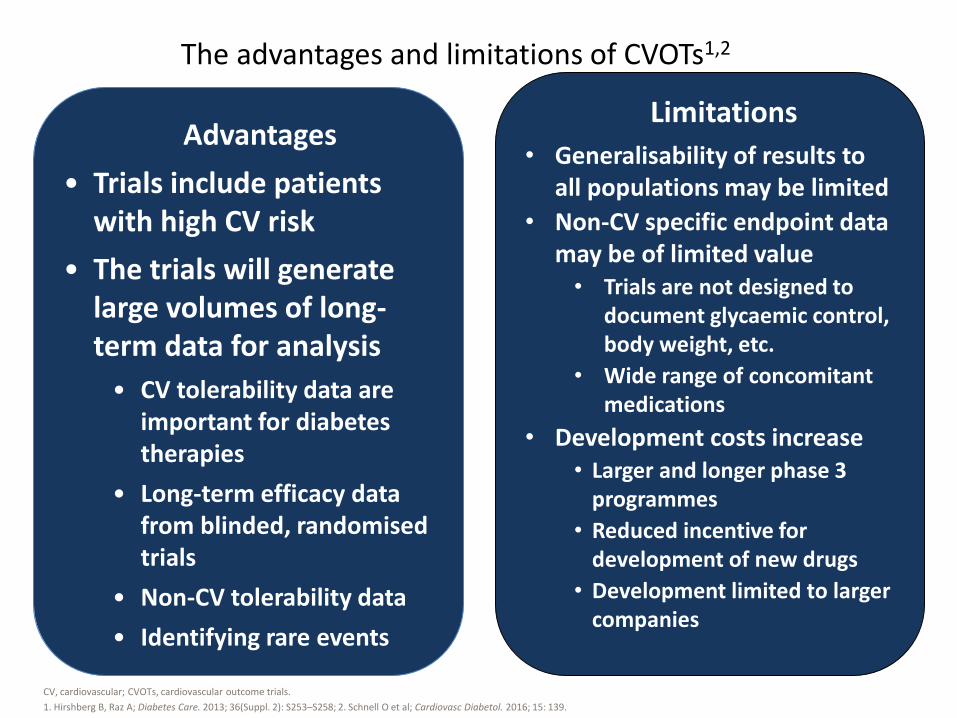
The advantages and limitations of CVOTs1,2
CV, cardiovascular; CVOTs, cardiovascular outcome trials.
1. Hirshberg B, Raz A; Diabetes Care. 2013; 36(Suppl. 2): S253–S258; 2. Schnell O et al; Cardiovasc Diabetol. 2016; 15: 139.
Pros Cons
• Trials include patients with high CV risk
• The trials will generate large volumes of long-term data for analysis
• CV tolerability data are important for diabetes therapies
• Long-term efficacy data from blinded, randomised trials
• Non-CV tolerability data
• Identifying rare events
• Generalisability of results to all populations may be limited
• Non-CV specific endpoint data may be of limited value
• Trials are not designed to document glycaemic control, body weight, etc.
• Wide range of concomitant medications
• Development costs increase • Larger and longer phase 3
programmes
• Reduced incentive for development of new drugs
• Development limited to larger companies
Advantages Limitations
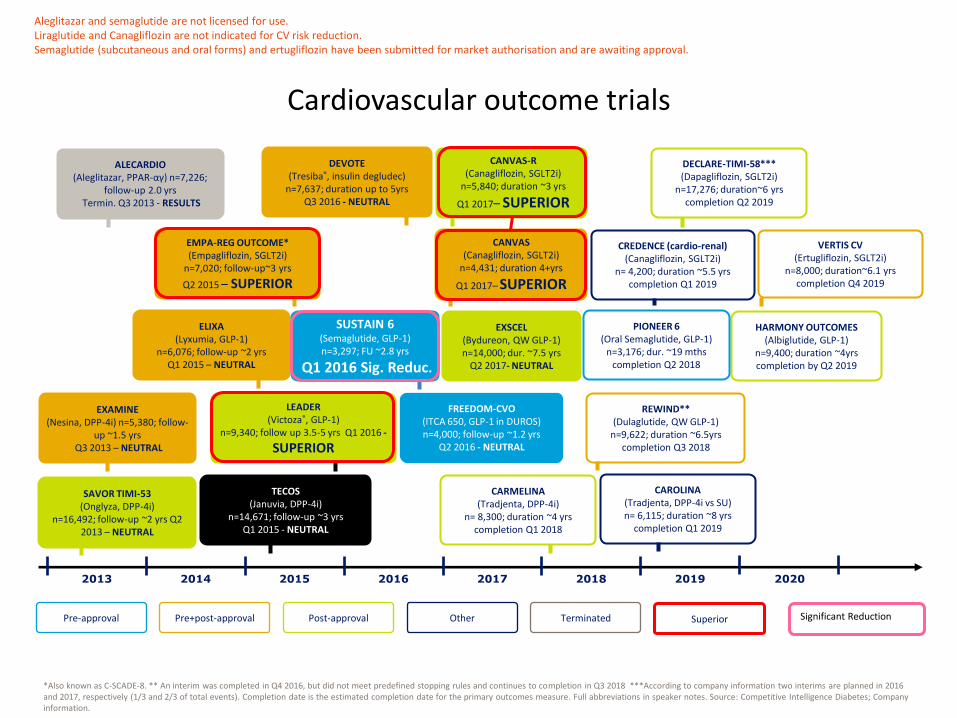
Cardiovascular outcome trials
*Also known as C-SCADE-8. ** An interim was completed in Q4 2016, but did not meet predefined stopping rules and continues to completion in Q3 2018 ***According to company information two interims are planned in 2016 and 2017, respectively (1/3 and 2/3 of total events). Completion date is the estimated completion date for the primary outcomes measure. Full abbreviations in speaker notes. Source: Competitive Intelligence Diabetes; Company information.
2013 2014 2015 2016 2017 2018 2019 2020
Pre-approval Pre+post-approval Post-approval Other Terminated
TECOS (Januvia, DPP-4i)
n=14,671; follow-up ~3 yrs Q1 2015 - NEUTRAL
CARMELINA (Tradjenta, DPP-4i)
n= 8,300; duration ~4 yrs completion Q1 2018
CAROLINA (Tradjenta, DPP-4i vs SU) n= 6,115; duration ~8 yrs
completion Q1 2019
SAVOR TIMI-53 (Onglyza, DPP-4i)
n=16,492; follow-up ~2 yrs Q2 2013 – NEUTRAL
EXAMINE (Nesina, DPP-4i) n=5,380; follow-
up ~1.5 yrs Q3 2013 – NEUTRAL
ALECARDIO (Aleglitazar, PPAR-αγ) n=7,226;
follow-up 2.0 yrs Termin. Q3 2013 - RESULTS
LEADER (Victoza®, GLP-1)
n=9,340; follow up 3.5-5 yrs Q1 2016 -
SUPERIOR
ELIXA (Lyxumia, GLP-1)
n=6,076; follow-up ~2 yrs Q1 2015 – NEUTRAL
EMPA-REG OUTCOME* (Empagliflozin, SGLT2i)
n=7,020; follow-up~3 yrs
Q2 2015 – SUPERIOR
SUSTAIN 6 (Semaglutide, GLP-1) n=3,297; FU ~2.8 yrs
Q1 2016 Sig. Reduc.
EXSCEL (Bydureon, QW GLP-1) n=14,000; dur. ~7.5 yrs
Q2 2017- NEUTRAL
CANVAS-R (Canagliflozin, SGLT2i)
n=5,840; duration ~3 yrs
Q1 2017– SUPERIOR
DEVOTE (Tresiba®, insulin degludec)
n=7,637; duration up to 5yrs Q3 2016 - NEUTRAL
FREEDOM-CVO (ITCA 650, GLP-1 in DUROS) n=4,000; follow-up ~1.2 yrs
Q2 2016 - NEUTRAL
CREDENCE (cardio-renal) (Canagliflozin, SGLT2i)
n= 4,200; duration ~5.5 yrs completion Q1 2019
REWIND** (Dulaglutide, QW GLP-1)
n=9,622; duration ~6.5yrs completion Q3 2018
DECLARE-TIMI-58*** (Dapagliflozin, SGLT2i)
n=17,276; duration~6 yrs completion Q2 2019
VERTIS CV (Ertugliflozin, SGLT2i)
n=8,000; duration~6.1 yrs completion Q4 2019
HARMONY OUTCOMES (Albiglutide, GLP-1)
n=9,400; duration ~4yrs completion by Q2 2019
PIONEER 6 (Oral Semaglutide, GLP-1)
n=3,176; dur. ~19 mths completion Q2 2018
CANVAS (Canagliflozin, SGLT2i)
n=4,431; duration 4+yrs
Q1 2017– SUPERIOR
Superior Significant Reduction
Aleglitazar and semaglutide are not licensed for use. Liraglutide and Canagliflozin are not indicated for CV risk reduction. Semaglutide (subcutaneous and oral forms) and ertugliflozin have been submitted for market authorisation and are awaiting approval.

The Truth Is Not So Sweet
Cardiovascular safety of diabetes drugs
• The goal of merely lowering
blood glucose levels in
diabetes is too simplistic
• With respect to CVD it appears
important how you lower blood
sugar as well as how much
• Diabetes drugs, even within
the same “class” may yield
dramatically different CV
outcomes
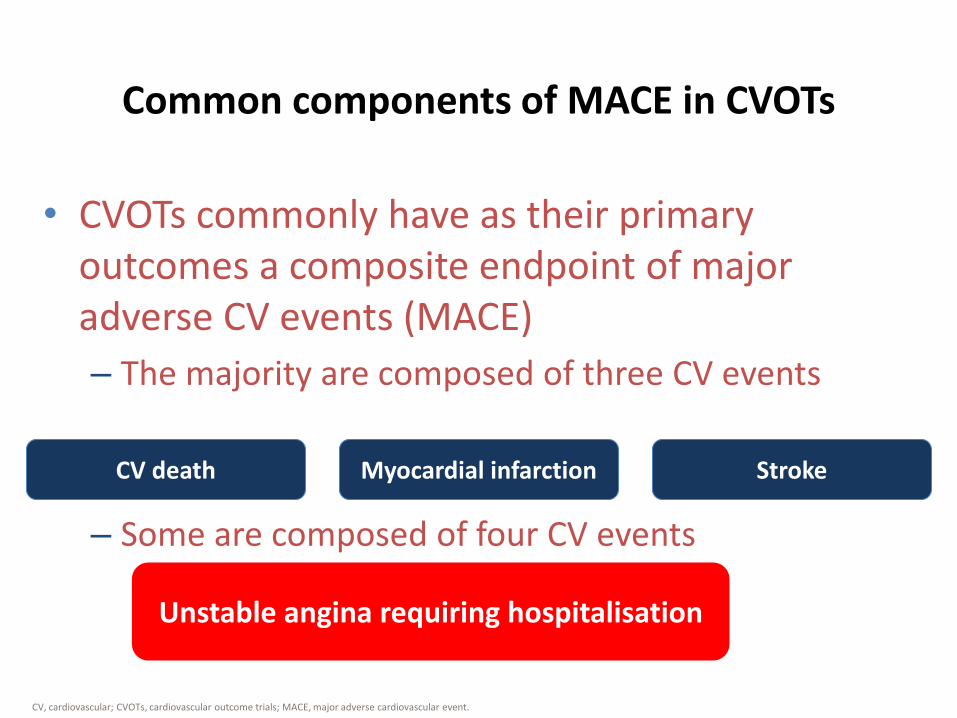
Common components of MACE in CVOTs
CV, cardiovascular; CVOTs, cardiovascular outcome trials; MACE, major adverse cardiovascular event.
• CVOTs commonly have as their primary outcomes a composite endpoint of major adverse CV events (MACE)
– The majority are composed of three CV events
– Some are composed of four CV events
Unstable angina requiring hospitalisation
CV death Myocardial infarction Stroke
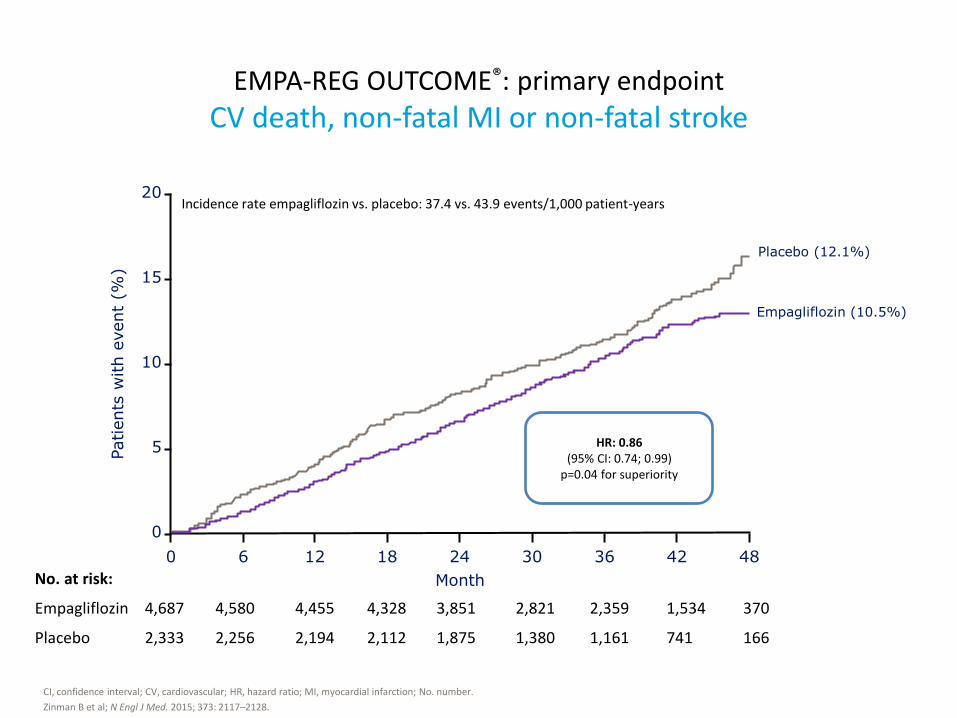
EMPA-REG OUTCOME®: primary endpoint
CV death, non-fatal MI or non-fatal stroke
CI, confidence interval; CV, cardiovascular; HR, hazard ratio; MI, myocardial infarction; No. number.
Zinman B et al; N Engl J Med. 2015; 373: 2117–2128.
No. at risk:
Empagliflozin 4,687 4,580 4,455 4,328 3,851 2,821 2,359 1,534 370
Placebo 2,333 2,256 2,194 2,112 1,875 1,380 1,161 741 166
Empagliflozin (10.5%)
Placebo (12.1%)
Month
0 6 12 18 30 24 42 36 48
20
10
5
0
15
Patients
with e
vent
(%)
Incidence rate empagliflozin vs. placebo: 37.4 vs. 43.9 events/1,000 patient-years
HR: 0.86 (95% CI: 0.74; 0.99)
p=0.04 for superiority
Month 0 6 12 18 30 24 42 36 48
20
10
5
0
15
Patients
with e
vent
(%)
HR:0.86 (95% CI: 0.74; 0.99) p=0.04 for superiority
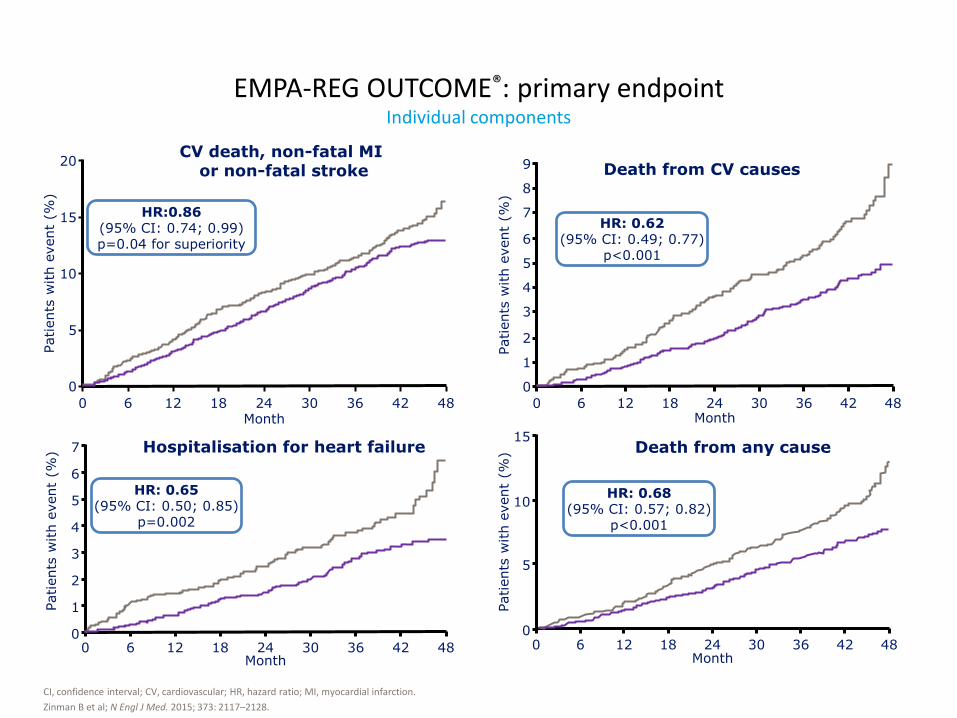
CV death, non-fatal MI or non-fatal stroke
0 6 12 18 30 24 42 36 48
Patients
with e
vent
(%)
9
7
6
0
8
5
3
2
4
1
Month
HR: 0.62 (95% CI: 0.49; 0.77)
p<0.001
Death from CV causes
0 6 12 18 30 24 42 36 48
Patients
with e
vent
(%) 7
6
0
5
3
2
4
1
Month
HR: 0.65 (95% CI: 0.50; 0.85)
p=0.002
Hospitalisation for heart failure
0 6 12 18 30 24 42 36 48
Patients
with e
vent
(%)
15
10
0
5
HR: 0.68 (95% CI: 0.57; 0.82)
p<0.001
Month
Death from any cause
CI, confidence interval; CV, cardiovascular; HR, hazard ratio; MI, myocardial infarction.
Zinman B et al; N Engl J Med. 2015; 373: 2117–2128.
EMPA-REG OUTCOME®: primary endpoint Individual components
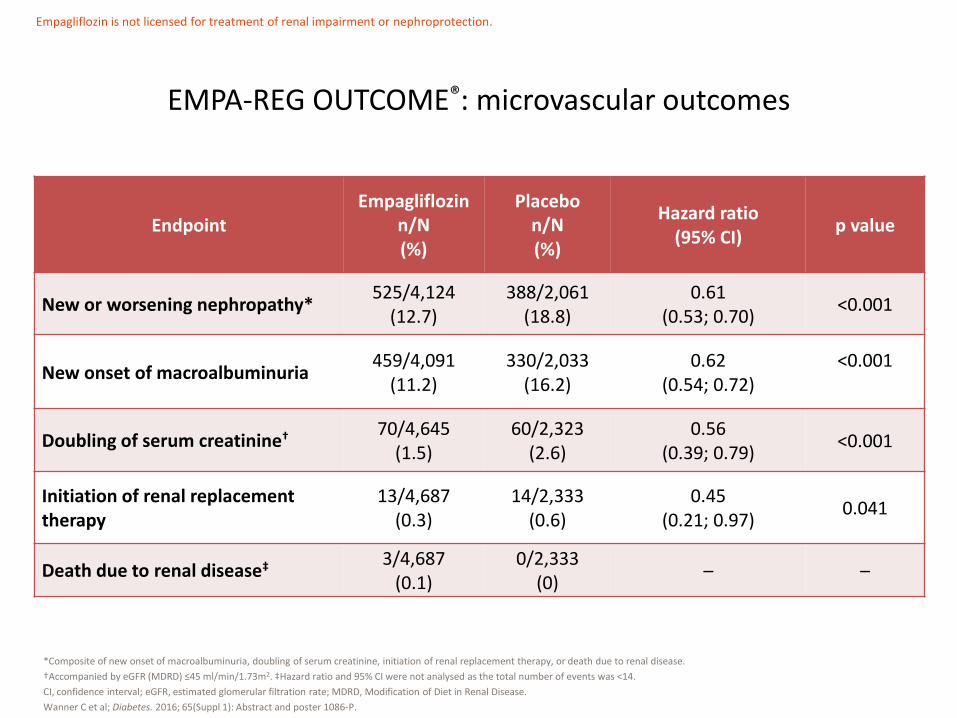
EMPA-REG OUTCOME®: microvascular outcomes
Endpoint Empagliflozin
n/N (%)
Placebo n/N (%)
Hazard ratio (95% CI)
p value
New or worsening nephropathy* 525/4,124
(12.7) 388/2,061
(18.8) 0.61
(0.53; 0.70) <0.001
New onset of macroalbuminuria 459/4,091
(11.2) 330/2,033
(16.2) 0.62
(0.54; 0.72) <0.001
Doubling of serum creatinine† 70/4,645 (1.5)
60/2,323 (2.6)
0.56 (0.39; 0.79)
<0.001
Initiation of renal replacement therapy
13/4,687 (0.3)
14/2,333 (0.6)
0.45 (0.21; 0.97)
0.041
Death due to renal disease‡ 3/4,687 (0.1)
0/2,333 (0)
– –
*Composite of new onset of macroalbuminuria, doubling of serum creatinine, initiation of renal replacement therapy, or death due to renal disease.
†Accompanied by eGFR (MDRD) ≤45 ml/min/1.73m2. ‡Hazard ratio and 95% CI were not analysed as the total number of events was <14.
CI, confidence interval; eGFR, estimated glomerular filtration rate; MDRD, Modification of Diet in Renal Disease.
Wanner C et al; Diabetes. 2016; 65(Suppl 1): Abstract and poster 1086-P.
Empagliflozin is not licensed for treatment of renal impairment or nephroprotection.

• Empagliflozin used in addition to standard care reduced the risk of a composite microvascular outcome in patients with T2D and high CV risk
– Standard care included approximately 80% of patients on ACE inhibitors/ARBs, 77% on statins and 83% on acetylsalicylic acid at baseline
• Risk reduction was primarily driven by a reduction in incident or worsening nephropathy with empagliflozin compared to placebo
• Eye-related outcomes were rare in both groups
EMPA-REG OUTCOME®: microvascular outcomes
ACE, angiotensin-converting enzyme; ARB, angiotensin receptor blockers; CV, cardiovascular; T2D, type 2 diabetes.
Wanner C et al; Diabetes. 2016; 65(Suppl. 1): Abstract and poster 1086-P.
Empagliflozin is not licensed for treatment of renal impairment or nephroprotection.
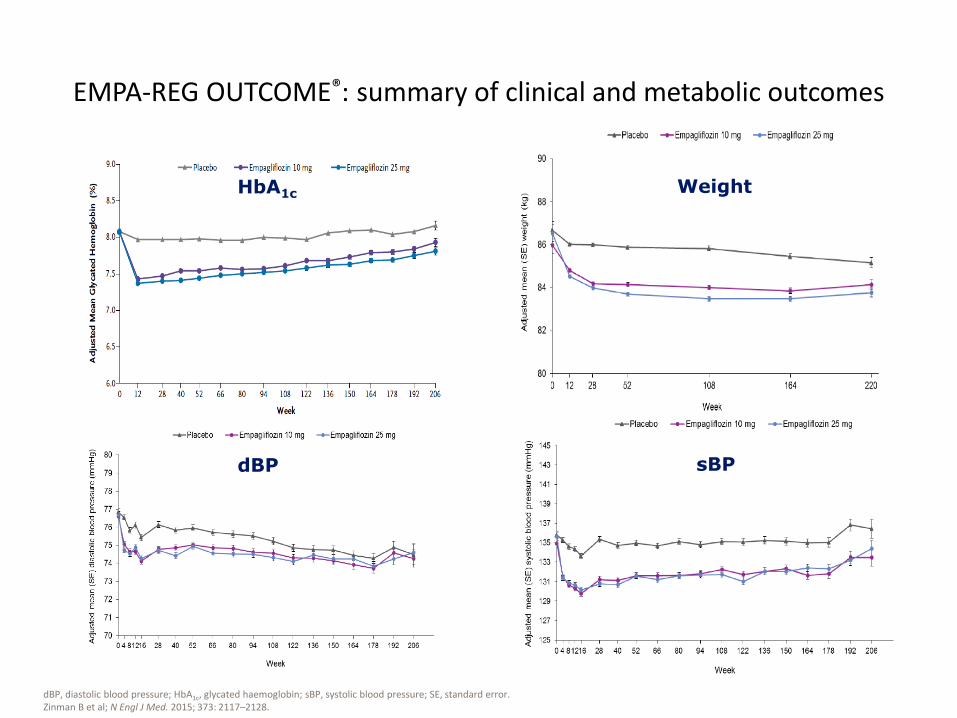
EMPA-REG OUTCOME®: summary of clinical and metabolic outcomes
HbA1c Weight
sBP dBP
dBP, diastolic blood pressure; HbA1c, glycated haemoglobin; sBP, systolic blood pressure; SE, standard error. Zinman B et al; N Engl J Med. 2015; 373: 2117–2128.

• EMPA-REG OUTCOME® demonstrated superiority for MACE (CV-death, non-fatal MI and non-fatal stroke) with empagliflozin treatment vs. placebo
– The incidence of the composite MACE endpoint was 37.4 events/1,000 patients-years with empagliflozin compared with 43.9 events/1,000 patient-years with placebo
– HR corresponding to an estimated risk reduction for MACE of 14% was observed
• 10.5% of patients in the empagliflozin group vs. 12.1% of patients in the placebo group: HR=0.86 (95% CI: 0.74; 0.99); p=0.04 for superiority
– CV death and non-fatal MI components of MACE contributed to the risk reduction
• Empagliflozin used in addition to standard of care reduced the risk of a composite microvascular outcome in patients with T2D and high CV risk
– Risk reduction was primarily driven by a reduction in incident or worsening nephropathy with empagliflozin compared to placebo
EMPA-REG OUTCOME®: summary
CI, confidence interval; CV, cardiovascular; HR, hazard ratio; MACE, major cardiovascular adverse events; MI, myocardial infarction; T2D, type 2 diabetes.
Zinman B et al; N Engl J Med. 2015; 373: 2117–2128.
Empagliflozin is not licensed for treatment of renal impairment or nephroprotection.
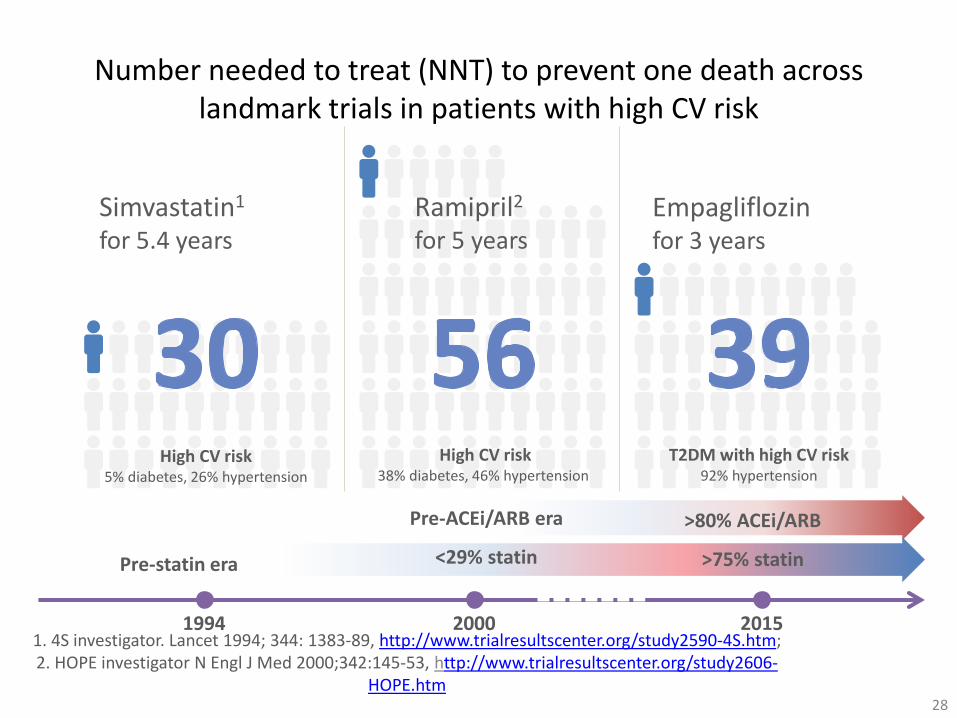
Number needed to treat (NNT) to prevent one death across landmark trials in patients with high CV risk
28
1. 4S investigator. Lancet 1994; 344: 1383-89, http://www.trialresultscenter.org/study2590-4S.htm; 2. HOPE investigator N Engl J Med 2000;342:145-53, http://www.trialresultscenter.org/study2606-
HOPE.htm
Simvastatin1
for 5.4 years
High CV risk 5% diabetes, 26% hypertension
1994 2000 2015
Pre-statin era
High CV risk 38% diabetes, 46% hypertension
Ramipril2
for 5 years
Pre-ACEi/ARB era
<29% statin
Empagliflozin for 3 years
T2DM with high CV risk 92% hypertension
>80% ACEi/ARB
>75% statin
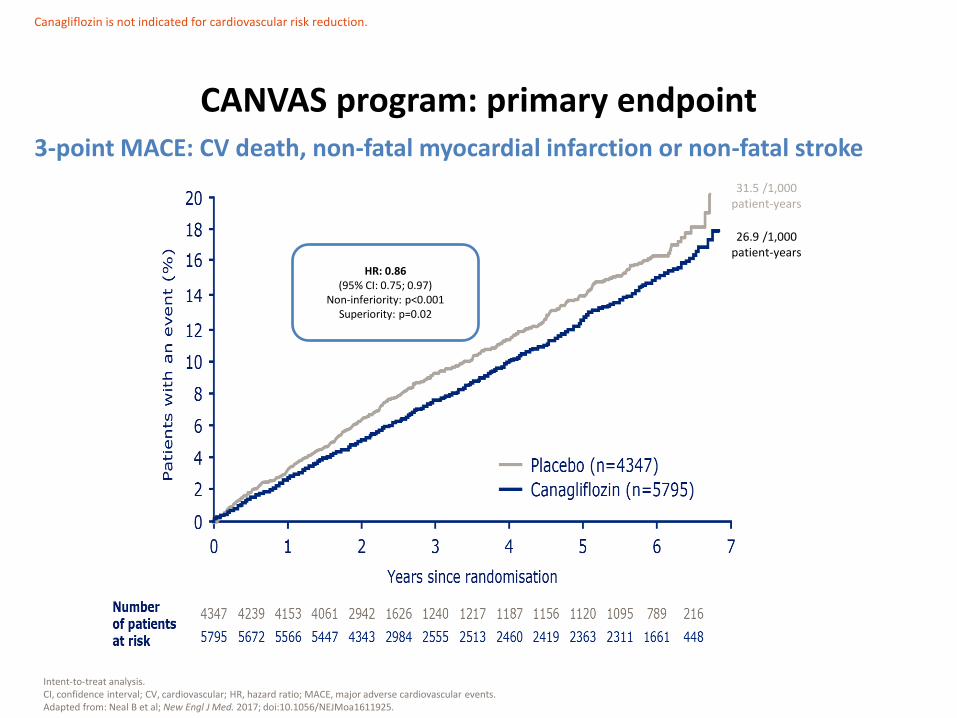
CANVAS program: primary endpoint
Intent-to-treat analysis. CI, confidence interval; CV, cardiovascular; HR, hazard ratio; MACE, major adverse cardiovascular events. Adapted from: Neal B et al; New Engl J Med. 2017; doi:10.1056/NEJMoa1611925.
HR: 0.86 (95% CI: 0.75; 0.97)
Non-inferiority: p<0.001 Superiority: p=0.02
31.5 /1,000 patient-years
26.9 /1,000 patient-years
Canagliflozin is not indicated for cardiovascular risk reduction.
3-point MACE: CV death, non-fatal myocardial infarction or non-fatal stroke
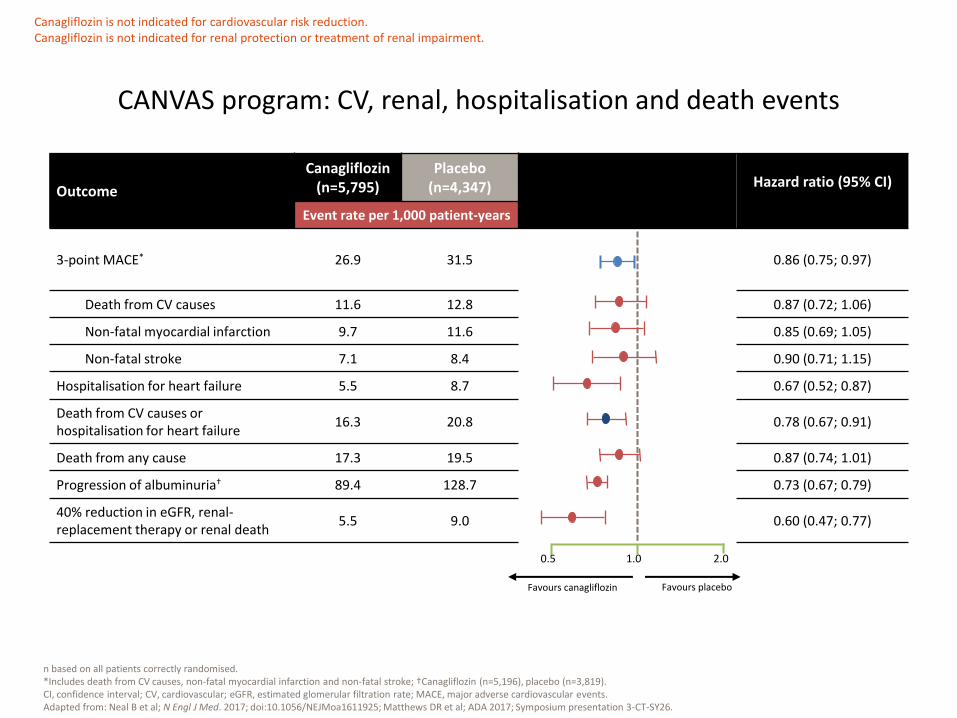
n based on all patients correctly randomised. *Includes death from CV causes, non-fatal myocardial infarction and non-fatal stroke; †Canagliflozin (n=5,196), placebo (n=3,819). CI, confidence interval; CV, cardiovascular; eGFR, estimated glomerular filtration rate; MACE, major adverse cardiovascular events. Adapted from: Neal B et al; N Engl J Med. 2017; doi:10.1056/NEJMoa1611925; Matthews DR et al; ADA 2017; Symposium presentation 3-CT-SY26.
Outcome
Canagliflozin (n=5,795)
Placebo (n=4,347) Hazard ratio (95% CI)
Event rate per 1,000 patient-years
3-point MACE* 26.9 31.5 0.86 (0.75; 0.97)
Death from CV causes 11.6 12.8 0.87 (0.72; 1.06)
Non-fatal myocardial infarction 9.7 11.6 0.85 (0.69; 1.05)
Non-fatal stroke 7.1 8.4 0.90 (0.71; 1.15)
Hospitalisation for heart failure 5.5 8.7 0.67 (0.52; 0.87)
Death from CV causes or hospitalisation for heart failure
16.3 20.8 0.78 (0.67; 0.91)
Death from any cause 17.3 19.5 0.87 (0.74; 1.01)
Progression of albuminuria† 89.4 128.7 0.73 (0.67; 0.79)
40% reduction in eGFR, renal-replacement therapy or renal death
5.5 9.0 0.60 (0.47; 0.77)
Favours placebo
CANVAS program: CV, renal, hospitalisation and death events
1.0
Favours canagliflozin
2.0 0.5
Canagliflozin is not indicated for cardiovascular risk reduction. Canagliflozin is not indicated for renal protection or treatment of renal impairment.
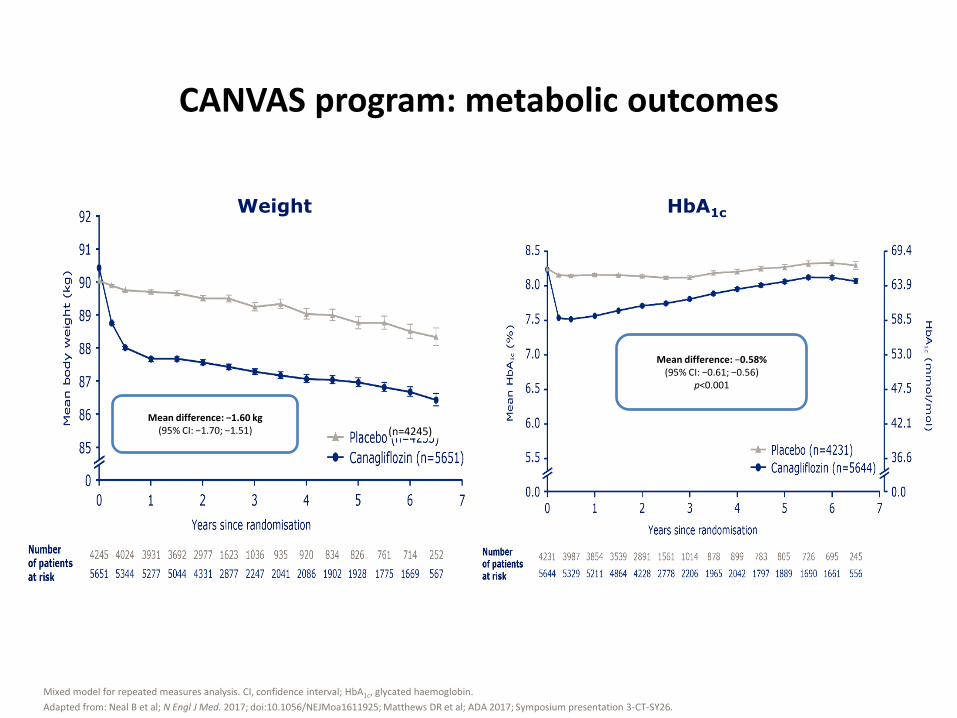
CANVAS program: metabolic outcomes
Mixed model for repeated measures analysis. CI, confidence interval; HbA1c, glycated haemoglobin.
Adapted from: Neal B et al; N Engl J Med. 2017; doi:10.1056/NEJMoa1611925; Matthews DR et al; ADA 2017; Symposium presentation 3-CT-SY26.
(n=4245) Mean difference: −1.60 kg
(95% CI: −1.70; −1.51)
Weight HbA1c
Mean difference: −0.58% (95% CI: −0.61; −0.56)
p<0.001
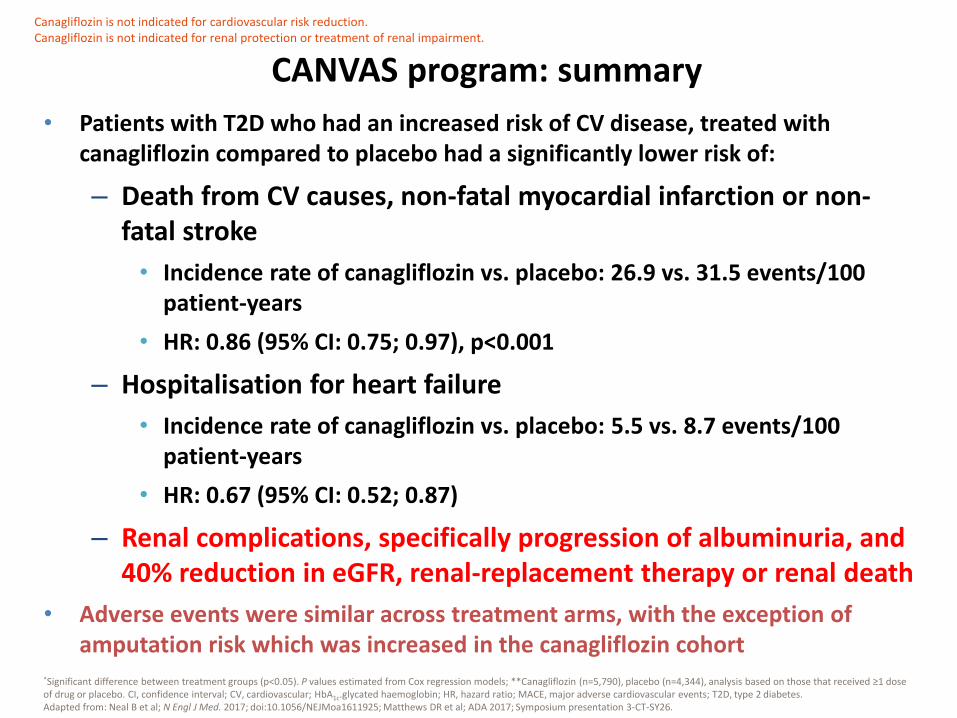
• Patients with T2D who had an increased risk of CV disease, treated with canagliflozin compared to placebo had a significantly lower risk of:
– Death from CV causes, non-fatal myocardial infarction or non-fatal stroke
• Incidence rate of canagliflozin vs. placebo: 26.9 vs. 31.5 events/100 patient-years
• HR: 0.86 (95% CI: 0.75; 0.97), p<0.001
– Hospitalisation for heart failure
• Incidence rate of canagliflozin vs. placebo: 5.5 vs. 8.7 events/100 patient-years
• HR: 0.67 (95% CI: 0.52; 0.87)
– Renal complications, specifically progression of albuminuria, and 40% reduction in eGFR, renal-replacement therapy or renal death
• Adverse events were similar across treatment arms, with the exception of amputation risk which was increased in the canagliflozin cohort
CANVAS program: summary
*Significant difference between treatment groups (p<0.05). P values estimated from Cox regression models; **Canagliflozin (n=5,790), placebo (n=4,344), analysis based on those that received ≥1 dose of drug or placebo. CI, confidence interval; CV, cardiovascular; HbA1c.glycated haemoglobin; HR, hazard ratio; MACE, major adverse cardiovascular events; T2D, type 2 diabetes. Adapted from: Neal B et al; N Engl J Med. 2017; doi:10.1056/NEJMoa1611925; Matthews DR et al; ADA 2017; Symposium presentation 3-CT-SY26.
Canagliflozin is not indicated for cardiovascular risk reduction. Canagliflozin is not indicated for renal protection or treatment of renal impairment.
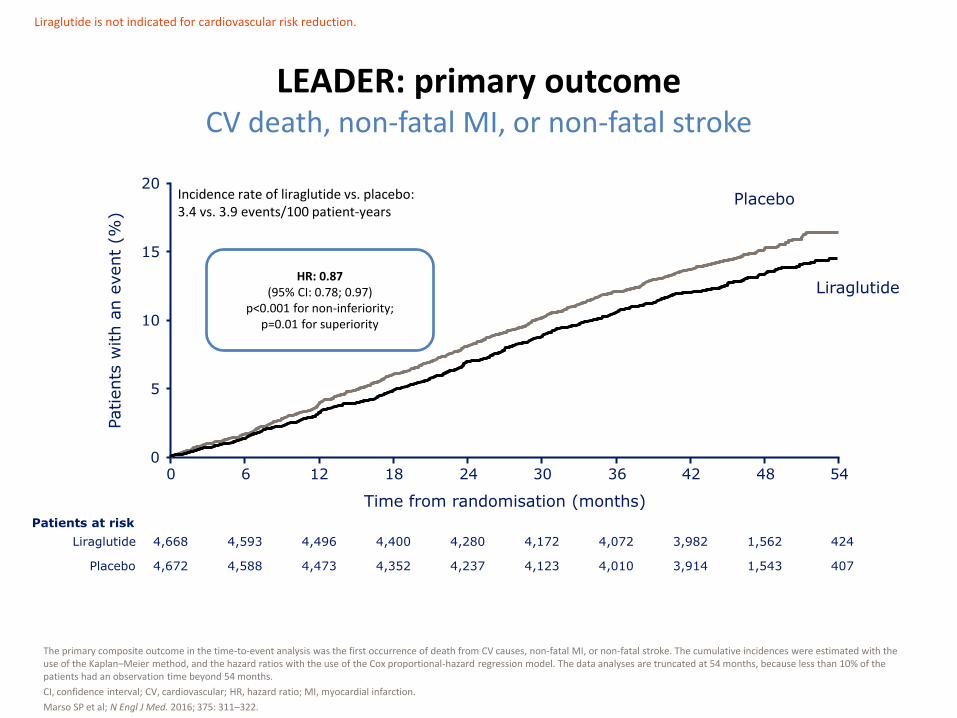
LEADER: primary outcome CV death, non-fatal MI, or non-fatal stroke
The primary composite outcome in the time-to-event analysis was the first occurrence of death from CV causes, non-fatal MI, or non-fatal stroke. The cumulative incidences were estimated with the use of the Kaplan–Meier method, and the hazard ratios with the use of the Cox proportional-hazard regression model. The data analyses are truncated at 54 months, because less than 10% of the patients had an observation time beyond 54 months.
CI, confidence interval; CV, cardiovascular; HR, hazard ratio; MI, myocardial infarction.
Marso SP et al; N Engl J Med. 2016; 375: 311–322.
0 6 18 24 30 36 42 48 54 0
5
10
15
20
12
Incidence rate of liraglutide vs. placebo: 3.4 vs. 3.9 events/100 patient-years
Time from randomisation (months)
Liraglutide
Placebo
4,668
4,672
4,593
4,588
4,496
4,473
4,400
4,352
4,280
4,237
4,172
4,123
4,072
4,010
3,982
3,914
1,562
1,543
424
407
Patients at risk
Liraglutide
Placebo
Patients
with a
n e
vent
(%)
Liraglutide is not indicated for cardiovascular risk reduction.
HR: 0.87 (95% CI: 0.78; 0.97)
p<0.001 for non-inferiority; p=0.01 for superiority

Hazard ratio (95% CI) p value
Liraglutide Placebo
n % R n % R
Number of patients 4,668 100.0 4,672 100.0
CV death 0.78 (0.66; 0.93) 0.007 219 4.7 1.2 278 6.0 1.6
Non-fatal MI 0.88 (0.75; 1.03) 0.11 281 6.0 1.6 317 6.8 1.8
Non-fatal stroke 0.89 (0.72; 1.11) 0.30 159 3.4 0.9 177 3.8 1.0
LEADER: individual components of the primary endpoint
Hazard ratios and p values were estimated with the use of a Cox proportional-hazards model with treatment as a covariate.
%, percentage of group; CI, confidence interval; CV, cardiovascular; MI, myocardial infarction; n, number of patients; R, incidence rate per 100 patient-years of observation.
Marso SP et al; N Engl J Med. 2016; 375: 311–322.
Hazard ratio (95% CI)
Favours placebo Favours liraglutide
10 .5 1 .5
Liraglutide is not indicated for cardiovascular risk reduction.
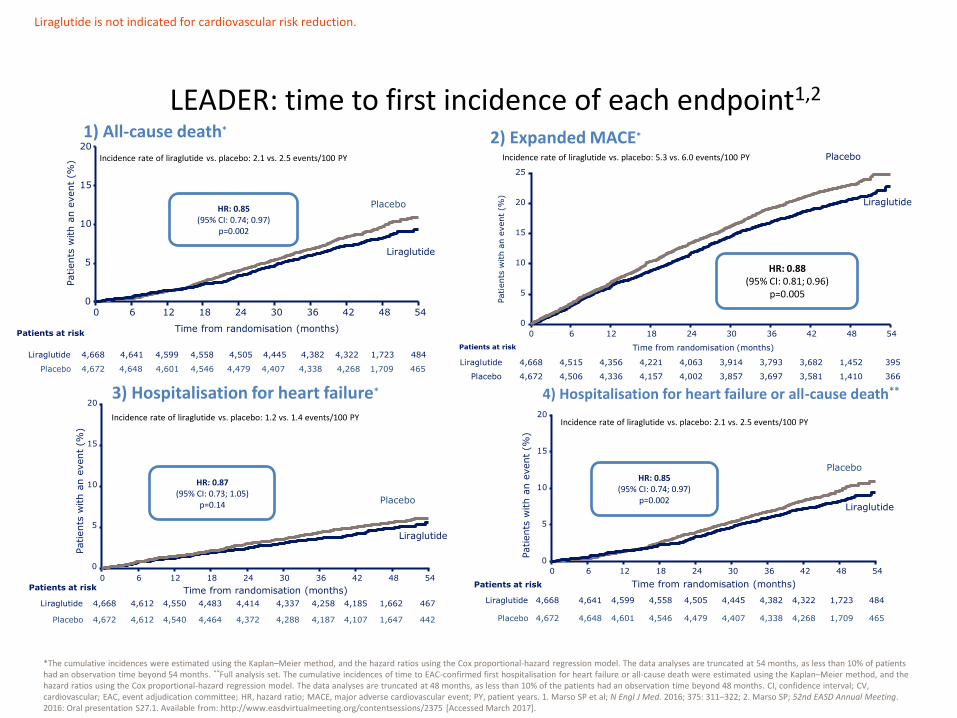
*The cumulative incidences were estimated using the Kaplan–Meier method, and the hazard ratios using the Cox proportional-hazard regression model. The data analyses are truncated at 54 months, as less than 10% of patients had an observation time beyond 54 months. **Full analysis set. The cumulative incidences of time to EAC-confirmed first hospitalisation for heart failure or all-cause death were estimated using the Kaplan–Meier method, and the hazard ratios using the Cox proportional-hazard regression model. The data analyses are truncated at 48 months, as less than 10% of the patients had an observation time beyond 48 months. CI, confidence interval; CV, cardiovascular; EAC, event adjudication committee; HR, hazard ratio; MACE, major adverse cardiovascular event; PY, patient years. 1. Marso SP et al; N Engl J Med. 2016; 375: 311–322; 2. Marso SP; 52nd EASD Annual Meeting. 2016: Oral presentation S27.1. Available from: http://www.easdvirtualmeeting.org/contentsessions/2375 [Accessed March 2017].
LEADER: time to first incidence of each endpoint1,2
4,668
4,672
4,641
4,648
4,599
4,601
4,558
4,546
4,505
4,479
4,445
4,407
4,382
4,338
4,322
4,268
1,723
1,709
484
465
Patients at risk
Liraglutide
Placebo
0
5
10
15
20
0 6 18 24 30 36 42 48 54 12
Time from randomisation (months)
Patients
with a
n e
vent
(%)
Liraglutide is not indicated for cardiovascular risk reduction.
Incidence rate of liraglutide vs. placebo: 2.1 vs. 2.5 events/100 PY
HR: 0.85 (95% CI: 0.74; 0.97)
p=0.002
Liraglutide
Placebo
1) All-cause death*
4,668
4,672
4,612
4,612
4,550
4,540
4,483
4,464
4,414
4,372
4,337
4,288
4,258
4,187
4,185
4,107
1,662
1,647
467
442
0
5
10
15
20
0 6 18 24 30 36 42 48 54 12
Time from randomisation (months) Patients at risk
Liraglutide
Placebo
Incidence rate of liraglutide vs. placebo: 1.2 vs. 1.4 events/100 PY
Liraglutide
Placebo
Patients
with a
n e
vent
(%)
3) Hospitalisation for heart failure* 4) Hospitalisation for heart failure or all-cause death**
0
5
10
15
20
0 6 18 24 30 36 42 48 54 12
Time from randomisation (months)
Patients
with a
n e
vent
(%)
Liraglutide
Placebo
Incidence rate of liraglutide vs. placebo: 2.1 vs. 2.5 events/100 PY
Patients at risk
Liraglutide
Placebo
4,668
4,672
4,641
4,648
4,599
4,601
4,558
4,546
4,505
4,479
4,445
4,407
4,382
4,338
4,322
4,268
1,723
1,709
484
465
HR: 0.87 (95% CI: 0.73; 1.05)
p=0.14
HR: 0.85 (95% CI: 0.74; 0.97)
p=0.002
0
5
10
15
20
25
0 6 18 24 30 36 42 48 54 12
4,668
4,672
4,515
4,506
4,356
4,336
4,221
4,157
4,063
4,002
3,914
3,857
3,793
3,697
3,682
3,581
1,452
1,410
395
366
Patients at risk
Liraglutide
Placebo
Time from randomisation (months)
Patients
with a
n e
vent
(%)
HR: 0.88 (95% CI: 0.81; 0.96)
p=0.005
Liraglutide
Placebo
2) Expanded MACE* Incidence rate of liraglutide vs. placebo: 5.3 vs. 6.0 events/100 PY
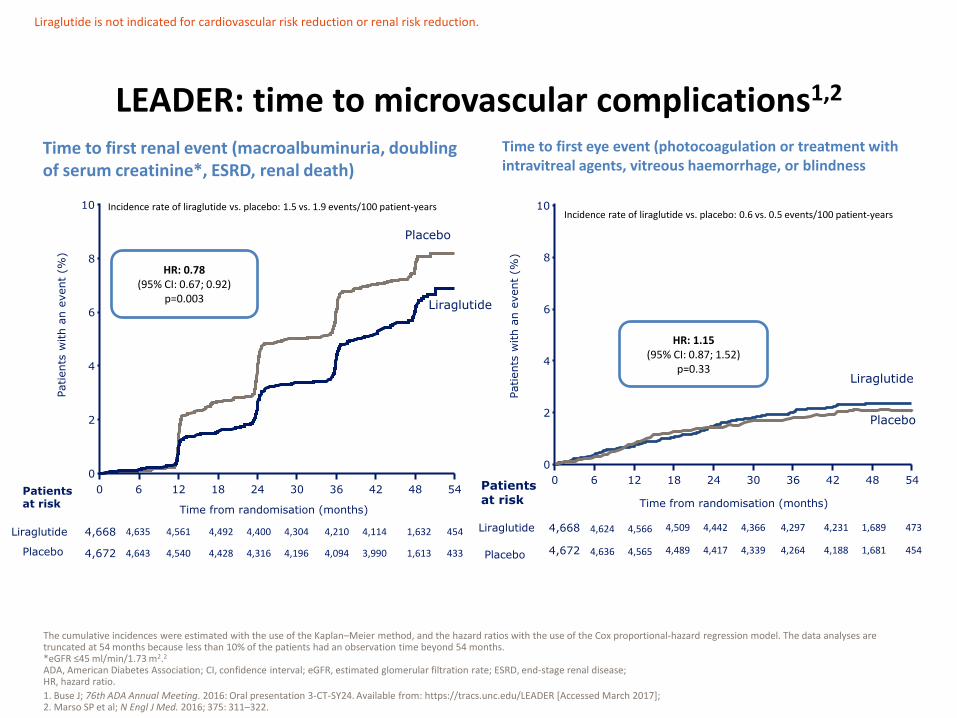
LEADER: time to microvascular complications1,2
The cumulative incidences were estimated with the use of the Kaplan–Meier method, and the hazard ratios with the use of the Cox proportional-hazard regression model. The data analyses are truncated at 54 months because less than 10% of the patients had an observation time beyond 54 months. *eGFR ≤45 ml/min/1.73 m2.2
ADA, American Diabetes Association; CI, confidence interval; eGFR, estimated glomerular filtration rate; ESRD, end-stage renal disease; HR, hazard ratio.
1. Buse J; 76th ADA Annual Meeting. 2016: Oral presentation 3-CT-SY24. Available from: https://tracs.unc.edu/LEADER [Accessed March 2017]; 2. Marso SP et al; N Engl J Med. 2016; 375: 311–322.
Liraglutide is not indicated for cardiovascular risk reduction or renal risk reduction.
4,668
4,672
4,635
4,643
4,561
4,540
4,492
4,428
4,400
4,316
4,304
4,196
4,210
4,094
4,114
3,990
1,632
1,613
454
433
0 6 12 18 24 30 36 42 48 54
0
2
4
6
8
10
Time from randomisation (months)
Patients at risk
Liraglutide
Incidence rate of liraglutide vs. placebo: 1.5 vs. 1.9 events/100 patient-years
Placebo
Patients
with a
n e
vent
(%)
Liraglutide
Placebo
HR: 0.78 (95% CI: 0.67; 0.92)
p=0.003
Time to first renal event (macroalbuminuria, doubling of serum creatinine*, ESRD, renal death)
4,668
4,672
4,624
4,636
4,566
4,565
4,509
4,489
4,442
4,417
4,366
4,339
4,297
4,264
4,231
4,188
1,689
1,681
473
454
0 6 12 18 24 30 36 42 48 54
0
2
4
6
8
10
Time from randomisation (months)
Patients at risk
Liraglutide
Placebo
Liraglutide
Placebo
Incidence rate of liraglutide vs. placebo: 0.6 vs. 0.5 events/100 patient-years
HR: 1.15 (95% CI: 0.87; 1.52)
p=0.33
Patients
with a
n e
vent
(%)
Time to first eye event (photocoagulation or treatment with intravitreal agents, vitreous haemorrhage, or blindness

LEADER: summary of clinical and metabolic outcomes1,2
Data are estimated mean values from randomisation. ADA, American Diabetes Association; bpm, beats per minute; CI, confidence interval; CV, cardiovascular; dBP, diastolic blood pressure; EOT, end of treatment; ETD, estimated treatment difference; HbA1c, glycated haemoglobin; sBP, systolic blood pressure. 1. Marso SP et al; N Engl J Med. 2016; 375: 311–322; 2. Buse J; 76th ADA Annual Meeting. 2016: Oral presentation 3-CT-SY24. Available from: https://tracs.unc.edu/LEADER [Accessed March 2017].
HbA1c Weight
Heart rate Blood pressure
Liraglutide is not indicated for cardiovascular risk reduction; and doses of up to 1.8 mg are not indicated for weight management.
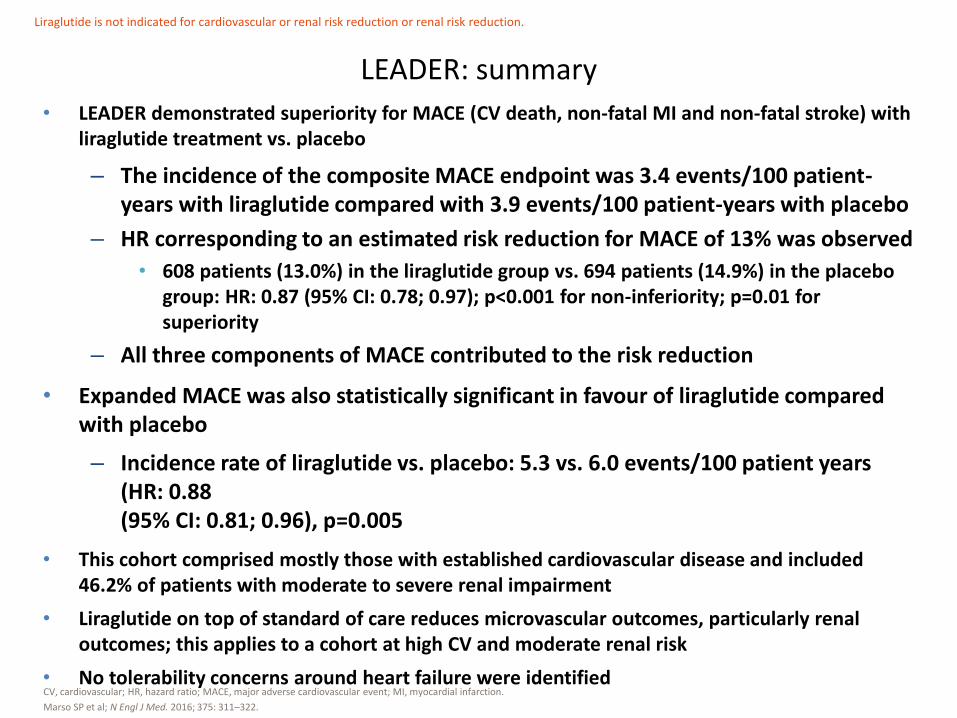
• LEADER demonstrated superiority for MACE (CV death, non-fatal MI and non-fatal stroke) with liraglutide treatment vs. placebo
– The incidence of the composite MACE endpoint was 3.4 events/100 patient-years with liraglutide compared with 3.9 events/100 patient-years with placebo
– HR corresponding to an estimated risk reduction for MACE of 13% was observed
• 608 patients (13.0%) in the liraglutide group vs. 694 patients (14.9%) in the placebo group: HR: 0.87 (95% CI: 0.78; 0.97); p<0.001 for non-inferiority; p=0.01 for superiority
– All three components of MACE contributed to the risk reduction
• Expanded MACE was also statistically significant in favour of liraglutide compared with placebo
– Incidence rate of liraglutide vs. placebo: 5.3 vs. 6.0 events/100 patient years (HR: 0.88 (95% CI: 0.81; 0.96), p=0.005
• This cohort comprised mostly those with established cardiovascular disease and included 46.2% of patients with moderate to severe renal impairment
• Liraglutide on top of standard of care reduces microvascular outcomes, particularly renal outcomes; this applies to a cohort at high CV and moderate renal risk
• No tolerability concerns around heart failure were identified
LEADER: summary
CV, cardiovascular; HR, hazard ratio; MACE, major adverse cardiovascular event; MI, myocardial infarction.
Marso SP et al; N Engl J Med. 2016; 375: 311–322.
Liraglutide is not indicated for cardiovascular or renal risk reduction or renal risk reduction.

0
5
10
15
0 8 16 24 32 40 48 56 64 72 80 88 96 104
Sub
ject
s w
ith
an
eve
nt
(%)
Time since randomisation (weeks)
SUSTAIN-6: primary outcome Time to first occurrence of CV death, non-fatal MI, or non-fatal stroke
Kaplan-Meier plot for first event adjudication committee-confirmed CV death, non-fatal MI and non-fatal stroke using ‘in-trial’ data from subjects in the full analysis set. *Not prespecified. CI, confidence interval; CV, cardiovascular; HR, hazard ratio; MI, myocardial infarction.
Marso SP et al; N Engl J Med. 2016; 375: 1834–1844.
Patients at risk
Semaglutide 1,648 1,619 1,601 1,584 1,568 1,543 1,524
Placebo 1,649 1,616 1,586 1,567 1,534 1,508 1,479
Incidence rate of semaglutide vs. placebo: 3.24 vs. 4.44 events/100 patient-years
Semaglutide, 6.6%
Placebo, 8.9%
109
HR: 0.74 (95% CI: 0.58; 0.95)
p<0.001 for non-inferiority p=0.02 for superiority*
Marketing authorisation for semaglutide has been submitted and approval is currently awaited.
0
1
2
3
4
5
0 8 16 24 32 40 48 56 64 72 80 88 96 104
Pa
tie
nts
wit
h a
n e
ven
t (%
)
Time since randomisation (weeks)
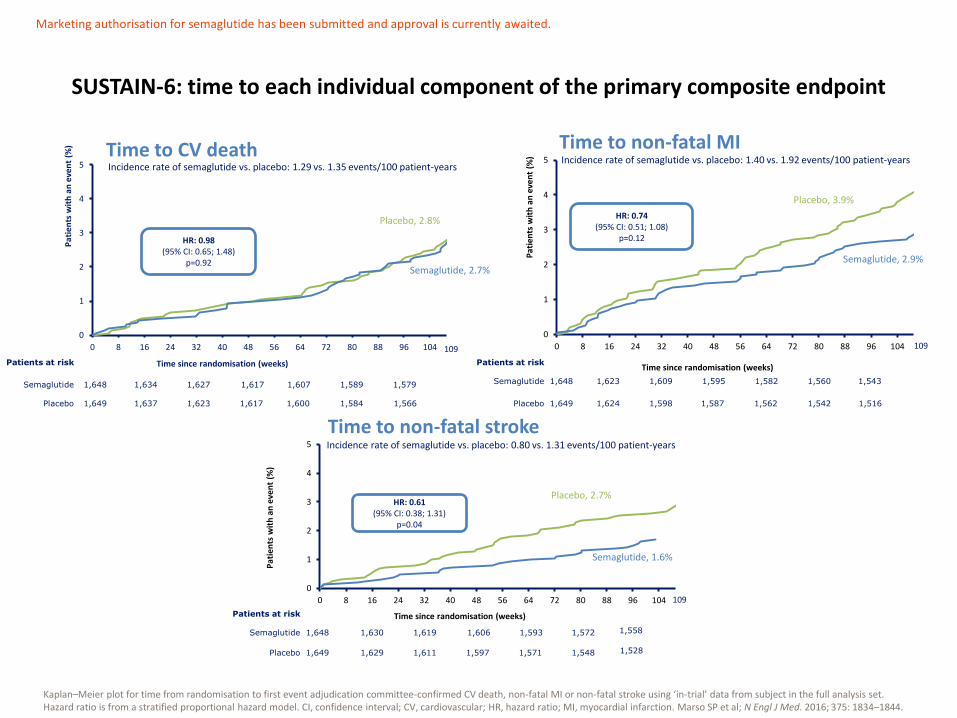
SUSTAIN-6: time to each individual component of the primary composite endpoint
Kaplan–Meier plot for time from randomisation to first event adjudication committee-confirmed CV death, non-fatal MI or non-fatal stroke using ‘in-trial’ data from subject in the full analysis set. Hazard ratio is from a stratified proportional hazard model. CI, confidence interval; CV, cardiovascular; HR, hazard ratio; MI, myocardial infarction. Marso SP et al; N Engl J Med. 2016; 375: 1834–1844.
Incidence rate of semaglutide vs. placebo: 1.29 vs. 1.35 events/100 patient-years
Semaglutide, 2.7%
Placebo, 2.8%
109
1,648 1,634 1,627 1,617 1,607
1,649 1,637 1,623 1,617 1,600
1,589
1,584
1,579
1,566
Patients at risk
Semaglutide
Placebo
HR: 0.98 (95% CI: 0.65; 1.48)
p=0.92
Time to CV death
0
1
2
3
4
5
0 8 16 24 32 40 48 56 64 72 80 88 96 104
Pa
tie
nts
wit
h a
n e
ven
t (%
)
Time since randomisation (weeks)
Semaglutide, 2.9%
Placebo, 3.9%
109
Time to non-fatal MI Incidence rate of semaglutide vs. placebo: 1.40 vs. 1.92 events/100 patient-years
1,648 1,623 1,609 1,595 1,582
1,649 1,624 1,598 1,587 1,562
1,560
1,542
1,543
1,516
Patients at risk
Semaglutide
Placebo
0
1
2
3
4
5
0 8 16 24 32 40 48 56 64 72 80 88 96 104
Pa
tien
ts w
ith
an
eve
nt
(%)
Time since randomisation (weeks)
109
Time to non-fatal stroke
109
Incidence rate of semaglutide vs. placebo: 0.80 vs. 1.31 events/100 patient-years
Semaglutide, 1.6%
Placebo, 2.7%
1,648 1,630 1,619 1,606 1,593
1,649 1,629 1,611 1,597 1,571
1,572
1,548
1,558
1,528
Patients at risk
Semaglutide
Placebo
HR: 0.74 (95% CI: 0.51; 1.08)
p=0.12
HR: 0.61 (95% CI: 0.38; 1.31)
p=0.04
Marketing authorisation for semaglutide has been submitted and approval is currently awaited.
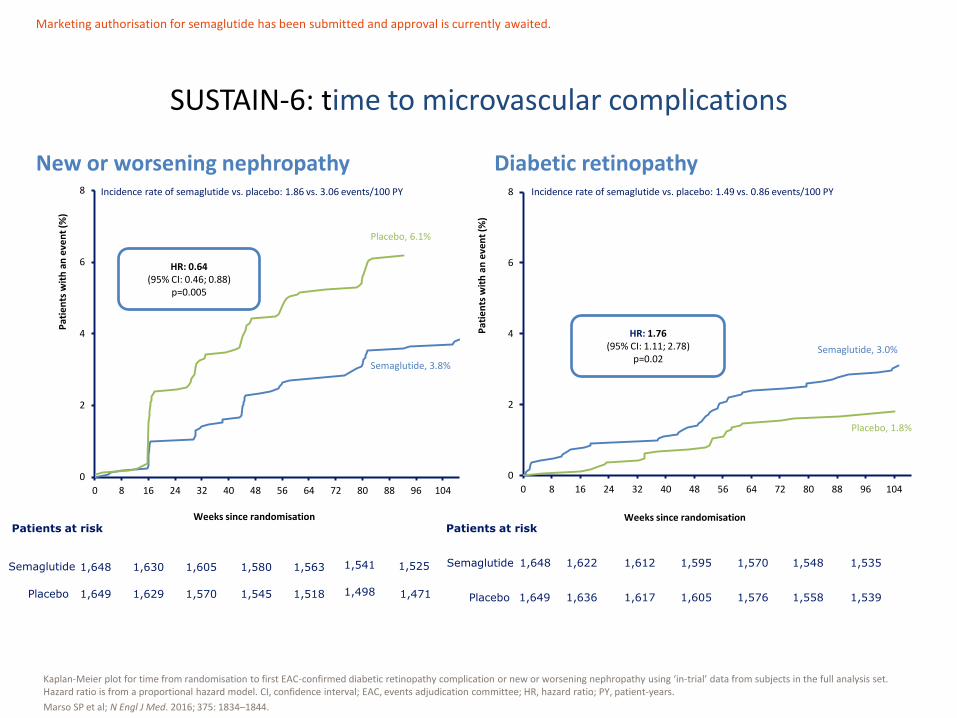
SUSTAIN-6: time to microvascular complications
Kaplan-Meier plot for time from randomisation to first EAC-confirmed diabetic retinopathy complication or new or worsening nephropathy using ‘in-trial’ data from subjects in the full analysis set. Hazard ratio is from a proportional hazard model. CI, confidence interval; EAC, events adjudication committee; HR, hazard ratio; PY, patient-years.
Marso SP et al; N Engl J Med. 2016; 375: 1834–1844.
0
2
4
6
8
0 8 16 24 32 40 48 56 64 72 80 88 96 104P
atie
nts
wit
h a
n e
ven
t (%
)
Weeks since randomisation
0
2
4
6
8
0 8 16 24 32 40 48 56 64 72 80 88 96 104
Pat
ien
ts w
ith
an
eve
nt
(%)
Weeks since randomisation
Semaglutide, 3.8%
Placebo, 6.1%
1,525 1,648 1,630 1,605 1,580 1,563
1,649 1,629 1,570 1,545 1,518
1,541
1,498 1,471
Incidence rate of semaglutide vs. placebo: 1.86 vs. 3.06 events/100 PY
Patients at risk
Semaglutide
Placebo
HR: 0.64 (95% CI: 0.46; 0.88)
p=0.005
New or worsening nephropathy Diabetic retinopathy Incidence rate of semaglutide vs. placebo: 1.49 vs. 0.86 events/100 PY
HR: 1.76 (95% CI: 1.11; 2.78)
p=0.02 Semaglutide, 3.0%
Placebo, 1.8%
1,648 1,622 1,612 1,595 1,570
1,649 1,636 1,617 1,605 1,576
1,548
1,558
1,535
1,539
Patients at risk
Semaglutide
Placebo
Marketing authorisation for semaglutide has been submitted and approval is currently awaited.
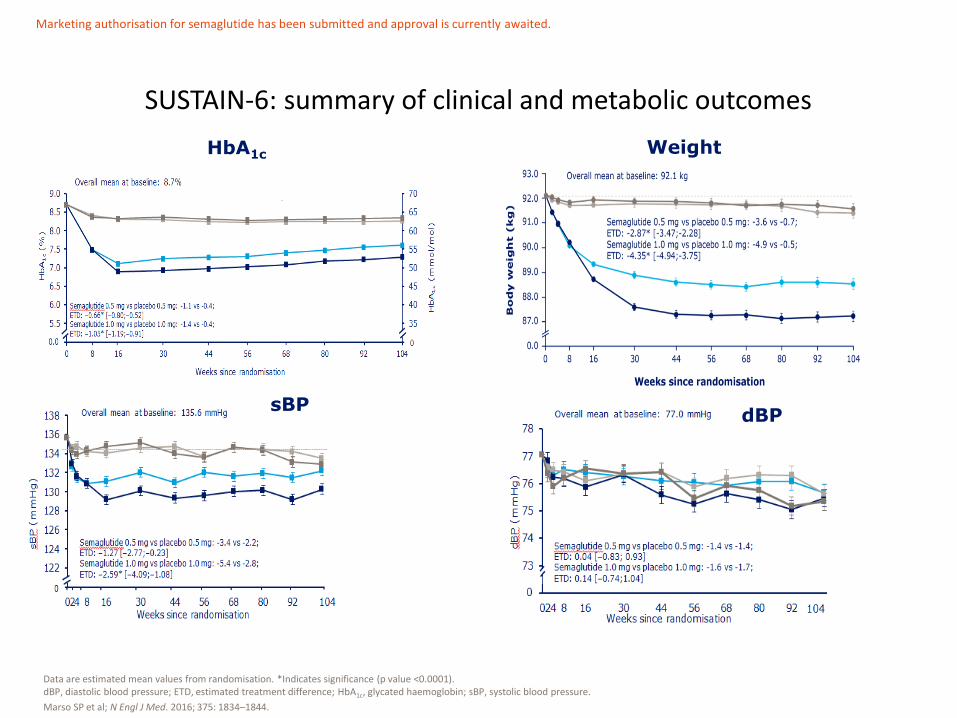
SUSTAIN-6: summary of clinical and metabolic outcomes
Data are estimated mean values from randomisation. *Indicates significance (p value <0.0001). dBP, diastolic blood pressure; ETD, estimated treatment difference; HbA1c, glycated haemoglobin; sBP, systolic blood pressure.
Marso SP et al; N Engl J Med. 2016; 375: 1834–1844.
HbA1c Weight
dBP
sBP
Marketing authorisation for semaglutide has been submitted and approval is currently awaited.
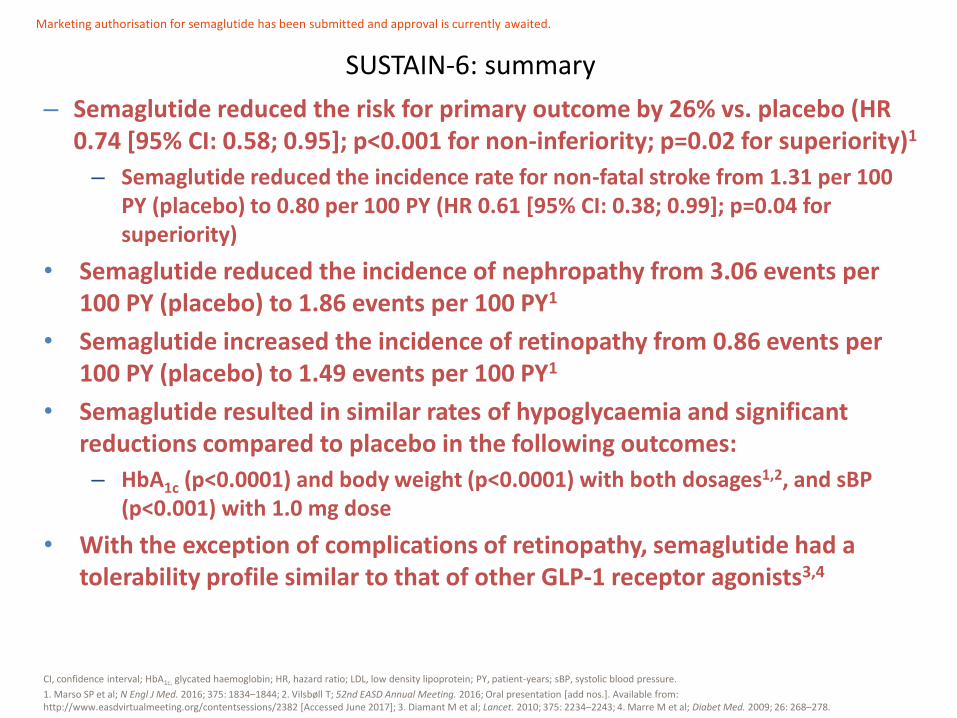
– Semaglutide reduced the risk for primary outcome by 26% vs. placebo (HR 0.74 [95% CI: 0.58; 0.95]; p<0.001 for non-inferiority; p=0.02 for superiority)1
– Semaglutide reduced the incidence rate for non-fatal stroke from 1.31 per 100 PY (placebo) to 0.80 per 100 PY (HR 0.61 [95% CI: 0.38; 0.99]; p=0.04 for superiority)
• Semaglutide reduced the incidence of nephropathy from 3.06 events per 100 PY (placebo) to 1.86 events per 100 PY1
• Semaglutide increased the incidence of retinopathy from 0.86 events per 100 PY (placebo) to 1.49 events per 100 PY1
• Semaglutide resulted in similar rates of hypoglycaemia and significant reductions compared to placebo in the following outcomes:
– HbA1c (p<0.0001) and body weight (p<0.0001) with both dosages1,2, and sBP (p<0.001) with 1.0 mg dose
• With the exception of complications of retinopathy, semaglutide had a tolerability profile similar to that of other GLP-1 receptor agonists3,4
SUSTAIN-6: summary
CI, confidence interval; HbA1c, glycated haemoglobin; HR, hazard ratio; LDL, low density lipoprotein; PY, patient-years; sBP, systolic blood pressure.
1. Marso SP et al; N Engl J Med. 2016; 375: 1834–1844; 2. Vilsbøll T; 52nd EASD Annual Meeting. 2016; Oral presentation [add nos.]. Available from: http://www.easdvirtualmeeting.org/contentsessions/2382 [Accessed June 2017]; 3. Diamant M et al; Lancet. 2010; 375: 2234–2243; 4. Marre M et al; Diabet Med. 2009; 26: 268–278.
Marketing authorisation for semaglutide has been submitted and approval is currently awaited.
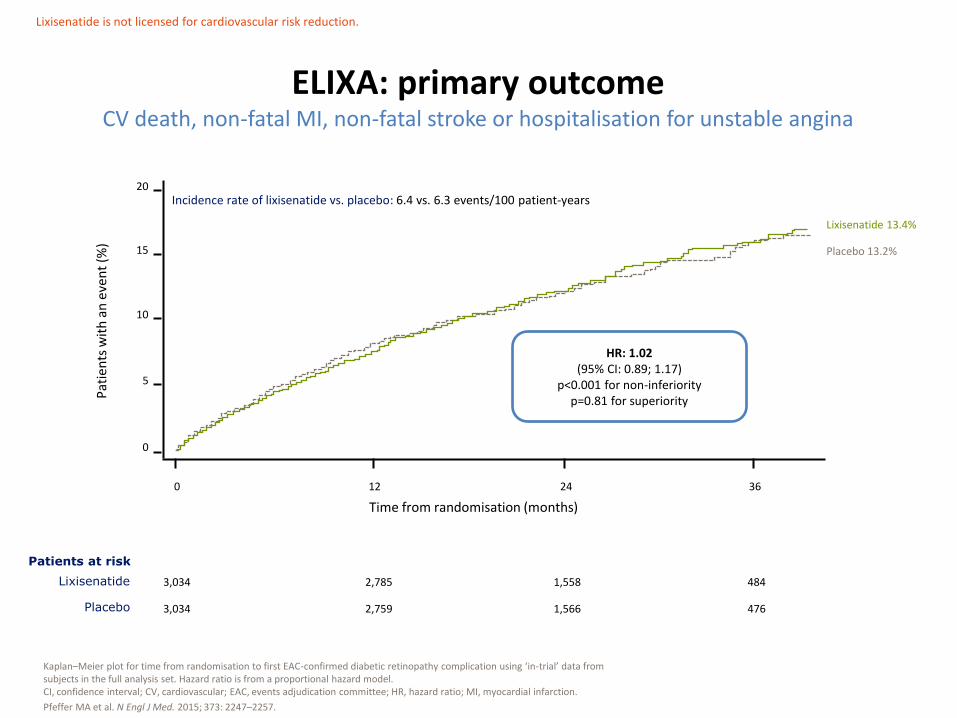
ELIXA: primary outcome CV death, non-fatal MI, non-fatal stroke or hospitalisation for unstable angina
Kaplan–Meier plot for time from randomisation to first EAC-confirmed diabetic retinopathy complication using ‘in-trial’ data from subjects in the full analysis set. Hazard ratio is from a proportional hazard model. CI, confidence interval; CV, cardiovascular; EAC, events adjudication committee; HR, hazard ratio; MI, myocardial infarction.
Pfeffer MA et al. N Engl J Med. 2015; 373: 2247–2257.
Pat
ien
ts w
ith
an
eve
nt
(%)
Time from randomisation (months)
3,034
3,034
2,785
2,759
1,558
1,566
484
476
0
0 12 24 36
5
10
15
20
Lixisenatide 13.4%
Placebo 13.2%
Lixisenatide is not licensed for cardiovascular risk reduction.
Incidence rate of lixisenatide vs. placebo: 6.4 vs. 6.3 events/100 patient-years
Patients at risk
Lixisenatide
Placebo
HR: 1.02 (95% CI: 0.89; 1.17)
p<0.001 for non-inferiority p=0.81 for superiority
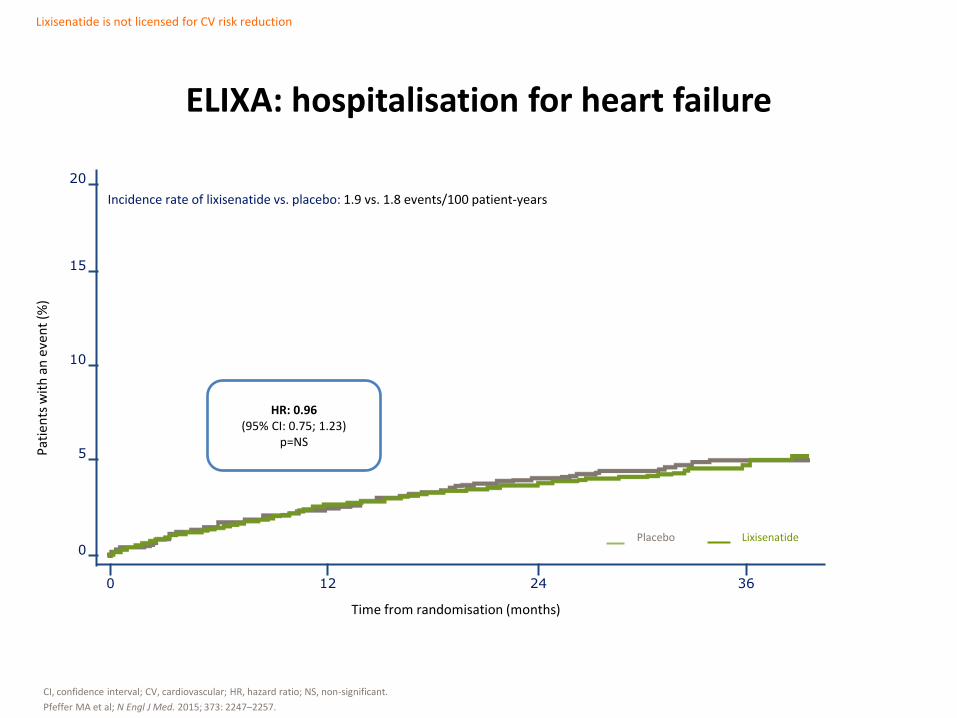
ELIXA: hospitalisation for heart failure
CI, confidence interval; CV, cardiovascular; HR, hazard ratio; NS, non-significant.
Pfeffer MA et al; N Engl J Med. 2015; 373: 2247–2257.
0
0 12 24 36
5
10
15
20
Lixisenatide is not licensed for CV risk reduction
Pat
ien
ts w
ith
an
eve
nt
(%)
Time from randomisation (months)
Incidence rate of lixisenatide vs. placebo: 1.9 vs. 1.8 events/100 patient-years
HR: 0.96 (95% CI: 0.75; 1.23)
p=NS
Lixisenatide Placebo
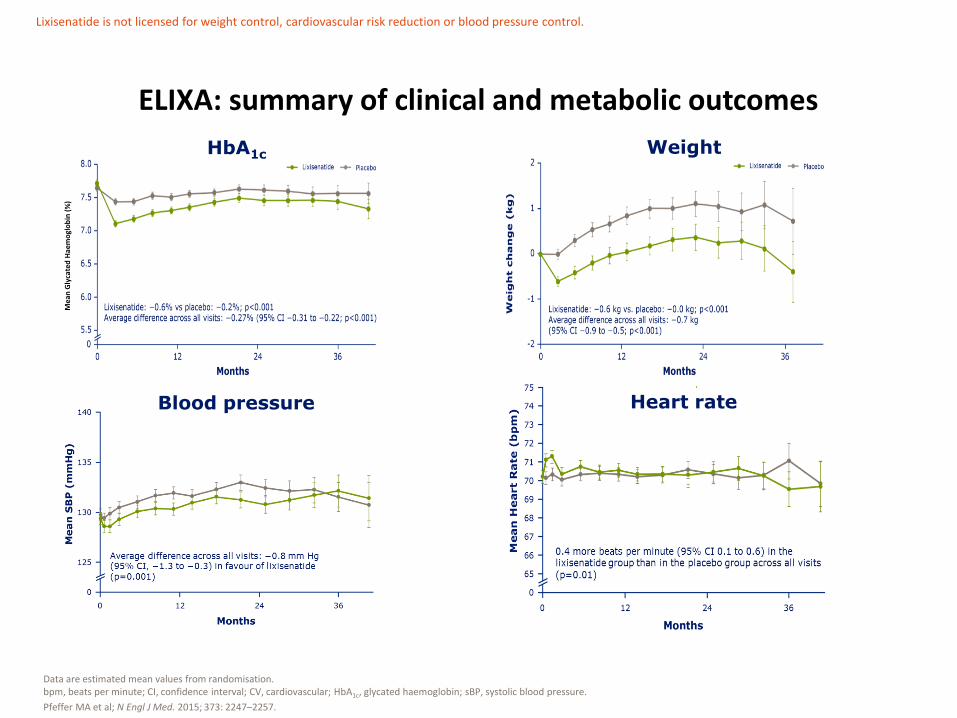
ELIXA: summary of clinical and metabolic outcomes
Data are estimated mean values from randomisation. bpm, beats per minute; CI, confidence interval; CV, cardiovascular; HbA1c, glycated haemoglobin; sBP, systolic blood pressure.
Pfeffer MA et al; N Engl J Med. 2015; 373: 2247–2257.
HbA1c Weight
Blood pressure Heart rate
Lixisenatide is not licensed for weight control, cardiovascular risk reduction or blood pressure control.
Mea
n G
lyca
ted
Hae
mo
glo
bin
(%
)
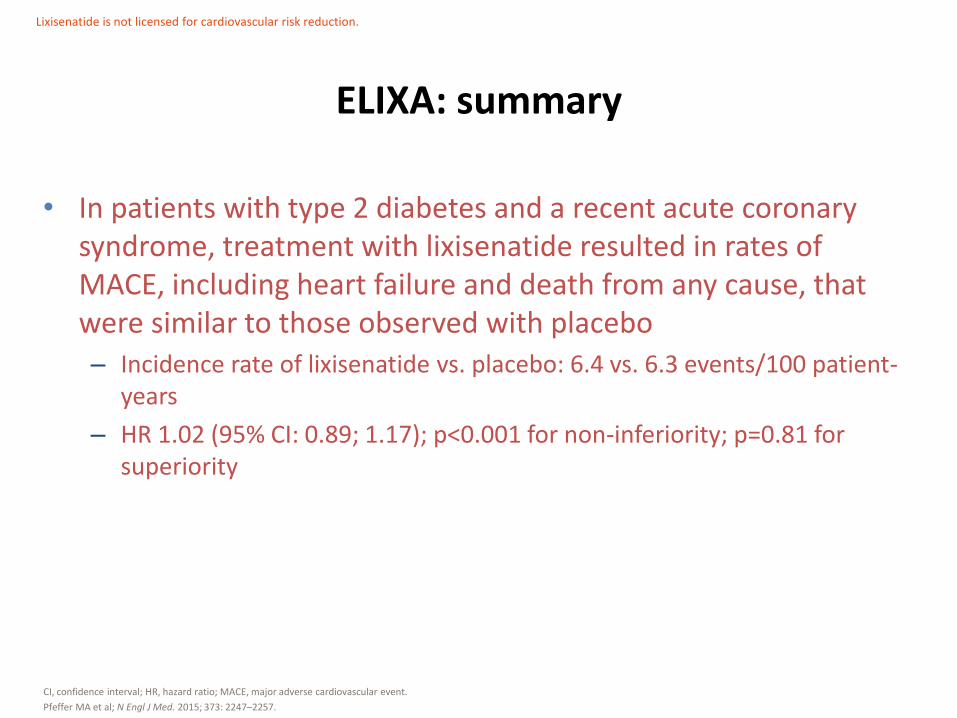
• In patients with type 2 diabetes and a recent acute coronary syndrome, treatment with lixisenatide resulted in rates of MACE, including heart failure and death from any cause, that were similar to those observed with placebo – Incidence rate of lixisenatide vs. placebo: 6.4 vs. 6.3 events/100 patient-
years
– HR 1.02 (95% CI: 0.89; 1.17); p<0.001 for non-inferiority; p=0.81 for superiority
ELIXA: summary
CI, confidence interval; HR, hazard ratio; MACE, major adverse cardiovascular event.
Pfeffer MA et al; N Engl J Med. 2015; 373: 2247–2257.
Lixisenatide is not licensed for cardiovascular risk reduction.
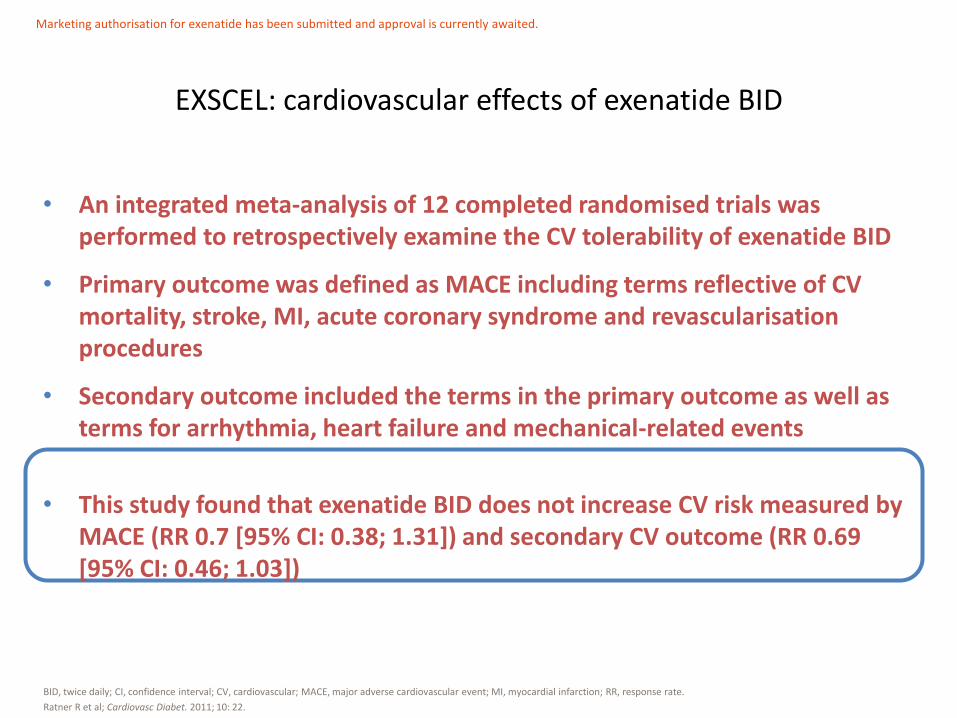
• An integrated meta-analysis of 12 completed randomised trials was performed to retrospectively examine the CV tolerability of exenatide BID
• Primary outcome was defined as MACE including terms reflective of CV mortality, stroke, MI, acute coronary syndrome and revascularisation procedures
• Secondary outcome included the terms in the primary outcome as well as terms for arrhythmia, heart failure and mechanical-related events
• This study found that exenatide BID does not increase CV risk measured by MACE (RR 0.7 [95% CI: 0.38; 1.31]) and secondary CV outcome (RR 0.69 [95% CI: 0.46; 1.03])
EXSCEL: cardiovascular effects of exenatide BID
BID, twice daily; CI, confidence interval; CV, cardiovascular; MACE, major adverse cardiovascular event; MI, myocardial infarction; RR, response rate.
Ratner R et al; Cardiovasc Diabet. 2011; 10: 22.
Marketing authorisation for exenatide has been submitted and approval is currently awaited.

LEADER1
• Liraglutide demonstrated superiority for MACE (CV-death, non-fatal MI and non-fatal stroke) vs. placebo
– Incidence rate of liraglutide vs. placebo: 3.4 vs. 3.9 events/100 patient-years
– HR (95% CI)=0.87 (0.78; 0.97); p<0.001 for non-inferiority and p=0.01 for superiority
SUSTAIN 62
• Semaglutide demonstrated superiority for MACE (CV-death, non-fatal MI and non-fatal stroke) vs. placebo
– Incidence rate of semaglutide vs. placebo: 3.24 vs. 4.44 events/100 patient-years
– HR (95% CI)=0.74 (0.58; 0.95); p<0.001 for non-inferiority and p=0.02 for superiority
ELIXA3
• Lixisenatide demonstrated non-inferiority for MACE (CV-death, non-fatal MI and non-fatal stroke or hospitalisation for unstable angina) vs. placebo
– Incidence rate of lixisenatide vs. placebo: 6.4 vs. 6.3 events/100 patient-years
– HR (95% CI)=1.02 (0.89; 1.17); p<0.001 for non-inferiority and p=0.81 for superiority
Overview of findings in CVOTs with GLP-1 RAs Time to primary endpoint
CI, confidence interval; CV, cardiovascular; CVOTs, cardiovascular outcome trials; GLP-1 RA, glucagon-like peptide-1 receptor agonist; HR, hazard ratio; MACE, major adverse cardiovascular event; MI, myocardial infarction. 1. Marso SP et al; N Engl J Med. 2016; 375: 311–322; 2. Marso SP et al; N Engl J Med. 2016; 375: 1834–1844; 3. Pfeffer MA et al. N Engl J Med 2015; 373: 2247–2257.
Liraglutide is not licensed for cardiovascular risk reduction. Semaglutide is not licensed for cardiovascular risk reduction. Lixisenatide is not licensed for cardiovascular risk reduction.
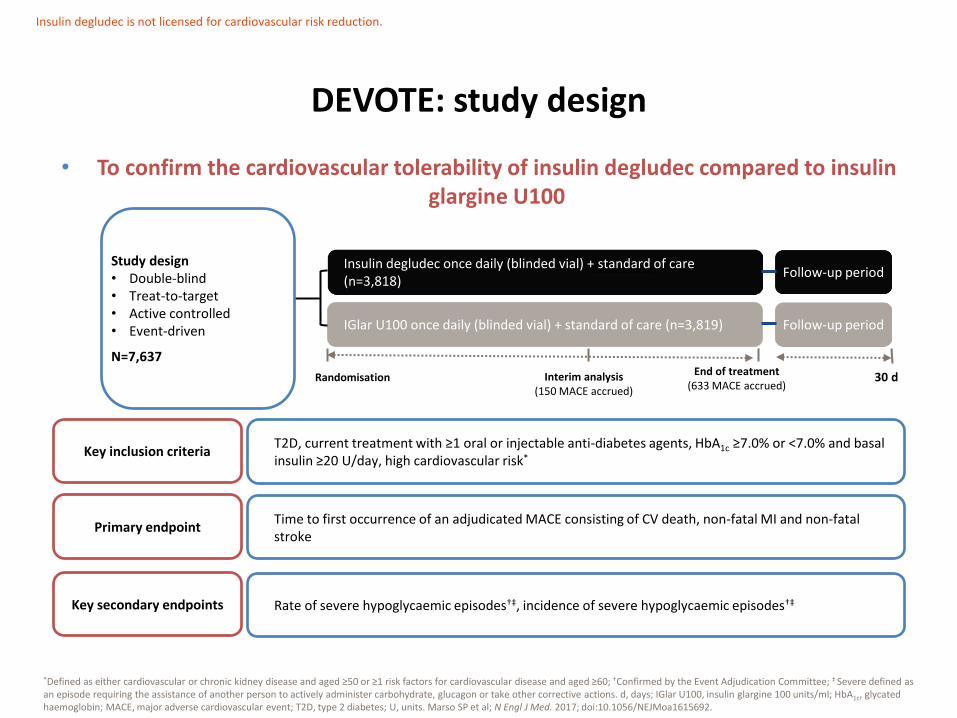
• To confirm the cardiovascular tolerability of insulin degludec compared to insulin glargine U100
DEVOTE: study design
*Defined as either cardiovascular or chronic kidney disease and aged ≥50 or ≥1 risk factors for cardiovascular disease and aged ≥60; †Confirmed by the Event Adjudication Committee; ‡ Severe defined as an episode requiring the assistance of another person to actively administer carbohydrate, glucagon or take other corrective actions. d, days; IGlar U100, insulin glargine 100 units/ml; HbA1c, glycated haemoglobin; MACE, major adverse cardiovascular event; T2D, type 2 diabetes; U, units. Marso SP et al; N Engl J Med. 2017; doi:10.1056/NEJMoa1615692.
Insulin degludec once daily (blinded vial) + standard of care (n=3,818)
IGlar U100 once daily (blinded vial) + standard of care (n=3,819)
Randomisation End of treatment
(633 MACE accrued)
Follow-up period
30 d
Follow-up period
Interim analysis (150 MACE accrued)
Study design • Double-blind • Treat-to-target • Active controlled • Event-driven
N=7,637
Time to first occurrence of an adjudicated MACE consisting of CV death, non-fatal MI and non-fatal stroke
T2D, current treatment with ≥1 oral or injectable anti-diabetes agents, HbA1c ≥7.0% or <7.0% and basal insulin ≥20 U/day, high cardiovascular risk*
Primary endpoint
Key inclusion criteria
Insulin degludec is not licensed for cardiovascular risk reduction.
Rate of severe hypoglycaemic episodes†‡, incidence of severe hypoglycaemic episodes†‡ Key secondary endpoints
0
2
4
6
8
10
12
0 3 6 9 12 15 18 21 24 27 30
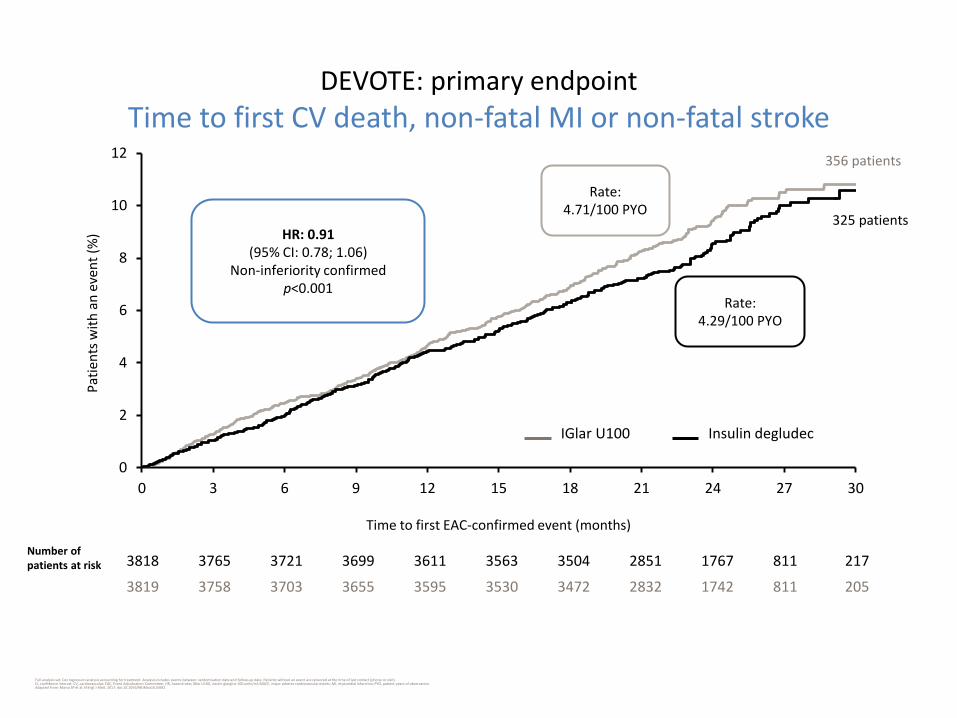
DEVOTE: primary endpoint
Time to first CV death, non-fatal MI or non-fatal stroke
Full analysis set; Cox regression analysis accounting for treatment. Analysis includes events between randomisation date and follow-up date. Patients without an event are censored at the time of last contact (phone or visit). CI, confidence interval; CV, cardiovascular; EAC, Event Adjudication Committee; HR, hazard ratio; IGlar U100, insulin glargine 100 units/ml; MACE, major adverse cardiovascular events; MI, myocardial infarction; PYO, patient-years of observation. Adapted from: Marso SP et al; N Engl J Med. 2017; doi:10.1056/NEJMoa1615692.
HR: 0.91 (95% CI: 0.78; 1.06)
Non-inferiority confirmed p<0.001
Pat
ien
ts w
ith
an
eve
nt
(%)
3818 3765 3721 3699 3611 3563 3504 2851 1767 811 217
3819 3758 3703 3655 3595 3530 3472 2832 1742 811 205
Time to first EAC-confirmed event (months)
356 patients
325 patients
Rate: 4.71/100 PYO
Rate: 4.29/100 PYO
IGlar U100 Insulin degludec
Number of patients at risk

DEVOTE: rates of severe hypoglycaemia
Full analysis set; Mean number of confirmed severe hypoglycaemic episodes. The number of events is analysed using a negative binomial regression model using a log link and the logarithm of the observation time (100 years) as offset. CI, confidence interval; E, number of events; EAC, Event Adjudication Committee; IGlar U100, insulin glargine 100 units/ml; R, events per 100 patient-years of observation; PYO, patient-years of observation. Adapted from: Marso SP et al; N Engl J Med. 2017; doi:10.1056/NEJMoa1615692.
0
4
8
12
16
0 3 6 9 12 15 18 21 24 27 30
Mea
n n
um
ber
of
even
ts/1
00
PYO
Time from randomisation (months)
Insulin degludec (n=3818) IGlar U100 (n=3819)
E R E R
EAC-confirmed episodes 280 3.70 472 6.25
Rate ratio: 0.60 (95% CI: 0.48; 0.76)
p<0.001
IGlar U100 Insulin degludec
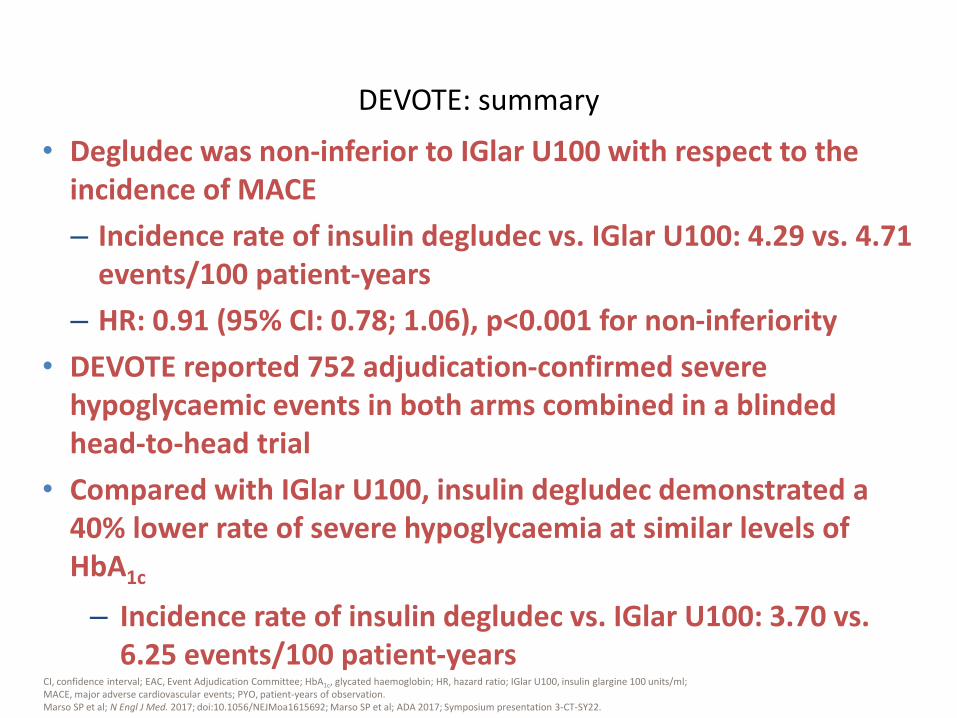
• Degludec was non-inferior to IGlar U100 with respect to the incidence of MACE
– Incidence rate of insulin degludec vs. IGlar U100: 4.29 vs. 4.71 events/100 patient-years
– HR: 0.91 (95% CI: 0.78; 1.06), p<0.001 for non-inferiority
• DEVOTE reported 752 adjudication-confirmed severe hypoglycaemic events in both arms combined in a blinded head-to-head trial
• Compared with IGlar U100, insulin degludec demonstrated a 40% lower rate of severe hypoglycaemia at similar levels of HbA1c
– Incidence rate of insulin degludec vs. IGlar U100: 3.70 vs. 6.25 events/100 patient-years
DEVOTE: summary
CI, confidence interval; EAC, Event Adjudication Committee; HbA1c, glycated haemoglobin; HR, hazard ratio; IGlar U100, insulin glargine 100 units/ml; MACE, major adverse cardiovascular events; PYO, patient-years of observation. Marso SP et al; N Engl J Med. 2017; doi:10.1056/NEJMoa1615692; Marso SP et al; ADA 2017; Symposium presentation 3-CT-SY22.
3.70 472 6.25
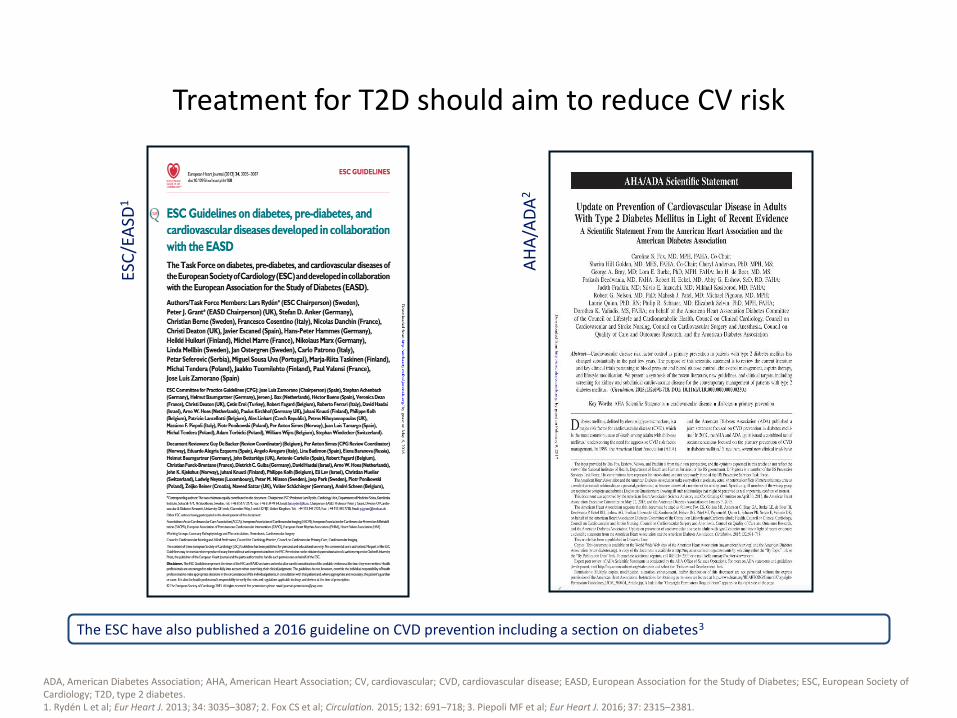
Treatment for T2D should aim to reduce CV risk
ADA, American Diabetes Association; AHA, American Heart Association; CV, cardiovascular; CVD, cardiovascular disease; EASD, European Association for the Study of Diabetes; ESC, European Society of Cardiology; T2D, type 2 diabetes. 1. Rydén L et al; Eur Heart J. 2013; 34: 3035–3087; 2. Fox CS et al; Circulation. 2015; 132: 691–718; 3. Piepoli MF et al; Eur Heart J. 2016; 37: 2315–2381.
ESC
/EA
SD1
AH
A/A
DA
2
The ESC have also published a 2016 guideline on CVD prevention including a section on diabetes3

Selected key messages
The multifactorial approach is very important in patients with T2D
Intensive management of hyperglycaemia reduces the risk of microvascular complications and, to a lesser extent, the risk of CVD. However, targets should be relaxed in the elderly, frail, those with long-duration DM and those with existing CVD
In DM patients with existing CVD, the use of a SGLT2 inhibitor substantially lessened CVD and total mortality and HF hospitalisation without major adverse effects. SGLT2 inhibitors should be considered early in the course of DM management in such patients
The ESC have published a 2016 guideline on CVD prevention including a section on diabetes
CVD, cardiovascular disease; DM, diabetes mellitus; ESC, European Society of Cardiology; HF, heart failure; SGLT2, sodium-glucose co-transporter 2; T2D, type 2 diabetes. Piepoli MF et al; Eur Heart J. 2016; 37: 2315–2381.
ESC guidelines were published in 2016 LEADER and SUSTAIN-6 data have since been published as well
Mechanisms of action
Home
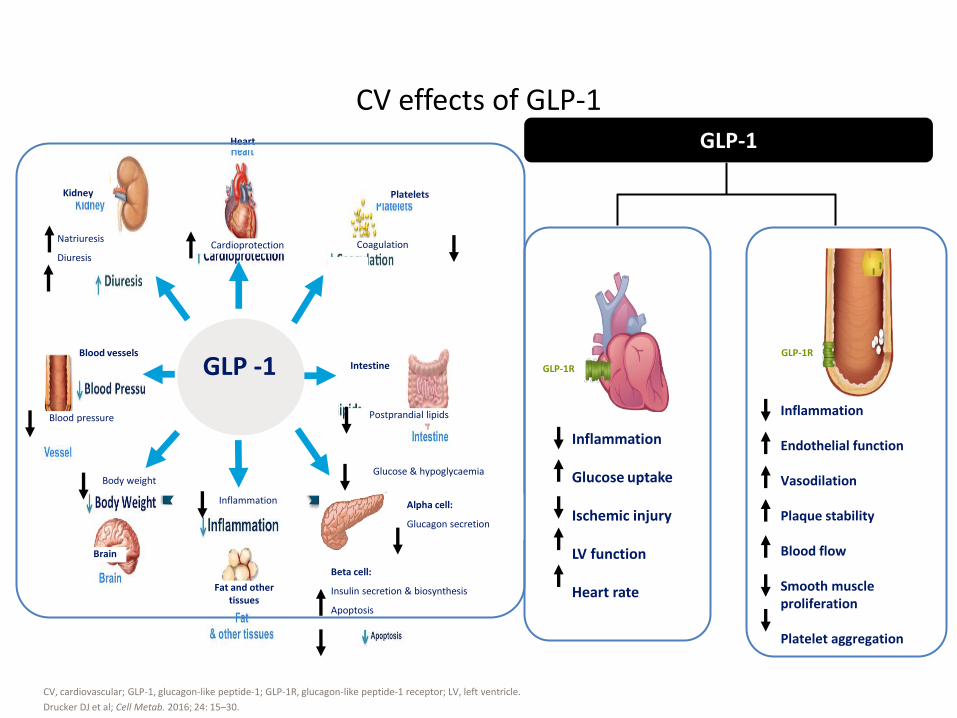
Inflammation Glucose uptake Ischemic injury LV function Heart rate
Inflammation Endothelial function Vasodilation Plaque stability Blood flow Smooth muscle proliferation Platelet aggregation
CV effects of GLP-1
CV, cardiovascular; GLP-1, glucagon-like peptide-1; GLP-1R, glucagon-like peptide-1 receptor; LV, left ventricle.
Drucker DJ et al; Cell Metab. 2016; 24: 15–30.
GLP-1
GLP-1R
GLP-1R
Kidney
Heart
Platelets
Fat and other tissues
Brain
Blood vessels
Natriuresis
Diuresis
Blood pressure
Inflammation
Postprandial lipids
Glucose & hypoglycaemia
Cardioprotection
Body weight
GLP -1 Intestine
Alpha cell:
Glucagon secretion
Beta cell:
Insulin secretion & biosynthesis
Apoptosis
Coagulation

GLP-1 RAs have multifactorial effects
Liver
Brain Pancreas
Stomach
Cardiovascular risk2
Fatty acid metabolism3
Cardiac function3
Systolic blood
pressure3
Inflammation4
Endogenous glucose
production10
Hepatic insulin
sensitivity10
De novo lipogenesis10
Lipotoxicity10
Steatosis11
Beta-cell function1
Beta-cell apoptosis1
Insulin biosynthesis1
Glucose-dependent
insulin secretion1
Glucose-dependent
glucagon secretion1
Body weight5
Food intake5
Satiety7,8
Gastric emptying9
Heart
Portions of the content presented on this slide may originate from non-human studies, i.e., animal and in vitro studies. GLP-1 RA, glucagon-like peptide-1 receptor agonist.
Adapted from 1. Campbell JE, Drucker DJ; Cell Metab. 2013; 17: 819–837; 2. Pratley RE, Gilbert M; Rev Diabet Stud. 2008; 5: 73–94. A full reference list for this slide can be found in the slide notes.
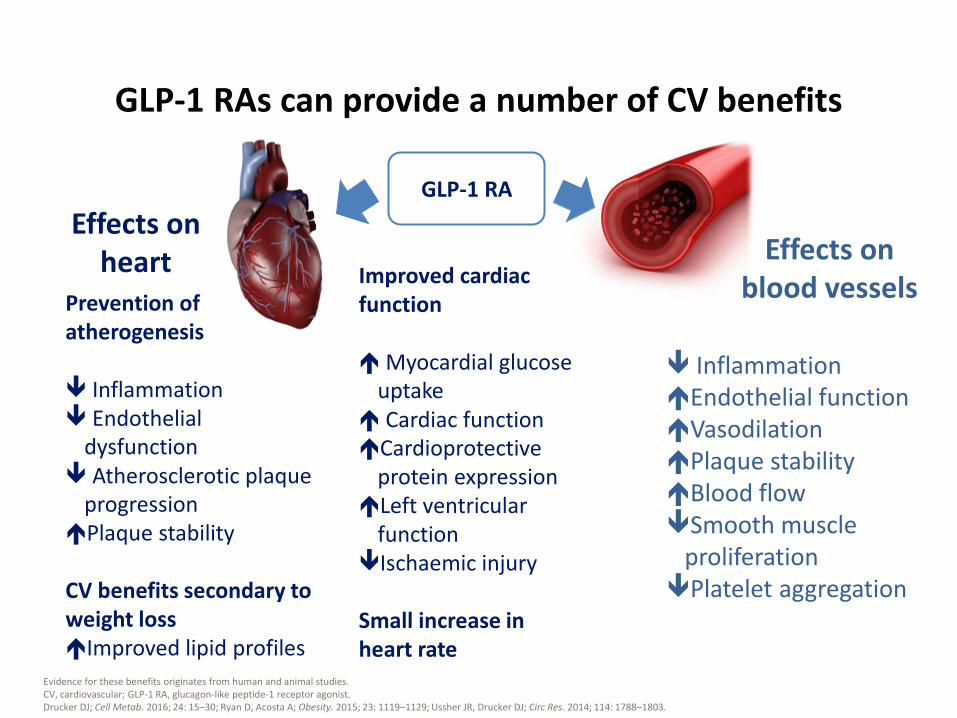
GLP-1 RAs can provide a number of CV benefits
Evidence for these benefits originates from human and animal studies. CV, cardiovascular; GLP-1 RA, glucagon-like peptide-1 receptor agonist. Drucker DJ; Cell Metab. 2016; 24: 15–30; Ryan D, Acosta A; Obesity. 2015; 23: 1119–1129; Ussher JR, Drucker DJ; Circ Res. 2014; 114: 1788–1803.
GLP-1 RA
Improved cardiac function Myocardial glucose
uptake Cardiac function Cardioprotective
protein expression Left ventricular
function Ischaemic injury Small increase in heart rate
Prevention of atherogenesis Inflammation Endothelial
dysfunction Atherosclerotic plaque
progression Plaque stability CV benefits secondary to weight loss Improved lipid profiles
Effects on heart Effects on
blood vessels
Inflammation Endothelial function Vasodilation Plaque stability Blood flow Smooth muscle
proliferation Platelet aggregation
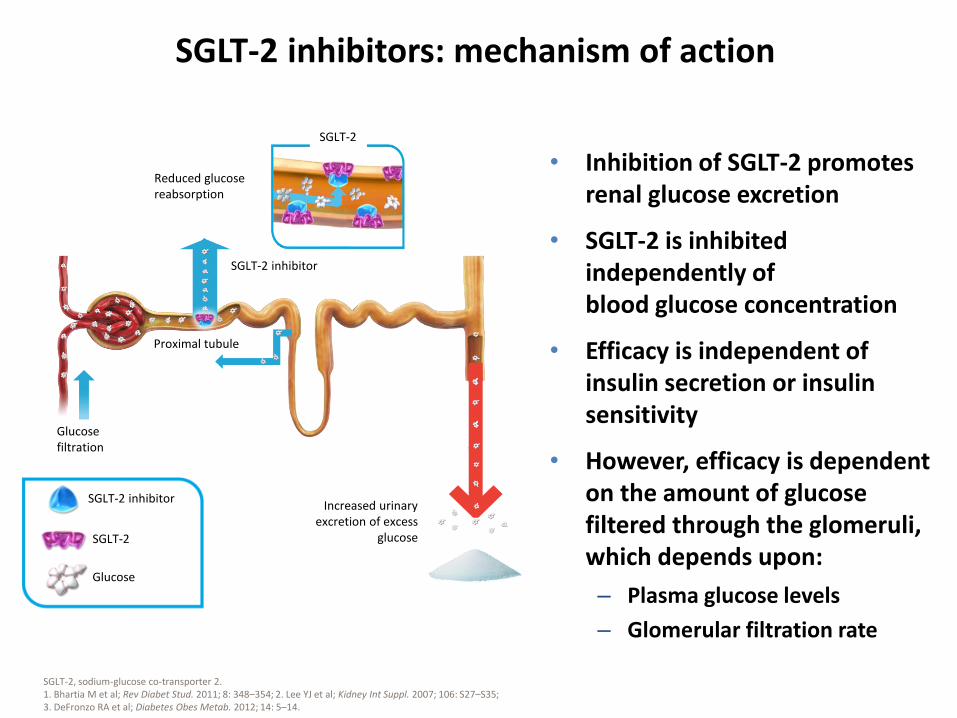
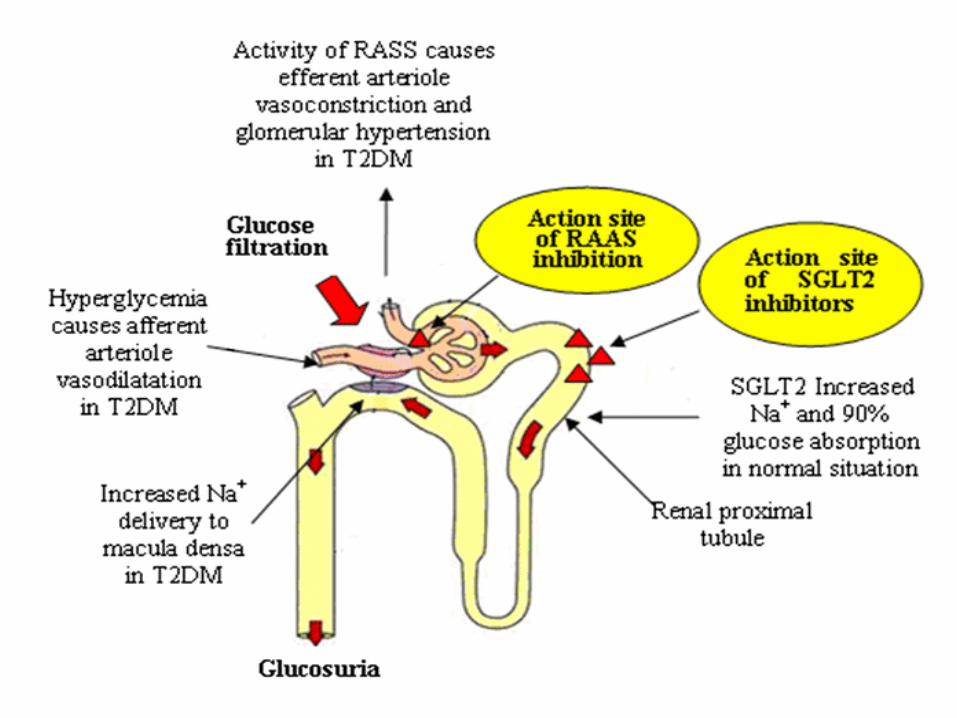
SGLT-2 inhibitors: mechanism of action
SGLT-2, sodium-glucose co-transporter 2. 1. Bhartia M et al; Rev Diabet Stud. 2011; 8: 348–354; 2. Lee YJ et al; Kidney Int Suppl. 2007; 106: S27–S35; 3. DeFronzo RA et al; Diabetes Obes Metab. 2012; 14: 5–14.
Reduced glucose reabsorption
Increased urinary excretion of excess
glucose
Proximal tubule
Glucose filtration
SGLT-2 inhibitor
SGLT-2
SGLT-2
Glucose
SGLT-2 inhibitor
• Inhibition of SGLT-2 promotes renal glucose excretion
• SGLT-2 is inhibited independently of blood glucose concentration
• Efficacy is independent of insulin secretion or insulin sensitivity
• However, efficacy is dependent on the amount of glucose filtered through the glomeruli, which depends upon:
– Plasma glucose levels
– Glomerular filtration rate
• Mudaliar et al have hypothesised that empagliflozin, an SGLT-2 inhibitor, improves myocardial fuel metabolism, myocardial contractility and cardiac efficiency:
• by shifting fuel utilisation away from lipids and glucose (which are less energy efficient) toward ketone bodies that produce ATP energy more efficiently than glucose or FFA and that act as a super fuel
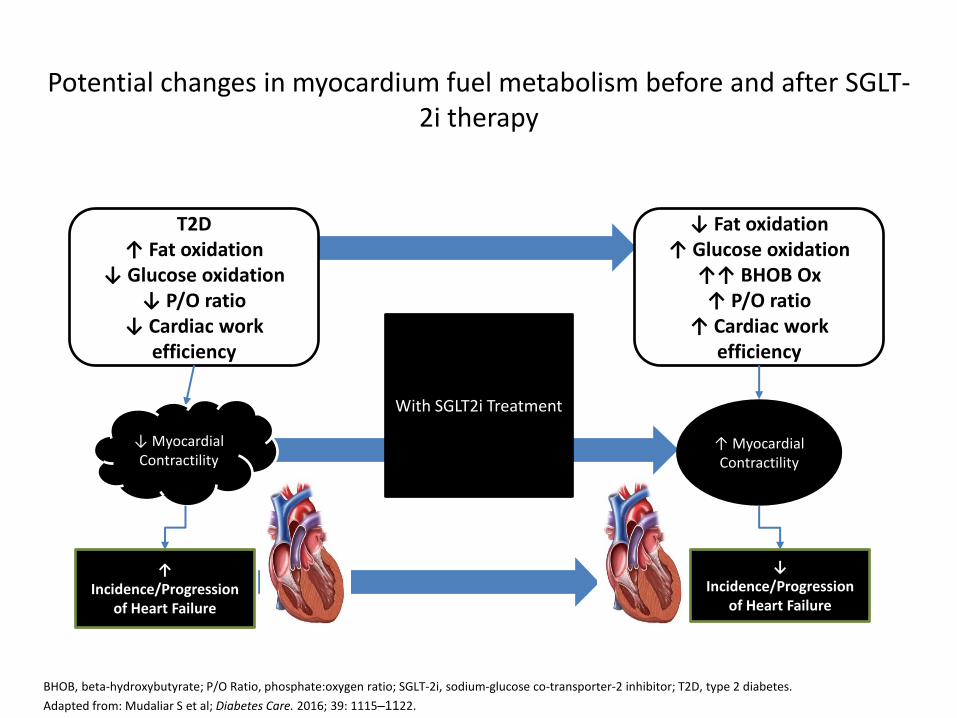
Potential changes in myocardium fuel metabolism before and after SGLT-2i therapy
BHOB, beta-hydroxybutyrate; P/O Ratio, phosphate:oxygen ratio; SGLT-2i, sodium-glucose co-transporter-2 inhibitor; T2D, type 2 diabetes.
Adapted from: Mudaliar S et al; Diabetes Care. 2016; 39: 1115–1122.
T2D ↑ Fat oxidation
↓ Glucose oxidation ↓ P/O ratio
↓ Cardiac work efficiency
↓ Fat oxidation ↑ Glucose oxidation
↑↑ BHOB Ox ↑ P/O ratio
↑ Cardiac work efficiency
With SGLT2i Treatment
↑ Incidence/Progression
of Heart Failure
↓ Incidence/Progression
of Heart Failure
↑ Myocardial Contractility
↓ Myocardial Contractility
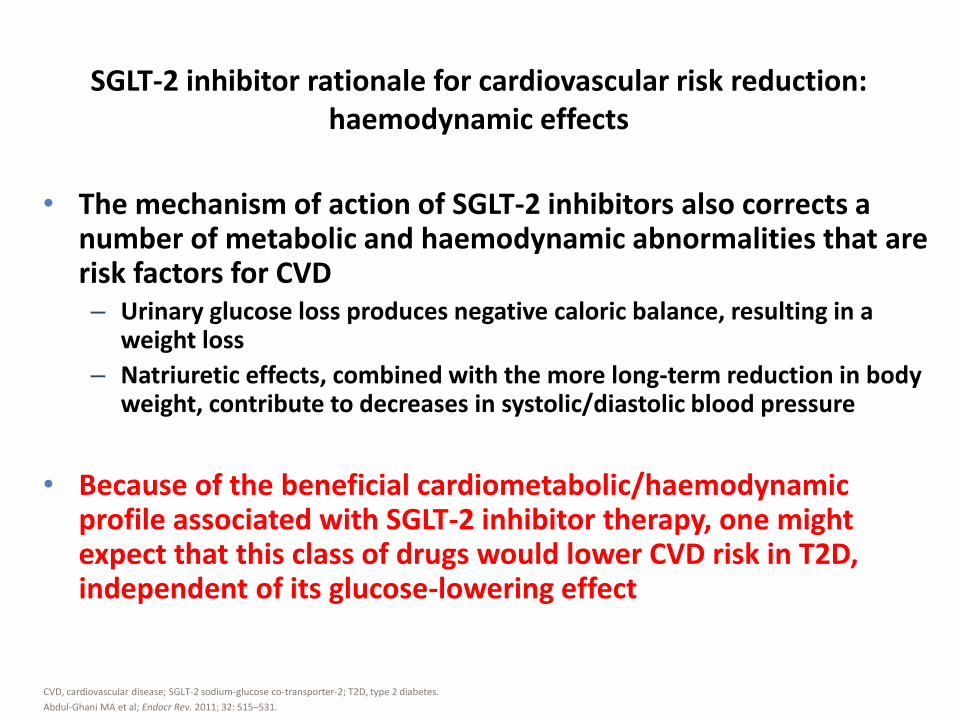
• The mechanism of action of SGLT-2 inhibitors also corrects a number of metabolic and haemodynamic abnormalities that are risk factors for CVD
– Urinary glucose loss produces negative caloric balance, resulting in a weight loss
– Natriuretic effects, combined with the more long-term reduction in body weight, contribute to decreases in systolic/diastolic blood pressure
• Because of the beneficial cardiometabolic/haemodynamic profile associated with SGLT-2 inhibitor therapy, one might expect that this class of drugs would lower CVD risk in T2D, independent of its glucose-lowering effect
SGLT-2 inhibitor rationale for cardiovascular risk reduction: haemodynamic effects
CVD, cardiovascular disease; SGLT-2 sodium-glucose co-transporter-2; T2D, type 2 diabetes.
Abdul-Ghani MA et al; Endocr Rev. 2011; 32: 515–531.
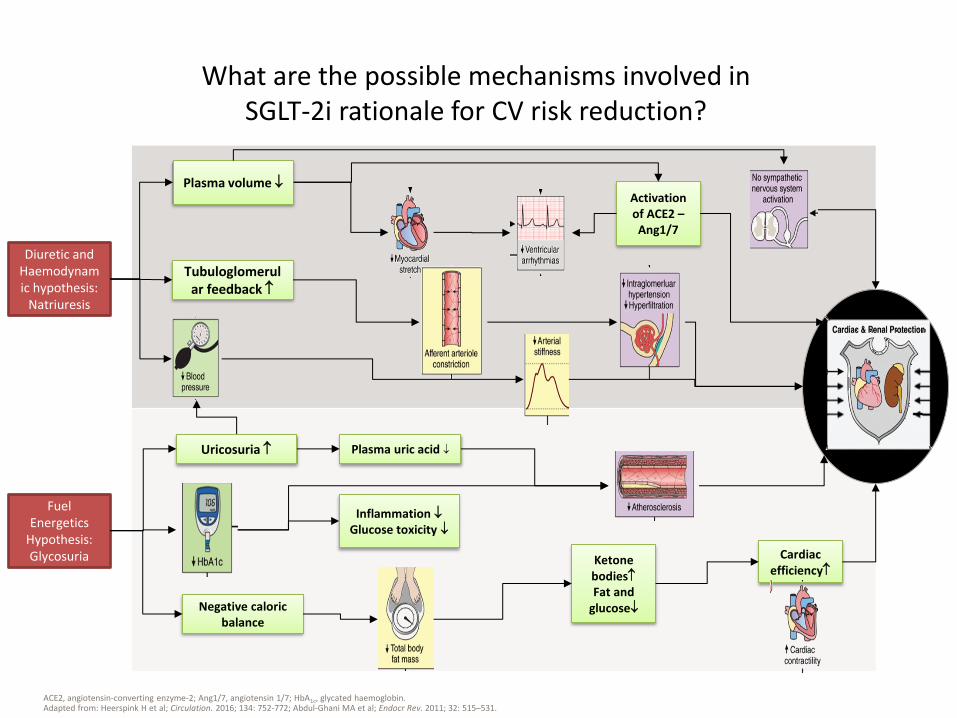
What are the possible mechanisms involved in SGLT-2i rationale for CV risk reduction?
Ketone bodies Fat and
glucose
Cardiac efficiency
Diuretic and Haemodynamic hypothesis:
Natriuresis
Negative caloric balance
Uricosuria
Inflammation Glucose toxicity
Plasma uric acid
Fuel Energetics
Hypothesis: Glycosuria
Plasma volume Activation of ACE2 – Ang1/7
Tubuloglomerular feedback
ACE2, angiotensin-converting enzyme-2; Ang1/7, angiotensin 1/7; HbA1c, glycated haemoglobin. Adapted from: Heerspink H et al; Circulation. 2016; 134: 752-772; Abdul-Ghani MA et al; Endocr Rev. 2011; 32: 515–531.
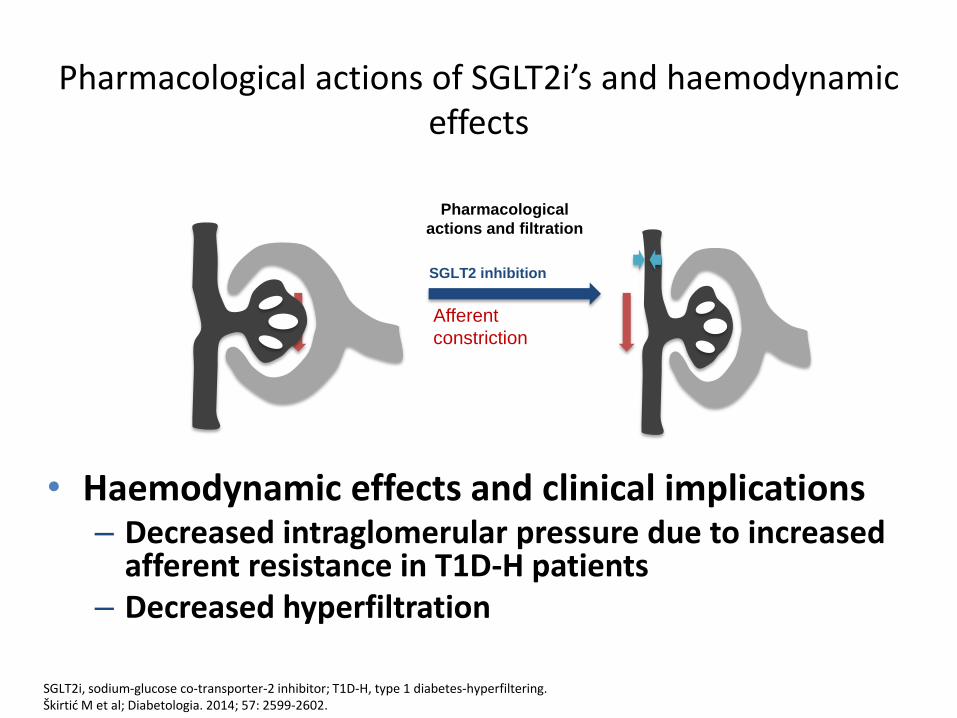
• Haemodynamic effects and clinical implications – Decreased intraglomerular pressure due to increased
afferent resistance in T1D-H patients – Decreased hyperfiltration
Pharmacological actions of SGLT2i’s and haemodynamic effects
SGLT2i, sodium-glucose co-transporter-2 inhibitor; T1D-H, type 1 diabetes-hyperfiltering. Škirtić M et al; Diabetologia. 2014; 57: 2599-2602.
Pharmacological
actions and filtration
Afferent
constriction
SGLT2 inhibition