per capita gdp
TRANSCRIPT

Per-Capita GDP Comparisons
Real per-capita GDP allows us to compare the
standard of living in nations of vastly different sizes. It does this by calculating real GDP per-person
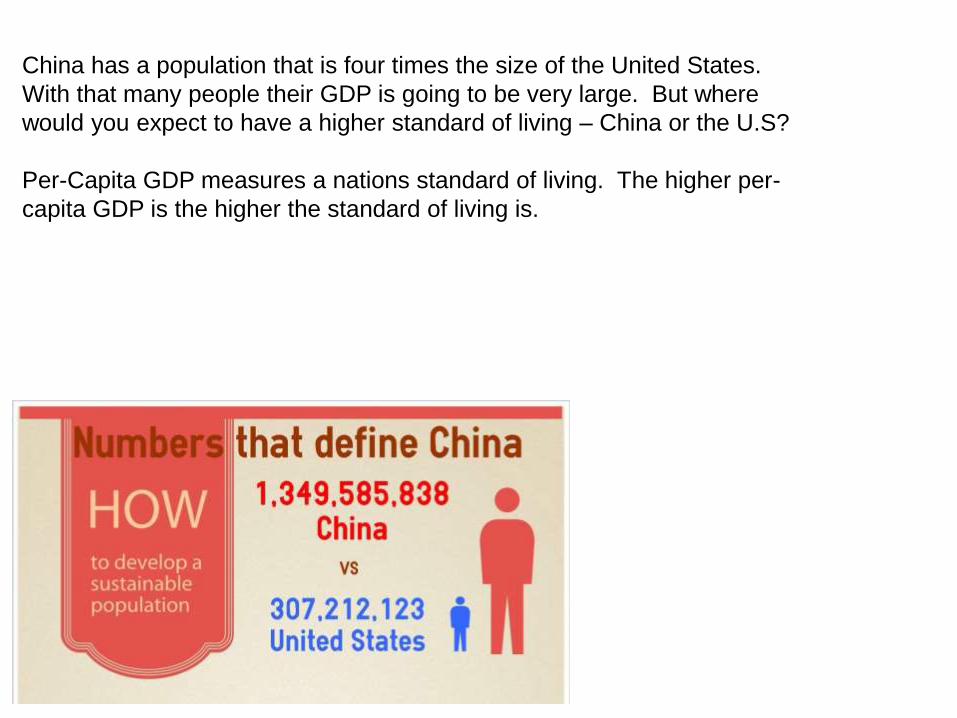
China has a population that is four times the size of the United States.
With that many people their GDP is going to be very large. But where
would you expect to have a higher standard of living – China or the U.S?
Per-Capita GDP measures a nations standard of living. The higher per-
capita GDP is the higher the standard of living is.
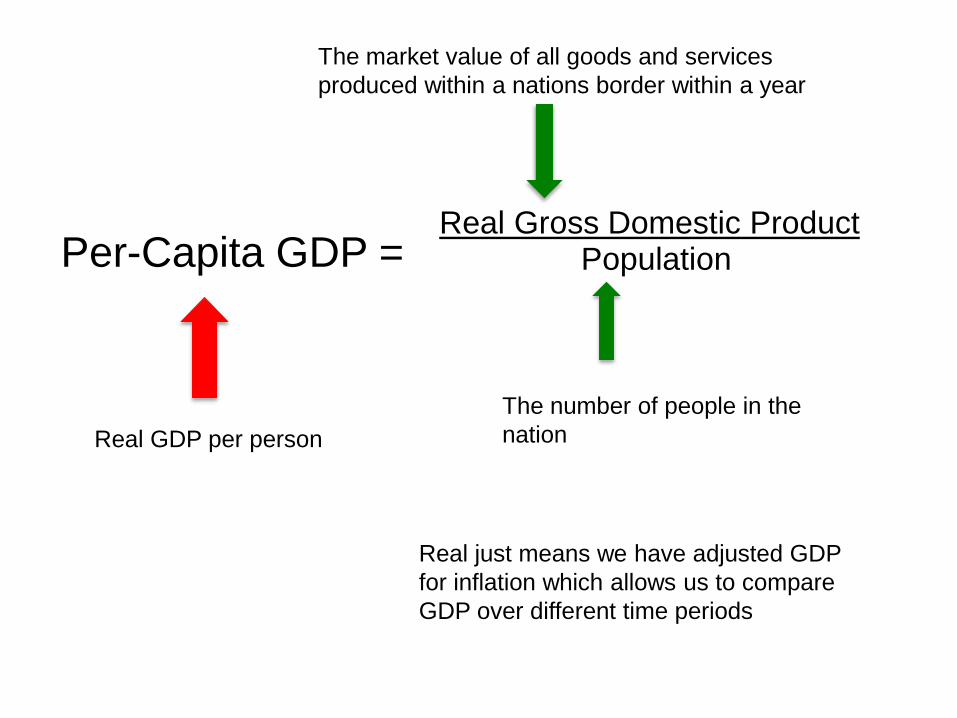
Per-Capita GDP =Real Gross Domestic Product
Population
Real GDP per person
The market value of all goods and services
produced within a nations border within a year
The number of people in the
nation
Real just means we have adjusted GDP
for inflation which allows us to compare
GDP over different time periods
When you see the following per-capita
GDP figures try to think about how a
person can live on that amount for a
year.

Developing Nations
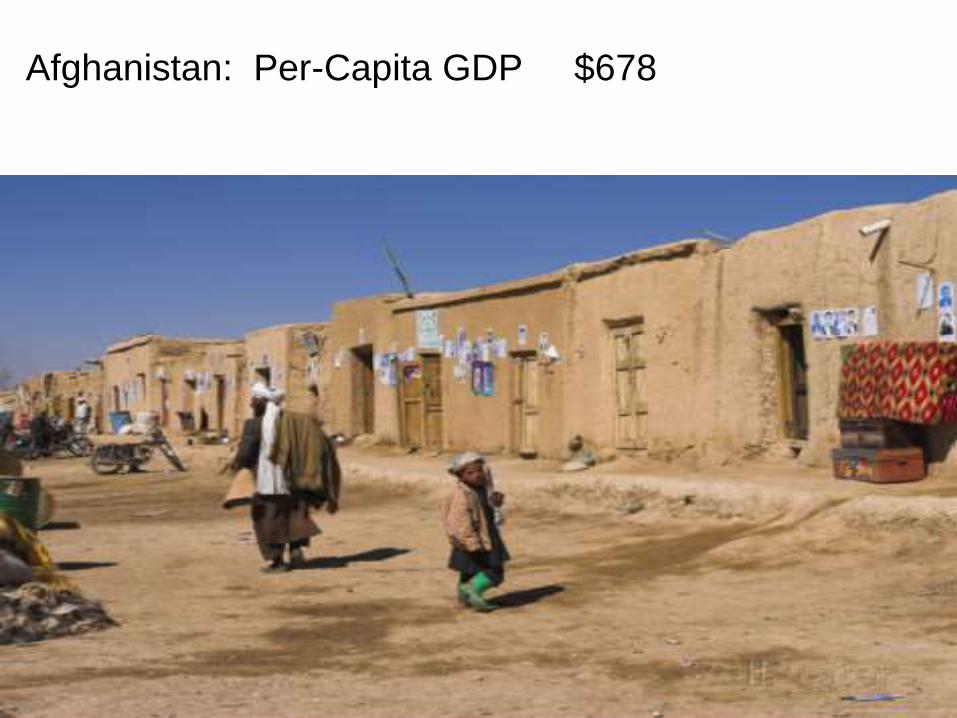
Afghanistan: Per-Capita GDP $678

Zimbabwe: Per-Capita GDP $905

Mongolia: Per-Capita GDP $4,056

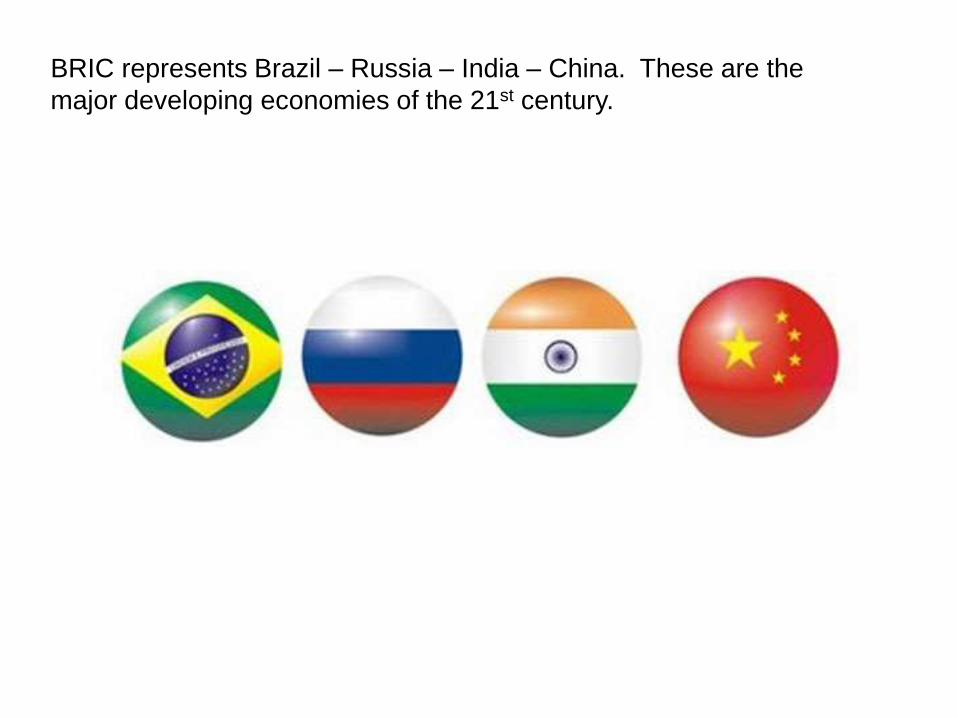
BRIC represents Brazil – Russia – India – China. These are the
major developing economies of the 21st century.
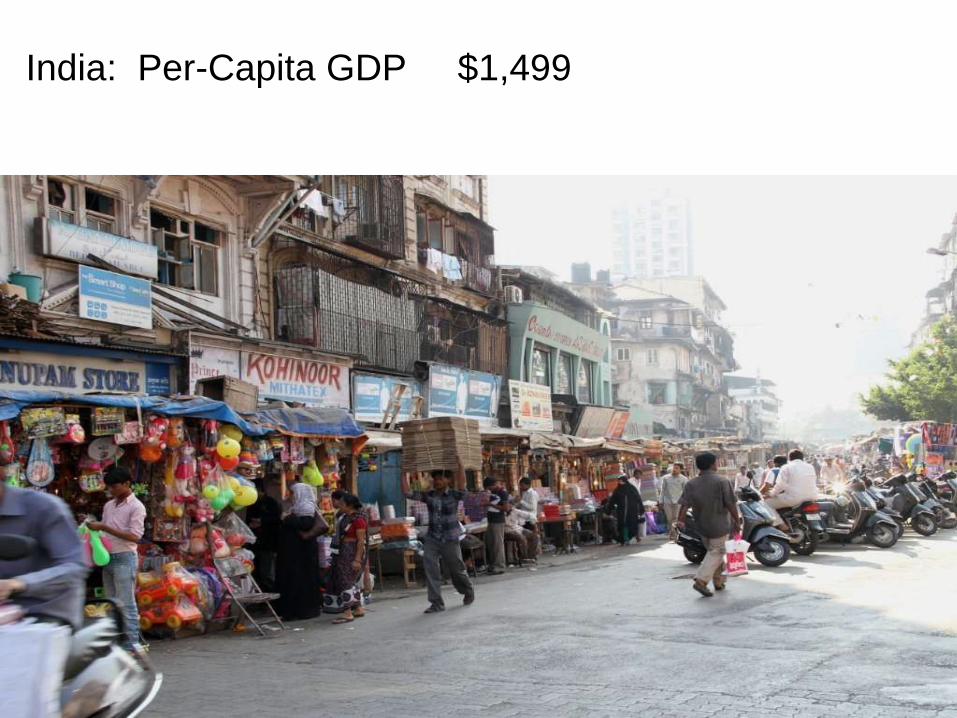
India: Per-Capita GDP $1,499

China: Per-Capita GDP $6,807
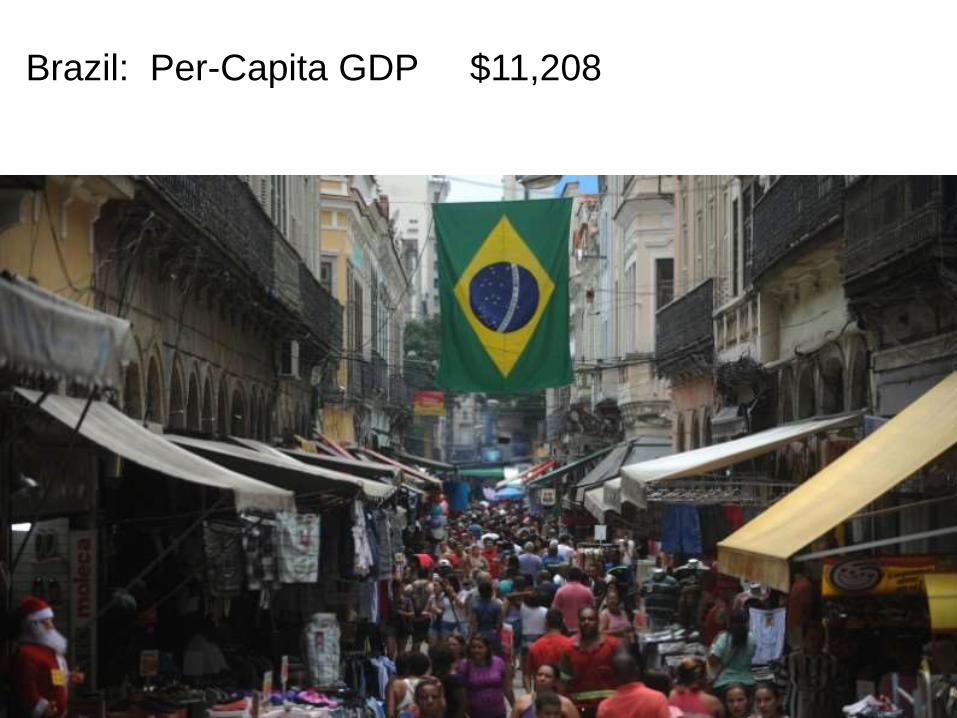
Brazil: Per-Capita GDP $11,208

Russia: Per-Capita GDP $14,612

Advanced Nations

Japan: Per-Capita GDP $38,492
United Kingdom: Per-Capita GDP $39,337
United States: Per-Capita GDP $53,143
Sweden: Per-Capita GDP $58,269

Norway: Per-Capita GDP $100,819