per capita real gdp, usa (in thousands of 2005 $), 1900 2012 · per capita real gdp, usa (in...
TRANSCRIPT
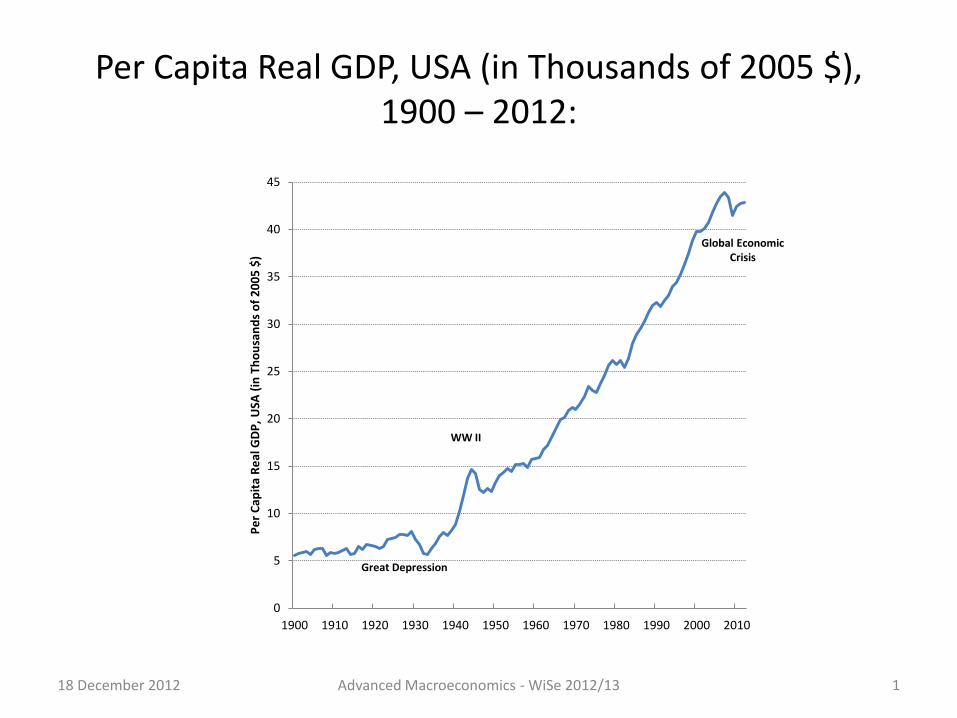
Per Capita Real GDP, USA (in Thousands of 2005 $), 1900 – 2012:
Advanced Macroeconomics - WiSe 2012/13 1
0
5
10
15
20
25
30
35
40
45
1900 1910 1920 1930 1940 1950 1960 1970 1980 1990 2000 2010
Pe
r C
apit
a R
eal
GD
P,
USA
(in
Th
ou
san
ds
of
20
05
$)
WW II
Great Depression
Global Economic Crisis
18 December 2012

Natural Log of Per Capita Real GDP:
Advanced Macroeconomics - WiSe 2012/13 2
1,5
2
2,5
3
3,5
4
1900 1910 1920 1930 1940 1950 1960 1970 1980 1990 2000 2010
Nat
ura
l Lo
g o
f P
er
Cap
ita
Re
al G
DP
:
WW II
Great Depression
Global Economic Crisis
18 December 2012

Natural Log of Per Capita Real GDP and Trend:
Advanced Macroeconomics - WiSe 2012/13 3
1,5
2
2,5
3
3,5
4
1900 1910 1920 1930 1940 1950 1960 1970 1980 1990 2000 2010
Nat
ura
l Lo
g o
f P
er
Cap
ita
Re
al G
DP
an
d T
ren
d
Trend
Actual
18 December 2012

Percentage Deviation of Per Capita Real GDP from Trend:
Advanced Macroeconomics - WiSe 2012/13 4
-20
-15
-10
-5
0
5
10
15
20
25
1900 1910 1920 1930 1940 1950 1960 1970 1980 1990 2000 2010
Pe
rce
nta
ge D
evi
atio
n f
rom
Tre
nd
WW II
Great Depression
Global Economic Crisis
18 December 2012

GDP composition, USA 2011:
Advanced Macroeconomics - WiSe 2012/13 5
Component of GDP $Billions % of GDP GDP 15,075.7 100.0
Consumption 10,729.0 71.2
Durable goods 1,146.4 7.6
Nondurable goods 2,478.4 16.4
Services 7,104.2 47.1
Investment 1,854.9 12.3
Fixed investment 1,818.3 12.1
Nonresidential 1,479.6 9.8
Residential 338.7 2.2
Inventory Investment 36.6 0.2
Net exports of goods and services –568.1 -3.8
Exports 2,094.2 13.9
Imports 2,662.3 17.7
Government expenditures 3,059.8 20.3
Federal 1,222.1 8.1
National defense 820.8 5.4
Nondefense 401.3 2.7
State and local 1,837.7 12.2
Source: www.bea.gov
18 December 2012
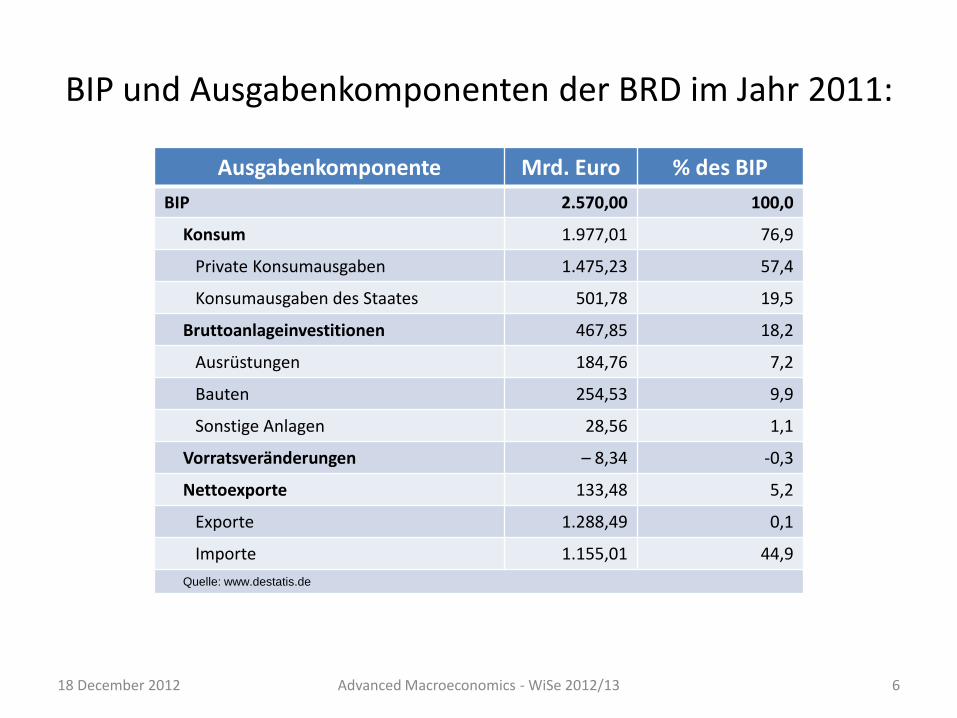
BIP und Ausgabenkomponenten der BRD im Jahr 2011:
Advanced Macroeconomics - WiSe 2012/13 6
Ausgabenkomponente Mrd. Euro % des BIP
BIP 2.570,00 100,0
Konsum 1.977,01 76,9
Private Konsumausgaben 1.475,23 57,4
Konsumausgaben des Staates 501,78 19,5
Bruttoanlageinvestitionen 467,85 18,2
Ausrüstungen 184,76 7,2
Bauten 254,53 9,9
Sonstige Anlagen 28,56 1,1
Vorratsveränderungen – 8,34 -0,3
Nettoexporte 133,48 5,2
Exporte 1.288,49 0,1
Importe 1.155,01 44,9
Quelle: www.destatis.de
18 December 2012
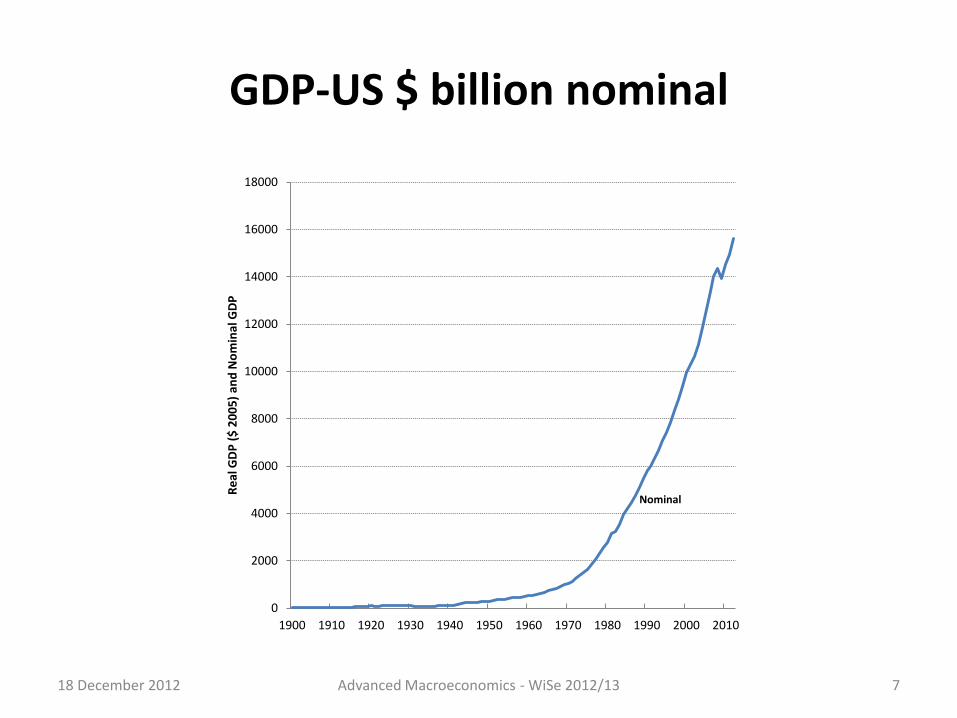
GDP-US $ billion nominal
18 December 2012 Advanced Macroeconomics - WiSe 2012/13 7
0
2000
4000
6000
8000
10000
12000
14000
16000
18000
1900 1910 1920 1930 1940 1950 1960 1970 1980 1990 2000 2010
Re
al G
DP
($
20
05
) an
d N
om
inal
GD
P
Nominal

Real GDP vs. Nominal GDP
18 December 2012 Advanced Macroeconomics - WiSe 2012/13 8
0
2000
4000
6000
8000
10000
12000
14000
16000
18000
1900 1910 1920 1930 1940 1950 1960 1970 1980 1990 2000 2010
Re
al G
DP
($
20
05
) an
d N
om
inal
GD
P
Real
Nominal

Idealized Business Cycle
18 December 2012 Advanced Macroeconomics - WiSe 2012/13 9

Percentage Deviations from Trend in Real GDP from 1947–2009
18 December 2012 Advanced Macroeconomics - WiSe 2012/13 10

Percentage Deviations from Trend in Real Consumption (black line) and Real GDP (colored line) 1947–2009
18 December 2012 Advanced Macroeconomics - WiSe 2012/13 11
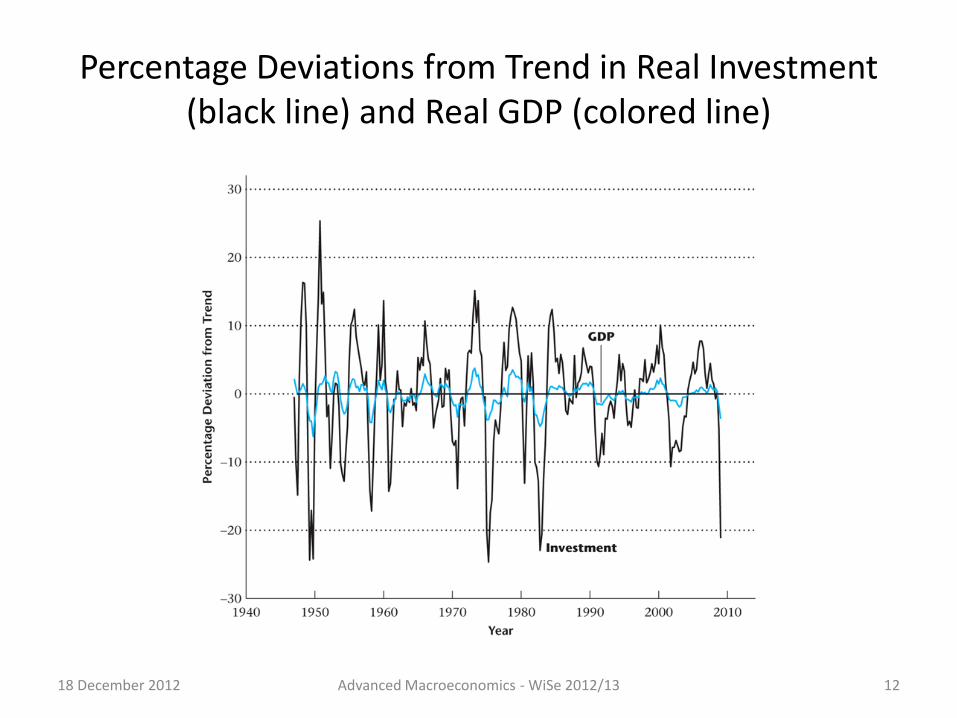
Percentage Deviations from Trend in Real Investment (black line) and Real GDP (colored line)
18 December 2012 Advanced Macroeconomics - WiSe 2012/13 12

Percentage Deviations in Real GDP (colored line) and Housing Starts (black line), for 1959–2009
18 December 2012 Advanced Macroeconomics - WiSe 2012/13 13

Percentage Deviations from Trend in Employment (black line) and Real GDP (colored line)
18 December 2012 Advanced Macroeconomics - WiSe 2012/13 14
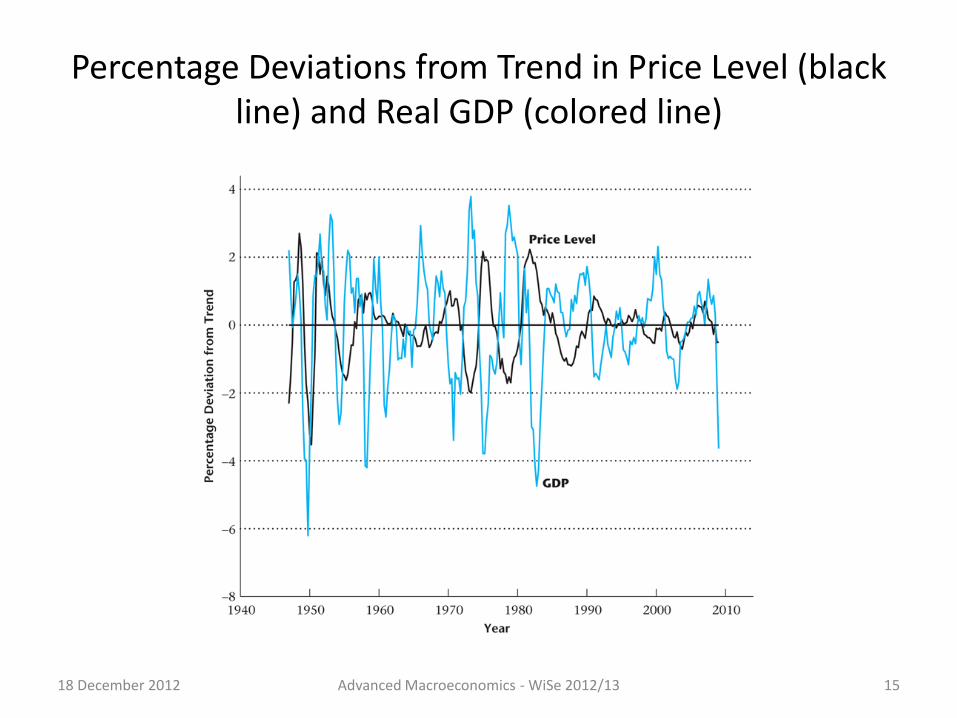
Percentage Deviations from Trend in Price Level (black line) and Real GDP (colored line)
18 December 2012 Advanced Macroeconomics - WiSe 2012/13 15