perception of care survey system
TRANSCRIPT
Perception of Care Survey System
USER GUIDE
Introduction
• Background and Purpose
• Enrolling Staff in the Survey System
• Logging into the Survey System
• Selecting Your Role
• Main Menu Navigation
Survey Management
• Manage Users
• Set Survey Targets – a Must Do
• Staff Enrolled in System
• Printing Survey Forms
• Enter Survey Responses
• Data Collection Monitoring
• Suggestions Regarding Survey
Administration
• Suggestions Regarding Data Entry
Reports and Data Analysis
• Report for Survey Quarter
• Interpreting Reports
• Filtered Report for Survey Quarter
• Quarter Comparison Report
• Export Data to Spreadsheet
• Analyzing Data with SPSS (to be
developed)
Using Your Survey Data for Quality Improvement
• Client-driven Quality Improvement
Further assistance is available at ( [email protected] )

Introduction
Background and Purpose
The 2006 Institute of Medicine (IOM) report on Improving the Quality of Health Care for Mental and
Substance-use Conditions provides recommendations in seven strategic areas. Among
recommendations for patient-centered care is the involvement of clients in the design, administration
and delivery of treatment and recovery services. Well designed and implemented perception of care
surveys are an important method for involving clients in improving the quality and effectiveness of
services. Obtaining patient input is a standard in the health care field. Accreditation bodies require
treatment organizations to routinely involve stakeholders, especially clients. The Substance Abuse
and Mental Health Services Administration (SAMHSA) recognized this in identifying perception of
care as one of 10 nation outcome domains. SAMHSA sponsored the Forum on Performance
Measures for Behavioral Health and Related Service Systems which developed a “modular survey”
for Substance Abuse Treatment services.
Although SAMHSA’s national outcome measures (NOMs) were developed to assess federally-
funded prevention and treatment services, many of the measures address recovery issues. Further,
the modular survey includes many items related to recovery: social connectedness and support for
recovery; participation in employment and education; coping with stress and ability to accomplish
things; access to services and help when needed. Thus perception of care surveys may be used by
programs that do not provide treatment but are designed to support recovery.
In 2008, a survey of New York addiction treatment programs indicated that almost all conducted
some type of client survey (97%), but only half conducted surveys quarterly. Just one-in-eight
programs (13%) used a standard survey instrument. Less than half (43%) had any method for sharing
findings with clients. Only one-in-five (21%) had made any changes in their program based on a
survey.
In 2011, two pilot surveys were conducted using an instrument closely modeled on SAMHSA’s
Modular Survey, but with the inclusion of open-ended write-in items asking clients to identify
problems and make recommendations. About 30 programs assisted in the development and
participated in one or both surveys and over 1600 clients responded to the surveys. The Perception
of Care (PoC) Survey System was developed based on experience from these pilot surveys.
The Perception of Care Survey System is intended to support service providers in implementing
effective client surveys as part of their Quality Improvement (QI) program. The system enables
providers to collect, enter and analyze their own client survey data. Open-ended write-in questions
are included so that clients can provide program managers with concrete ideas for quality
improvement. (These client write-in responses cannot be viewed by state agency staff since their
purpose is to help program directors improve services and they must be interpreted in the specific
program context.) Guidelines are developed to assist providers in administering and utilizing their
perception of care surveys as part of a client-driven quality improvement protocol at the programs
level.

Enrolling Staff in the Survey System
If you are already a user of other OASAS applications, such as the Client Data System, you will use
the same user ID and password. If not, you will need to complete and IRM-15 application. Your
access to survey system functions is based on your role. Your provider administrator will determine
what roles to assign to various staff members:
Program Staff Role – As program staff enrolled in the survey system you will be able to obtain a
print version of the survey form (PDF file), enter survey data for your program from survey forms
completed by clients, and see how many surveys have already been entered.
Program Administrator Role – In addition to what program staff can do, as program-level
administrator you will be able to generate reports for your program as well as see which staff
members have been enrolled as survey system users for your program.
Provider Administrator Role – As provider-level administrator, responsible for one or more
programs, you will control access to the system by assigning roles for other staff members. You will
be able to set your quarterly data collection targets for each of your participating programs. (Data
cannot be entered for a program unless you specify a survey target for the program.) In addition,
you will be able to do all that your program administrators can do.
You may have more than one role and may switch roles depending on what function you are
performing for a particular program. For instance, you may be a program administrator for two
different programs while being program staff for a third program. You can only play one role for one
program at a time; fortunately switching roles is easy. (The provider administrator role, however,
accesses all programs belonging to the provider.)
In order to participate in the Survey System, an agency must have a provider administrator. An
agency may have more than one person in the provider administrator role: for instance, a director of
addictions or mental health services and a quality improvement (QI) director. In fact, it is
recommended that an agency have two or more provider administrators to assure continuity during
vacations and staff transitions. Similarly, you may have more than one staff member in the program
administrator role for a single program—whatever makes sense for your agency. Any staff member
who will be entering data must be enrolled at least at the program staff role level.
(It is possible that a single individual may be a program administrator for more than one or even all
the programs operated by an agency without being a provider administrator. Similarly, a single
person could be program staff for more than one program, for instance, as part of a centralized data
entry function.)
Enrollment Process
1. Initially, all provider staff enrolled in the NYS OASAS applications system will be
assigned the provider administrator role for their program(s). The person(s) who will perform the
provider administrator function will then re-assign roles for each staff person

based on your agency’s survey management plan. Thus, current NYS OASAS providers can
begin using the system without having to enroll staff. (However it is important that
responsible staff be familiar with these guidelines and or participate in an orientation
session before any data is entered into the system.)
1 If prior to 05/03/2013 you were a user of other OASAS applications you will use the
same user ID and Password. Otherwise, you will use the OASAS APP ID provided on your
enrollment form (IRM-15). Please remember that you must go to the OASAS APP website to
change your temporary password. A temporary password will not enable access to the
Perception of Care Survey System. OASAS_APPS
2 Provider staff not already enrolled in NYS OASAS applications systems will have to
complete an IRM 15 application in order to use the Survey System.
3 When completing the IRM-15 application you must select Other in the SYSTEM
TO BE ACCESSED section and write-in Perception of Care.

Logging into the Survey System
Using your Internet browser, enter the URL address for the Perception of Care Survey System:
https://www.oasas.ny.gov/poc/.You will see the Login screen. (See figure below.) To log in, use
your OASAS Applications User ID and your password. (If you do not already have a user ID, you
must submit an IRM-15 application
By logging into the Survey System, you are signing the User Agreement which governs, among
other things, the confidentiality of client/participant responses to the survey. While the data stored in
the Perception of Care Survey System is anonymous, demographic survey data and/or open-ended
comments entered into the system combined with staff knowledge of clients may be sufficient to
identify a client. Therefore, whether in the online system or on paper, these data should be treated as
confidential.
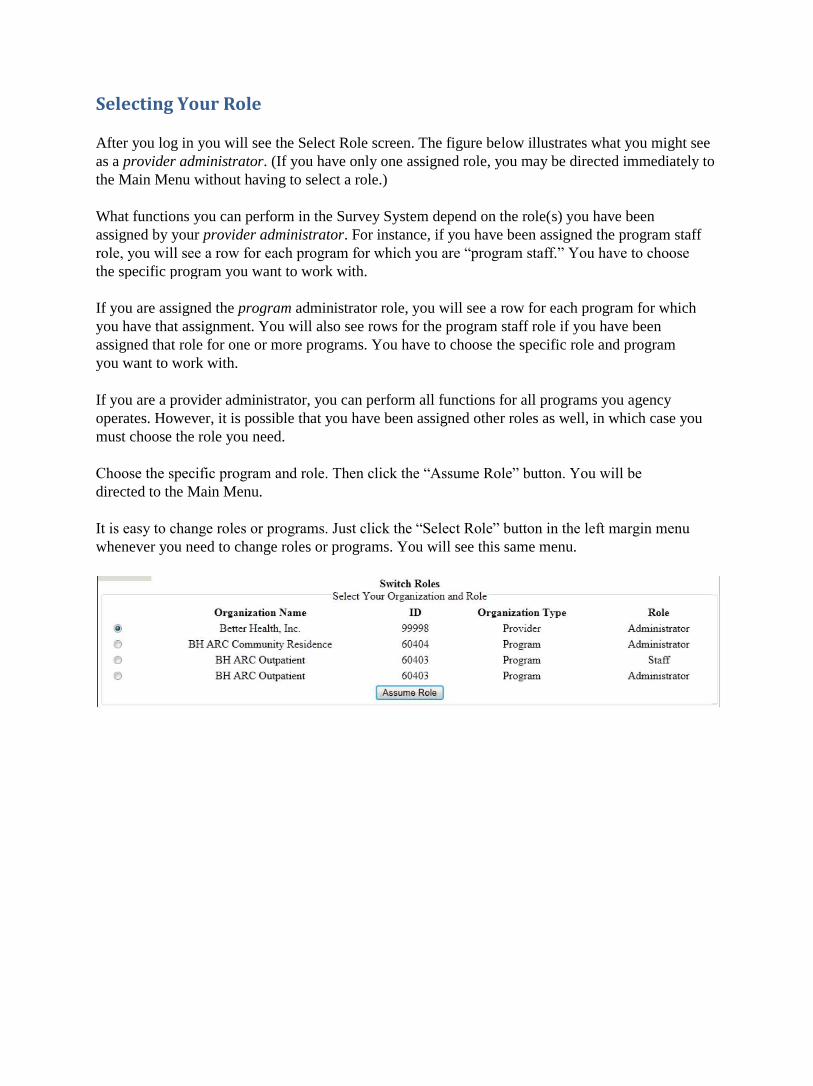
Selecting Your Role
After you log in you will see the Select Role screen. The figure below illustrates what you might see
as a provider administrator. (If you have only one assigned role, you may be directed immediately to
the Main Menu without having to select a role.)
What functions you can perform in the Survey System depend on the role(s) you have been
assigned by your provider administrator. For instance, if you have been assigned the program staff
role, you will see a row for each program for which you are “program staff.” You have to choose
the specific program you want to work with.
If you are assigned the program administrator role, you will see a row for each program for which
you have that assignment. You will also see rows for the program staff role if you have been
assigned that role for one or more programs. You have to choose the specific role and program
you want to work with.
If you are a provider administrator, you can perform all functions for all programs you agency
operates. However, it is possible that you have been assigned other roles as well, in which case you
must choose the role you need.
Choose the specific program and role. Then click the “Assume Role” button. You will be
directed to the Main Menu.
It is easy to change roles or programs. Just click the “Select Role” button in the left margin menu
whenever you need to change roles or programs. You will see this same menu.
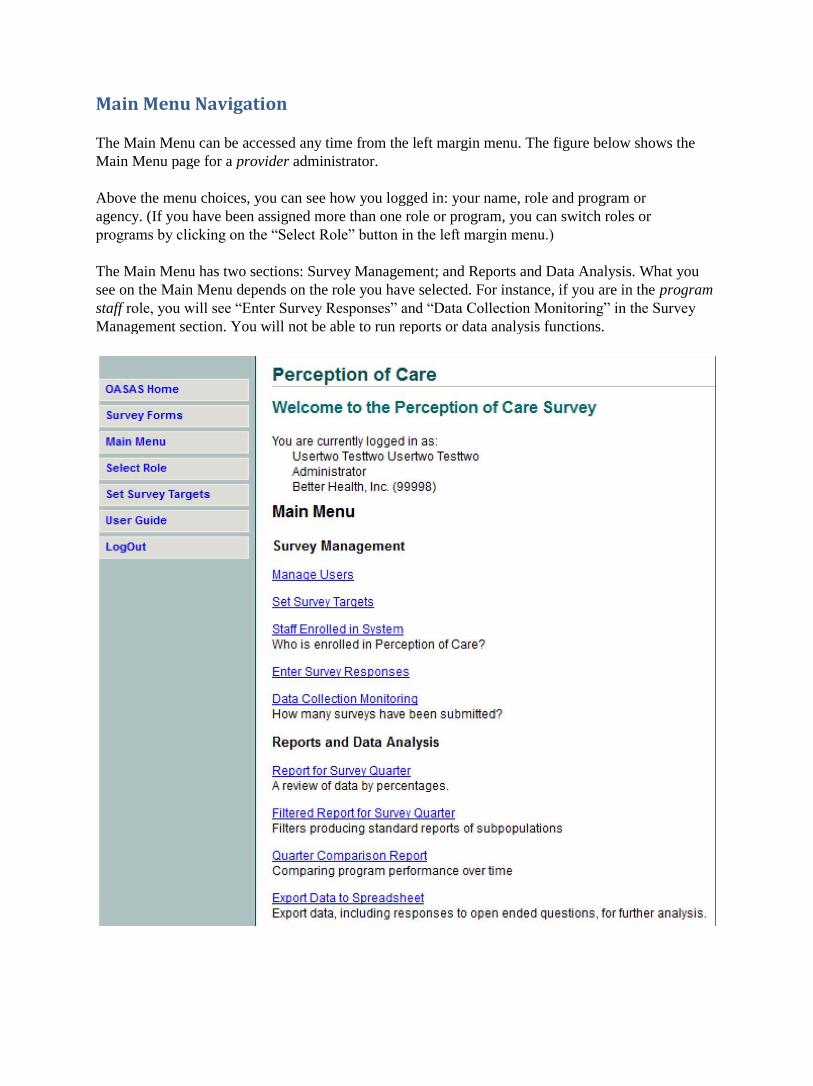
Main Menu Navigation
The Main Menu can be accessed any time from the left margin menu. The figure below shows the
Main Menu page for a provider administrator.
Above the menu choices, you can see how you logged in: your name, role and program or
agency. (If you have been assigned more than one role or program, you can switch roles or
programs by clicking on the “Select Role” button in the left margin menu.)
The Main Menu has two sections: Survey Management; and Reports and Data Analysis. What you
see on the Main Menu depends on the role you have selected. For instance, if you are in the program
staff role, you will see “Enter Survey Responses” and “Data Collection Monitoring” in the Survey
Management section. You will not be able to run reports or data analysis functions.

Survey Management
Manage Users
On the Main Menu, if you are logged in as provider administrator, you will see “Manage Users” as
the first choice under the Survey Management section. Provider Administrators are responsible for
managing their agency’s Perception of Care surveys, including controlling which staff can access the
Survey System and what roles staff are assigned. Choosing “Manage Users,” you will see a table
with separate rows for each combination of program, staff member and assigned role. (Provider
administrator will be listed only once for an individual since this role provides access to all the
provider’s programs; however, your agency will typically have more than one provider administrator
to assure continuity.) The “Organization Type” column will show either Provider or Program and the
“Role” column will show either administrator or staff.
As provider administrator, you will not see your own role in the table. Thus you will not be able to
change your own role and possibly lock yourself out of the provider administer role. However,
another provider administrator at your agency can change your role from provider administrator if
you will no longer be serving in that capacity.
If a staff member is already enrolled in the NYS OASAS Applications system, but not in the Survey
System part, you can add them by choosing “Add New User” at the top of the table. (You will need to
know his or her user name.) If a staff member is not currently enrolled in OASAS Applications, he or
she must first complete an IRM 15 application. You can also delete a specific

role for a specific staff member in a specific program. If you delete all the roles for a specific staff
member, he or she will no longer appear in the table. Later, if you decide to assign that staff member
a role in the Survey System, you will use the “Add New User” function.
Initially all new users will have the provider administrator role. It is the responsibility of the agency’s
actual provider administrator(s) to re-assign roles. Using the “Edit Roles” function, you will be able
to change an existing role or add a new role. In either case, this involves choosing a specific program
and specifying whether the role is program administrator or program staff.
When you have made the changes, click the “Save Changes” button. A message will appear in red
text indicating whether the change was successful. Then you can click the “Return to Manage Users”
button to see the changes in the Manage Users table.
Assigning the Provider Administrator Role
As provider administrator, you may promote another staff person to that role. At least two staff
members should be assigned the provider administrator role. In addition, you may want to assign this
role to a trusted support staff member as a back-up. While editing a staff member’s role(s), you can
use the “Add User Role” function to assign the provider administrator role. You do this by choosing
“administrator” but not choosing any specific program. The result is displayed below where Program
remains “--Select Program--” but Role is “Administrator.”

Set Survey Targets – a Must Do
The Survey System is designed to produce reports and analyses by calendar quarter. For each
calendar quarter, the provider administrator must determine whether a program is participating in the
Client Perception of Care Survey. This is done by setting survey targets for the year and quarter.
Calendar quarter is a required data element for each completed survey, but no data can be entered
for a calendar quarter until a target has been set for that quarter.
The calendar year and quarter are not determined by when the survey form is completed or when the
data is entered. At data entry, calendar year and quarter are entered before the survey responses. This
provides your agency and programs with flexibility in managing the survey process. For instance,
surveys completed a few days before, or a few days after, the nominal calendar quarter may still be
included in reports for the quarter. (Typically, a perception of care survey should be conducted over
just a few weeks so that it represents a point in time. The timing of the survey is determined by the
provider based on your quality improvement and survey plan.) The date that the survey form was
completed is also entered as a separate data item, but this date is not used in generating standard
reports.
Setting Survey Targets
The setting of survey targets is designed to assist provider administrators and survey coordinators
in monitoring and managing the survey process. The Survey System will show program staff how
many surveys have been entered into the system by quarter for each of your programs. Interpreting
this, however, requires an expectation of how may surveys should be entered, thus the targets.

Expected Number of Clients/Participants Enrolled is the provider administrator’s estimate or
projection of the number of clients or participants who will be eligible to complete the survey. Most
programs will conduct their perception of care survey on a cross-section of clients/ participants, that
is, all who are enrolled in the program at a point in time or during a particular week. The survey
should not be based only on clients who are served during a survey week. For instance, in outpatient
settings the survey may typically be administered in group sessions. However, the program should
have a strategy to obtain survey responses from clients or participants who don’t show up for a
particular survey session. The responses of those less engaged in the program may be very important
for improving client engagement.
Some programs may choose a different sample definition. For instant, a short-term inpatient or
residential program (with a typical length of less than 30 days) may decide to conduct the survey
after the client has completed 3 weeks or as part of the discharge process. In this case the provider
administrator should enter the number of clients expected to reach 3 weeks or to complete the
discharge process during the period (e.g., calendar quarter) rather than the expected enrollment.
Target Sample Size is the goal the provider administrator sets. By comparing this figure against the
actual number of completed forms entered into the Survey System, the provider and program
administrators can determine how the survey is progressing. Program staff can also see the progress
as they enter forms into the Survey System by selecting “Data Collection Monitoring” from the Main
Menu.
Programs with very large enrollments or with high volumes of admissions and discharges may
consider some type of random sampling. In theory, this could enable the program to spend more
effort trying to get responses from the more-difficult-to-survey clients or participants. However, few
programs would have sufficient numbers to sample from, and further, executing a valid probability
sample is often a difficult task. Therefore, the strategy for most programs will be to administer the
survey to all those eligible to be included. Although it is seldom possible to obtain survey responses
from all eligible clients/participants, it is important to obtain responses from a very large proportion
of those eligible. It is recommended that your programs should try to obtain responses from 90
percent or more of those eligible in order to assure that your data is representative of all your
clients/participants. Another perspective is that all clients/participants should have the opportunity to
provide their assessment and recommendations for program improvement. In any case, the targets
you set should be challenging, but realistic, so that staff members do not become discouraged in
trying to meet the targets.
Practice Data Entry – Setting Targets for Calendar 1999
Once data is entered into the Survey System it cannot be deleted or edited. Therefore it is
important that you do not try out data entry using an actual survey year and quarter. The
Provider Administrator should set targets for quarters in 1999 to be used for practicing data entry.
“1999” was chosen as a practice year because it cannot be confused with an actual survey year. To
repeat, do not practice data entry with an actual calendar quarter.
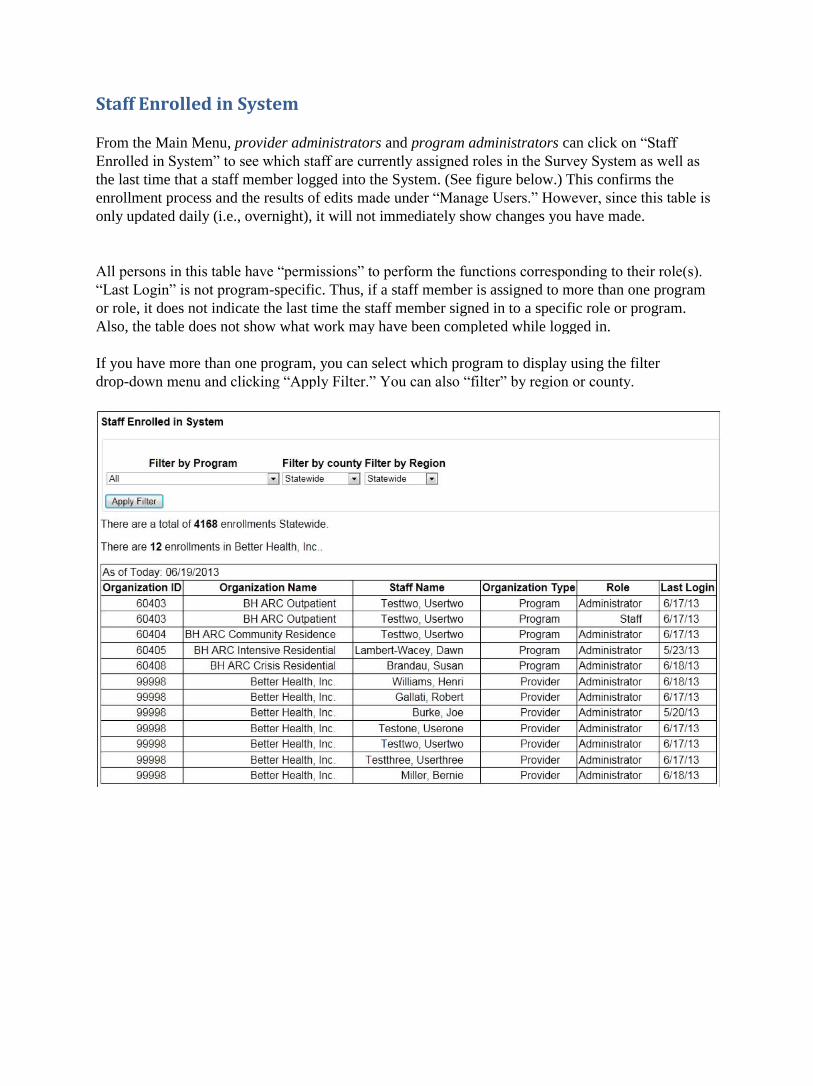
Staff Enrolled in System
From the Main Menu, provider administrators and program administrators can click on “Staff
Enrolled in System” to see which staff are currently assigned roles in the Survey System as well as
the last time that a staff member logged into the System. (See figure below.) This confirms the
enrollment process and the results of edits made under “Manage Users.” However, since this table is
only updated daily (i.e., overnight), it will not immediately show changes you have made.
All persons in this table have “permissions” to perform the functions corresponding to their role(s).
“Last Login” is not program-specific. Thus, if a staff member is assigned to more than one program
or role, it does not indicate the last time the staff member signed in to a specific role or program.
Also, the table does not show what work may have been completed while logged in.
If you have more than one program, you can select which program to display using the filter
drop-down menu and clicking “Apply Filter.” You can also “filter” by region or county.
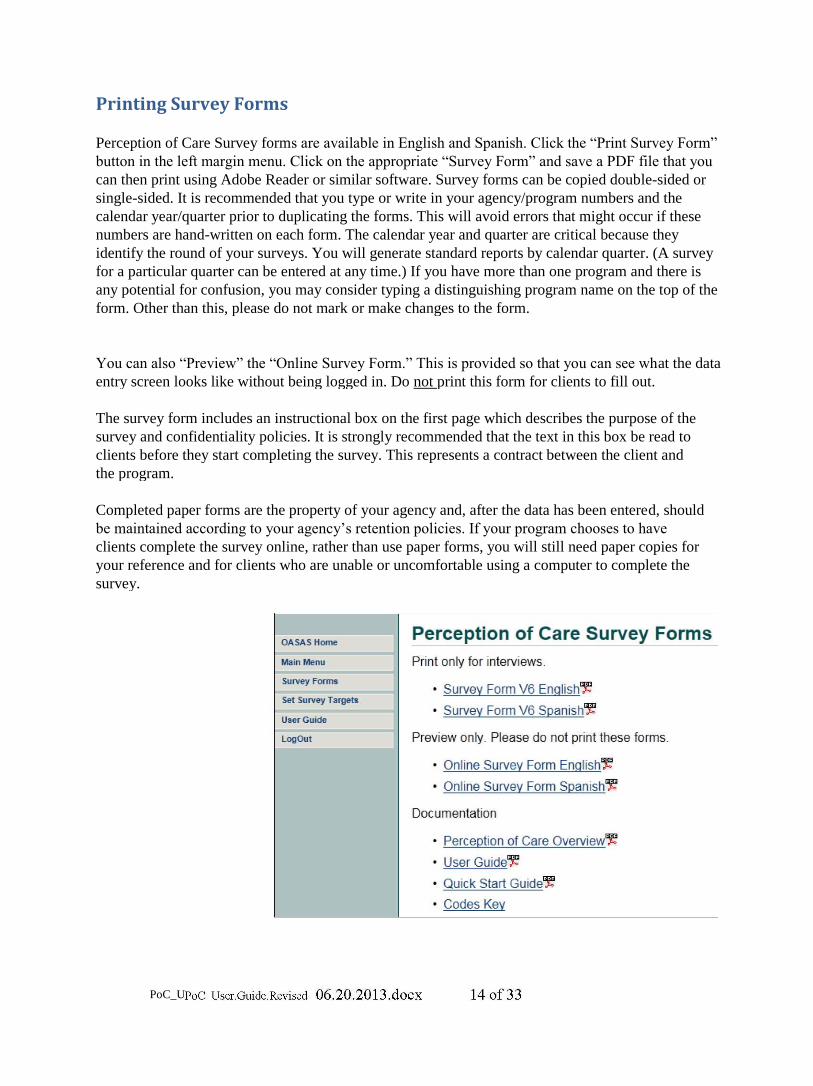
Printing Survey Forms
Perception of Care Survey forms are available in English and Spanish. Click the “Print Survey Form”
button in the left margin menu. Click on the appropriate “Survey Form” and save a PDF file that you
can then print using Adobe Reader or similar software. Survey forms can be copied double-sided or
single-sided. It is recommended that you type or write in your agency/program numbers and the
calendar year/quarter prior to duplicating the forms. This will avoid errors that might occur if these
numbers are hand-written on each form. The calendar year and quarter are critical because they
identify the round of your surveys. You will generate standard reports by calendar quarter. (A survey
for a particular quarter can be entered at any time.) If you have more than one program and there is
any potential for confusion, you may consider typing a distinguishing program name on the top of the
form. Other than this, please do not mark or make changes to the form.
You can also “Preview” the “Online Survey Form.” This is provided so that you can see what the data
entry screen looks like without being logged in. Do not print this form for clients to fill out.
The survey form includes an instructional box on the first page which describes the purpose of the
survey and confidentiality policies. It is strongly recommended that the text in this box be read to
clients before they start completing the survey. This represents a contract between the client and
the program.
Completed paper forms are the property of your agency and, after the data has been entered, should
be maintained according to your agency’s retention policies. If your program chooses to have
clients complete the survey online, rather than use paper forms, you will still need paper copies for
your reference and for clients who are unable or uncomfortable using a computer to complete the
survey.
PoC_User.Guide.Revised_06.20.2013.docx 14 of 33

Enter Survey Responses
Begin at the main menu, and click on “Enter Survey Responses.” You will see a data entry
screen formatted to closely follow the paper survey form. The data entry screen is one
continuous Web page. In addition to the description below, see Suggestions Regarding Data
Entry further below.
Select Client/Participant Type: By default, the Survey System assumes that the survey form being
entered is for a client enrolled in substance use treatment services. However, your program may be
providing recovery services or mental health treatment services. If you do not click on another
alternative, the client/ participant type will be entered as “Treatment.” A program that provides
multiple types of services can use this indicator to produce separate reports for different service
populations.
Select Program, Year and Quarter: In order to enter survey data you must select the program,
calendar year and calendar quarter from the drop-down menus. If you are entering more than one
completed survey form, you will not need to re-enter this information; it will be auto-filled. (It is
important to keep survey forms from different programs or calendar quarters in separate batches so
that the wrong program or calendar quarter information is not auto-filled.)
. . .

Date Survey Conducted is the date the client entered on the paper form. Clicking in this box will
open a calendar from which you can select the date.
Submit Survey: Please note that no data that has been entered will be stored in the data base until you
click “Submit Survey” at the bottom of the data entry screen. Once you click on “Submit Survey” and
confirm that submission, the data is stored. There is no way to change or delete the data for a survey
form once it is submitted. Prior to submitting the data you can change anything on the data entry
screen by scrolling back and re-entering it.
Clear Survey: If a client skipped a question, then you should also skip the question by not clicking a
response. However sometimes we mistakenly click on a response category. This can happen
frequently on the rating scales where a client may leave an item blank if it is “not applicable.” For
most survey items, the survey screen does not let you uncheck a response except by entering another
response. In this case, to clear the item, you have to clear the whole data entry screen. At the bottom
of the data entry screen, click “Clear Survey” which erases all the responses and starts over at the top
of the data entry screen.
Cancel: If you need to stop data entry, click on “Cancel.” No data that you have entered on the screen
will be stored in the data base and you will be returned to the Main Menu. (This also happens if you
click on the Main Menu option in the left-margin menu.) Since the survey is relatively short, there is
no option for closing and later continuing data entry for a survey form. If you are interrupted during
data entry, you should consider canceling and later starting the form over again.
When you have finished entering a batch of forms, you will be at the top of the data entry screen,
ready to enter another form. To end data entry, simply choose any option from the left-margin menu,
such as, “Log Out.” Alternately, you can go to the Main Menu and click “Data Collection
Monitoring” to check how many forms have been entered.
Practicing Data Entry
Prior to entering data, it may be useful to try out the data entry screen. However, since there is no way
to change or delete the data for a survey form once it is submitted, you should not practice data
entry using a real calendar quarter. Your provider administrator can set up survey targets for your
program for Calendar 1999. You will then be able to enter practice data using Calendar 1999.
Since the Survey System was not operational until 2013, practice data for 1999 will not be confused
with read data.
Can Clients/Participants Enter Their Own Responses?
For a client or participant who is able to, and comfortable with, answering the survey on a computer
screen, program staff already enrolled in the Survey System can prepare the system so that the client
can directly enter survey responses. Program staff will need to enter the program identifier and the
calendar year and quarter at the beginning of the survey. See Suggestions Regarding Data Entry
below for further information.
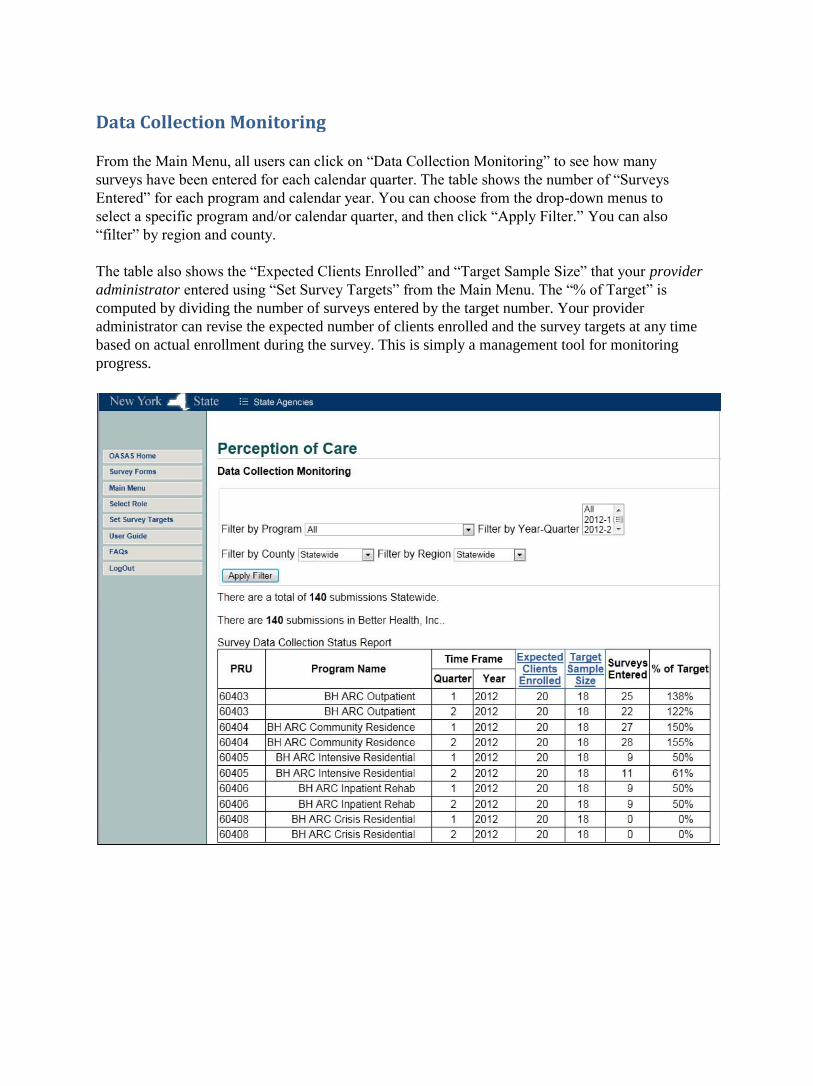
Data Collection Monitoring
From the Main Menu, all users can click on “Data Collection Monitoring” to see how many
surveys have been entered for each calendar quarter. The table shows the number of “Surveys
Entered” for each program and calendar year. You can choose from the drop-down menus to
select a specific program and/or calendar quarter, and then click “Apply Filter.” You can also
“filter” by region and county.
The table also shows the “Expected Clients Enrolled” and “Target Sample Size” that your provider
administrator entered using “Set Survey Targets” from the Main Menu. The “% of Target” is
computed by dividing the number of surveys entered by the target number. Your provider
administrator can revise the expected number of clients enrolled and the survey targets at any time
based on actual enrollment during the survey. This is simply a management tool for monitoring
progress.

Suggestions Regarding Survey Administration
These suggestions are offered to your program survey coordinator and to those persons who will
administer the survey to clients.
• Purpose of the Survey
• Where and How to Administer the Survey
• Presenting the Survey to Your Clients/Participants
• Answering Questions While Clients/Participants Are Completing the Survey
• Survey Coverage
Purpose of the Survey
Clients and participants are in an excellent position to provide feedback on how the program is
working for them. The Perception of Care Survey System is designed to enable your program to:
• Obtain direct client/participant feedback about the program in order to
• Improve the quality and effectiveness of your services and to be able to
• Inform staff, clients, participants, interested persons and the general public how the program
is doing and where it is improving.
Prior to administering the survey to clients or participants, you should be able to explain the
purpose of the survey in your own words to both staff and clients.
Where and How to Administer the Survey
• The environment should offer clients some privacy in completing the survey.
• Before administering the survey, try to answer the survey yourself. Try to identify what
difficulties or questions clients might have in answering the survey. Discuss these with your
program’s survey coordinator.
• If you are using paper forms (as most programs do), it is recommended that the provider and
program number and the calendar year and quarter be typed at the top of the form prior to
administration of the survey. This is especially important if your agency has more than one program.
In this case, you may want to also type a distinguishing name for the program at the top of the form to
further avoid confusion and potentially entering data into the wrong program. (Please do not make
any other marks or changes to the survey.)
• If the client/participant will complete the survey on a computer, please enter the correct
program and calendar quarter, as well as the “Survey Conducted” date, before the client begins.
• When administering the survey, whether by paper form or computer screen, you should have
your own paper copy of the survey so that you can answer questions without looking at the client’s
answers.
• Never look over a client’s shoulder unless explicitly asked to do so by the client.
• For collecting completed paper surveys, you can provide each client/participant an envelope
in which to seal his or her completed survey. Alternately, for a group administration, you

could have clients/participants put their completed surveys in one large envelope that you seal
in front of everyone.
Presenting the Survey to Your Clients/Participants
• All clients/participants should receive the same information regarding the survey.
• Whether using paper forms or a computer, you can read the text in the box at the top of the
survey aloud. This heading explains that the survey is voluntary, confidential and anonymous.
Clients/participants might skip over this important information if you don’t read it to them.
• If you are using paper forms, remind clients/participants not to write their names on the form.
Tell them how you will be collecting the forms to preserve confidentiality (for example, sealing the
forms in an envelope).
• If it is possible that a client/participant has already completed the survey (for instance, in
another group), ask whether the survey was previously completed. The survey should only be
completed once.
• If administering the survey in a group, advise group members: please do not discuss or share
responses before everyone has finished the survey.
• Remember that this survey is voluntary. Clients/participants can stop at any time or chose not
to complete the survey.
• If a client/participant decides to not participate, ask the him or her please to return a blank
paper form or, if using a computer, pass over the questions and click “Cancel” at the end.
• Reinforce the need for honest responses and feedback. No one should feel any pressure to
give the program good scores or ratings. Honest answers will help improve the program.
• After the survey session has been completed, you may have additional questions or topics
that you wish to discuss. As an example:
• o Do you have any thoughts about the survey process?
• o Do you have any feedback regarding the survey questions?
• o Is there something you would like to share that you did not mention in the survey?
• o Are there any issues you would like to discuss at this time?
• If a question is asked about a specific item, the first strategy is to read the item aloud. Very often
this will be sufficient.
• If it is still unclear, provide a simple paraphrase of the item if possible.
• Avoid giving concrete examples to explain the item. (This may narrow the scope of meaning or
otherwise bias the response.)
• You can tell the client/participant that it is okay to skip an item if it does not make sense to
him or her.
Answering Questions While Clients/Participants Are Completing the Survey
Survey Coverage
• Keep track of which clients/participants were provided the opportunity to complete the
survey, regardless of whether they actually completed it.

• Your survey coordinator can compare this to a list of all who should have been given the
opportunity to complete the survey.
• In many programs the survey will typically be administered in group sessions. However, the
program should have a strategy to obtain survey responses from those who missed a particular
survey session. The responses of persons less engaged in the program may be very important for
improving engagement.
• If done in a timely manner, it may be appropriate to contact persons who were missed to
offer them the opportunity to complete the survey.
• Many programs have special groups or tracks for different population groups, for example,
women, adolescents, or criminal justice referrals. It is important that all population groups are
represented. The adequacy of the sample can be partially assessed by comparing tabulations of
demographic items on the survey with corresponding program statistics.
• Programs with very large enrollments or with high volumes of admissions and discharges
may consider some type of random sampling. In theory, this could enable the program to spend
more effort trying to get responses from the more-difficult-to-survey clients or participants.
However, few programs would have a sufficient number to sample from, and further, executing a
valid probability sample is often a difficult task. Therefore, the strategy for most programs will be to
administer the survey to all those eligible to be included. Although it is seldom possible to obtain
survey responses from all eligible clients/participants, it is important to obtain responses from a
very large proportion of those eligible. It is recommended that your programs should try to obtain
responses from 90 percent or more of those eligible in order to assure that your data is
representative of all your clients/participants. Another perspective is that all clients/participants
should have the opportunity to provide their assessment and recommendations for program
improvement. In any case, the targets you set should be challenging, but realistic, so that staff do
not become discouraged in trying to meet the targets.

Suggestions Regarding Data Entry
These suggestions are offered to the program’s survey data manager and staff, especially those who
will be entering data collected on paper forms. Many of these suggestions may be common sense or
common practice. You may use somewhat different procedures than suggested here. The goal is that
you have meaningful data to help improve your program and the care that clients receive.
• Managing Paper Forms
• Preparing to Enter Data
• Entering Data
• Deleting Incorrect Data
• Using Your Judgment
• Confidentiality
• If your program is using paper survey forms, at various points in time you will receive the paper
forms that clients have completed. You may receive multiple surveys in large envelopes and/or single
surveys in individual envelopes, depending on how the forms were collected from clients.
• Your agency may operate more than one program. The program number, as well as the year and
quarter, should be printed at the top of each survey form. When you open the envelopes with completed
surveys, it is important to check for this information and to keep the different program units separate.
You should create separate batches for different programs to avoid having to switch programs in the
middle of data entry.
• It is good practice to put serial numbers on the top of the forms as you initially process them. The
numbers should be unique within a program for a given calendar quarter. This will give you a running
count of the forms you have received and enable you to keep track of which forms have been entered.
• Blank forms? Check with your survey coordinator. A blank form inside an envelope may
mean that a client turned in a blank because he or she did not want to participate in the survey. It is
suggested that you put a serial number on such forms. These forms can be counted for determining
how many clients received survey forms, even if not all clients completed them. However, if the
blank forms are just extras that were never given to clients, then they should not receive serial
numbers and should not be counted. In any case, blank forms should not be entered as data.
Preparing to Enter Data
• Obtain a copy of the paper survey form for your reference. Write your name on it so it won’t
get mixed up with other forms. You can use this form to take notes.
• If a client skipped a question, then you should also skip the question by not clicking a
response. However sometimes we mistakenly click on a response category. This can happen
frequently on the rating scales where a client may leave an item blank if it is “not applicable.” For
most survey items, the data entry screen does not let you uncheck a response except by entering
another response. In this case you should click “Clear Survey” at the bottom of the data entry screen.
This erases all the responses and starts over at the top of the data entry screen. Then re-enter the data.
Managing Paper Forms

• Take your copy of the paper form and pretend that you are a client. Try filling out the form.
This is a great way to become familiar with the form.
• Prior to entering data, you should practice with the data entry screen. However, since there is
no way to change or delete the data for a survey form once it is submitted, you should not practice
data entry using a real calendar quarter. Your provider administrator can set up survey targets for
your program for Calendar 1999. You will then be able to enter practice data using Calendar 1999.
Since the Survey System was not operational until 2013, practice data for 1999 will not be confused
with real data.
• Before you start entering data, it is a good idea to look over the batch of forms you will be
entering to see if there are potential problems. Are all the forms from the same program? Are there
any pages missing? Are some of the forms blank? Look at the write-in questions. Do you need help
interpreting a client’s handwriting? Better to identify potential problems before you begin than to
have to stop in the middle of the batch.
Entering Data
• Once you start entering a particular survey form, you must complete the entire form and
click “Submit Survey” at the end. You cannot stop and later go back and finish it. If you click a
button in the left-margin menu or if you close your Web browser or the browser tab before you
finish entering a survey form, the data for that survey form will not be recorded.
• Once you click “Submit Survey” at the end of the data entry screen (and clicked the
confirmation), you cannot change or delete the data you have entered for the survey form. If the data
you just entered is incorrect, please record the date and time it was entered. Once you have recorded
this information, you can continue with data entry. You must notify your data coordinator or survey
manager. Do not re-enter the data unless asked to do so by either your data coordinator or survey
manager.

• If you need to stop data entry, click on “Cancel” at the bottom of the data entry screen. No
data that you have entered on the screen will be stored in the data base and you will be returned to the
Main Menu. (This also happens if you click on the Main Menu option in the left-margin menu.) Since
the survey is relatively short, there is no option for closing and later continuing data entry for a
survey form. If you are interrupted during data entry, you should consider canceling and later starting
the form over again.
• When you have finished entering a batch of forms, you will be at the top of the data entry
screen, ready to enter another form. To end data entry, simply choose any option from the left-
margin menu, such as, “Log Out.” Alternately, you can go to the Main Menu and click “Data
Collection Monitoring” to check how many forms have been entered.
Using Your Judgment
• The content of the paper form and the computer survey screen are identical. However, when
you enter data on the computer screen, not all responses can be checked. Most questions allow only
one response so, for instance, you cannot check two different age groups on the computer screen.
However, on the paper form some clients may check multiple responses, or cross out responses, or
write notes that hopefully you can read. You may have to use your judgment to key in the response
that the client intended.
• Multiple Choice Questions – If a client has marked more than one response, in most cases,
you will be able to determine what the client’s intention was. But suppose the client checked both
“agree” and “strongly agree” with similar markings so that you cannot distinguish which was
intended. Perhaps the client could not make up his or her mind. Your solution is to literally flip a
coin (after you’ve decided which choice is heads and which is tails). Then you can click your
randomly selected response.
• Multiple Response Questions – The following items allow multiple checks (more than one
response): question 7 (prior treatment) and question 9 (medications).
• Illogical Responses – In order to make the paper form and the data entry screen as identical
as possible, skip logic is not used on the data entry screen. Therefore, for some questions it is
possible for a client to make illogical choices, specifically, by checking both “yes” and “no” on
questions 7 and/or 9. If the client checked one or more “yes” responses, but also checked the “no”
response, do not enter the “no” response.
• Write-in Responses – At the end of the survey, there are 3 write-in questions. Many clients
will leave one or more of these questions blank. The data entry screen does not require anything to be
entered. So if the client left the item blank, you should also leave it blank—no need to type anything.
If you cannot understand all or part of what a client has written, indicate that by making your own
comment in [square brackets].
Confidentiality
• Data records are anonymous. There is no information on the data record about which client
completed the survey form. Staff should not try to guess about which client entered what responses
since this would violate confidentiality. In addition, such guesses are likely to be wrong.
• The open-ended write-in questions are encrypted in the data base so that only the provider
administrator and the program administrator can see these responses. State or local officials cannot
view these comments. Therefore, you can enter exactly what the client wrote.

• Sometimes client will mention clients or program staff, often either praising them or
complaining about them. What you enter into the survey system is encrypted. This information
should be treated confidentially and not discussed informally. Paper forms should be
considered confidential.
• The program should have clear internal reporting procedures to act on when comments made
on survey forms require immediate attention, such as threats of harm or serious misconduct.
• In addition, many programs systematically review comments as soon as possible to identify
opportunities for immediate improvement or problem resolution.

Reports and Data Analysis
Report for Survey Quarter
From the Main Menu, provider administrators and program administrators can click on “Report for
Survey Quarter” to generate the basic report. To generate a report, you must use the drop-down
menus to select the participant type, the specific program and the calendar year/quarter, and then
click on “Generate Report.”
The Survey System will compile the report based on the most current data. Each report includes the
date on which the report was generated. Reports can be generated at any time during or after data
collection. It is important to assure that interim reports do not get confused with reports after data
collection is complete.
The report provides tabulations and graphics for each survey item. The figure below shows only the
tabular part. More examples are available in the section, “Interpreting Reports.”
Non-responses
By default, non-responses are included in the tabulations and graphics. To exclude non-responses,
scroll (if necessary), to the top of the report where it indicates “Include Non-Responses” and click
“No,” then click “Go.” The tabulations and charts will be re-calculated excluding non-responses. For
instance, if 3 of 25 clients did not respond to a particular item, percentages will now be computed
based on only the 22 clients who did respond. The number of respondents will vary from table to
table.
It is recommended that, in the first instance, you review tabulations with non-responses included.
This will enable you to see the proportion of clients who did not respond to each question. You can
then decide how you would like to present the data, with or without non-responses. It is suggested
that the rating scales are typically most informative when non-responses are included.

Printing Your Report
To print a copy of your report, scroll (if necessary), to the top of the report where it indicates
“Export to PDF” and click on it. After a few seconds, the print version of the report will appear in
the same window. You can print this and or save it in PDF format. Use the browser’s back button
to return to the html version and menu system.
Tabulations and Graphics in Word Processor Documents
To copy tabulations into your word processor, from the Web-based (HTML) report, select by
highlighting the table you want and use the edit menu or “right click” menu to copy the table. Then
paste it on a page in your word processor. It should appear in table format which you can then edit
and format.
To copy a graphic, start with the PDF version of the report. Use the select function cursor to select
the graphic and use the edit menu or “right click” menu to copy the graphic. Then paste it onto a
page in your word processor. It should appear as a picture. The picture cannot be edited, but it can
be formatted.

Interpreting Reports
The following are sample tables and graphics from a typical report.


Filtered Report for Survey Quarter
From the Main Menu, provider administrators and program administrators can click on “Filtered
Report for Survey Quarter” to generate the basic report for different sub-populations survey
respondents. You must use the drop-down menus to select the participant type, the specific program
and the calendar year/quarter. After you have selected your filter criteria, click on “Generate
Report” at the bottom of the screen.
Reports can be filtered by: months in the program; age; gender; Hispanic identification; racial
identification; reason for seeking services; and criminal justice mandate. For any of these factors you
must “add” the response categories to include in your analysis. If you do not add any filters, all
survey respondents will be included and the report will be the same as the Report for Survey Quarter.
PoC_User.Guide.Revised_06.20.2013.docx 29 of 33

filter criteria are connected as an “OR” condition while between factors (e.g., age and gender)
you filter criteria are connected by an “AND” condition.

Quarter Comparison Report
PoC_User.Guide.Revised_06.20.2013.docx 31 of 33

Export Data to Spreadsheet
• Once you have completed the administration of the client survey, it is important to review
and analyze the client feedback data and then use a process to act upon that data in a planned way.
Your client survey data is considered baseline data that you can use to routinely assess how you
are doing. If your data indicates that there is room for improvement, you may want to establish
an internal Change Team, inclusive of clients and/or alumni, to implement a small project in
response to the feedback you received from your clients. The small project is conducted by your
Change Team using a PlanDo-Study-Act (PDSA) framework also known as process
improvement. The re-administration of the client survey once a PDSA is completed will provide
you with comparison data to inform you if you are moving in the right direction. The PoC system
can generate reports that will provide you with graphical information about your program’s
performance from one quarter to another or one year to another.
• The University of Wisconsin in Madison has developed significant resources to help
addiction treatment and recovery organizations to implement a model of process improvement.
They maintain a website called NIATx that anyone may use to obtain more information on
building change teams and conducting PDSA cycles. Please go to www.niatx.net and click on
NIATx for Agencies-The Provider Toolkit. There is also a section entitled Process Improvement
Tools-Toolbox which contains information on How to Establish a Change Team; Essential Team
Behaviors; Test Changes: How to Conduct a PDSA Cycle; as well as information on flowcharting
and nominal group technique for developing team consensus on selecting changes to implement.
You may even download a Change Project Form to assist you in recording and tracking the work
of the Change Team.
Using Your Survey Data for Quality Improvement
Client-driven Quality Improvement