performance verification of the … · supply air: 1,200 cmh 300 300 300 vav vav air diffuser air...
TRANSCRIPT

PERFORMANCE VERIFICATION OF THE INTEGRATED OPTICAL AIR DUCT SYSTEM
(AIR-CONDITIONING DUCT PERFORMANCE)
Toshihiko Sudo 1, Ryoichi Kajiya 2, Koji Sakai 2, Tomoyuki Okusa 2
1 Nikken Sekkei Research Institute, Japan 2 School of Science and Technology, Meiji University, Japan
ABSTRACT
The integration of two technologies - the Air-conditioning Duct System and Optical Mirror Duct System - into a new energy-saving system “Integrated Optical Air Duct System” (IOAD) significantly reduces the lighting energy, which accounts for roughly 30% of the energy consumption in large-scale office buildings. The utilization of IOAD in combination with other energy reduction techniques could help these office buildings become Zero Energy Buildings (ZEB). The IOAD System could minimize the effect of natural light loss during light transport inside the air conditioning duct branches and thus allow for the efficient usage of day light. CFD simulations were performed to examine the flow of conditioned air in the duct.
INTRODUCTION There have been rapid development of energy-saving technologies for "Net Zero Energy Building (ZEB)" in Japan in recent years. Since lighting accounts for about 20-30% of the energy consumption of buildings, reduction in lighting energy has become one of the important themes for ZEB. An optical mirror duct (OMD) system allows natural light to flow into a room, resulting in the reduction of the energy used for artificial lighting during the day. The benefits include the possibility to enjoy natural light indoors and increase in building energy efficiency. However, an optical mirror duct system requires installation space in the ceiling, and the height constraints in most urban area office buildings have impeded the widespread installation of these systems.
It is therefore necessary to develop an integrated lighting and air-conditioning duct system that could overcome the installation barriers of such system while maintaining the necessary lighting and air-conditioning performance.
PURPOSE OF THE STUDY The Integrated Optical Air Duct (IOAD) system integrates two existing technologies - the air-conditioning duct (ACD) and the optical mirror duct (OMD) - into a new energy-saving duct system. Figure 1 shows the graphical overview of an IOAD system. Figure 2 shows the ducting layout of a typical office floor. The duct has a cross section of 1000 mm x 500 mm assumed to be installed within a ceiling space. The assumed air flow volume for one office bay is 3,600 CMH (m3/h). The conditioned air is supplied from three main ducts to the office space. A previous study (Sudo et al., 2014) has evaluated the thermal conditions of a IOAD system using a 1/5 scale model, and performed an airflow analysis using Computational Fluid Dynamics (CFD) to determine the duct specifications that could meet the minimum lighting performance of the OMD while maintaining the performance of the ACD. The purpose of this study is to provide technical proposals for the IOAD system by examining the internal thermal measurements of a 1/5 scale model IOAD under air flow condition, as well as performing CFD simulations using the measured values as boundary conditions and validate the accuracy of the measured values.
Daylight collector
Daylight diffuser
Figure 1. IOAD System Diagram
Proceedings of BS2015: 14th Conference of International Building Performance Simulation Association, Hyderabad, India, Dec. 7-9, 2015.
- 2174 -

6,4
00
Window glass
One Office span:120 ㎡
Supply Air:3,600 CMH
Supply Air:1,200 CMH
Supply Air:1,200 CMH
1000×500
1000×500
200φ 200φ 500×350
The Integrated of Optical and Air Duct System
Sup
ply
Air:
1,2
00
CM
H
30
0φ
30
0φ
30
0φ
VAVVAV
Air diffuser
Air diffuser Air diffuser
Air diffuser
Inlet-flowSection
Outlet-flowSection
Day light distributor
Day light distributor
Day light collector
18,750
Figure 2. IOAD Layout Plan
1
370mm 870mm 2370mm1420mm 2970mm
3970mm
3620mm
2 3 4 65
1 2 3 4
1910mm 2540mm 3220mm 3850mm
0 x
:ダクト内番号:アクリル板番号 :アクリル板距離
:ダクト内距離
- Acrylic Plate
- Duct Air Temperature
Number of
Figure 3. Graphical Overview of 1/5 Scale Model IOAD and Measurement Points
: Solar Radiation Temperature of
: Acrylic Plate Surface: Duct Surface: Duct Air: Outside Air
Proceedings of BS2015: 14th Conference of International Building Performance Simulation Association, Hyderabad, India, Dec. 7-9, 2015.
- 2175 -

THERMAL MEASUREMENT EXPERIMENTS To examine the thermal conditions inside the 1/5 scale model IOAD, actual measurements of daylight were taken and used as thermal load. Temperature measurements were made using a multi-point thermometer with 0.01°C resolution and 0.32 mm wire diameter thermocouple. Global solar radiation measurements were made using a pyranometer with wavelength range of 305 - 2800 nm and sensitivity of 14.84x10⁻⁶ V/Wm-2. Figure 3 shows the graphical overview of the 1/5 scale model IOAD. The dimensions of the IOAD model are 200 mm (depth) x 100 mm (height) x 3,970 mm (length). The shape and dimensions of the Daylight Collector (DLC) and the Daylight Distributor (DLD), and the temperature measurement points are shown in Figure 3. The DLC in the model was south-facing. For the air flow inside the IOAD, fresh air was brought in through an air inlet and relieved through an air outlet that is connected to a mechanical fan. The air flow volume was 20 m3/h. The thermal measurements inside the IOAD system were taken while the air flow system was active (air was blowing). Figure 4 through Figure 7 show the measured temperatures at each measurement point collected at 1-minute intervals. The DLC acrylic surface temperatures, greatly affected by sunlight exposure, exceeded 40°C at times under the sunlight. Closer to the DLC than the air outlet, the in-duct air temperatures at point 1 were approximately 40°C, much higher than the in-duct air temperatures at other measurement points (approximately 30°C), and slightly higher than the DLC acrylic plate surface temperatures that were greatly influenced by solar radiation. The in-duct air temperatures at other measurement points were similar to one another (approximately 30°C) and were close to the air temperatures at the air inlet (approximately 28°C).
The DLC acrylic plate at four locations had nearly constant surface temperatures (approximately 30°C). The maximum air temperature difference between the air inlet (approximately 29°C) and air outlet (approximately 31°C) was 2.1°C.
CFD SIMULATION The STAR-CD (ver4.14) software was used to performed CFD simulations. Steady-state analysis was conducted by applying high Re k-ε equation (Lien et al.) in the turbulence model and using the SIMPLE calculation algorithm. Upwind differencing scheme was used for convection problems and central differencing scheme was used for solving other problems. The total number of meshes was 116,684, and the convergence test value was 0.0001. Figure 8 shows a graphical overview of the CFD model. Table 1 shows the shape of the outlet-flow section and inlet-flow section of the integrated duct system. The boundary conditions in the CFD model were defined by using the measured values from the 1/5 scale model as the temperature set-points in the CFD model since it was confirmed by the experiment that the impact of air flow on the thermal conditions at the DLC was insignificant. Figure 9 shows the temperature set point locations in the CFD model and temperature at each location. Table 2 reflects the flow evaluation results of the airflow at the outlet. Figure 10 shows inlet portion and the air flow speed of the vector of the integrated duct system.
a. The air flow Velocity rate into the main duct is a maximum of 10.3 m/s
b. The inlet-flow of the main duct with induction air flow is small
c. Outlet-flow section1, Outlet-flow section2 and Outlet-flow section3 show that the flow equalized after the outlet
Figure 4. Thermal Measurements of 1/5 Scale Model IOAD (Solar Radiation and Outside Air Temperature)
26.0
28.0
30.0
32.0
34.0
36.0
38.0
40.0
42.0
44.0
46.0
48.0
50.0
0
200
400
600
800
1,000
1,200
10:00
10:30
11:00
11:30
12:00
12:30
13:00
13:30
14:00
Outsi
de a
ir te
mpe
ratu
re (℃
)
Solar
Rad
iation
(W/㎡
)
Time
Solar Radiation
Outside air temperature
Solar Radiation
Outside air temperature
Proceedings of BS2015: 14th Conference of International Building Performance Simulation Association, Hyderabad, India, Dec. 7-9, 2015.
- 2176 -

20.0
25.0
30.0
35.0
40.0
45.0
50.0
10:00
10:30
11:00
11:30
12:00
12:30
13:00
13:30
14:00
IOAD
Upp
er s
urfa
ce te
mpe
ratu
re (
℃)
Time
1 2 3 4 5 6
1
23
456
20.0
25.0
30.0
35.0
40.0
45.0
50.0
10:00
10:30
11:00
11:30
12:00
12:30
13:00
13:30
14:00
Acry
lic P
late
sur
face
tem
pera
ture
(℃
)
Time
DLC DLD1 DLD2 DLD3 DLD4
DLC (Day Light Collector )
DLD1 (Day Light Distributor) DLD2
DLD3DLD4
20.0
25.0
30.0
35.0
40.0
45.0
50.0
10:00
10:30
11:00
11:30
12:00
12:30
13:00
13:30
14:00
Duct
air te
mpe
ratu
re (℃
)
Time
1 2 3 4
1
2Outlet-Flow Air temperature3
4Inlet-Flow Air temperature
Figure 5. Thermal Measurements of 1/5 Scale Model IOAD (Acrylic Plate Surface Temperature)
Figure 6. Thermal Measurements of 1/5 Scale Model IOAD (In-Duct Air Temperature)
Figure 7. Thermal Measurement of 1/5 Scale Model IOAD (IOAD Upper Surface Temperature)
Proceedings of BS2015: 14th Conference of International Building Performance Simulation Association, Hyderabad, India, Dec. 7-9, 2015.
- 2177 -
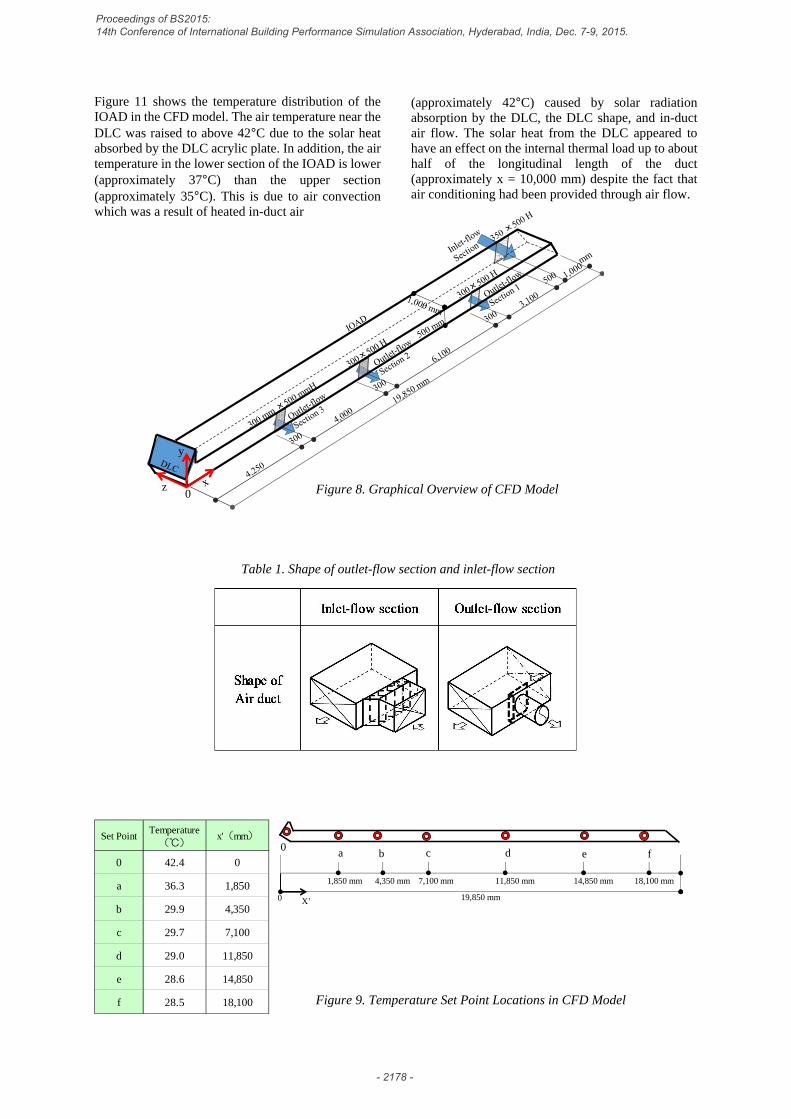
Figure 11 shows the temperature distribution of the IOAD in the CFD model. The air temperature near the DLC was raised to above 42°C due to the solar heat absorbed by the DLC acrylic plate. In addition, the air temperature in the lower section of the IOAD is lower (approximately 37°C) than the upper section (approximately 35°C). This is due to air convection which was a result of heated in-duct air
(approximately 42°C) caused by solar radiation absorption by the DLC, the DLC shape, and in-duct air flow. The solar heat from the DLC appeared to have an effect on the internal thermal load up to about half of the longitudinal length of the duct (approximately x = 10,000 mm) despite the fact that air conditioning had been provided through air flow.
Figure 8. Graphical Overview of CFD Model
Figure 9. Temperature Set Point Locations in CFD Model
a b c d e f
1,850 mm 4,350 mm 11,850 mm7,100 mm 14,850 mm
19,850 mm
18,100 mm
0 X’
0Set Point
Temperature(℃)
x'(mm)
0 42.4 0
a 36.3 1,850
b 29.9 4,350
c 29.7 7,100
d 29.0 11,850
e 28.6 14,850
f 28.5 18,100
Table 1. Shape of outlet-flow section and inlet-flow section
y
z0
Proceedings of BS2015: 14th Conference of International Building Performance Simulation Association, Hyderabad, India, Dec. 7-9, 2015.
- 2178 -

Supply air volume
(CMH)
Outlet air volume 1,198
(CMH) ( 1.00 )
1,218
( 1.02 )
1,184
( 0.99 )
* CMH (m3/h):
Cubic Meter per Hour
The deviation from the 1,200 CMH designvalue in ( )
Inlet-flowsection
3,600
Outlet-flowsection 1
Outlet-flowsection 2
Outlet-flowsection 3
Outlet-flow Section 1
Outlet-flow Section 2
Outlet-flow Section 3
Inlet-flow Section
Table 2. Outlet Section Air flow
Figure 10. Airflow Velocity Vector Diagram and Diagram of the Inlet-flow Section and Outlet-flow Section
Proceedings of BS2015: 14th Conference of International Building Performance Simulation Association, Hyderabad, India, Dec. 7-9, 2015.
- 2179 -

DISCUSSION With the inlet-flow, the integrated duct system of a maximum airflow velocity after the inlet-flow of 10.3 m/s. On comparing the inlet-flow in Figure 7 and Figure 9 showed induction airflow of noise and the increase of pressure loss were restrained. The outlet-flow of the outlet-flow section reached average with no drift angle. On Table 2 the quantity of air flow distribution after the outlet-flow section was 0.99 to 1.02 the amount expected. Although the overall thermal effect could vary by the thermal characteristics of the DLC acrylic plate, it is concluded that thermal insulations are required in the DLC and the duct body since the DLC components have shown to have a significant effect on solar heat absorption.
CONCLUSION The results of the evaluation of the simulation of airflow in the technical elements of the ACD and the IOAD, showed the IOAD has the performance of a conventional duct system while maintaining the function of the OMD, as well, it was found that the ACD can be used. The IOAD combines the two technologies and functions of the ACD and the OMD making the flow of conditioned air smooth as well as minimize the attenuation of natural light from the air
conditioning branch. The thermal conditions inside an IOAD system were examined through measurements of actual daylight and a 1/5 scale model of the IOAD. A CFD analysis was performed to examine the in-duct air temperatures during the experiment by analyzing the actual measurement values. The results showed that, in order to reduce the thermal load of the conditioned air inside the IOAD system, thermal insulations would be required for the DLC and the duct body. Therefore, further study is necessary for examining the thermal conditions of an IOAD system based on shapes of duct with thermal insulation. Furthermore, it is necessary to examine the thermal conditions inside and outside of an IOAD system under no air flow and with air flow conditions, as well as the indoor thermal conditions by measurements using a full scale model.
ACKNOWLEDGEMENTS This study was made possible with enormous cooperation from Toyo Kohan Co., Ltd. In addition, the authors wish to express their appreciation to Mr. Kimura Y. and Mr. Okamura K. (School of Science and Technology, Meiji University) for their efforts in performing measurements in the experiment and the CFD analysis.
28.35 35.35 42.35[℃]
28.35 35.35 42.35
[℃]
Figure 11. CFD Simulation of In-Duct Air Temperature Distribution
x-y Section (z = 500mm)
x-z Section (y = 0mm)
Proceedings of BS2015: 14th Conference of International Building Performance Simulation Association, Hyderabad, India, Dec. 7-9, 2015.
- 2180 -
REFERENCES 1) Toshihiko Sudo, Ryoichi Kajiya, Tomoyuki Okusa
(2014) Performance verification of The Integrated Optical Air Duct System: Air-conditioning duct performance, Summaries of technical papers of Annual Meeting Architectural Institute of Japan, Sep. 2014, pp. 1019-1020
2) Tomoyuki Okusa, Toshihiko Sudo, Ryoichi Kajiya, (2014) Performance verification of The Integrated Optical Air Duct System: Air-conditioning duct performance, Summaries of technical papers of Annual Meeting The Society of Heating, Air-Conditioning and Sanitary Engineers of Japan 2014, pp. 209-212
3) Kouichi Kaihou (2004) 41332 Field Survey on
Visual Comfort in an Office with Mirror Duct System (Part1): Outline of Mirror Duct System, Summaries of technical papers of Annual Meeting Architectural Institute of Japan, July 2004, pp. 691-692
4) Kouichi Kaihou (2004) Daylighting Using Mirror Duct System (<Special Issue>Daylighting at Present), Journal of the Illuminating Engineering Institute of Japan 88(10), October 2004, pp. 788-792
Proceedings of BS2015: 14th Conference of International Building Performance Simulation Association, Hyderabad, India, Dec. 7-9, 2015.
- 2181 -