pertcpm projectmanagement siddanna m balapgol
TRANSCRIPT

PROJECT MANAGEMENTCPM & PERT TECHNIQUES

FLOW OF PRESENTATION
INTRODUCTION
NETWORK PLANNING
ESTIMATING TIME
CPM
PERT

Project Management
Project
• A project is an interrelated set of activities that has a definite starting and ending point and that results in a unique product or service.
Project management
• Project management is a scientific way of planning, implementing, monitoring & controlling the various aspects of a project such as time, money, materials, manpower & other resources.

Network Planning Methods
Methods used for network planning are:
CPM
PERT
Managing a project with network planning methods involves four steps:
1. Describing the Project.
2. Diagramming the Network.
3. Estimating time of completion.
4. Monitoring Project Progress.

Network Diagram
Concepts
• Activity
• Precedence relationship
• Successor
• Event

Guidelines for network diagram
1. Before an activity can begin, its preceding activities must be completed.
2. Arrows indicate logical precedence.
3. Flow of the diagram is from left to right.
4. Arrows should not intersect.
5. Dangling should be avoided.

APPRAOCHES FORNETWORK DIAGRAM
ACTIVITY ON ARC(AOA):
• Uses arcs to represent activities and nodes to represent events.
• It is Event Oriented.
1 876
54
3
2

DUMMY ACTIVITY
AOA approach requires the addition of a Dummy Activity to clarify the precedence relationships between the two activities. It is a zero time activity and consumes no resources.
Dummy Activity is used in two situations:
1) When two or more activities start and end at the same nodes
1 3
2
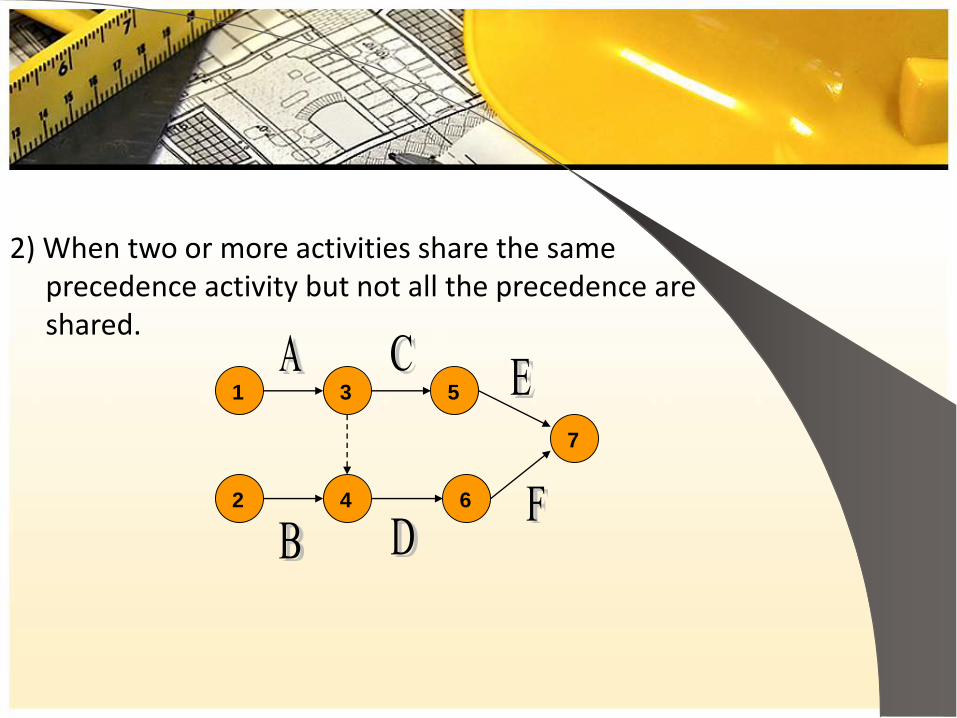
2) When two or more activities share the same precedence activity but not all the precedence are shared.
1 53
6
7
2 4

Uses nodes to represent activities and arcs indicate precedence relationships between them.
It is Activity Oriented.
ACTIVITY ON NODE(AON):

ESTIMATING TIME OF
COMPLETION
Planning the schedule of the project
Time estimates include:
1) Total time for completion.
2) ES- Earliest start time: the earliest time at which the activity can start given that its precedent activities must be completed first.
3) EF-Earliest finish time: equals to the earliest start time for the activity plus the time required to complete the activity.
4) LF- Latest finish time: the latest time in which the activity can be completed without delaying the project.
5) LS- Latest start time: equal to the latest finish time minus the time required to complete the activity.

6) FORWARD PASS:
The early start and early finish times are calculated by moving forward through the network and considering the predecessor activities Considers maximum
7) BACKWARD PASS:The latest start and finish times are calculated by moving backward through the network.Considers minimum
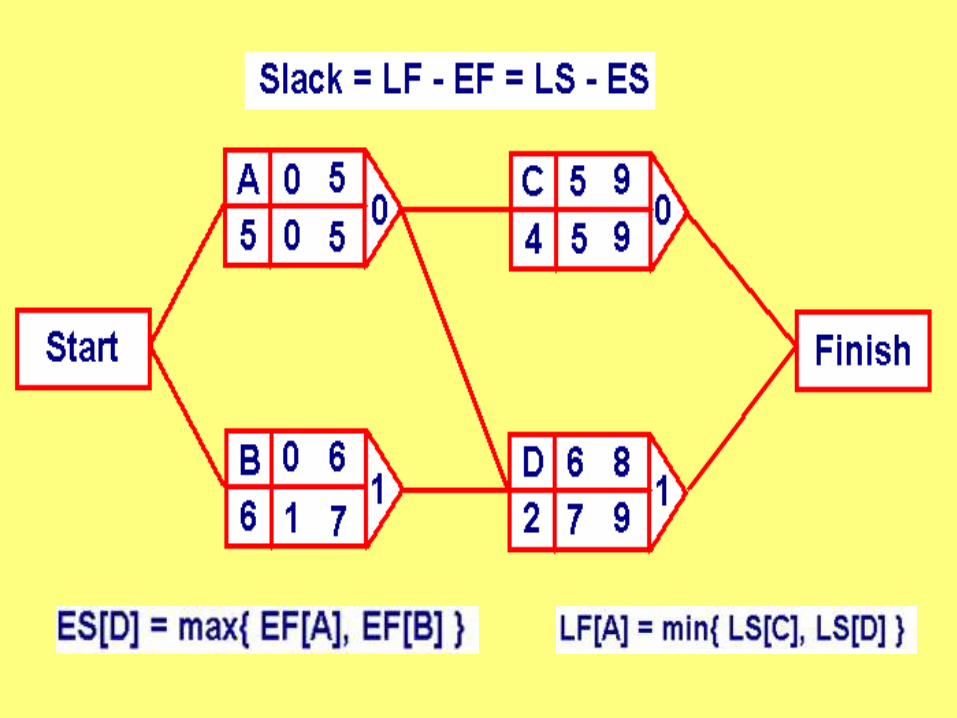
8) SLACK TIME:Slack time for an activity is the difference between its earliest and latest start time or between the earliest and latest finish time.Critical path is the path of activities having zero Slack time.

A Simple Project
Activity ImmediatePredecessor
ExpectedTime
A - 5
B - 6
C A 4
D A, B 2

Precedence Diagram

ES Earliest Starting (time)
EF Earliest Finishing
LS Latest Starting
LF Latest Finishing
Slack Difference Time
CRITICAL PATH METHODS(CPM)
HISTORY :
It was developed by J.E.KELLY of REMINGTON-RAND
and M.R.WALKER of DU PONT and the emphasis was on the trade-off between the cost of project and its overall completion time. The first test was made in 1958,when CPM was applied to the construction of a new chemical plant.
DEFINITION:
Critical path is the sequence of activities between a project’s start and finish that takes the longest time to complete.

STEPS IN DETERMINING CRITICAL PATH
• Specify the individual activities.
• Determine the sequence of the activities.
• Draw the network diagram.
• Estimate the activity completion time.
• Identify the critical path.
• Update the CPM diagram.

Activit
y
Preceden
ce
Normal time (week)
Normal
Cost (Rs)
A - 3 300
B A 3 30
C A 7 420
D A 9 720
E D 5 250
F B,C,E 6 320
G F 4 400
H F 13 780
I G 10 1000
Total 4220

1
8
7
6
3
5
4
2

Overhead cost as per the given data- Rs.50
Paths in the network diagram :
A-D-F-G-I = 32
A-D-F-H = 31
A-C-F-H = 29
A-C-F-G-I = 30
A-B-E-F-H = 30
A-B-E-F-G-I = 31

Critical path – A-D-F-G-I = 32
1
8
7
6
3
5
4
2

TIME ESTIMATES
o Optimistic time (to) – It is the shortest time in which the activity can be completed.
o Most likely time (tm) – It is the probable time required to perform the activity.
o Pessimistic time (tp) – It is the longest estimated time required to perform an activity.
o Expected time
te = to + 4tm + tp
6

STEPS IN PERT
1. Identify the specific activities.
2. Determine proper sequence of the activities.
3. Construct the network diagram.
4. Estimate the time required for each activity.
5. Determine the critical path.
6. Update the PERT chart.

Activity Descrip
tion
Preced
ence
Optimis
tic time
Most
Likely
time
Pessimi
stic
time
Expecte
d time
A Initial
design- 12 16 26 17
B Survey
marketA 6 9 18 10
C Build
prototypeA 8 10 18 11
D Test
prototypeC 2 3 4 3
E Redesign
ing B,D 3 4 11 5
F Market
testingE 6 8 10 8
G Set up
productio
n
F 15 20 25 20

1 7652
3
4
A-B-E-F-G = 60
A-C-D-E-F-G = 64 (CRITICAL PATH)

Advantages of PERT
• Expected project completion time.
• Probability of completion before a specified date.
• The critical path activities that directly impact the completion time.
• The activities that have slack time and that can lend resources to critical path activities.
• Activity start and end dates.

LIMITATIONS
• The PERT Formula Requires Too Much Work.
• The network charts tend to be large and unwieldy.
• Calculating the time estimates is very complex for all the activities.
• Updating of the project is time consuming and requires high costs.
• Emphasis is laid only on time factors and cost factors are neglected.

Difference between CPM & PERT
CPM PERT
• CPM works with fixed deterministic time
• PERT works with probabilistic time
• CPM is useful for repetitive and non complex projects with a certain degree of time estimates.
• PERT is useful for non repetitive and complex projects with uncertain time estimates.
• CPM includes time-cost trade off. • PERT is restricted to time variable.
• CPM- for construction projects. • PERT- used for R&D programs.

Thank You…