phd defence: how to measure remotely the wind using nacelle … · phd defence: how to measure...
TRANSCRIPT

General rights Copyright and moral rights for the publications made accessible in the public portal are retained by the authors and/or other copyright owners and it is a condition of accessing publications that users recognise and abide by the legal requirements associated with these rights.
Users may download and print one copy of any publication from the public portal for the purpose of private study or research.
You may not further distribute the material or use it for any profit-making activity or commercial gain
You may freely distribute the URL identifying the publication in the public portal If you believe that this document breaches copyright please contact us providing details, and we will remove access to the work immediately and investigate your claim.
Downloaded from orbit.dtu.dk on: Jun 18, 2020
PhD defence: How to measure remotely the wind using nacelle lidars for powerperformance testing
Borraccino, Antoine
Publication date:2017
Document VersionPeer reviewed version
Link back to DTU Orbit
Citation (APA):Borraccino, A. (Author). (2017). PhD defence: How to measure remotely the wind using nacelle lidars for powerperformance testing. Sound/Visual production (digital)http://orbit.dtu.dk/admin/files/136859224/2017_08_30_Antoine_Borraccino_PhD_defence_SlideShow.mp4

DTU Wind Energy, Technical University of Denmark
How to measure remotely the wind using nacelle lidars for power performance testingA. BorraccinoPh.D. defence, 30th August 2017
Supervisors: Michael Courtney, Rozenn WagnerProject: UniTTe

DTU Wind Energy, Technical University of Denmark
Outline
2
1 •Introduction
2 •Calibration of wind lidars
3 •Wind field reconstruction
4 •Power performance testing

DTU Wind Energy, Technical University of Denmark
Outline
3
1 •Introduction
2 •Calibration of wind lidars
3 •Wind field reconstruction
4 •Power performance testing
DTU Wind Energy, Technical University of Denmark
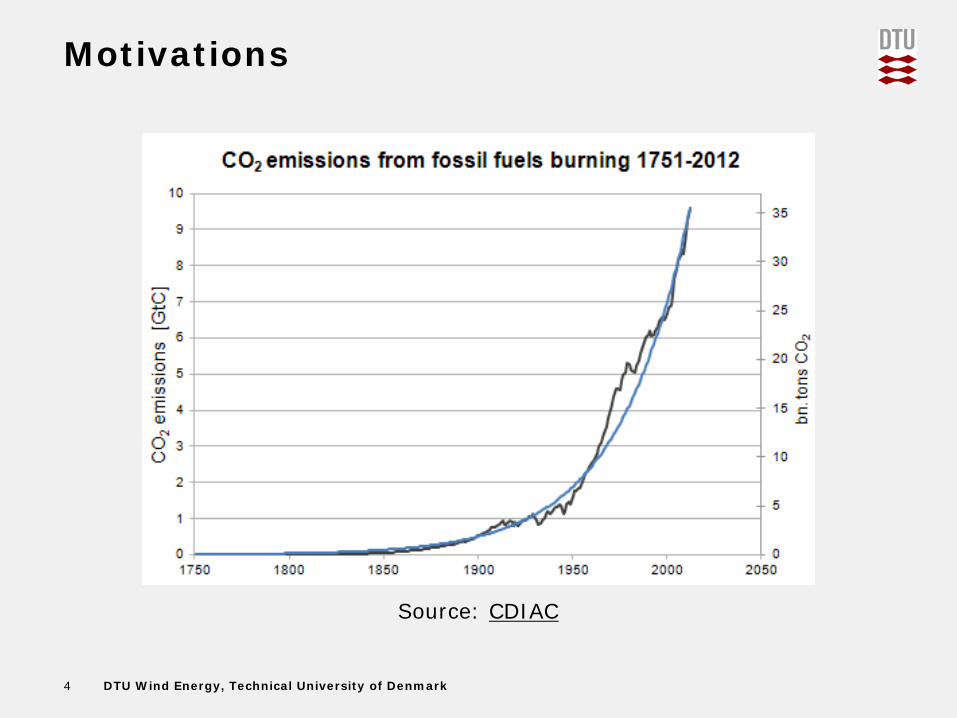
Motivations
4
Source: CDIAC

DTU Wind Energy, Technical University of Denmark
Motivations
5

DTU Wind Energy, Technical University of Denmark
Motivations
• The wind industry is a business strives for making money no such big machines and
large scale wind farm without a profitable business
6

DTU Wind Energy, Technical University of Denmark
How wind industry ensures it makes money
Wind resource
Power curve of wind turbines
Annual energy
production
7
Power curve of wind turbines
Is very uncertainGuaranteed by manufacturer
Contractual agreements+ international standards
Basis for bankablewind projects
(GWh/year)

DTU Wind Energy, Technical University of Denmark
Power performance testing
8
• GOAL 1: relate turbine power to energy available in the wind
This needs measurements of:–Turbine power–(free stream) Wind speed
“the wind speed at the turbine position as if the wind turbine was not there”
• GOAL 2: assess power curve uncertainties–how far from the true power curve (unmeasurable) is the
measured one
“the wind turbine will produce that much energy at this wind speed, and we’re sure with a probability of XX %”

DTU Wind Energy, Technical University of Denmark
Power performance testingThe old way
9
meteorology mast far enough away (2-4 diameters)+ cup anemometers

DTU Wind Energy, Technical University of Denmark
Power performance testingThe modern ways (1/2)
10
Remote sensing instruments –
new IEC standard (2017): use of ground-based wind lidars (profilers) allowed
WindCube (by Leosphere)ZephIR 300 (by ZephirLidar)

DTU Wind Energy, Technical University of Denmark
Power performance testingThe modern ways (2/2)
11
Remote sensing instruments –
Future/Now: use of nacelle-based wind lidars
ZephIR Dual Mode(scanning)
by ZephirLidar
Wind Iris(4-beam)
by AventLidar
Wind Eye(4-beam)
by Windar Photonics
Diabrezza(9-beam)
by Mitsubishi Electric

DTU Wind Energy, Technical University of Denmark
Why nacelle lidars for power performance testing
12
For modern multi-megawatt turbines:
Cost-efficiency
met. mast
ground-basedlidars
nacelle-basedlidars
especially offshore!
especially in complex terrain!
Representativity of wind measurements
met. mast
ground-basedlidars
nacelle-basedlidars

DTU Wind Energy, Technical University of Denmark
Lidar
13
• LIght Detection And Ranging: “a radar using light”• Remotely measuring: from some meters to >10 km away
• Principles of coherent Doppler wind lidars
Credit: N. Vasiljevic

DTU Wind Energy, Technical University of Denmark
Lidar
14
• LIght Detection And Ranging: “a radar using light”• Remotely measuring: from some meters to >10 km away
• Principles of coherent Doppler wind lidars
Credit: N. Angelou

DTU Wind Energy, Technical University of Denmark
Lidar
15
• LIght Detection And Ranging: “a radar using light”• Remotely measuring: from some meters to >10 km away
• Principles of coherent Doppler wind lidars
5B-demo
ZDM
V_los

DTU Wind Energy, Technical University of Denmark
Lidar
16
• LIght Detection And Ranging: “a radar using light”• Remotely measuring: from some meters to >10 km away
• Principles of coherent Doppler wind lidars
5B-demo
ZDM

DTU Wind Energy, Technical University of Denmark
Research questions
17
1) What are the uncertainties inherent to the measurements performed using a nacelle-mounted lidar? Calibration procedures requiredsee article in Remote Sensing journal:
“Generic Methodology for Field Calibration of Nacelle-Based” (2016)A. Borraccino, M. Courtney, R. Wagner
2) How can nacelle-mounted lidars provide free-field wind characteristics for power curve measurement? New wind field reconstruction methodologiessee article in Wind Energy Science journal:
“Wind field reconstruction from nacelle-mounted lidar short-range measurements” (2017), A. Borraccino, D. Schlipf, F. Haizmann, R. Wagner
Application to power performance testing

DTU Wind Energy, Technical University of Denmark
Outline
18
1 •Introduction
2 •Calibration of wind lidars
3 •Wind field reconstruction
4 •Power performance testing

DTU Wind Energy, Technical University of Denmark
Calibration of measuring systems
19
• Metrology (= science of measurements)
international standards: JCGM (BIPM, IEC, ISO, etc)• VIM: international vocabulary of metrology• GUM: guide to uncertainty in measurements
• Calibration =operation providing as an end-result
• a relation between measured values and reference ones(mathematical model, curve, table, etc)
• associated measurement uncertainties• a correction of the indicated quantity value
• Why?
“measurement values are meaningless without their associated uncertainty. The true value is unknowable”
Traceability to SI Uncertainty quantification

DTU Wind Energy, Technical University of Denmark
Calibration of wind lidars: white vs. black-box methodology (1/2)
20
• Black-box–Direct comparison of reconstructed wind parameters
PROS: simple, limited knowledge requiredCONS: lidar-specific, practical setup unrealistic, and …
It simply does not work for nacelle lidars!

DTU Wind Energy, Technical University of Denmark
Calibration of wind lidars: white vs. black-box methodology (1/2)
21
• White-box–calibration of all the inputs of the Wind Field ReconstructionPROS Low sensititivity to WFR assumptions Genericity Uncertainties on any wind characteristics (WFC)
CONS Longer process Need expert knowledge

DTU Wind Energy, Technical University of Denmark
Generic calibration methodology
22
• Based on the original procedures for 2-beam nacelle lidarsCourtney M.: “Calibrating nacelle lidars”, [2013], DTU Wind Energy E-0020(EN)
• Further developed and tested with two different nacelle lidar systems
• Published in journal article + 2 detailed calibration reports
ZephIR Dual Mode (ZDM)continuous wave, conically scanning
Avent 5-beam Demonstrator (5B-Demo): pulsed, step-staring

DTU Wind Energy, Technical University of Denmark
Generic calibration methodology1) beam positioning quantities
23
• Step 1: calibration of beam positioning quantities–inclinometers (tilt, roll)– lidar geometry: cone or opening angles
Procedures are lidar-specificWe used hard target methods to detect beam position

DTU Wind Energy, Technical University of Denmark
Generic calibration methodology2) calibration of LOS velocity
D=262m
ZDM 5B-demo
24
• Measurement setup, in Høvsøre (DK)

DTU Wind Energy, Technical University of Denmark
Generic calibration methodology2) calibration of LOS velocity
25
• Measurement setup, in Høvsøre (DK) - zoom
260m
ZDM
5B-demo

DTU Wind Energy, Technical University of Denmark26
• Main data– Cup: horizontal wind speed 𝐕𝐕𝐡𝐡𝐡𝐡𝐡𝐡– Sonic: wind direction 𝜽𝜽– Lidar: LOS velocity 𝐕𝐕𝐥𝐥𝐡𝐡𝐥𝐥 ; tilt angle 𝝋𝝋
• LOS direction evaluation– fit of wind direction response (part 1)– Residual sum of squares process (part 2)
• Comparison between– Lidar-measured LOS velocity 𝐕𝐕𝐥𝐥𝐡𝐡𝐥𝐥– Reference quantity: pseudo-LOS velocity 𝐕𝐕𝐡𝐡𝐫𝐫𝐫𝐫
derived from calibrated ref. instruments
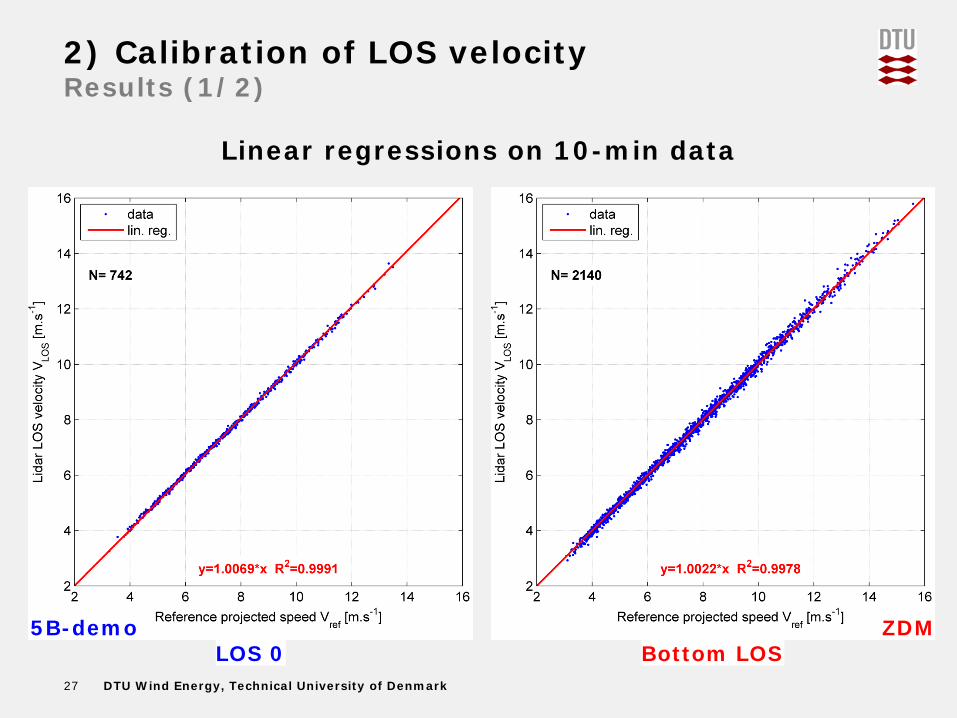
2) Calibration of LOS velocityMethod and data analysis
Reference quantity
𝐕𝐕𝐡𝐡𝐫𝐫𝐫𝐫 = 𝐕𝐕𝐡𝐡𝐡𝐡𝐡𝐡 𝐜𝐜𝐡𝐡𝐥𝐥𝝋𝝋 𝐜𝐜𝐡𝐡𝐥𝐥 𝜽𝜽 − 𝑳𝑳𝑳𝑳𝑺𝑺𝒅𝒅𝒅𝒅𝒅𝒅
DTU Wind Energy, Technical University of Denmark27
Linear regressions on 10-min data
2) Calibration of LOS velocityResults (1/2)
LOS 0 Bottom LOS5B-demo ZDM

DTU Wind Energy, Technical University of Denmark28
Linear regressions on binned data
the calibration relation is obtained!
5B-demo ZDMLOS 0 Bottom LOS
2) Calibration of LOS velocityResults (2/2)

DTU Wind Energy, Technical University of Denmark29
Uncertainty of LOS velocityMethod
• GUM methodology: – based on law of propagation of uncertainties– analytical method
• Measurement model
• ”Tree of uncertainties”: GUM method applied to the Vlos calibration
𝑎𝑎 ⋅ Vref = 𝒚𝒚 = 𝒂𝒂 ⋅ 𝐕𝐕𝐡𝐡𝐡𝐡𝐡𝐡 ⋅ 𝒄𝒄𝒄𝒄𝒄𝒄𝝋𝝋 ⋅ 𝒄𝒄𝒄𝒄𝒄𝒄 𝜽𝜽 − 𝑳𝑳𝑳𝑳𝑺𝑺𝒅𝒅𝒅𝒅𝒅𝒅𝜽𝜽𝒅𝒅
𝒖𝒖𝒂𝒂
𝒖𝒖𝒄𝒄,𝒚𝒚
𝒖𝒖𝝋𝝋
𝒖𝒖𝜽𝜽
𝒖𝒖𝒄𝒄,𝜽𝜽𝒅𝒅
𝒖𝒖𝜽𝜽𝒍𝒍𝒄𝒄𝒄𝒄
𝒖𝒖𝒄𝒄,𝑽𝑽𝒅𝒅𝒓𝒓𝒓𝒓
gain of calibration relation
𝒖𝒖𝒄𝒄,𝑽𝑽𝒉𝒉𝒄𝒄𝒅𝒅
𝒖𝒖𝒄𝒄𝒂𝒂𝒍𝒍 𝒖𝒖𝒄𝒄𝒐𝒐𝒓𝒓 𝒖𝒖𝒎𝒎𝒂𝒂𝒄𝒄𝒎𝒎 𝒖𝒖𝒐𝒐𝒄𝒄𝒄𝒄 𝒖𝒖𝒅𝒅𝒊𝒊𝒄𝒄
wind speed
beam tilt angle
wind direction

DTU Wind Energy, Technical University of Denmark30
Uncertainty of LOS velocityResults
• Expanded uncertainties (k=2) vs. 𝑽𝑽𝒍𝒍𝒄𝒄𝒄𝒄: in m/s and in %𝑈𝑈𝑒𝑒𝑒𝑒𝑒𝑒 increases linearly (m/s)
∼ 3% at 4m/s∼ 2% at 10 m/s
5B-demo ZDMLOS 0 Bottom LOS
almost same as cup anemometer

DTU Wind Energy, Technical University of Denmark31
𝒖𝒖𝒂𝒂
𝒖𝒖𝒄𝒄,𝒚𝒚
𝒖𝒖𝝋𝝋
𝒖𝒖𝜽𝜽
𝒖𝒖𝒄𝒄,𝜽𝜽𝒅𝒅
𝒖𝒖𝜽𝜽𝒍𝒍𝒄𝒄𝒄𝒄
𝒖𝒖𝒄𝒄,𝑽𝑽𝒅𝒅𝒓𝒓𝒓𝒓
𝒖𝒖𝒄𝒄,𝑽𝑽𝒉𝒉𝒄𝒄𝒅𝒅
𝒖𝒖𝒄𝒄𝒂𝒂𝒍𝒍 𝒖𝒖𝒄𝒄𝒐𝒐𝒓𝒓 𝒖𝒖𝒎𝒎𝒂𝒂𝒄𝒄𝒎𝒎 𝒖𝒖𝒐𝒐𝒄𝒄𝒄𝒄 𝒖𝒖𝒅𝒅𝒊𝒊𝒄𝒄
~0%8% 92%
6% 94%40% 30% 24% 5% 1%
99%1%
Uncertainty of LOS velocityPrevailing sources
• Conclusions: the lidar 𝐕𝐕𝐥𝐥𝐡𝐡𝐥𝐥 uncertainty is almost entirely inherited from the cup need to improve uncertainty assessment of cup anemometersOR need for new reference sensors
𝑎𝑎 ⋅ Vref = 𝒚𝒚 = 𝒂𝒂 ⋅ 𝐕𝐕𝐡𝐡𝐡𝐡𝐡𝐡 ⋅ 𝒄𝒄𝒄𝒄𝒄𝒄𝝋𝝋 ⋅ 𝒄𝒄𝒄𝒄𝒄𝒄 𝜽𝜽 − 𝑳𝑳𝑳𝑳𝑺𝑺𝒅𝒅𝒅𝒅𝒅𝒅𝜽𝜽𝒅𝒅

DTU Wind Energy, Technical University of Denmark
Outline
32
1 •Introduction
2 •Calibration of wind lidars
3 •Wind field reconstruction
4 •Power performance testing

DTU Wind Energy, Technical University of Denmark
Wind Field Reconstruction …
33
• Combines LOS velocities measured in multiple locations
–Needed to retrieve useful info: wind speed, direction, shear, …–Assumptions on the flow field must me made
• Simplest example two-beam nacelle lidar horizontal homogeneity hyp. analytical solution for wind
speed and relative direction
• Not a good enough methodfor profiling nacelle lidars

DTU Wind Energy, Technical University of Denmark
And… searching for free stream wind speed
34
𝑽𝑽∞ ??𝑽𝑽𝟐𝟐.𝟓𝟓𝟓𝟓
Modern turbines: 2.5D ~ 200-400m
• Decorrelation WSpeed / power• Hub height speed insufficient?
• 2.5D not really free wind …

DTU Wind Energy, Technical University of Denmark
Does this make it any easier?
35
Flow disturbed by turbine wakes !
Perdigão.credit: N. Vasiljevic
(very)complexterrain

DTU Wind Energy, Technical University of Denmark
• Method is (not new…)Schlipf D., Rettenmeier A., Haizmann F., Hofsäß M., Courtney M. and Cheng, P. W.:“Model Based Wind Vector Field Reconstruction from Lidar Data”, DEWEK, 2012.
• need new “wind models” for profiling nacelle lidars, suitable for power performance testing
Model-fitting Wind Field Reconstruction
36
DTU Wind Energy, Technical University of Denmark
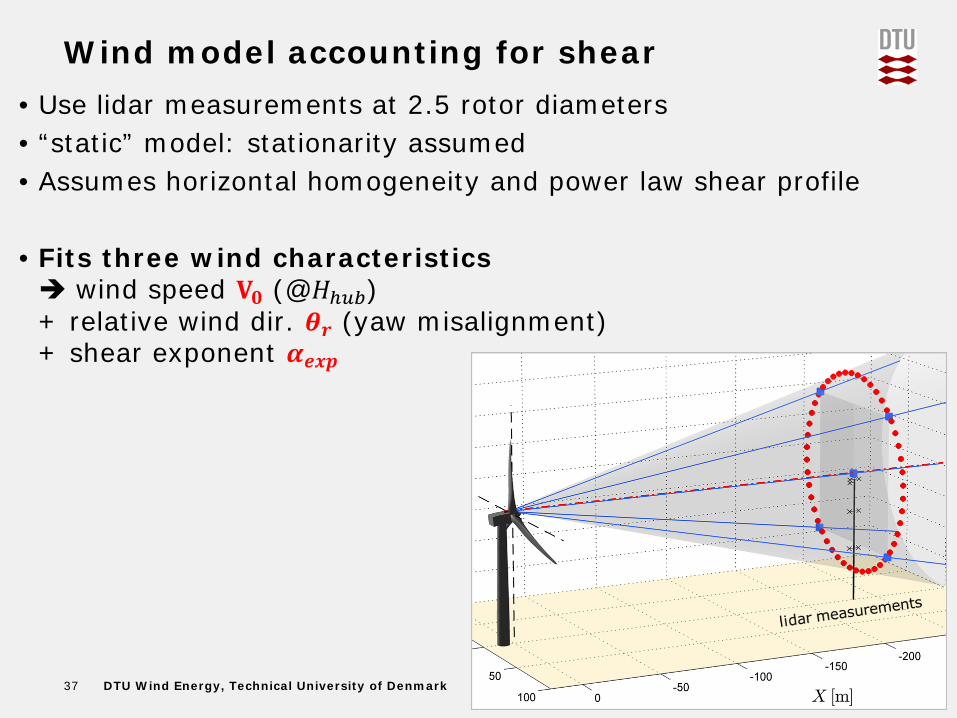
Wind model accounting for shear
37
• Use lidar measurements at 2.5 rotor diameters• “static” model: stationarity assumed• Assumes horizontal homogeneity and power law shear profile
• Fits three wind characteristics wind speed 𝐕𝐕𝟎𝟎 (@𝐻𝐻ℎ𝑢𝑢𝑢𝑢)+ relative wind dir. 𝜽𝜽𝒅𝒅 (yaw misalignment)+ shear exponent 𝜶𝜶𝒓𝒓𝒆𝒆𝒐𝒐

DTU Wind Energy, Technical University of Denmark
Combined wind-induction model
38
• Use lidar measurements at multiple distances close to rotor• Additionally assumes simple induction model:(from actuator disk and vortex sheet theory)
𝑈𝑈 𝑥𝑥𝑈𝑈∞
= 1 − 𝑎𝑎𝑖𝑖𝑖𝑖𝑖𝑖 1 +𝜉𝜉
1 + 𝜉𝜉2
• Fits four wind characteristics Free stream wind speed 𝐕𝐕∞ (@𝐻𝐻ℎ𝑢𝑢𝑢𝑢) + relative wind dir. 𝜽𝜽𝒅𝒅+ shear exponent 𝜶𝜶𝒓𝒓𝒆𝒆𝒐𝒐+ induction factor 𝒂𝒂𝒅𝒅𝒊𝒊𝒅𝒅

DTU Wind Energy, Technical University of Denmark
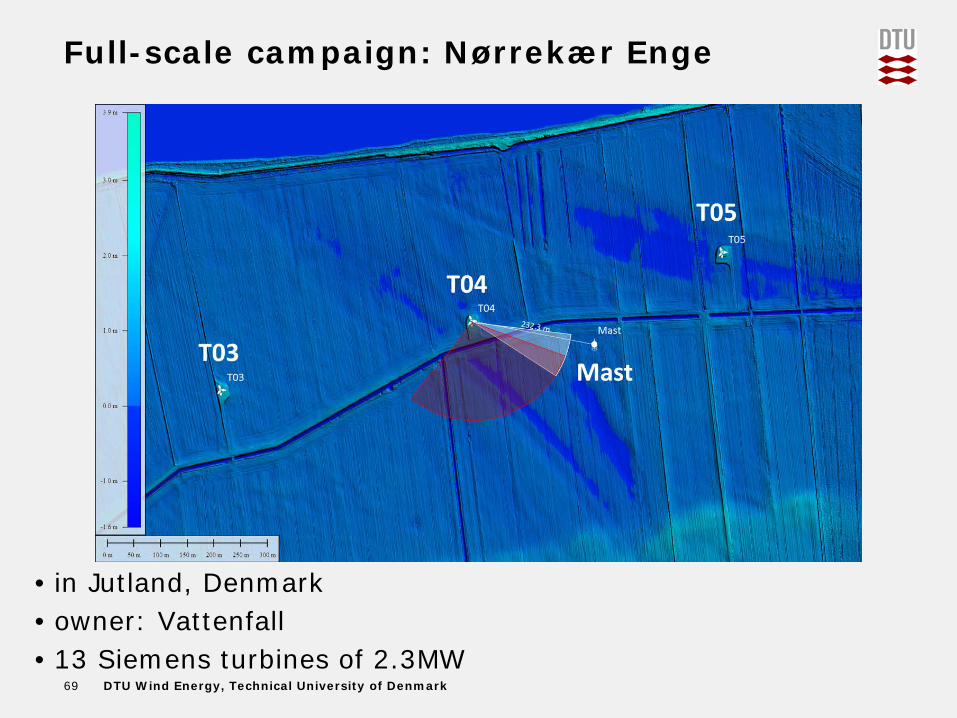
Full-scale campaign: Nørrekær Enge
• in Jutland, Denmark• owner: Vattenfall• 13 Siemens turbines of 2.3MW
39

DTU Wind Energy, Technical University of Denmark
Nørrekær Engenacelle lidars measurement trajectories
• Considered lines-of-sight:–5B-Demo: all 5 LOS–ZDM: 6 LOS / azimuth sectors, ie. 3 pairs (in green)
40

DTU Wind Energy, Technical University of Denmark
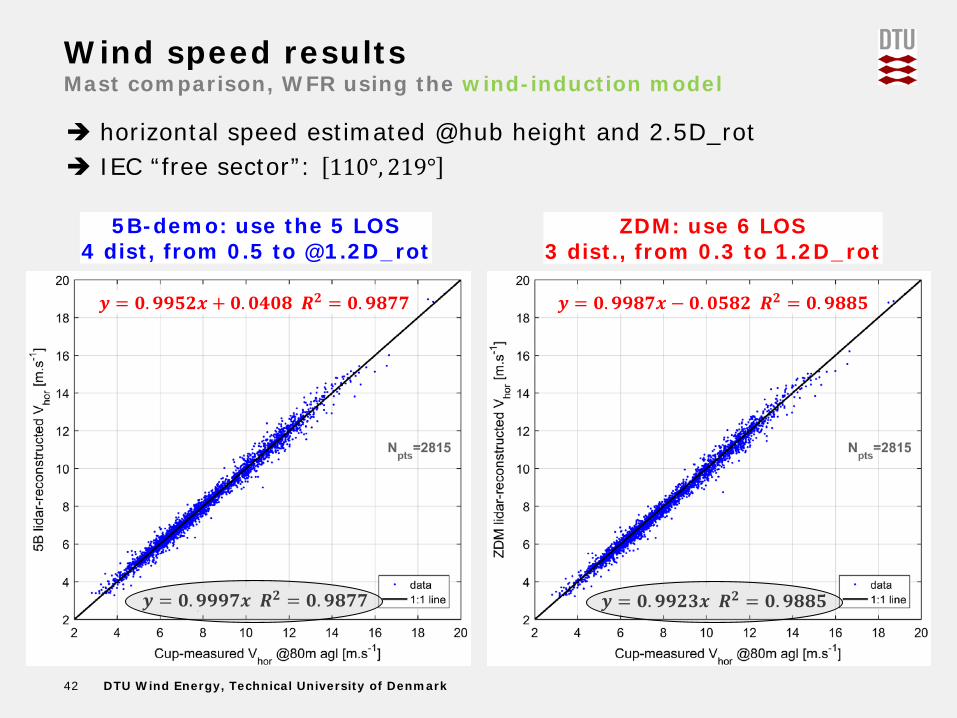
Wind speed resultsMast comparison, WFR using the wind model
horizontal speed estimated @hub height IEC “free sector”: 110°, 219°
41
5B-demouse the 5 LOS, @2 D_rot
ZDMuse 6 LOS, @2.5 D_rot
𝒚𝒚 = 𝟏𝟏.𝟎𝟎𝟎𝟎𝟐𝟐𝟎𝟎𝒆𝒆 𝑹𝑹𝟐𝟐 = 𝟎𝟎.𝟗𝟗𝟎𝟎𝟗𝟗𝟏𝟏
𝒚𝒚 = 𝟏𝟏.𝟎𝟎𝟏𝟏𝟗𝟗𝟐𝟐𝒆𝒆 − 𝟎𝟎.𝟏𝟏𝟗𝟗𝟎𝟎𝟏𝟏 𝑹𝑹𝟐𝟐 = 𝟎𝟎.𝟗𝟗𝟎𝟎𝟗𝟗𝟗𝟗
𝒚𝒚 = 𝟏𝟏.𝟎𝟎𝟎𝟎𝟓𝟓𝟗𝟗𝒆𝒆 𝑹𝑹𝟐𝟐 = 𝟎𝟎.𝟗𝟗𝟎𝟎𝟗𝟗𝟎𝟎
𝒚𝒚 = 𝟏𝟏.𝟎𝟎𝟎𝟎𝟗𝟗𝟎𝟎𝒆𝒆 − 𝟎𝟎.𝟎𝟎𝟎𝟎𝟗𝟗𝟓𝟓 𝑹𝑹𝟐𝟐 = 𝟎𝟎.𝟗𝟗𝟎𝟎𝟗𝟗𝟎𝟎
DTU Wind Energy, Technical University of Denmark
Wind speed resultsMast comparison, WFR using the wind-induction model
horizontal speed estimated @hub height and 2.5D_rot IEC “free sector”: 110°, 219°
42
5B-demo: use the 5 LOS4 dist, from 0.5 to @1.2D_rot
ZDM: use 6 LOS3 dist., from 0.3 to 1.2D_rot
𝒚𝒚 = 𝟎𝟎.𝟗𝟗𝟗𝟗𝟐𝟐𝟎𝟎𝒆𝒆 𝑹𝑹𝟐𝟐 = 𝟎𝟎.𝟗𝟗𝟎𝟎𝟎𝟎𝟓𝟓
𝒚𝒚 = 𝟎𝟎.𝟗𝟗𝟗𝟗𝟎𝟎𝟎𝟎𝒆𝒆 − 𝟎𝟎.𝟎𝟎𝟓𝟓𝟎𝟎𝟐𝟐 𝑹𝑹𝟐𝟐 = 𝟎𝟎.𝟗𝟗𝟎𝟎𝟎𝟎𝟓𝟓
𝒚𝒚 = 𝟎𝟎.𝟗𝟗𝟗𝟗𝟗𝟗𝟎𝟎𝒆𝒆 𝑹𝑹𝟐𝟐 = 𝟎𝟎.𝟗𝟗𝟎𝟎𝟎𝟎𝟎𝟎
𝒚𝒚 = 𝟎𝟎.𝟗𝟗𝟗𝟗𝟓𝟓𝟐𝟐𝒆𝒆 + 𝟎𝟎.𝟎𝟎𝟗𝟗𝟎𝟎𝟎𝟎 𝑹𝑹𝟐𝟐 = 𝟎𝟎.𝟗𝟗𝟎𝟎𝟎𝟎𝟎𝟎

DTU Wind Energy, Technical University of Denmark
Wind speed evolution in induction zone
43
5B-demo ZDM
The simple induction model seems adequate! (enough)

DTU Wind Energy, Technical University of Denmark
The white-box methodology: where are we?
• Propagation of input uncertainties (V los, inclination, etc) –Not possible with GUM–Use numerical methods instead: Monte Carlo simulations
• Get model uncertainties of all (fitted) wind characteristics44

DTU Wind Energy, Technical University of Denmark
Monte Carlo methods for Uncertainty Quantification
• Monte Carlo methods (MCM):–Statistical techniques used to computationally solve physical or
mathematical problems–Applications: numerical integration, optimisation, sensitivity or
reliability analysis, uncertainty quantification (UQ)–References: GUM supplement 1, Cox (2006)
• Principles:–Propagation of random inputs –By evaluation of a model for a large number of samples –Outputs characterized through their distribution

DTU Wind Energy, Technical University of Denmark
Uncertainties of WFC using Monte Carlo on free wind speed 𝐕𝐕∞
46
• Conclusions–Linear variation vs speed–No variability with input yaw misalignment and shear–No significant difference with two-beam lidar results (using
GUM) essentially, the wind speed model uncertainty is the one of the
cup anemometer used during the calibration in Høvsøre!
𝜃𝜃𝑟𝑟 = 4°; 𝛼𝛼𝑒𝑒𝑒𝑒𝑒𝑒 = 0.2; 𝑎𝑎𝑖𝑖𝑖𝑖𝑖𝑖 = 𝑛𝑛𝑛𝑛𝑛𝑛. 𝑉𝑉∞ = 10 𝑛𝑛𝑠𝑠−1; 𝛼𝛼𝑒𝑒𝑒𝑒𝑒𝑒 = 0.2; 𝑎𝑎𝑖𝑖𝑖𝑖𝑖𝑖 = 𝑛𝑛𝑛𝑛𝑛𝑛. 𝑉𝑉∞ = 10 𝑛𝑛𝑠𝑠−1; 𝜃𝜃𝑟𝑟 = 4°; 𝑎𝑎𝑖𝑖𝑖𝑖𝑖𝑖 = 𝑛𝑛𝑛𝑛𝑛𝑛

DTU Wind Energy, Technical University of Denmark
Outline
47
1 •Introduction
2 •Calibration of wind lidars
3 •Wind field reconstruction
4 •Power performance testing

DTU Wind Energy, Technical University of Denmark48
• Based on international standards IEC 61400-12-1 (2017 ed)– for the mast measurements
• Adapted to nacelle-based wind lidars: 5B-Demo and ZDM Wind field reconstruction with:
1) wind model2) combined wind-induction model
• Considering hub height wind speed only–No rotor equivalent wind speed
• Derived results– Measured power curves– Power curve uncertainties– Annual Energy Production (AEP)
Power performance testingMethod – NKE campaign

DTU Wind Energy, Technical University of Denmark49
Measured Power curves (scatter)WFR using wind-induction model
5B-demo ZDM
Mast

DTU Wind Energy, Technical University of Denmark50
Measured Power curves (binned)WFR using wind-induction model

DTU Wind Energy, Technical University of Denmark51
Power curve uncertainties: power, type AWFR using wind-induction model
• Clear reduction of scatter in power curve nacelle lidars yield smaller type A (statistical) power uncertainty
DTU Wind Energy, Technical University of Denmark52
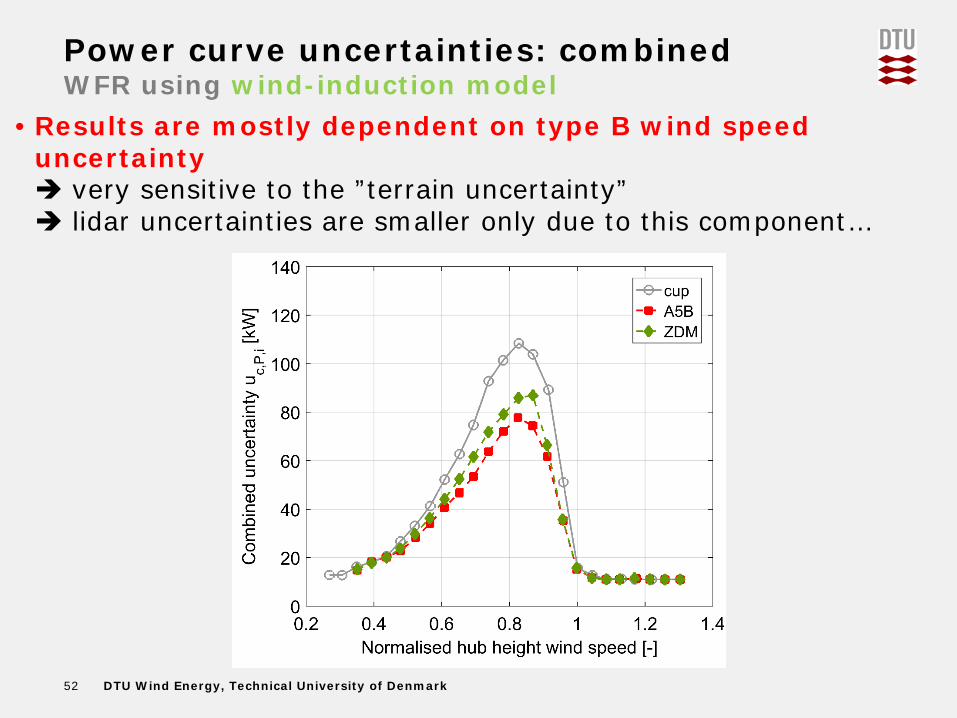
Power curve uncertainties: combinedWFR using wind-induction model
• Results are mostly dependent on type B wind speed uncertainty very sensitive to the ”terrain uncertainty” lidar uncertainties are smaller only due to this component…

DTU Wind Energy, Technical University of Denmark53
Annual Energy production• Derived as percentage of AEP using ”mast power curve”• 3 methods:
– Wind model– Combined wind-induction
• Wind speed estimated at 2.5D• fitted free stream wind speed (𝑉𝑉∞)
ZDM5B-demo

DTU Wind Energy, Technical University of Denmark54
Overall conclusions• Calibration of wind lidars
–the white-box methodology successfully applied– is now the preferred technique by wind industry!–Lidar LOS velocity uncertainty ≈ ref. anemometer speed
• V infinity is found ! solution: combined wind-induction WFR model and lidarmeasurements close to rotor allows to estimate free stream wind speed
• For power curve measurements: nacelle-based lidars are at least as accurate as meteorology masts (offshore) likely to replace them systematically to be included in next generation IEC standards?

DTU Wind Energy, Technical University of Denmark55
Future work
• Testing similar methods in complex terrain–Hill of Towie–Ogorje
• Standardisation work on nacelle lidars for power perfo.
• Optimisation of nacelle lidar trajectory–Needs a fully implemented lidar simulator–Needs validated CFD tools
• Development of model-fitting wind field reconstruction for:–Nacelle lidar measurements in wakes–Ground-based, scanning and floating lidars
UniTTe campaigns, ongoing analysis

DTU Wind Energy, Technical University of Denmark
Thanks for your attention!
56
Antoine RozennMichael
Anders
Nikolas
Per Kristoffer
Steen
Matthieu
Michael
Andrea
Ines
David
Florian
Guillaume
Nikola
Alexander
Niels
Nikolay
And many many others!!
Ioannis
Ameya

DTU Wind Energy, Technical University of Denmark
Acknowledgements
My Ph.D. project formed part of the UniTTe project (www.unitte.dk) which is financed by Innovation Fund Denmark.
57

DTU Wind Energy, Technical University of Denmark
Preparing for questions-
Calibration of wind lidars
58

DTU Wind Energy, Technical University of Denmark
Publications
59
• Publications:
DTU E-0086 report generic methodology
DTU E-0087 report detailed procedure 5B-demo
DTU E-0088 report detailed procedure ZDM
Journal paper Remote Sensing of Wind Energy (special issue) methodology, results, discussions, 2-beam example doi: 10.3390/rs8110907

DTU Wind Energy, Technical University of Denmark
Lidar
60
• LIght Detection And Ranging: “a radar using light”• Remotely measuring: from some meters to >10 km away
• Principles of coherent Doppler wind lidars
–sense light backscattered from particles moving with the wind–return light is frequency-shifted (Doppler effect)(1) Processing of raw signal Doppler spectrum(2) Estimate wind velocity along beam path
Line-Of-Sight (LOS) velocity 𝐕𝐕𝐥𝐥𝐡𝐡𝐥𝐥(3) Combine Vlos measurement in multiple locations
reconstructed wind field characteristics (WFC): speed, direction, shear, etc

DTU Wind Energy, Technical University of Denmark61
2) Calibration of LOS velocityData analysis (1/2)
• LOS direction evaluation (part 1)– Cosine / rectified cosine fitting to wind direction response– The lidar LOS is normalised by the horizontal speed Gives a first good estimation of LOS direction in sonic CS
ZDM5B-demoLOS 0 Bottom LOS

DTU Wind Energy, Technical University of Denmark62
2) Calibration of LOS velocityData analysis (1/2) – RSS process
• LOS direction evaluation (part 2)– Projection angle range: ±1°to cosine fitted LOS_dir– Linear reg. each 0.1°
– LOS dir = min parabola
ZDM5B-demoLOS 0 Bottom LOS
DTU Wind Energy, Technical University of Denmark
Calibration results
63
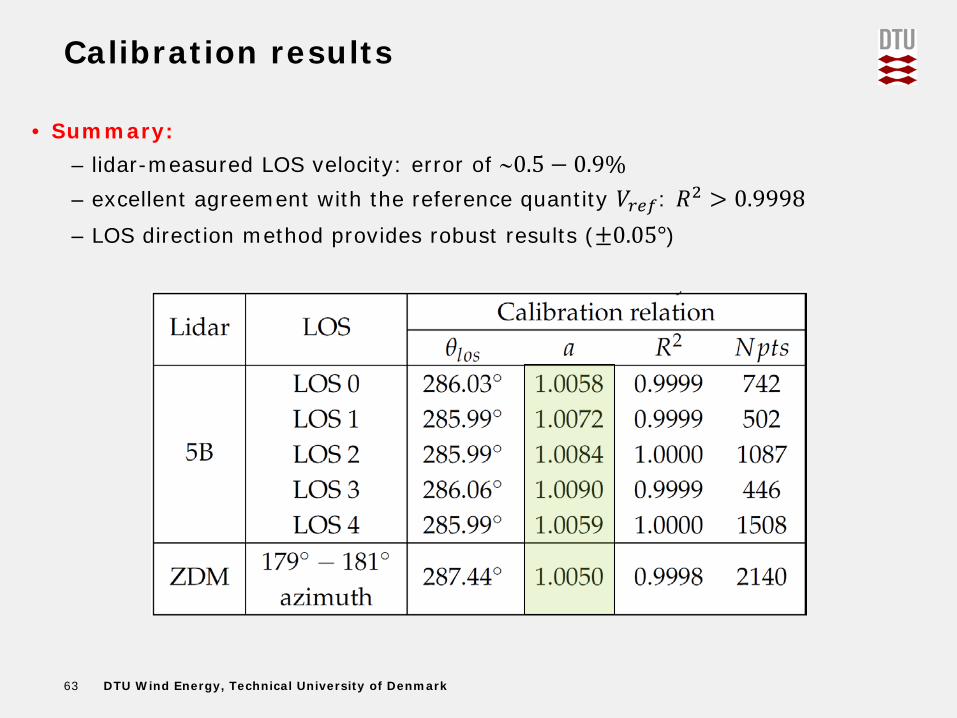
• Summary:– lidar-measured LOS velocity: error of ∼0.5 − 0.9%– excellent agreement with the reference quantity 𝑉𝑉𝑟𝑟𝑒𝑒𝑟𝑟: 𝑅𝑅2 > 0.9998– LOS direction method provides robust results (±0.05°)

DTU Wind Energy, Technical University of Denmark
Uncertainty assessment: how to combinecomponents?
64
• GUM methodology: analytic method1) Define measurement model: 𝑦𝑦𝑚𝑚 = 𝑓𝑓 𝑥𝑥1, 𝑥𝑥2, … , 𝑥𝑥𝑖𝑖2) Law of propagation of uncertainties:
𝑈𝑈𝑐𝑐 = ∑𝑖𝑖=1𝑖𝑖 𝜕𝜕𝑦𝑦𝑚𝑚𝜕𝜕𝑒𝑒𝑖𝑖
� 𝑢𝑢𝑒𝑒𝑖𝑖2
for uncorrelated inputs 𝑥𝑥𝑖𝑖
3) Expanded uncertainty with coverage factor k𝑈𝑈𝑒𝑒𝑒𝑒𝑒𝑒 = 𝑘𝑘 � 𝑈𝑈𝑐𝑐
typically, k=2 corresponds to 95% confidence interval

DTU Wind Energy, Technical University of Denmark
What are the uncertainty sources?
65
• Reference instruments uncertainties–HWS (IEC 61400-12 procedure for cups)
• Wind tunnel calibration uncertainty
𝑢𝑢𝑐𝑐𝑐𝑐𝑐𝑐 = 𝑢𝑢𝑐𝑐𝑐𝑐𝑐𝑐 1 +0.01
3� 𝐻𝐻𝐻𝐻𝐻𝐻
• Operational uncertainty
𝑢𝑢𝑜𝑜𝑒𝑒𝑒𝑒 =13� 𝑐𝑐𝑢𝑢𝑐𝑐 𝑐𝑐𝑐𝑐𝑎𝑎𝑠𝑠𝑠𝑠 𝑛𝑛𝑢𝑢𝑛𝑛𝑛𝑛𝑛𝑛𝑛𝑛 � 0.05 + 0.005 � 𝐻𝐻𝐻𝐻𝐻𝐻
• Mounting uncertainty𝑢𝑢𝑚𝑚𝑐𝑐𝑚𝑚𝑚𝑚 = 0.5% � 𝐻𝐻𝐻𝐻𝐻𝐻
–Wind direction, from calibration certificate of sonic anemometer:
𝑢𝑢𝑊𝑊𝑊𝑊 ≈ 0.4°

DTU Wind Energy, Technical University of Denmark
What are the uncertainty sources?
66
• Calibration process uncertainties–LOS direction uncertainty
𝑢𝑢𝐿𝐿𝐿𝐿𝐿𝐿 𝑖𝑖𝑖𝑖𝑟𝑟 = 0.1°
–Uncertainty of tilt inclination angle𝑢𝑢𝜑𝜑 = 0.05°
–Beam positioning uncertainty: 𝑢𝑢𝐻𝐻 = 10 𝑐𝑐𝑛𝑛, shear 𝛼𝛼𝑒𝑒𝑒𝑒𝑒𝑒 = 0.2
𝑢𝑢𝑒𝑒𝑜𝑜𝑚𝑚 = 𝛼𝛼𝑒𝑒𝑒𝑒𝑒𝑒 �𝑢𝑢𝐻𝐻𝐻𝐻� 𝐻𝐻𝐻𝐻𝐻𝐻 ≈ 0.23% � 𝐻𝐻𝐻𝐻𝐻𝐻
–Inclined beam and range uncertainty𝑢𝑢𝑖𝑖𝑖𝑖𝑐𝑐 = 0.052% � 𝐻𝐻𝐻𝐻𝐻𝐻
”how the probe volume affects the RWS estimation when the beam is inclined” (see model in DTU report E-0086, Annex A)

DTU Wind Energy, Technical University of Denmark
Preparing for questions-
Wind Field Reconstruction
67

DTU Wind Energy, Technical University of Denmark
Publications
68
• Publications:
Scientific article: wes-2017-10/
DTU Wind Energy, Technical University of Denmark
Full-scale campaign: Nørrekær Enge
• in Jutland, Denmark• owner: Vattenfall• 13 Siemens turbines of 2.3MW
69

DTU Wind Energy, Technical University of Denmark
Wind speed results: summary table
70
• Overestimation of 1-1.5% with the wind model• Better performance of wind-induction model using the lidars’
short-range measurements• Lidar-to-lidar: 5B-Demo about 0.5-1% higher than ZDM

DTU Wind Energy, Technical University of Denmark
Wind speed results: summary table
71
• Disjoint datasets: similar observations• Increased number of valid data points (2-3x more)• R2 enhanced slightly

DTU Wind Energy, Technical University of Denmark
Wind speed results: summary table
72
• Better agreement between lidar and mast• Much larger scatter (“signal decorrelation”)• Still 5B-Demo above ZDM (about 0.5%)

DTU Wind Energy, Technical University of Denmark
Wind speed results: summary table
73

DTU Wind Energy, Technical University of Denmark
Yaw misalignment results:WFR using the wind-induction model
74
• Wind sector: [110°, 219°] (joint datasets)• “Ref.” yaw misalignment from spinner anemometer
Higher scatter with lidars than spinner “mean” yaw misalignment: ≈ −3°The two nacelle lidars seem to provide similar results
5B-demo: 4 dist,from 0.5 to @1.2D_rot
ZDM: 3 dist.From 0.3 to 1.2D_rot
Spinner anemometer

DTU Wind Energy, Technical University of Denmark
Shear exponent results:WFR using the wind-induction model
75
• Wind sector : [110°, 219°] (joint datasets)• “Ref.” shear exponent: from mast, using cups at 80 and 57m agl
Slight overestimation vs. mast Similar results between the two lidars
5B-demo: 4 dist,from 0.5 to @1.2D_rot
𝒚𝒚 = 𝟎𝟎.𝟗𝟗𝟎𝟎𝟗𝟗𝟎𝟎𝒆𝒆 + 𝟎𝟎.𝟎𝟎𝟏𝟏𝟎𝟎𝟎𝟎 𝑹𝑹𝟐𝟐 = 𝟎𝟎.𝟔𝟔𝟔𝟔𝟔𝟔𝟗𝟗𝒚𝒚 = 𝟏𝟏.𝟎𝟎𝟎𝟎𝟎𝟎𝟏𝟏𝒆𝒆 𝑹𝑹𝟐𝟐 = 𝟎𝟎.𝟔𝟔𝟔𝟔𝟗𝟗𝟏𝟏
ZDM: 3 dist.From 0.3 to 1.2D_rot
𝒚𝒚 = 𝟎𝟎.𝟗𝟗𝟎𝟎𝟎𝟎𝟏𝟏𝒆𝒆 + 𝟎𝟎.𝟎𝟎𝟎𝟎𝟎𝟎𝟐𝟐 𝑹𝑹𝟐𝟐 = 𝟎𝟎.𝟔𝟔𝟔𝟔𝟔𝟔𝟎𝟎𝒚𝒚 = 𝟏𝟏.𝟎𝟎𝟎𝟎𝟎𝟎𝟐𝟐𝒆𝒆 𝑹𝑹𝟐𝟐 = 𝟎𝟎.𝟔𝟔𝟓𝟓𝟓𝟓𝟗𝟗
DTU Wind Energy, Technical University of Denmark
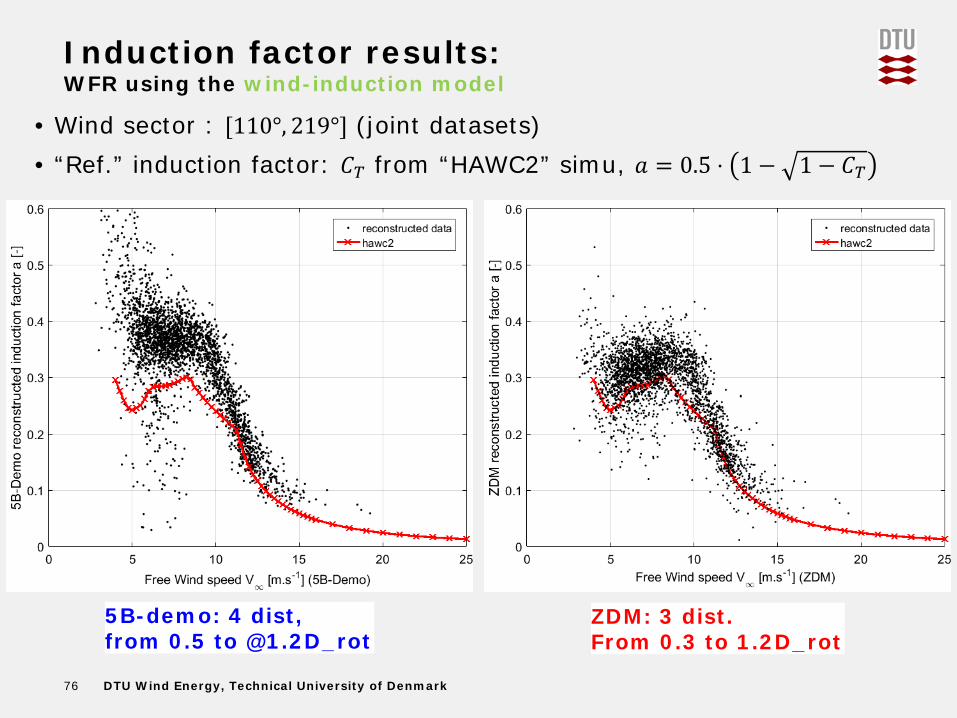
Induction factor results:WFR using the wind-induction model
76
• Wind sector : [110°, 219°] (joint datasets)• “Ref.” induction factor: 𝐶𝐶𝑇𝑇 from “HAWC2” simu, 𝑎𝑎 = 0.5 ⋅ 1 − 1 − 𝐶𝐶𝑇𝑇
5B-demo: 4 dist,from 0.5 to @1.2D_rot
ZDM: 3 dist.From 0.3 to 1.2D_rot

DTU Wind Energy, Technical University of Denmark
LOS velocity fitting residuals
• Definitions:– 𝑽𝑽𝐥𝐥𝐡𝐡𝐥𝐥 and �𝑽𝑽𝐥𝐥𝐡𝐡𝐥𝐥 are column vectors of length = N meas. points
(e.g. 5B-Demo = 4 dist*5 los =20; ZDM = 3 dist*6 los =18)–“bias” = 𝑽𝑽𝐥𝐥𝐡𝐡𝐥𝐥 − �𝑽𝑽𝐥𝐥𝐡𝐡𝐥𝐥 ; “error”: = 𝒂𝒂𝒂𝒂𝒄𝒄 𝑽𝑽𝐥𝐥𝐡𝐡𝐥𝐥 − �𝑽𝑽𝐥𝐥𝐡𝐡𝐥𝐥
77
observations
predictions

DTU Wind Energy, Technical University of Denmark
LOS velocity fitting residuals
• Computed stats: –M:mean, N:normalised; F:fractional; –S: squared; R: root; SS: sum of squares–MB, ME, NMB, NME, MFB, MFE, SSE, MSE, RMSE, NMSE
78
observations
predictions

DTU Wind Energy, Technical University of Denmark
V_los fitting residuals: mean biasWFR using the wind-induction model
79
• Wind sector : [110°, 219°] (joint datasets)
MB show very low values;Histogram centered on zero: the used model is “unbiased”
5B-demo4 dist. from 0.5 to @1.2D_rot
ZDM3 dist. from 0.3 to 1.2D_rot
𝟏𝟏𝟎𝟎−𝟎𝟎𝟏𝟏𝟎𝟎−𝟎𝟎

DTU Wind Energy, Technical University of Denmark
• Wind sector : [110°, 219°] (joint datasets)
RMSE values between 0 and 0.25 m/sSimilar distributions for both lidars, with a slightly larger mean for ZDM
V_los fitting residuals: mean biasWFR using the wind-induction model
80
5B-demo4 dist. from 0.5 to @1.2D_rot
ZDM3 dist. from 0.3 to 1.2D_rot

DTU Wind Energy, Technical University of Denmark
A simple induction model
• Derived from the Biot-Savart law–see The upstream flow of a wind turbine: blockage effect
–two parameters: induction factor 𝑎𝑎, free wind speed 𝑈𝑈∞𝑈𝑈𝑈𝑈∞
= 1 − 𝑎𝑎 1 + 𝜉𝜉1+𝜉𝜉2
, with 𝜉𝜉 = 𝑒𝑒𝑊𝑊𝑅𝑅𝑟𝑟𝑟𝑟𝑟𝑟
81ZDM5B-demo

DTU Wind Energy, Technical University of Denmark
Simple induction models
• One- or two- dimensional?
82

DTU Wind Energy, Technical University of Denmark
Preparing for questions-
propagation of uncertaintieswith Monte Carlo methods
83

DTU Wind Energy, Technical University of Denmark
Model uncertainty framework
84
Reproduced from:
Huard, D., and A. Mailhot (2006),
A Bayesian perspective on input uncertainty in model calibration: Application to hydrological model ‘‘abc’’,
Water Resour. Res., 42, W07416, doi:10.1029/2005WR004661
�𝐲𝐲𝐢𝐢 is a measured value of 𝑔𝑔;𝛜𝛜𝐱𝐱 represents the error related to the inputs;𝛜𝛜𝐠𝐠 is the random error due to the model uncertainty;𝛜𝛜𝐚𝐚 characterises the error due to the model inadequacy𝛜𝛜𝐫𝐫 is the error between observations �𝐲𝐲𝐢𝐢 (measured) and the true value 𝐲𝐲𝐭𝐭;
�𝐲𝐲𝐢𝐢 = 𝐲𝐲𝐭𝐭 + 𝛜𝛜𝐫𝐫 = 𝑔𝑔 𝐱𝐱𝐢𝐢 + 𝛜𝛜𝐱𝐱, �𝛉𝛉 + 𝛜𝛜𝐠𝐠 + 𝛜𝛜𝒂𝒂

DTU Wind Energy, Technical University of Denmark85
• Decreasing vs speed: consistent with NKE campaign results!• Values are very (too ??) low: due to assumed high correlation
between V_los• No variability with input yaw misalignment and shear
𝜃𝜃𝑟𝑟 = 4°; 𝛼𝛼𝑒𝑒𝑒𝑒𝑒𝑒 = 0.2; 𝑎𝑎𝑖𝑖𝑖𝑖𝑖𝑖 = 𝑛𝑛𝑛𝑛𝑛𝑛. 𝑉𝑉∞ = 10 𝑛𝑛𝑠𝑠−1; 𝛼𝛼𝑒𝑒𝑒𝑒𝑒𝑒 = 0.2; 𝑎𝑎𝑖𝑖𝑖𝑖𝑖𝑖 = 𝑛𝑛𝑛𝑛𝑛𝑛. 𝑉𝑉∞ = 10 𝑛𝑛𝑠𝑠−1; 𝜃𝜃𝑟𝑟 = 4°; 𝑎𝑎𝑖𝑖𝑖𝑖𝑖𝑖 = 𝑛𝑛𝑛𝑛𝑛𝑛
Uncertainties of WFC yaw misalignment 𝜽𝜽𝒅𝒅

DTU Wind Energy, Technical University of Denmark86
• Decreasing vs speed• No variability with input yaw misalignment• Increasing with shear • Order of magnitude: 5-10%
𝜃𝜃𝑟𝑟 = 4°; 𝛼𝛼𝑒𝑒𝑒𝑒𝑒𝑒 = 0.2; 𝑎𝑎𝑖𝑖𝑖𝑖𝑖𝑖 = 𝑛𝑛𝑛𝑛𝑛𝑛. 𝑉𝑉∞ = 10 𝑛𝑛𝑠𝑠−1; 𝛼𝛼𝑒𝑒𝑒𝑒𝑒𝑒 = 0.2; 𝑎𝑎𝑖𝑖𝑖𝑖𝑖𝑖 = 𝑛𝑛𝑛𝑛𝑛𝑛. 𝑉𝑉∞ = 10 𝑛𝑛𝑠𝑠−1; 𝜃𝜃𝑟𝑟 = 4°; 𝑎𝑎𝑖𝑖𝑖𝑖𝑖𝑖 = 𝑛𝑛𝑛𝑛𝑛𝑛
Uncertainties of WFC shear exponent 𝜶𝜶𝒓𝒓𝒆𝒆𝒐𝒐

DTU Wind Energy, Technical University of Denmark87
• Decreasing vs speed• No variability with input yaw misalignment and shear
• Much higher for 5B-Demo than ZDM: why??• Order of magnitude:
5% at high CT (low spd), up to 20% at low CT (high spd)
𝜃𝜃𝑟𝑟 = 4°; 𝛼𝛼𝑒𝑒𝑒𝑒𝑒𝑒 = 0.2; 𝑎𝑎𝑖𝑖𝑖𝑖𝑖𝑖 = 𝑛𝑛𝑛𝑛𝑛𝑛. 𝑉𝑉∞ = 10 𝑛𝑛𝑠𝑠−1; 𝛼𝛼𝑒𝑒𝑒𝑒𝑒𝑒 = 0.2; 𝑎𝑎𝑖𝑖𝑖𝑖𝑖𝑖 = 𝑛𝑛𝑛𝑛𝑛𝑛. 𝑉𝑉∞ = 10 𝑛𝑛𝑠𝑠−1; 𝜃𝜃𝑟𝑟 = 4°; 𝑎𝑎𝑖𝑖𝑖𝑖𝑖𝑖 = 𝑛𝑛𝑛𝑛𝑛𝑛
Uncertainties of WFC induction factor 𝒂𝒂𝒅𝒅𝒊𝒊𝒅𝒅

DTU Wind Energy, Technical University of Denmark88
MCM convergenceWind speed uncertainties (k=2)

DTU Wind Energy, Technical University of Denmark89
MCM convergenceYaw misalignment uncertainties (k=2)

DTU Wind Energy, Technical University of Denmark90
Shear exponent uncertainties (k=2)

DTU Wind Energy, Technical University of Denmark91
Induction factor uncertainties (k=2)

DTU Wind Energy, Technical University of Denmark
Preparing for questions-
power performance testing
92

DTU Wind Energy, Technical University of Denmark93
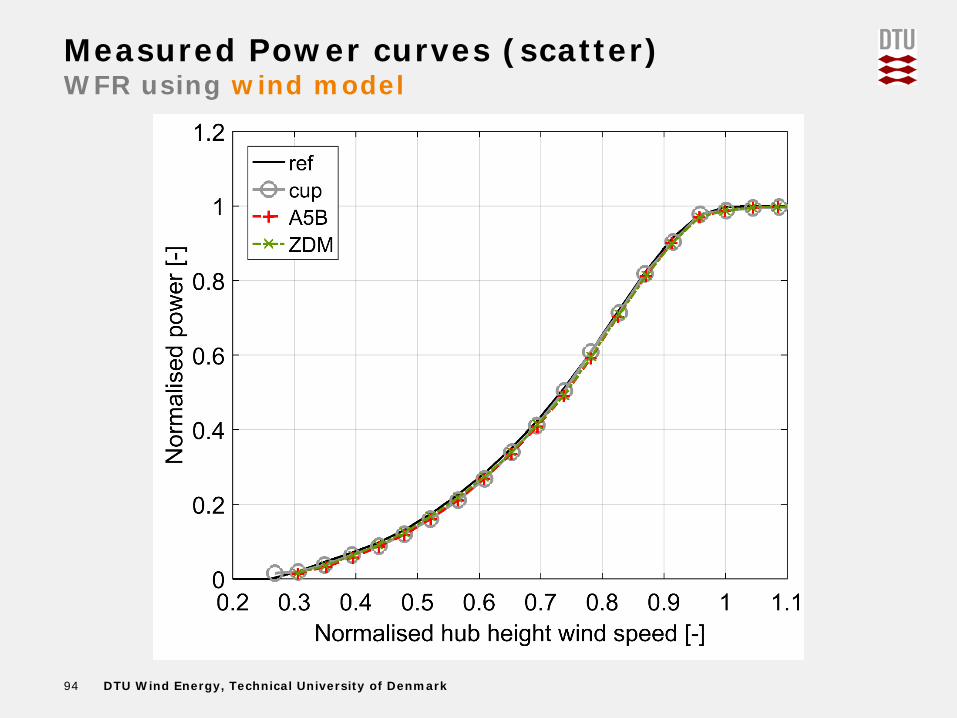
Measured Power curves (scatter) WFR using wind model
5B-demo ZDM
Mast
DTU Wind Energy, Technical University of Denmark94
Measured Power curves (scatter) WFR using wind model

DTU Wind Energy, Technical University of Denmark95
Power curve uncertainties: power, type AWFR using wind model

DTU Wind Energy, Technical University of Denmark96
Power curve uncertainties: combinedWFR using wind model