phosphorus removal - wwoa conference... · msa professional services, inc. | more ideas. better...
TRANSCRIPT

MSA PROFESSIONAL SERVICES, INC. | More ideas. Better Solutions. © 2014 by MSA Professional Services
Presentation prepared for: Wisconsin Wastewater Operator Association 2015 Wisc. Dells October 8th, 2015 | Mark Lundgren
Phosphorus Removal Going from 1 ppm to 0.075 ppm in
Cumberland, WI

MSA PROFESSIONAL SERVICES, INC. | More ideas. Better Solutions. © 2014 by MSA Professional Services
What is your current P Limit?

MSA PROFESSIONAL SERVICES, INC. | More ideas. Better Solutions. © 2014 by MSA Professional Services
Cumberland, WI
Population: 2,152 Phosphorus Effluent Limit: 0.075 mg/l

MSA PROFESSIONAL SERVICES, INC. | More ideas. Better Solutions. © 2014 by MSA Professional Services
Agenda » State of Nutrient Regulations + Policy » Cumberland WI Story » Q & A

MSA PROFESSIONAL SERVICES, INC. | More ideas. Better Solutions. © 2014 by MSA Professional Services
Nutrient Pollution – Why Care?


MSA PROFESSIONAL SERVICES, INC. | More ideas. Better Solutions. © 2014 by MSA Professional Services
MSA PROFESSIONAL SERVICES, INC. | More ideas. Better Solutions. © 2014 by MSA Professional Services
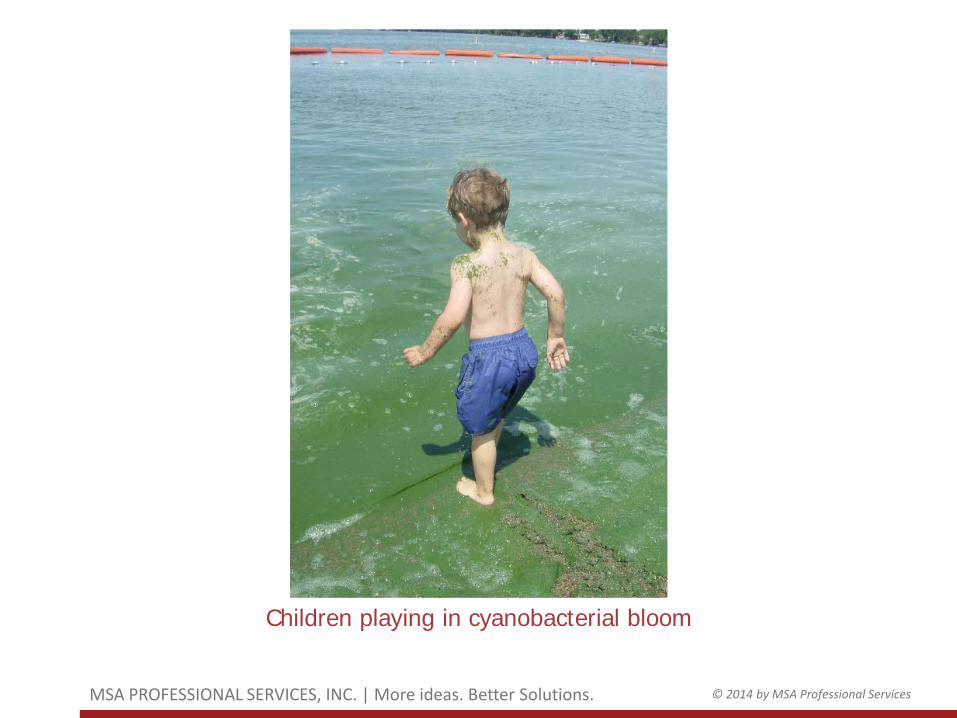
Children playing in cyanobacterial bloom

MSA PROFESSIONAL SERVICES, INC. | More ideas. Better Solutions. © 2014 by MSA Professional Services
What does that mean for my plant?

MSA PROFESSIONAL SERVICES, INC. | More ideas. Better Solutions. © 2014 by MSA Professional Services
PERMIT

MSA PROFESSIONAL SERVICES, INC. | More ideas. Better Solutions. © 2014 by MSA Professional Services
Why low limits in WI?

MSA PROFESSIONAL SERVICES, INC. | More ideas. Better Solutions. © 2014 by MSA Professional Services

MSA PROFESSIONAL SERVICES, INC. | More ideas. Better Solutions. © 2014 by MSA Professional Services
Wisconsin Level
» 2009 - Environmental Groups file lawsuit » 2010 – EPA Sends warning to WDNR to adopt
new phosphorus standards by 2010 and nitrogen standards by 2013
» Dec 1, 2010 WI Phosphorus Water Quality Standards updated • Created water quality standards in surface waters • WPDES permits issued to point sources • Tightened Ag performance standards
» 2012 EPA approves WI phosphorus program

MSA PROFESSIONAL SERVICES, INC. | More ideas. Better Solutions. © 2014 by MSA Professional Services
National Level - EPA Lawsuit » 2005 – Mississippi River Collaborative (MRC) is formed.
• Includes Minnesota Center for Environmental Advocacy » 2008 – MRC files petition to force EPA to act on
hypoxia. » 2011 – EPA denies petition. » 2012 – MRC files lawsuit against EPA denial. » 2013 – Court rules for MRC. EPA must respond to
original hypoxia petition in 6 months. » 2013 – EPA appeals court decision. Granted stay of
deadline to respond. » More to come . . . .

MSA PROFESSIONAL SERVICES, INC. | More ideas. Better Solutions. © 2014 by MSA Professional Services
Comprehensive National Mississippi Nutrient Regulations
Coming?

MSA PROFESSIONAL SERVICES, INC. | More ideas. Better Solutions. © 2014 by MSA Professional Services
Cumberland WWTP - Existing

MSA PROFESSIONAL SERVICES, INC. | More ideas. Better Solutions. © 2014 by MSA Professional Services
Cumberland WI WWTP - Phosphorus
» Design Flow 0.4 MGD » Typical Flow 0.18 MGD » No major upgrade since 1980 » Current Plant Effluent Average
• 9 lbs / day total P (2.7 mg/l) » Previous Permit
• 1 mg/l P (1,218 lbs total per year) • City did NOT meet limits • Participated in Red Cedar River Phosphorus Trading
Program 2 to 1 trade with Ag Sources ~4000 lbs /yr trade (~$16,000 per year in payments)

MSA PROFESSIONAL SERVICES, INC. | More ideas. Better Solutions. © 2014 by MSA Professional Services
2010 WDNR Phosphorus Rules
» Added Water Quality Based Effluent Limit (WQBEL) to TMDL for Hay River
» New limit 0.075 mg/l P (91 lbs / yr) • City would have to offset 3,200 lbs / yr through
trading
» Two options for offsetting P: • Adaptive Management • P Trading

MSA PROFESSIONAL SERVICES, INC. | More ideas. Better Solutions. © 2014 by MSA Professional Services
P Trading
» Trading reduced to upstream only partners in 2010 rules update

MSA PROFESSIONAL SERVICES, INC. | More ideas. Better Solutions. © 2014 by MSA Professional Services
Adaptive Management
» Adaptive management requires 5:1 trade • 16,000 lbs/yr would need to be offset to meet
permit • $64,000 / yr in offsets $1.2 million over 20 year lifespan
• Improvement in instream P levels MUST be seen over 10 year permit cycle No guarantee for no further action
» Neither P Trading or Adaptive Mgmt works for Cumberland

MSA PROFESSIONAL SERVICES, INC. | More ideas. Better Solutions. © 2014 by MSA Professional Services
How to meet 0.075 mg / L P Limit?
» “Typical” Influent = 4.0 – 12.0 mg/L » Some P is removed in biological treatment process
• About 2% of cell biomass is phosphorus • Ponds & Lagoons = less TP removed • Activated sludge = more TP removed
2005 MPCA study of 59 activated sludge treatment plants found an average removal of 47%
» Cumberland RBC poor P removal efficiency • ~25% removal of influent P • 20+ years old
» Cumberland needs additional P treatment

MSA PROFESSIONAL SERVICES, INC. | More ideas. Better Solutions. © 2014 by MSA Professional Services
Decision Time
» City decides to go for upgrade • High cost of payments to farmers • No guarantee that adaptive management will
meet permit requirements
» Options to meet limits • Oxidation Ditch w tertiary filter • Membrane Bioreactor

MSA PROFESSIONAL SERVICES, INC. | More ideas. Better Solutions. © 2014 by MSA Professional Services
Oxidation Ditch Pros: Easy to Operate. Less Cost. Less Equipment.
Cons: Provides 1mg/l P in Effluent. Provides 0.5 mg/l P with Chemical Addition. Requires Additional Treatment.

MSA PROFESSIONAL SERVICES, INC. | More ideas. Better Solutions. © 2014 by MSA Professional Services
» Physical Barrier » Small pores (5 - 10 um) » Compact footprint » TP = ~ 0.10 mg/L » 0.075 mg/L achievable
Cloth Media Filtration

MSA PROFESSIONAL SERVICES, INC. | More ideas. Better Solutions. © 2014 by MSA Professional Services
» Deep Bed Sand
Filters » Filtration of TP » Filtration +
Adsorption • Can add Hydrous
Ferric Oxide (HFO) Coating to sand to gather more P
» Larger footprint » TP = ~ 0.05 – 0.10
mg/L » 3 ft headloss per
filter » 6 ft headloss in
series
2-Stage Upflow Sand Filtration

MSA PROFESSIONAL SERVICES, INC. | More ideas. Better Solutions. © 2014 by MSA Professional Services
Pros: Effluent 0.075 mg/l P. Modular Units. No Additional Treatment Needed. Flexibility for Future Regs.
MEMBRANE BIO REACTOR (MBR)
Cons: Higher Cost. Proprietary. More Equipment, Single Source Vendor. “New” Technology.

MSA PROFESSIONAL SERVICES, INC. | More ideas. Better Solutions. © 2014 by MSA Professional Services
» Greatest Degree of Solids Separation » MicroFiltration (MF)
• 0.1 – 3.0 um » UltraFiltration (UF)
• 0.01 – 0.1 um
Membranes

MSA PROFESSIONAL SERVICES, INC. | More ideas. Better Solutions. © 2014 by MSA Professional Services
» TP < 0.05 mg/L » Small Footprint » Energy Intensive » Typically not gravity flow
• Permeate suction pumps
Membranes

MSA PROFESSIONAL SERVICES, INC. | More ideas. Better Solutions. © 2014 by MSA Professional Services
» Operate at elevated MLSS » Membranes used instead of final clarifiers » Metal Salt addition to MLSS ahead of membranes » TP < 0.05 mg/L possible » Requires excellent (redundant) fine screening
• < 3 mm (0.12 in)
Membrane Bioreactors (MBRs)

MSA PROFESSIONAL SERVICES, INC. | More ideas. Better Solutions. © 2014 by MSA Professional Services
Cumberland WWTP Cost Analysis: Cost Consideration
Oxidation Ditch W Tertiary Filter Membrane Bio Rector
2014 Capital Cost $1,582,000 $2,196,000
2019 Capital Cost $600,000 $223,000
2015-2025 Annual O&M Cost $49,000 $49,000
2025-2035 Annual O&M Cost $49,000 $49,000
Total Cost 2015 thru 2035 $3,320,000 $3,396,000
MSA PROFESSIONAL SERVICES, INC. | More ideas. Better Solutions. © 2014 by MSA Professional Services

MSA PROFESSIONAL SERVICES, INC. | More ideas. Better Solutions. © 2014 by MSA Professional Services
» Enhanced Biological Phosphorus Removal » Chemical Addition (Optional) » MBR » Total P = 0.03 mg/l (Modeled)
What are we doing in Cumberland?
MBR MBR
Anoxic
Anaerobic
INFLUENT
EFFLUENT
FINE SCREENS
CHEMICAL ADDITION
CHEMICAL ADDITION

MSA PROFESSIONAL SERVICES, INC. | More ideas. Better Solutions. © 2014 by MSA Professional Services
» Capital Cost Similar to Oxidation Ditch with Tertiary
Filter » More reliable effluent quality » More flexibility to meet future regulations
Main Reasons for MBR

MSA PROFESSIONAL SERVICES, INC. | More ideas. Better Solutions. © 2014 by MSA Professional Services
Ovivo Membrane System

MSA PROFESSIONAL SERVICES, INC. | More ideas. Better Solutions. © 2014 by MSA Professional Services

MSA PROFESSIONAL SERVICES, INC. | More ideas. Better Solutions. © 2014 by MSA Professional Services

MSA PROFESSIONAL SERVICES, INC. | More ideas. Better Solutions. © 2014 by MSA Professional Services
» $7.6 Million Upgrade
• New screening • New MBR Building • Misc Equipment Replacements • Anaerobic Digesters Aerobic Digesters
» Average Residential User Charge for Cumberland • $39.25 $55 / month (40% increase)
Cost?

MSA PROFESSIONAL SERVICES, INC. | More ideas. Better Solutions. © 2014 by MSA Professional Services
Thank You! Questions?

MSA PROFESSIONAL SERVICES, INC. | More ideas. Better Solutions. © 2014 by MSA Professional Services
National Nutrient Regulation
» EPA • Gives states technical guidance to states on how
to deal with nutrient pollution • Helps States develop water quality criteria for
incorporating nutrient regulations into state policy • Helps States develop TMDLs (Total Maximum Daily
Load) allocations for nutrients
» States • Figure out the details and implementation

MSA PROFESSIONAL SERVICES, INC. | More ideas. Better Solutions. © 2014 by MSA Professional Services
Minnesota – Watershed Approach » Step 1. Monitor water
bodies and collect data » Step 2. Assess the data » Step 3. Develop strategies
to restore and protect the watershed's water bodies
» Step 4. Conduct restoration and protection projects in the watershed
Wisconsin Approach very similar . . .

MSA PROFESSIONAL SERVICES, INC. | More ideas. Better Solutions. © 2014 by MSA Professional Services
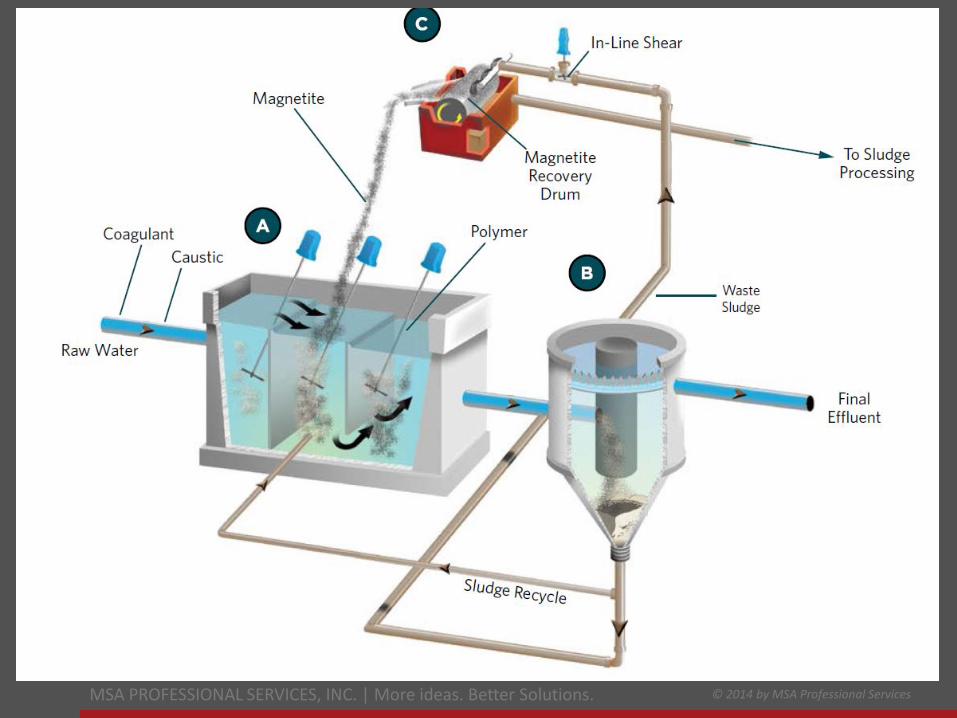
» Use a “ballast”
• Create ‘heavy’ floc • Micro-Sand/Lamella Clarifier • Magnetite/Circular Clarifier
» Fast Settling • Small Footprint
» Capture and Reuse Ballast » Fair amount of moving parts » TP = ~0.05 – 0.1 mg/L » Many demonstration tests
in WI (2012-2014) • < 0.05 mg/L achievable
» ~ 1 ft headloss
Ballasted Clarification

MSA PROFESSIONAL SERVICES, INC. | More ideas. Better Solutions. © 2014 by MSA Professional Services
Ballasted Clarification
MSA PROFESSIONAL SERVICES, INC. | More ideas. Better Solutions. © 2014 by MSA Professional Services
Ballasted Clarification

MSA PROFESSIONAL SERVICES, INC. | More ideas. Better Solutions. © 2014 by MSA Professional Services
» Adsorption-enhanced
filtration may yield lower chemical use
» Hydrous Ferric Oxide (HFO) Coating • P is adsorbed onto sand • HFO and P abraded
during backwash • Sand re-charged with
HFO
Reactive Upflow Sand Filtration

MSA PROFESSIONAL SERVICES, INC. | More ideas. Better Solutions. © 2014 by MSA Professional Services
Coagulation Tank Contents

MSA PROFESSIONAL SERVICES, INC. | More ideas. Better Solutions. © 2014 by MSA Professional Services
Flocculation Tank Contents

MSA PROFESSIONAL SERVICES, INC. | More ideas. Better Solutions. © 2014 by MSA Professional Services
» Dose coagulant after secondary clarifier, ahead of filter » Rapid Mix » Coagulation » Flocculation » Add Polymer at Flocculation Stage
Cloth Media Filtration – Flow Diagram

MSA PROFESSIONAL SERVICES, INC. | More ideas. Better Solutions. © 2014 by MSA Professional Services
» Goal
• Convert phosphorus to a form that can be separated from the final effluent (settling or filtration)
» How?
• Chemical addition to make dissolved P settleable or filterable
• Biological Treatment to Increase P in waste sludge • Advanced P Removal Technologies
Additional P Removal

MSA PROFESSIONAL SERVICES, INC. | More ideas. Better Solutions. © 2014 by MSA Professional Services
Options for Cumberland

MSA PROFESSIONAL SERVICES, INC. | More ideas. Better Solutions. © 2014 by MSA Professional Services
Phosphorus Speciation (Effluent)
» Soluble Reactive P • “Reactive” with metal salts to form precipitate
» Soluble Non-reactive P • Passes through treatment • Typically small fraction (0.01 – 0.03 mg/L)
Ortho-P
Total Phosphorus (TP)
Soluble Reactive P (sRP)
Soluble Non-reactive P (sNRP)
Colloidal P
Particulate P

MSA PROFESSIONAL SERVICES, INC. | More ideas. Better Solutions. © 2014 by MSA Professional Services
» Add a metal salt to bind with soluble reactive phosphate
• Calcium-based (lime) • Iron-based (Ferric Chloride, Ferrous Sulfate) • Aluminum-based (Alum, Polyaluminum Chloride)
Chemical Phosphorus Removal

MSA PROFESSIONAL SERVICES, INC. | More ideas. Better Solutions. © 2014 by MSA Professional Services
» The lower you go, the greater the dosage rate
required • Need greater chemical concentration in water to “find” the
remaining phosphorus
» Molar Ratios (moles of metal:moles of Phosphorus) • 5 mg/L 0.8 mg/L : Molar Ratio ~ 1.2:1 to 1.5:1 • 0.8 mg/L 0.5 mg/L: Molar Ratio ~ 1.5:1 to 3.5:1 • 0.5 mg/L 0.2 mg/L: Molar Ratios ~ 3.5:1 to 10:1 • 0.2 mg/L 0.04 mg/L: Molar Ratios ~10:1 to >30:1
Chemical Phosphorus Removal

MSA PROFESSIONAL SERVICES, INC. | More ideas. Better Solutions. © 2014 by MSA Professional Services
Molar Ratios Getting from 6 mg/L to 0.8 mg/L

MSA PROFESSIONAL SERVICES, INC. | More ideas. Better Solutions. © 2014 by MSA Professional Services
Molar Ratios Getting from 0.8 mg/L to 0.4 mg/L!

MSA PROFESSIONAL SERVICES, INC. | More ideas. Better Solutions. © 2014 by MSA Professional Services
» Inject at head of primary and/or secondary clarifiers
• Well-mixed area yields best results
» Chemically bound TP solids are settled and removed » Typical Dosing Molar Ratios (Metal:TP) = 1.2 to 2.0 » Final effluent TP = 0.5 mg/L » Increased sludge production from chemical addition
Chemical Phosphorus Removal

MSA PROFESSIONAL SERVICES, INC. | More ideas. Better Solutions. © 2014 by MSA Professional Services
» Create conditions to grow specific biomass (PAO’s)
• Cycle between anaerobic and aerobic phase • PAOs consume VFAs and release stored polyphosphate in anaerobic conditions, building up
carbon reserves • In aerobic conditions, PAOs multiply and take up more phosphate than was released in the
anaerobic phase • RAS returns the PAOs to the anaerobic stage to build up the population and keep the process
running
Biological Phosphorus Removal
MSA PROFESSIONAL SERVICES, INC. | More ideas. Better Solutions. © 2014 by MSA Professional Services
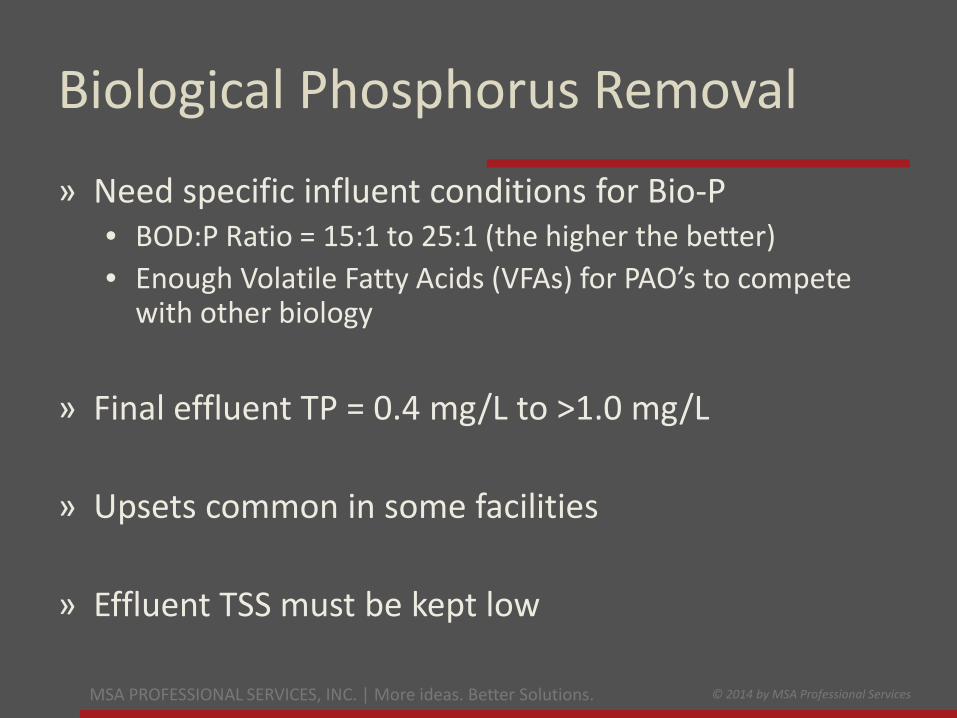
» Need specific influent conditions for Bio-P
• BOD:P Ratio = 15:1 to 25:1 (the higher the better) • Enough Volatile Fatty Acids (VFAs) for PAO’s to compete
with other biology
» Final effluent TP = 0.4 mg/L to >1.0 mg/L
» Upsets common in some facilities » Effluent TSS must be kept low
Biological Phosphorus Removal

MSA PROFESSIONAL SERVICES, INC. | More ideas. Better Solutions. © 2014 by MSA Professional Services
ARGGGG!!!! (Bored Yet???)

MSA PROFESSIONAL SERVICES, INC. | More ideas. Better Solutions. © 2014 by MSA Professional Services
Cumberland WWTP 4 Phosphorus Considerations: DNR REQUIREMENTS: Oxidation Ditch: MBR: 2016 Establish Effluent P 2015 MBR On-line *2017 P = 1mg/l No P Trading *2016 Meet 0.075 mg/l P 2018 P Options: Review Filtration, Storm Water, MBR, Bio P with Chemicals, Trading in Effluent 2019 Implement Option: e.g. MBR or Trading * Based on 9/3/13 correspondence with Kathy Bartilson @DNR

MSA PROFESSIONAL SERVICES, INC. | More ideas. Better Solutions. © 2014 by MSA Professional Services
It’ll get better…

MSA PROFESSIONAL SERVICES, INC. | More ideas. Better Solutions. © 2014 by MSA Professional Services
» Filtration or equivalent
• Tertiary or “Add-on” processes
• Downstream of secondary treatment
» Same principles apply! • Add metal salts • Create particulate P from
remaining sRP and colloidal P • Confine by a physical barrier
or settle out
» Low TP limits require very low effluent TSS
Advanced Phosphorus Removal
MSA PROFESSIONAL SERVICES, INC. | More ideas. Better Solutions. © 2014 by MSA Professional Services
» Cloth Media Filtration (pile cloth, micro-screens)
» Sand Filtration (2-stage upflow, 2-stage reactive) » Membrane Filtration (microfiltration, ultrafiltration,
MBR)
Advanced Phosphorus Removal

MSA PROFESSIONAL SERVICES, INC. | More ideas. Better Solutions. © 2014 by MSA Professional Services
» How Strict* is your Limit?
• 0.5 – 1.0 mg/L – “standard” Chem-P, EPBR, EPBR + Chem P • 0.3 – 0.5 mg/L – sand filtration, CMF • 0.3 – 0.1 mg/L – CMF, 2SUSF • 0.075 – 1.0 mg/L – CMF?, R2SUSF • 0.04 - 0.075 mg/L –R2SUSF, 2SUSF, MF, UF, MBR • <0.040 – R2SUSF, UF, MBR, RO
What Technologies to Consider?
CMF = Cloth Media Filtration MF = Microfiltration
2SUSF = 2 Stage Upflow Sand Filtration UF = Ultrafiltration
RO = Reverse Osmosis MBR = Membrane BioReactor
EBPR = Enhanced Biological Phosphorus Removal Chem-P = Chemical Phosphorus Removal
R2SUSF = Reactive 2 Stage Upflow Sand Filtration *Limits and corresponding technologies indicated are the author’s opinion. They are provided as a possible starting point for evaluation and cost effectiveness determination.