potential health risks a ssociated with nanotechnologies in existing food additives of... ·...
TRANSCRIPT

Potential Health Risks Associated with Nanotechnologies in Existing Food
Additives
(May 2016) Prepared by: Roger Drew, PhD, DABT Tarah Hagen, MSc ToxConsult Pty Ltd. Prepared for: Food Standards Australia New Zealand

Page 2 of 106
Disclaimer This report was prepared by ToxConsult Pty Ltd as an account of work for FSANZ (the ‘Client’). This report should be read, and used in its entirety. The material in it reflects ToxConsult’s best judgement in the light of the information available to it at the time of preparation. However, as ToxConsult cannot control the conditions under which this report may be used, ToxConsult will not be responsible for damages of any nature resulting from use of or reliance upon this report. ToxConsult’s responsibility for the information herein is subject to the terms of engagement with the client. Information provided by the client has been used in good faith; ToxConsult has not, and was not required to, verify its veracity. Copyright and any other Intellectual Property associated with this report belongs to ToxConsult Pty Ltd and may not be reproduced in any form without the written consent of ToxConsult. The Client, and only the client, is granted an exclusive licence for the use of the report for the purposes described in the report.
About ToxConsult Pty Ltd About the authors: Dr Drew Dr Roger Drew is one of the principal consultants of ToxConsult Pty Ltd. He has primary degrees in biochemistry and pharmacology and postgraduate degrees in toxicology. Postdoctoral training was undertaken at the National Institutes of Health, National Cancer Institute in the USA. He has more than 40 years of toxicological and risk assessment experience in academia, industry and consulting. He has served on advisory committees and task forces for Australian Health Departments and the World Health Organization. He has provided advice to a range of industries and Government authorities and has significantly participated in developing risk assessment practice in Australia. Dr Drew is one of just a few toxicologists in Australia certified by the American Board of Toxicology. Dr Drew is also Adjunct Associate Professor in the Department of Epidemiology and Preventive Medicine, Monash University and teaches various aspects of toxicology and risk assessment to undergraduate and postgraduate students at local Universities. He is a member of professional toxicology societies and is a recognised national and international expert in toxicology and risk assessment. He is currently on the editorial board of the international scientific journal “Regulatory Toxicology and Pharmacology". Ms Hagen Tarah Hagen is a director and senior consultant at ToxConsult Pty Ltd providing ecotoxicology and risk assessment services to a broad range of industries and government bodies. She has a Masters degree in Environmental Toxicology and Pollution Monitoring, an honours degree in ecotoxicology, and a degree in Applied Science (Biological Sciences).

Page 3 of 106
Executive Summary Introduction:
Throughout the world nanotechnologies are increasingly being used, or are proposed to be used, to
advance various aspects of food production. Included is direct addition to food of nano-substances to
improve desirable attributes during manufacture, use and/or storage. This review, commissioned by
Food Standards Australia New Zealand (FSANZ), examines the scientific literature to determine
whether there is currently objective evidence for determining if adverse health effects may be
associated with nano-forms of insoluble inorganic food additives. In this review such nano-substances
are called engineered nanomaterials (ENMs). Traditionally an ENM is defined as a particle with at
least one size aspect less than 100nm. This review is primarily concerned with whether the small size
confers novel attributes to the food additive that result in demonstrably different health risks relative to
the same additive used in non-nano (i.e. bulk) form. The manner in which health risk possibly
associated with nanotechnology applications in the food sector is managed by international food
regulatory authorities is summarised in Appendix B.
General considerations:
The review provides a synopsis of the absorption, distribution, metabolism and excretion (ADME) of
nanoparticles. The uptake, translocation and biodistribution of ENMs after ingestion are modulated by
potential degradation and/or solubilisation during passage through the gastrointestinal tract (GIT), or
by food in the GIT. ENMs may also agglomerate to larger sizes and as a result be excreted without
being absorbed into the body. Nano-specific properties of an ENM are linked to the physical integrity
of the constituting nano-structure. When an ENM loses its nano-structure, it logically should not
behave significantly different from its conventional bulk form. It is noted that many ADME studies with
oral ENM administration do not measure the ENM per se in tissues; rather some component that may
be released from the ENM, e.g. the metal from a metal oxide ENM, is conveniently measured. In such
cases it is not known if the ENM itself has been absorbed.
General considerations and issues associated with conduct and interpretation of oral toxicity studies
with nanomaterials are canvassed in this report. Studies conducted under the governance of Good
Laboratory Practice (GLP) and according to defined, standard protocols are much more useful for
regulatory safety assessment and decision making than are publications reporting research
investigations. OECD (2013) recommends chronic studies of dietary exposure are best performed by
feeding the nanoparticles in a diet to the animal. However, most toxicology studies have been
undertaken with gavage administration and at doses much higher than realistically expected for
dietary human exposure. This limits the interpretation, safety assessment and human relevance of

Page 4 of 106
many studies. Interpretation of the oral toxicity studies with ENMs is further hampered by the absence
of bulk material as comparative control. Research investigations are designed for different purposes
than safety assessment. They are frequently inadequate in terms of reporting, route of ENM
administration, experimental design and dose relevance, and they lack the appropriate controls.
Furthermore effects chosen to be studied are sometimes esoteric (e.g. release of individual
inflammatory mediators or changed gene expression), or have incomplete assessment (e.g. change
in organ weight or detection of tissue nano-particles but no histopathological evaluation) and their
usefulness for assessing ENM safety when incorporated into food is obscure.
Notably several recent reviews have concluded the current toxicological database for ENMs does not
show evidence of novel nano-related toxicity. It is argued conventional particle toxicology data are
useful and relevant to the determination of the nanoparticle hazard. It is also evident there is
publication bias towards academic research studies purported to show an ENM related effect while
investigations conducted to regulatory guidelines are largely unavailable. The latter is because they
usually show no adverse effects and it is difficult to publish such information, and/or the data may be
proprietary or commercially sensitive.
Information on nano titanium dioxide (nTiO2), nano amorphous silica (nSiO2) and nano-silver (nanoAg)
are examined in detail since the first two have already been used as food additives for a long time,
and there appears to be concerted interest in the use of nanoAg in food packaging.
In vitro experiments have uniformly shown ENMs added to different types of cultured cells can, at
some ENM concentration, cause cellular oxidative stress and release of pro-inflammatory molecules.
It has been suggested ENMs in food may be responsible for exacerbation of GIT inflammatory
diseases such as Crohn’s Disease in susceptible persons. This report carefully examines the
literature investigating this hypothesis and has found a potential link has not yet been reasonably
established. Much more additional research is required to impartially and objectively determine
whether TiO2, silicates, or dietary microparticles in general have a cause and effect relationship in the
pathogenesis of Crohn’s disease, or other inflammatory bowel diseases, in genetically susceptible
subjects.
Amorphous silica (SiO2) Amorphous SiO2 has been used as a food additive for decades. It is designated as E551.
• The percentage of SiO2 in foods that is ‘nano’ size ranges from <4% to approximately 40%.
• The nanoparticle size in food is typically 50 – 200nm.

Page 5 of 106
• Consumer intake of SiO2 from food has been estimated to be 0.3 - 9.4 mg/kg/d for a 70 kg
adult (i.e. ~0.14 - 4.4 mg Si/kg/d), of which ~0.06 - 1.8 mg/kg/d (i.e. ~0.03 - 0.8 mg Si/kg/d)
could be in the nano-size.
In experimental animals most of the orally administered nano-SiO2 is excreted in faeces. This is
consistent with low bioavailability. Once in the blood Si from nano-SiO2 is quickly removed by tissue
uptake and urinary excretion. Si in tissues, mainly liver and spleen, is only slowly removed. Data for
tissue half-lives are not available. Although a few studies have identified particulates in tissues after
dosing animals with nano-SiO2 most studies rely on Si or fluorescence from the tagged nanoparticle
to infer particulates could have been absorbed across the gastrointestinal tract. However dissolution
of nano-SiO2 has been shown to occur in gastric fluids suggesting Si measurements in systemic
tissues may be due to absorption of soluble Si and/or SiO2 nano-particles. Gastrointestinal absorption
of Si from SiO2 nanomaterials in vivo is likely to be low to moderate; perhaps ~0.2% from diet and
~10% after gavage administration, depending on the study.
Some types of nano-SiO2 can cause chromosomal damage to mammalian cells in in vitro test
systems. Genotoxicity data for in vivo exposure for nano- or food grade SiO2 was not found.
Gavage and dietary studies, up to 90 days, with nano-SiO2 (unspecified as to food grade) and sub-
chronic and chronic diet studies with SiO2 that is presumed to be food grade, (but uncertain) indicate
very low toxicity of the administered SiO2. The NOAELs are high, collectively ≥1,000 mg/kg/d. It is
concluded from a hazard aspect that there is no evidence to suggest at human dietary exposures an
unacceptable risk is likely. The database is however lacking in in vivo genotoxicity and developmental
studies.
The European Food Safety Authority concluded exposures to SiO2 in food supplements and from
typical dietary intakes are of no safety concern (EFSA 2009a).
Titanium dioxide (TiO2) Food grade TiO2 used as a food additive may have up to approximately 10 - 40% of the particle size
in the nano-range (<100 nm).

Page 6 of 106
In food, content of TiO2 nano-size particles varies. For example in chewing gum ~93% may be
<200nm depending on brand, but in food only 5 – 10% may be <100nm. A significant uncertainty
associated with estimating the particle size range of TiO2 in food is the influence the extraction
techniques may have had on the result.
Adult dietary exposure to TiO2 may be approximately 1 mg TiO2/kg/d but up to 2 mg TiO2/kg/d for
children. Chewing gum has the highest concentrations of TiO2, the swallowed dose of nano-TiO2 per
piece of chewing gum may be up to 7 mg depending on the brand.
In simulated gastric fluid nano-TiO2 agglomerates, but approximately 10% or more may remain in the
nano-form. Unlike some other metal oxide nanoparticles, there is minimal dissolution of nano-TiO2 in
gastric juices.
Data are not available on the absorption, distribution, elimination and toxicology of nano-TiO2 when
mixed with food. Oral absorption information is reliant on gavage studies conducted in rodents,
distribution information comes primarily from intravenous studies and may, or may not, represent the
fate of nano-TiO2 particles if they are systemically absorbed from the gut. Toxicology studies have
been conducted in rodents with repeat gavage administration.
Overall this review has found no evidence that titanium from nano-particulate TiO2 in the diet is more
likely to be absorbed from the gut than micron-sized particles, i.e. bulk material. Overall, absorption of
TiO2 from the gastrointestinal tract is very low. Nevertheless there are some gavage animal studies
with nano-TiO2 that show small increases in tissue titanium concentrations (mainly liver and spleen)
after gavage dosing. In a few cases the presence of TiO2 particles and/or agglomerates has been
observed.
There are conflicting data regarding the extent of absorption of nano-TiO2 from the gastrointestinal
tract of humans or animals. The disparity between studies may reflect the different exposure periods,
dose size, animal fasting state and/or analytical sensitivity of the methods employed. However, the
data collectively show nano-TiO2 has very poor bioavailability.
Parenteral administration of nano-TiO2 shows it is widely distributed to tissues, particularly those with
the highest level of fixed phagocytic cells, i.e. the liver and spleen. Titanium concentrations in these
tissues decline very slowly, half-lives are 28 – 650 days.

Page 7 of 106
There are few studies investigating the toxicity of TiO2 by dietary exposure, those that exist are old
and do not specify the grade or particle size of the TiO2. Nevertheless, these studies have been used
by regulatory bodies to conclude that even at very high dietary levels (e.g. 100,000 ppm in diet) TiO2
has very low toxicity to rats and mice when they are exposed in the diet for long periods. In both
species faeces are recorded to be white. TiO2 in the diet showed no evidence of carcinogenicity or
systemic tissue toxicity.
In contrast to the dearth of dietary studies there is a plethora of studies with nano-TiO2 that have
investigated various toxicological effects following gavage administration from single high doses, or
much lower doses of ~1 – 250 mg/kg/d for 5 – 90 days. Many have shown small increases in titanium
concentrations in various organs and associated degrees of toxicity. The liver, spleen and kidney are
the primary target organs. But dose- and time-dependent effects have been observed in other organs,
e.g. the heart, thyroid, ovary and brain. Adverse effects on tissues have been usually demonstrated
by traditional clinical chemistry and histopathology techniques, but also include gene expression
changes. While many of the toxicology gavage studies with nano-TiO2 have been well conducted and
reported, they are not undertaken according to GLP, not comprehensive for endpoint assessment nor
do they employ the TiO2 that is used as food additive, or have such material as a comparative control.
It is noted that a number of gavage studies showing tissue effects have been published by a single
laboratory which has used very small nano-TiO2 (5 – 6nm) made ‘in house’ which is unlikely to be
representative of TiO2 food additive material. Because the doses are via gavage and the tested nano-
TiO2 is not the same as food grade material the relevance of these studies, apart from showing
potential hazard, for human risk assessment is uncertain.
Summary conclusion:
There is marked uncertainty in extrapolating animal toxicological studies for nano-TiO2 to human
dietary exposure when the exposure has been via gavage and food grade TiO2 has not been
examined. All forms of TiO2 are poorly absorbed from the gastrointestinal tract. Nevertheless the
weight of evidence indicates that oral exposure to nano-TiO2, at least by gavage, can result in small
increases in tissue titanium and is potentially associated with a range of tissue effects. Some of these
effects have been observed at doses ≤ 200 mg/kg/d for exposure periods of 5 – 90 days. Many of the
studies have been well conducted and reported, although perhaps as expected not to GLP standards
since they have been undertaken by university research laboratories investigating issues other than
safety assessment.

Page 8 of 106
The absence of modern dietary absorption and chronic toxicological studies with well characterised
food grade TiO2 means greater weight than otherwise is placed on the animal gavage studies using
non-food grade TiO2. Nonetheless extrapolation of gavage studies to assess hazards of a substance
in food is highly uncertain, this is particularly so for nano-particulates where food can significantly alter
the nano-nature of the substance. Overall this review concludes there is insufficient, directly relevant
information available to confidently support a contemporary risk assessment of nano-TiO2 in food.
It is also noted that despite TiO2 being used as a food additive for many years there are no
epidemiology studies available regarding possible associations with adverse health outcomes. On the
other hand the long history of use has not given rise to reports of adverse effects.
Nanosilver (nanoAg or Ag-NPs) Daily human dietary Ag intake has been estimated to be <0.4 to 27 µg/day for different populations.
Ag-NPs have complex interactions in the gastrointestinal tract. In the stomach agglomeration is
facilitated by chloride and/or protein bridges, and there is significant dissolution into Ag ions. The
formation of silver chloride in the stomach complicates ascribing any toxicity observed in oral toxicity
studies conducted with Ag-NPs to their nano-nature. In the small intestine the agglomerates may
revert back to nanoparticles, or nanoparticles may be formed from precipitation of soluble ions exiting
the stomach. The bioavailability of Ag from Ag-NPs is similar or less than from equimolar doses of
soluble Ag.
Significant increases in tissue Ag concentrations are observed after gavage administration of Ag-NPs.
Whether this is the result of absorption of the NPs or Ag ions is unknown. However from in vitro
studies it appears the nano-size facilitates passage across cell membranes and lysosomal uptake, the
lysosome acidic environment releases Ag ions which then cause cellular toxicity.
Once absorbed the Ag from Ag-NPs is widely distributed to tissues. It is uncertain whether Ag
containing particulates found in tissues are from the dosed Ag-NP or have been formed by
precipitation of soluble Ag within the cells.
Short or long term dietary investigations with Ag-NPs are not available. Gavage dose studies using
traditional toxicological endpoints indicate potential effects in liver, kidney and spleen. These effects
are qualitatively similar to those observed with Ag salts, and in some studies are less severe. Both

Page 9 of 106
Ag-NPs and Ag salts affect many biochemical parameters, when they have been investigated,
however the toxicological significance of some of these biochemical changes is obscure.
• NOAELs from 28-90d gavage studies using traditional toxicological assessments with Ag-NPs
are 0.5 to ~500 mg Ag/kg/d.
• Special gavage studies (14d – 28d) investigating changes in brain biochemistry, inflammatory
responses, or sperm development show effects with doses ≤ 2.25 mg/kg/d.
Tentative margins of exposure between gavage NOAELs (0.5 – 500 mg/kg bw/d) and high end
human dietary exposure estimates for Ag (i.e. ~0.4 µg/kg bw/day) are high, in the order of 1,250 –
1,250,000, suggesting low risk of adverse health effects from use of nanoAg as a food additive.
However, there is currently insufficient data to confidently determine if Ag-NPs in food may present a
toxicological hazard to humans at the dietary exposure levels so far estimated. Apart from there being
no chronic studies, the finding that Ag after gavage administration of Ag-NPs has a longer residence
time in the brain than other tissues warrants precaution when undertaking risk assessments.
Neurobehavioral studies are not available. Similarly, research investigations with Ag-NPs showing
potential for sperm abnormalities and delay of puberty onset need consideration. Toxicological data
for reproductive impacts of Ag-NPs are not available. Since the available information indicates the
toxicity of nanoAg is similar to the ionic form, data for Ag salts, if available, may assist with these data
gaps.
In summary:
• Absorption of silver from Ag-NP is likely to be very low. It is not clear whether absorption
occurs as a NP or as soluble silver. Nevertheless the latter is likely to significantly contribute to
absorption.
• Organ distribution of silver is similar after either Ag-NP or ionic silver, but tissue concentrations
appear generally higher for ionic silver.
• Nano-sized precipitates are formed in tissues when silver is administered as nanoparticles or
soluble silver.
• In OECD tests for genotoxicity, Ag-NPs have been negative, which is similar for ionic silver.
At present there does not seem to be any robust scientific evidence indicating nanoAg may pose new
or novel risks that are not observed with ionic silver following oral ingestion. There is however an
incomplete toxicological database for both forms of silver.

Page 10 of 106
Contents Executive Summary ............................................................................................................................. 3 Contents ............................................................................................................................................ 10 Abbreviations ..................................................................................................................................... 11 1. Introduction .................................................................................................................................... 13 2. ADME studies ................................................................................................................................ 14
2.1 General considerations ............................................................................................................. 14 3. Oral toxicity .................................................................................................................................... 16
3.1 General considerations ............................................................................................................. 16 3.2 Animal studies – quality and limitation issues ........................................................................... 18 3.3 Inflammatory bowel disease ..................................................................................................... 21
4. Case studies .................................................................................................................................. 24
4.1 Titanium dioxide (TiO2) ............................................................................................................. 24 4.1.1 TiO2 in food and GIT .......................................................................................................... 24 4.1.2 Absorption .......................................................................................................................... 27 4.1.3 Distribution ......................................................................................................................... 31 4.1.4 Excretion ............................................................................................................................ 33 4.1.5 Toxicity ............................................................................................................................... 33 4.1.6 Conclusions ....................................................................................................................... 37
4.2 Amorphous silica (SiO2) ............................................................................................................ 39 4.2.1 Absorption .......................................................................................................................... 41 4.2.2 Distribution ......................................................................................................................... 44 4.2.3 Excretion ............................................................................................................................ 45 4.2.4 Toxicity ............................................................................................................................... 47 4.2.5 Conclusions ....................................................................................................................... 55
4.3 Nanosilver (nanoAg or Ag-NPs) ................................................................................................ 56 4.3.1 Behaviour in GIT ................................................................................................................ 57 4.3.2 Absorption .......................................................................................................................... 58 4.3.3 Distribution ......................................................................................................................... 59 4.3.4 Excretion ............................................................................................................................ 62 4.3.5 Toxicity ............................................................................................................................... 63 4.3.6 Conclusions ....................................................................................................................... 77
References ........................................................................................................................................ 79 Appendix A: Descriptions of TiO2 toxicity gavage studies ................................................................... 96 Appendix B: Regulatory Aspects ...................................................................................................... 101

Page 11 of 106
Abbreviations ADME: Absorption, Distribution, Metabolism, and Excretion
ALP: Alkaline Phosphatase
ALT: Alanine Transaminase
Ag-NPs: Silver Nanoparticles
AST: Aspartate Transaminase
d: Day
EDX: Energy Dispersive X-ray Spectroscopy
ENM: Engineered Nanomaterial
FSANZ: Food Standards Australia New Zealand
GALT: Gut Associated Lymphoid Tissue
GD: Gestation Day
GIT: Gastrointestinal Tract
GLP: Good Laboratory Practice
GMP: Good Manufacturing Practice
HDC: Hydrodynamic Chromatography
hr: Hour
ICP-AES: Inductively Coupled Plasma-Atomic Emission Spectrometry
ICP-MS: Inductively Coupled Plasma-Mass Spectrometry
kg: Kilogram
LPS: Lipopolysaccharide
mg: Milligram
mL: Millilitre
MPS: Mononuclear Phagocyte System
nanoAg: Nanosilver
NCI: National Cancer Institute
nm: Nanometre
NM: Nanomaterial
NOAEL: No Observed Adverse Effect Level
NP: Nanoparticle
nTiO2: Nano Titanium Dioxide
OECD: Organisation for Economic Co-operation and Development
PBPK: Physiologically Based Pharmacokinetic
PEG: Polyethylene Glycol
PND: Postnatal Day

Page 12 of 106
ppm: Part Per Million
RfD: Reference Dose
RITC: Rhodamine B Isothiocyanate
SAS: Synthetic Amorphous Silica
SEM: Scanning Electron Microscopy
SiO2: Silicon Dioxide
SSF: Synthetic Stomach Fluid
TDI: Tolerable Daily Intake
TEM: Transmission Electron Microscopy
TiO2: Titanium Dioxide
µg: Microgram

Page 13 of 106
1. Introduction Application of nanotechnology in all sectors of food production promises significant benefits in terms
of amounts of food produced, processing advances, food stability and preservation, health promotion
and novelty (NAS 2009, Magnuson et al. 2011). Food Standards Australia New Zealand (FSANZ)
has engaged ToxConsult Pty Ltd to provide a review of potential health risks associated with the
application of nanotechnologies to existing insoluble inorganic food additives; particularly titanium
dioxide (TiO2), amorphous silica (SiO2) and nano-silver (nanoAg). The manner in which the risk
possibly associated with nanotechnology applications in the food sector is managed by international
food regulatory authorities is summarised in Appendix B.
It is worth noting nanostructures occur naturally and are ubiquitously present in food. Dairy and food
containing milk are well known examples (NAS 2009, Magnuson et al. 2011, Priestly et al. 2014,
Aguilera 2014). The gastrointestinal tract has been exposed to nano- and micro-particles throughout
evolution (Powell et al. 2010). In addition, inorganic substances with a portion of their particle size
range in the nano-scale region have been used as food additives for decades. For example, food-
grade amorphous silica (SiO2) used to avoid caking and enhance flowability of powdered food, or as a
carrier for flavourings may contain primary nanoparticles (10 nm) organised in clusters or aggregates
of much larger size (Contado et al 2013, Athinarayanan et al. 2014)1. Food grade titanium dioxide
(TiO2), as raw material used to enhance the whiteness of some foods (e.g. candy and chewing gum)
may have a high proportion (up to approximately 35%) of nanoparticles <100nm (Weir et al. 2012).
ENMs is the term used in this report to distinguish between nanomaterials that are man-made and
purposefully added to food from those that are naturally present or formed during food preparation.
Since the objective is to gain an understanding of possible effects of engineered nanomaterials
1 Contado et al. (2013) discusses the inherent difficulties associated with determining particle size distribution of food grade SiO2, particularly the influence of the dispersive carrier in introducing artefacts. It is difficult to keep the particles well dispersed. Consequentially the relevance of particle size distribution determined for the raw ingredient prior to addition to food is questionable when it is the particle size in food, or gastrointestinal fluid, to which the gastrointestinal epithelium is exposed. SiO2 particles < 50 nm create aggregate sizes far in excess of 100 nm when mixed with food (e.g. instant coffee). This general phenomenon is supported by Weir et al. (2012) who found food-grade TiO2 contained approximately 36% of particles <100 nm that readily dispersed in water as fairly stable colloids. However, filtration of water solubilised consumer products indicated that less than 5% of the titanium was able to pass through 450 nm filters. Athinarayanan et al. (2014) dispersed commercially available silica anti-caking agent (E551) in water using sonication for 30 min, centrifugation (20,000 rpm for 15 minutes) and removed the pellet for characterisation by transmission electron microscopy (TEM). Particle sizing of the pellet powder was measured by dynamic light scattering (DLS) following dispersal in ethanol. The TEM image showed the silica to be 10-50 nm in size, with primary particles aggregated into clusters. Average particle size by DLS was 158 nm.

Page 14 of 106
(ENMs) which are added to the human diet, this report pays greater attention to information obtained
from in vivo investigations rather than in vitro cell culture systems.
2. ADME studies
2.1 General considerations Most absorption, distribution, metabolism and excretion (ADME) studies with nanoparticles (NPs)
have not followed the nanomaterial per se through these biological processes. Very few studies have
been conducted in humans, hence information obtained in animals, primarily rodents, is generally
assumed to be applicable for humans2.
For a variety of reasons it is difficult to identify and measure ENMs in biological fluid or in tissues.
Consequently there is overwhelming reliance in the literature on using a biomarker to track the fate of
a NP after administration to an animal. For example, the metal ion is measured in food (Weir et al.
2012), serum or tissues if the NP is a metal oxide, or occasionally a fluorescent or radiolabel tag that
has been bound to the NP is monitored (Lee et al. 2014a, Fu et al. 2014). Relatively few studies have
tracked the fate of NPs per se via techniques such as transmission or scanning election microscopy
(TEM, SEM). These are arguably the ‘gold standard’ methodologies for determining the presence of
nanoparticles within cells. However a significant disadvantage using these techniques to quantitate
the amount of nanoparticulate in tissue is that it is very labour intensive to find particles in cells and
count them in sufficient cells to obtain a meaningful result.
Interpretative problems arise if only total metal measurement is used to deduce the ADME fate of
ENMs after oral administration to animals. In addition the relevance of high doses often used in
toxicity studies relative to exposures via the human diet is obscure. Difficulty is also encountered
when apportioning causation for any potential adverse effect that may be observed in toxicity studies;
is the effect due to the NP per se or the metal ion?
NPs are difficult to maintain as pristine individual particles. They have a strong tendency to clump
together as agglomerates3 or aggregates and surfactant stabilisers are required to maintain a
2 Effects observed in animals are considered to be relevant to humans unless demonstrated otherwise. Quantitative extrapolation of dose response data from animals to humans for deriving tolerable daily intakes (TDIs) incorporates potential species differences and application of uncertainty factors. 3 Primary particles, i.e. pristine individual particles that are not aged but are as manufactured, characteristically agglomerate to larger units (agglomerates) by adhesion (weak physical interactions). Agglomerates are an

Page 15 of 106
minimum aggregation state for toxicity studies. In animal gavage experiments, preparations of NPs,
whether in water or a viscous carrier such as methyl cellulose, significant energy (in the form of
ultrasonication) is required to produce a suspension of reasonably uniform non-aggregated NPs.
Similar to others who have reviewed the literature (Yada et al. 2014), limited information was found on
the behaviour of silver, or titanium dioxide nanoparticles in food matrices (e.g. Peters et al. 2014,
Chen et al. 2013).
Apart from largely being agglomerated/aggregated and potentially binding to food, NMs in the
gastrointestinal tract (GIT) adsorb proteins and glycoproteins to their surface. This corona changes
with different locations in the GIT and, if absorbed into a cell, when within a cell. For example, the
protein corona on metal oxide nanoparticles facilitates cell entry but when trafficked to lysosomes the
protein is enzymatically stripped off and metal ions are released consequent to the lysosome acid
environment (Bhattacharya et al. 2014). The corona provides the biological identity of nanosized
materials which is distinct from their synthetic identity (Walkey and Chan 2012, Monopoli et al. 2012,
Farrera and Fadeel 2015). In biological media, complex and ENM specific coronas rapidly form but
change over time. Rapid corona formation has been found to affect haemolysis, thrombocyte
activation, nanoparticle uptake, endothelial cell death at an early exposure time, extent of uptake by
cells and intracellular location (Lesniak et al. 2012, Tenzer et al. 2013). Even where repulsive ionic
forces exist, soluble ions in the intestines may act as ‘sandwich filling’ elements that allow two equally
charged particles to interact. For example, binding of bacterial lipopolysaccharide (endotoxin) to TiO2
particles is promoted by the presence of calcium ions at typical gut luminal concentrations (Powell et
al. 2000, Ashwood et al. 2007). Binding macromolecules to their surface is the likely mode through
which NMs may act as adjuvants (see Section 3.2).
Since in the lysosome at pH 4.5 -5 (Mindell 2012) metal ions are released from many metal oxide NPs,
it is a reasonable expectation that metal oxide nanoparticles will tend to dissolve in the acid milieu of
the stomach to also form the respective metal ion (e.g. Seok et al. 2013). However, the solubility of
food borne poorly water soluble particles in stomach contents will depend not only on the gastric fluid
conditions but also on other factors such as particle concentration, coating, and the properties of the
assembly of primary particles held together by relatively weak forces, including van der Waals forces, electrostatic forces and surface tension. Nonetheless agglomerates do not easily revert back to the primary particle. Aggregates develop when primary particles begin to form a common crystalline structure, i.e. an aggregate refers to a heterogeneous particle in which various components are not easily broken apart. The surface area of the new particle (aggregate) compared with the sum of the surface areas of the former primary particles is reduced (Walter 2013).

Page 16 of 106
food matrix. For the NPs reviewed in detail Ag-NPs had greater solubility in gastrointestinal fluid than
SiO2-NPs, and TiO2-NPs show little dissolution.
3. Oral toxicity
3.1 General considerations The toxicological effects of NPs added to food can be broadly divided as possible impacts:
• on GIT micro-fauna and nutrient absorption,
• gastrointestinal tissue (i.e. ‘site of impact’ effects), and/or
• systemic effects occurring after a sufficient dose of the NP has been absorbed into lymph or
blood.
Farrera and Fadeel (2015) have proposed that most, if not all of the adverse effects of NPs are
exerted via direct effects on cells of the innate immune system and consequential inflammatory
effects. While there are numerous cell culture experiments showing pro-inflammatory responses
when various particles of different sizes are added to the culture medium, the relevance of these
studies to ENMs added to food is questionable. Krug (2014) notes most ENM samples are not
manufactured and packed under sterile conditions. Many are contaminated with small amounts of
endotoxins. Thus investigations studying the release of inflammatory mediators as markers of
potential hazard may be reporting false-positive results with respect to the ENM because endotoxins
produce exactly the same response. This is particularly applicable to in vitro studies and is an aspect
of inadequate ENM characterisation.
As noted previously, the particle size distribution of ‘fine’ grade bulk materials includes nano-size
particles (see also Sections 4.1, 4.2 and 4.3). Many of which have been used in food production for
decades but to date public health impacts have not been reported with use of these materials. That
may be because they have not been undertaken.
In relation to inhaled nanoparticles, a review of the available data by Donaldson and Poland (2013)
concluded there is no evidence that particles below 100 nm, the threshold definition of a NP, show
any step-change in their hazard meaning, that there is no evidence of novel ‘nano-specific hazard’.
In addition, there is no reason to presume that ingested nanoparticles would show novel toxicity when
the evidence doesn’t suggest nano-novelty when they are inhaled. The extensive review by Krug
(2014) reached the same conclusion, i.e. the available evidence on the toxicology of ENMs does not

Page 17 of 106
show unique nano-related toxicity. Therefore conventional particle toxicology data are useful and
relevant to the determination of the nanoparticle hazard.
Effects on micro-fauna and nutrient absorption:
Few studies were located in which NP effects on gastrointestinal bacteria, the GIT milieu or nutrient
absorption were specifically investigated (e.g. Williams et al. 2014). However theoretical adverse
effects arising from these actions would primarily be related to:
• Altered faecal character manifested as diarrhoea or constipation.
• Changed food utilisation (inclusive of digestion and/or absorption of nutrients). Well
conducted standard feed studies in experimental animals will/should identify food
utilisation/conversion issues and faecal changes.
• Immunological effects initiated by:
o Exposure of unusual allergens as a result of ENM interaction with a food constituent
revealing new epitopes. No data were found to support this hypothesis.
o Release of allergens from bacteria affected by the ENM. This notion is explored in
Section 3.3.
Gastrointestinal tissue effects:
Logically the mode of action leading to ‘local’ GIT tissue effects could be direct irritation/cytotoxicity, or
immunological as discussed above and in Section 3.3.
Standard safety tests for irritation/corrosion, and acute/repeat dose gavage studies in which
histological evaluation of gastro-intestinal tissue is undertaken will inform if the NP is likely to have
direct effects on gastrointestinal tissue.
Systemic effects:
Systemic effects of NPs added to food will depend on the extent of absorption of the NP, or its
constituents, from food and the intrinsic biological activity, if any, of the NP. Most of the research on
the oral safety of NPs conducted to date has been acute or short term exposure toxicity rather than
chronic exposure and morbidity. The majority of oral toxicity studies have been conducted in rodents
with gavage administration, rather than in diet. Apart from the well-known issues that may arise from
high bolus doses, these studies are not reflective of human exposure in food where the characteristics

Page 18 of 106
of the NP particles/aggregates may be quite different from the material used in the gavage
experimental animal investigations. An overview of the quality, limitations and relevance of animal
toxicity studies is provided in Section 3.2.
The review by Krug (2014) concluded:
• Some ENMs can pass the gastrointestinal tract at high oral doses.
• However, only a very small fraction of the applied dose reaches the bloodstream and is
distributed in the body to secondary target organs.
• Systemic effects have been observed in only a small number of studies, but these results
have not been found to be related to a specific “nano effect” of the ENMs because of flaws
within the study design or uncertainties in the conclusions (see below).
Krug (2014) also indicates it is frequently disregarded that specific nano-metal oxides can dissolve in
body fluids. This implies a more general element related toxicity may be responsible for the observed
effects (see Section 4.3).
3.2 Animal studies – quality and limitation issues Card et al. (2011) appraised the published literature available at the time on the safety and toxicity of
food related nanomaterials. After an exhaustive literature search relatively few relevant studies were
identified4. These were scored for overall quality using a two-step method (Card and Magnuson 2010)
that determined the reliability of the study design and the extent of nanomaterial characterisation
within each study.
• The first step used a publicly available tool5 to rank the reliability of the study based on
adequacy of design and documentation of methods, materials, and results, providing a ‘‘study
score’’.
4 Card et al. (2011) found 11,172 titles in their literature searches, however only 30 primary research articles (0.27%) were identified that contained information relevant to the oral safety of potential use of nanomaterials in food or the food industry. There were 21 in vivo and 9 in vitro studies. 5 The tool used by Card et al. (2011) is ToxRTool. It is software designed, tested, and released for public use by the European Centre for the Validation of Alternative Methods (ECVAM). It is freely available for non-commercial use at the ECVAM Web site (http://ecvam.jrc.it/; ‘‘Publications’’ section). The tool is based on the system proposed by Klimish et al. (1997) for categorising toxicological and ecotoxicological data. Its development and testing of the ToxRTool is described in detail by Schneider et al. (2009). Studies considered reliable without restriction are assigned a score of “K1,” those considered reliable but with restrictions are assigned a score of “K2,” and those regarded as unreliable are assigned a score of “K3.” These assignments are determined automatically by spreadsheet in response to a series of yes/no questions. If the evaluator disagrees with the calculated score, there is an option to amend the score but is expected to provide justification in the spread sheet so it can be shared with others.

Page 19 of 106
• The second step involved assessing the completeness of the nanomaterial physicochemical
characterisation. A ‘nanomaterial score’ was assigned to the study according to
characterisation against a list of ten parameters6. It was stressed that characterisation of
nanoparticles in the relevant experimental media (cell culture media, dosing solution, etc) was
an important issue.
Of the 21 in vivo studies evaluated by Card et al. (2011), 20 were in rodents, 15 were lacking in some
critical component of study design (e.g. oral gavage dose volume was not reported), none was longer
than 90 days in duration, and only seven reported more than five physicochemical parameters for the
nanomaterial(s) being evaluated. Due to the limited number of studies and the lack of complete
characterisation of the nanomaterials studied, the authors concluded it was not possible to derive any
overall conclusions regarding the toxicity of nanomaterials for food use. Most of the studies assessed
by Card et al. (2011) were for NPs that were not poorly soluble inorganic materials, were not related
to the actual food processing, or were investigating delivery of dietary supplements and hence of little
relevance to this review.
The authors concluded their evaluation indicated there was insufficient reliable data to allow clear
assessment of the safety of oral exposure to food-related nanomaterials.
An extensive recent review from the Swiss Federal Laboratories for Materials Science and
Technology (Krug 2014) of many 1000’s of published papers has questioned whether the exponential
rise in publications dealing with the toxicology of nanomaterials is providing the right information for
assessing their safety. The following overall statement was made “Most of these studies, however, do
not offer any kind of clear statement on the safety of nanomaterials. On the contrary, most of them are
either self-contradictory or arrive at completely erroneous conclusions.” Previous reviews have also
determined the majority of nano-toxicology studies in the scientific literature, although potentially
providing mechanistic information are not reliable or usable for assessing health risk by regulatory
agencies (Krug and Wick 2011, Hristozov et al. 2012). For example, Hristozov et al. (2012) found the
available nanotoxicology information stored in online chemical databases was very scarce, often not
properly referenced making their origin unclear.
6 Six sources from academics and scientific organisations which had made recommendations regarding which nanoparticle parameters should be measured were reviewed. The parameter list for the ‘nanomaterial score’ used by Card et al. (2011) was created if at least 3 of the 6 sources recommended the parameter be measured. To this list was added a requirement for characterisation in the test medium (Card and Magnuson 2009, 2010).

Page 20 of 106
The variety of experimental design, dose selections and number of variables in animal nano-toxicity
studies makes comparison between studies difficult and for most studies inappropriate. Regulatory
assessment of chemical hazards, including safety assessment of ENMs, is best done using results
from standard test protocols and tests conducted according to GLP. Compared to publications
produced by academic research, results from Organization for Economic Cooperation and
Development (OECD) test guideline studies are arguably the most reliable for conducting regulatory
risk assessments7.
Warheit and Donner (2015) argue the presence of significant publication bias in the area of nano-
toxicology. They contend some single investigation studies report specious toxicity findings, which
make the conclusions more alarming and attractive and publication worthy. In contrast, the
standardised, carefully conducted, ‘guideline study results’ are often ignored because they can
frequently report no adverse effects.
In assessing studies for this review the following limitations have been noted and should be taken into
account when evaluating applicability of the data for assessing human safety:
• The majority of studies have not been conducted to recommended regulatory guidelines.
• Many are single dose studies with limited or no dose response characterisation.
• Studies are mainly oral gavage and not dietary.
• Often high doses, orders of magnitude higher than expected human dietary exposures, were
employed.
• Test materials are often poorly characterised with respect to what is actually administered to
animals.
• Often small numbers of animals have been evaluated and often only one gender.
• For studies that have reported unexpected findings, appropriate controls have generally not
been included in the experimental design (e.g. ionic or conventional bulk material).
• The test material is not relevant to that likely to be used in foods.
• Assessment of effects has been limited to a single or just few organ/tissue analyses. The
absence of other organ evaluations makes it difficult to place the reported findings in the
appropriate toxicological and pathologic perspective.
7 This is a general truism for regulatory use of toxicological data for safety assessment (e.g. FSANZ 2014, 2016; NICNAS 2016, APVMA 2016, enHealth 2012, FAO/WHO 2010). This is because OECD test guidelines stipulate study protocols and endpoints to be evaluated. In addition, amongst other things, there are well defined reporting requirements. These necessities provide consistency such that data from different studies are readily compared. These official requirements are not necessarily part of studies from academic institutions.
Page 21 of 106
• For publications from research laboratories the analyses may be limited to techniques
available in the testing laboratory, and may not be the most appropriate.
• For metal oxide ENMs, the analytical techniques for ENM tissue quantitation are generally not
reliable to separate elemental form or nanoparticle. Hence it is difficult to determine whether
reported effects are due to the metal ion or ENM.
• Methods for detecting nanoparticles not suitable for quantification; even if they can
qualitatively detect some particles in tissues.
• There are some marked discordances in reported studies; some show no effects at very high
doses while others report adverse effects at comparatively very low doses.
• There is apparent discordance between reported very limited absorption of ENM in ADME
studies but some toxicological studies suggest gross histological effects.
The above brief discussion on the quality and limitations of the animal toxicity studies needs to be
kept in mind when reading the sections of this report dealing with nTiO2, nSiO2 and nanoAg, and
when evaluating the data for assessing human safety. In the summaries of the toxicological
databases for individually reviewed ENMs within this report (Section 4), study limitations and
information needs which could potentially reduce the uncertainty with respect to the conclusions made,
have been briefly mentioned where relevant.
3.3 Inflammatory bowel disease Since the late 1990’s it has been hypothesised by a group of UK researchers8 that the presence of
fine and ultrafine particles9 in food influences gastrointestinal tract mucosal immune response in a
way that, in susceptible persons, initiates or exacerbates inflammatory bowel disease, particularly
Crohn’s disease (Evans et al. 2002, Powell et al. 2000; 2010, Lomer et al. 2002).
The aetiology of Crohn’s disease is not fully known. However, it is appreciated genetic and
environmental factors are involved. A number of intestinal epithelial cell mutations, leading to
defective inflammasome/autophagy activity, have been identified that appear to make a person prone
to developing the disease (Lomer et al. 2002, Powell et al. 2010, Lerner 2012). Environmental factors
are centred on particulates that may act as adjuvants to enhance macrophage pro-inflammatory
8 Powell, J.J. and Lomer, M.C.E. and collaborators. 9 Fine and ultrafine particles are defined by the research group investigating the possible link with inflammatory bowel disease as 0.1–1.0 μm and < 0.1 μm diameter respectively.

Page 22 of 106
signalling immune responses to lipopolysaccharides (LPS), and which may result in loss of the normal
tolerance to enteric microbes (Lerner 2007, Powell et al. 2007). Exogenous food related particulates
considered in the hypothesis are nano- and ultra-fine TiO2 or silicates; however a role for aluminium in
environmental particulates is also being investigated (Perl et al. 2004, Lerner 2007; 2012). In relation
to food related particulates and development/exacerbation of Crohn’s disease:
• In humans, inorganic micro-particles containing Ti, Si, Mg and Al have been found in basal
‘pigmented cells’ of Peyer’s Patch. This however is a normal occurrence throughout Western
populations and not confined to GIT disease states, the source of these particulates is likely
environmental dusts (e.g. Shepherd et al. 1987, Urbanski et al. 1989, Powell et al. 1996). In
addition, there is no evidence for differential phenotype or activation of the macrophage
pigmented cells in differing disease states, including Crohn’s disease (Thoree et al. 2008).
This doesn’t support an association between the presence of pigmented cells and Crohn’s
disease.
• The generalisation that particulates per se, in a variety of occupational (inhalation) or
experimental in vivo or in vitro circumstances can invoke inflammatory responses10 has led to
investigations for their possible role in inflammatory bowel disease (e.g. Evans et al. 2002,
Powell et al. 2010).
• A pilot study in which patients with active Crohn’s disease were given a diet low in calcium and
exogenous microparticles resulted in significant alleviation of symptoms and activity of the
disease (Lomer et al. 2001; 2002). However, assessment of dietary inorganic microparticle
intake in Crohn’s disease patients showed no differences compared with controls (Lomer et al.
2004a). The same group later conducted a much larger single-blind, randomized, multicentre,
placebo controlled dietary trial that was adequately powered and carefully undertaken. No
evidence was seen to indicate that reduction in dietary microparticle intake assists remission
of active Crohn’s disease (Lomer et al. 2005).
The UK group have been investigating the impact of TiO2- LPS conjugates on the innate immune
response in the gastrointestinal tract. They have shown that while TiO2 particulates11 on their own are
not immunogenic, when calcium and LPS are adsorbed onto the surface the resulting particle is
significantly immuno-stimulatory. Peripheral circulating blood mononuclear cells were markedly
reactive but colonic tissue explants from patients without inflammatory bowel disease were much less
10 See SafeWork (2009, 2015) for numerous examples where an inflammatory response has been elicited by inhaled nano- or fine-particulates or in many different types of cultured cells. 11 TiO2 particulate mean diameter 0.2µm.

Page 23 of 106
so (demonstrating intrinsic tolerance of intestinal cells to bacterial endotoxins). Tissue explants from
patients with Crohn’s disease or ulcerative colitis were surprisingly unresponsive. On the other hand,
macrophages isolated from the intestinal lamina propria12 were responsive to the TiO2-Ca++-LPS
particle, the extent of response was roughly proportional to the extent of disease activity in the donor.
Calcium phosphate particles, as hydroxyapatite13, also caused a similar response in these harvested
cells. Overall the data has led the UK group to conclude TiO2, and by extension other insoluble dietary
particles, could act as adjuvants to augment gastrointestinal immune responses to bacterial
endotoxins (Powell et al. 2000, Evans et al. 2002, Ashwood et al. 2007, Butler et al. 2007).
However, since the late 2000’s these researchers have published little experimental data relating to
the ‘dietary exogenous particulate’ hypothesis for development/exacerbation of Crohn’s disease.
Instead they now appear focussed on dietary insufficiencies in active inflammatory bowel diseases, or
investigating the normal function of endogenously formed calcium phosphate particles (e.g. Lomer et
al. 2011, Pereira et al. 2014; 2015, Powell et al. 2013a, 2013b, 2014).
The ‘dietary exogenous particulate’ hypothesis and early work of the UK researchers is widely cited
as indicating ENMs, particularly TiO2, added to food may promote the development of Crohn’s
disease (e.g. Buzea et al. 2008, Mahler et al. 2012, FOE 2014). Although the immune-stimulatory
properties of TiO2-Ca++-LPS have been demonstrated in vitro, and a case for anthropomorphic fine-
particles that are added to food to be potential adjuvants has been made, data were not found for this
review showing this phenomenon occurred in vivo. It is also noted the particulate-Crohn’s disease
hypothesis is inclusive of particulates that may be generated endogenously in the GIT (e.g.
precipitated calcium phosphate) and a pivotal role for aluminium adjuvants in Crohn’s disease is
cogently argued (Lerner 2012). Indeed, various studies have shown a range of food constituents to be
associated with Crohn’s disease; included are higher dietary intake of sucrose and refined
carbohydrates and a reduced intake of fruit and vegetables, high intake of ω-6 fatty acids but low
intake of ω-3 fatty acids. Smoking is positively associated with Crohn's disease but negatively with
ulcerative colitis (Mahmud and Weir 2001). Clearly the aetiology of inflammatory bowel diseases is
complex.
12 The lamina propria is loose connective tissue in mucosa. It supports the mucosal epithelium and allows the epithelium to move freely with respect to deeper structures. It also contains macrophages and therefore provides for immune defence. 13 Hydroxyapatite is a mineral form of calcium hydroxy phosphate. It makes up the bone mineral and matrix of teeth.

Page 24 of 106
It is concluded a potential link between anthropomorphic inorganic nano- or ultra-fine particles added
to food and the development/exacerbation of Crohn’s disease in persons rendered susceptible by
genetic changes has not been reasonably established. It is still a hypothesis. Much more additional
research is required to equitably determine whether TiO2, silicates, or dietary microparticles in general
have a cause and effect relationship in the pathogenesis of Crohn’s disease, or other inflammatory
bowel diseases, in genetically susceptible subjects.
4. Case studies
4.1 Titanium dioxide (TiO2)
4.1.1 TiO2 in food and GIT Titanium dioxide (TiO2) is naturally occurring, it is an insoluble, relatively inert material. TiO2 has been
used as a pigment for food colouring for decades. In Australia, it is approved for use in processed
foods to Good Manufacturing Practice (GMP). It is also approved for use as a food colouring (E171) in
Europe (EC 1994), by the Codex Alimentarius of the FAO/WHO (EFSA 2004a), and in the US at
concentrations up to 1% w/w without the need to include it on the ingredient label (FDA 2015).
Although the nano-form of TiO2 is not an approved additive for food, the grade used in food may
contain up to approximately 36% of particles in the nanoscale (Weir et al. 2012). Therefore the
presence of ‘nano-TiO2’ in food is not a new phenomenon. The Joint WHO/FAO Expert Committee on
Food Additives (JECFA 1969) evaluated TiO2 and concluded studies in several species, including
humans, do not show significant absorption or tissue storage following ingestion. They considered the
establishment of an acceptable daily intake unnecessary due to the substance’s inertness (JECFA
1969).
Specifications for TiO2 use in food do not include particle size, however the grade of TiO2 that is used
may contain up to approximately 36% nanoscale particles (<100nm) (Weir et al. 2012). More recently
Peters et al. (2014) examined seven food grade TiO2 materials using three different methods and
found all had similar size distributions. The primary particle size range was 60 – 300nm, and
depending on the analytical technique 10 – 15% were <100nm. Periasamy et al. (2015) identified that
food additive TiO2 had particulates of 40 – 200 nm but many were aggregated. These authors did not
provide the proportion of TiO2 that was in the nano-scale.

Page 25 of 106
Despite being used in food products14 for a long time, the extent of systemic uptake after ingestion,
and biokinetic behaviour of TiO2 nanoparticles in humans is not known. In food: Although the raw food grade TiO2 may have a high percentage of nano-form, TiO2 extracted from food
may have either low (Weir et al. 2012) or high (Chen et al. 2013) proportion as nano-TiO2. An
uncertainty regarding food TiO2 particle size determination is how the methods15 used for the TiO2
extraction/isolation and size characterisation may have influenced the results.
In contrast to the high nano-content of TiO2 added to food, the data from Weir et al. (2012) imply very
little16 of the TiO2 in a range of food products is nano-scale.
Using a water, acetone and ethanol washing procedure, Chen et al. (2013) determined a piece of
chewing gum from six leading international brands contained on average17 2.4–7.5 mg TiO2 and up to
93% of this was <200nm. This was readily extracted since after 10 – 30 minutes chewing only
approximately 5% of the Ti was left in the gum. However, after 30 minutes incubation of chewing gum
in simulated human saliva, gastric or intestinal fluid, the extracted nano-TiO2 was significantly
agglomerated, only ~10 – 30% was <200nm. Based on the TiO2 extracted from different gum
samples not causing cytotoxicity to cultured human gastric epithelial cells (GES-1 cells) or human
epithelial colorectal adenocarcinoma cells (Caco-2 cells) at concentrations as high as 200 µg/mL, the
authors concluded risk to the consumer was low.
Peters et al. (2014) found that when TiO2 was present in food, 5 – 10% of the TiO2 particles were
<100 nm which was a similar proportion as found in the raw food grade material. Although chewing
14 Foods with the highest content of TiO2 included candies, sweets, and chewing gums (Weir et al. 2012). 15 How to characterise engineered nanomaterials in food is challenging. Chen et al. (2013) developed a system of dissolution of the food, separation of the TiO2 by centrifugation , purification of the pellet by washing with water, acetone and ethanol. The TiO2 was measured by ICP-AES. Morphology and size of the particles was determined with TEM and SEM. Weir et al. (2012) digested organic material from the TiO2 with hydrogen peroxide and nitric acid. Following filtration through 0.45 µm filters the Ti content was measured with ICP-MS. Particle size was characterised with SEM and dynamic light scattering (DLS). It is not clear how, or if, either of these techniques may have altered the particle size of the TiO2 in food. 16 After solubilising food products with hydrogen peroxide and nitric acid Weir et al. (2012) found less the 5% of the Ti in food was able to pass through 0.45 or 0.7 µm filters. 17 Limit of detection for Ti was not specified by Chen et al. (2013).

Page 26 of 106
gum had variable Ti content18, chewing gum and toothpaste had the highest Ti content of products
tested with ~100% of TiO2 particles in chewing gum <600 nm. Periasamy et al. (2015) also found
similar results for the size of TiO2 in chewing gum and as in food grade TiO2.
Based on analysis of 89 foods and Monte Carlo analysis of food group intake19 Weir et al. (2012)
estimated typical exposure for a UK adult may be 0.2 – 0.7 mg TiO2 mg/kg/d but up to 2 mg TiO2
mg/kg/d for children under the age of 10. Since it was not explicitly stated that this exposure from food
was for nano-TiO2 it is presumed it is for total TiO2. Exposure to TiO2 depends largely on dietary
habits, so in some cases a person’s ‘typical’ exposure may be higher than these estimates. Bachler et
al. (2014) estimated similar median exposures of Ti for all age groups and children in Germany. Chen
et al. (2013) determined the swallowed dose of nano-TiO2 per piece of chewing gum was
approximately 1.5 – 7 mg depending on the brand. Powell et al. (2010) estimated the overall dietary
intake of TiO2 in the UK was ~5mg/person, age not mentioned. It would not be unreasonable to
assume exposure of Australians would be of similar order. These intakes can be used to
contextualise TiO2 doses administered to experimental animals in kinetic, investigative toxicology and
safety studies.
In the GIT:
• The behaviour of nano-TiO2 appears to be different from that of some other metal-oxide
nanoparticles such as nano-ZnO and nanoAg. In simulated acidic gastric juice nano-TiO2
showed minimal dissolution after 24 hours incubation but nano-ZnO dissolved after 5 minutes
(Cho et al. 2013).
• Similar to Chen et al. (2013), Jones et al. (2015) found nano-TiO2 particles agglomerated in
simulated gastric fluid, particularly the smaller particles. Nonetheless, approximately 13% of
the 15 nm particles remained in the nano-form after 1 hour incubation. It is stated further
agglomeration was observed when dispersing formulations in polymeric or elemental food
matrices but data were not provided.
18 Limit of quantification for Ti in food was 0.01 mg Ti/g product (Peters et al. 2014). 19 The instrument detection limit for Ti in foods was not provided by the study authors, but if assumed to be similar to that in pharmaceuticals, was likely to be in the order of 0.0001 µg Ti/mg food (Weir et al. 2012). The authors created two human dietary exposure scenarios using statistical consumer intake data from the National Diet and Nutrition Survey in the UK for different food categories together with point values for measured TiO2 concentrations in foods for the UK from Lomer et al. (2000) and the United States (analysed and reported by Weir et al. 2012). The aggregate exposure distribution was calculated probabilistically by combining the single exposures via Monte Carlo simulations (100,000 steps) (Weir et al. 2012). Overall the estimates generated by Weir et al. (2012) are in general agreement with other estimates in the literature.

Page 27 of 106
The literature search for this review did not locate any reports in which the ADME or toxicology of
nano-TiO2 was studied when exposure was in the diet. The oral studies have been conducted by
gavaging animals with varying size TiO2 suspended by ultrasonication in water or methyl cellulose. It
is also noted that much of the available toxicological information has not been derived from studies in
which it had been identified food grade TiO2 was used.
4.1.2 Absorption ADME studies in rats with five types20 of TiO2 found no or low absorption after oral dosing21 (OECD
2015). The percentage absorption was not quantitated.
In their evaluation of the safety of TiO2, JECFA (1969) concluded that in several species including
humans TiO2 is very poorly absorbed following ingestion. Although doses tested were not always
reported, in one human study they were approximately 70 mg/kg bw22 and in rats around 660 mg/kg
bw (in rats, the grade of TiO2 tested was not reported). EFSA (2004a) reviewed an additional recently
conducted unpublished study in rats evaluating the absorption, distribution and excretion of four
grades23 of TiO2 administered in the diet at doses of 30 mg/kg bw/d for 7 days. EFSA (2004a)
20 The five different nano-TiO2 materials included Aeroxide®P 25 (P25, NM105, anatase/rutile mixture), PC105 (JRC No. NM102, anatase), Hombikat UV 100 (NM-101 TiO2), UV TITAN M212 (JRC No. NM104, rutile), and UV TITAN M262 (JRC No. NM103, rutile). An additional non-nano reference material (Tiona AT-1, JRC No. NM100, anatase) was also included. 21 The various dispersed TiO2 NMs were administered by gavage to Wistar rats at a dose of 10.2-11.4 mg/kg bw/d (male) and 13.1-15.2 mg/kg bw/d (female) for 5 consecutive days, after which various tissues (blood, spleen, liver, lungs, kidneys, heart, skin, muscle, bone, bone marrow and mesenteric lymph nodes) were analysed for Ti concentration by High-Resolution Inductively Coupled Plasma Mass Spectrometry (HR-ICP-MS) or Inductively Coupled Plasma Optical Emission Spectroscopy (ICP-OES). In a follow up study performed under identical conditions with either vehicle or NM102, the small and large intestines were also collected and analysed. There was no evidence for uptake of NM101, 102 or 103. Slightly higher uptake was observed with NM104 and 105, in the liver and/or spleen. Only marginally higher concentrations of Ti were found in the GIT of rats exposed to NM102 than controls, which the authors of the study state indicates fast and almost complete elimination of Ti in faeces. 22 JECFA (1969) describes a study in five male volunteers who ingested 5,000 mg of food grade TiO2 (i.e. approximately equivalent to 70 mg/kg bw assuming a 70 kg body weight for male adults) suspended in milk on three consecutive days. No detectable change in urinary Ti levels was detected, indicating the absence of any significant absorption of titanium. 23 The grades tested were: 1) rutile TiO2 (thick platelet), 2) rutile TiO2 (thin platelet), 3) rutile TiO2 (amorphous), and 4) anatase TiO2 (amorphous). Whether the TiO2 was food grade was not reported by EFSA (2004a), however it was noted the rutile grade was similar in structure to that used in the carcinogenicity study by Bernard et al. (1990).

Page 28 of 106
concluded there was no accumulation of titanium in tissues in the study, and there was essentially no
difference in the systemic absorption of the four forms of TiO2 following dietary administration.
o There have been mixed results regarding absorption of nano-TiO2 from the GIT in humans
(Bockmann et al. 2000, Jones et al. 2015) and animals.
o Some studies with rodents have shown nano-TiO2 to be absorbed after gavage administration
into the systemic circulation24 but there is no obvious correlation with particle size (Jani et al.
1994, Wang et al. 2007, Gui et al. 2011, Sang et al. 2013).
o Other studies have observed no increases in blood or tissue Ti concentrations (Cho et al.
2013, Wang et al. 2013, Geraets et al. 2014, Janer et al. 2014, MacNicoll et al. 2015).
It is difficult to determine why there are differences in the animal experimental literature on the extent
of absorption of ingested nano-TiO2. Studies identified in the literature search investigated the
absorption and toxicity of nano-TiO2 after gavage exposures, with the nano-TiO2 delivered in
ultrasonicated water or methyl cellulose suspensions. In addition to the characteristics of the nano-
TiO2, analytical sensitivity, whether exposure was in a fasting state, the size of the dose, and whether
there were single or multiple bolus doses, are important variables. High doses potentially allow
changes in systemic tissue Ti concentrations to be measurable even if only very low proportions of
the dose have been absorbed. There is however a general consensus that if nano-TiO2 is absorbed
from the GIT, it has very low oral bioavailability.
In humans,
• Bockmann et al. (2000) demonstrated Ti blood concentrations25 increased 2 – 8 fold after a
single dose (22.9 or 45.8 mg) of 160 or 380nm TiO2 in gelatine capsules to fasted male
volunteers.
• On the other hand Jones et al. (2015) did not observe increases in blood or plasma Ti after
ingesting different sized26 (15nm, 100nm and <5µm) TiO2 particles at higher human doses
24 Absorption was implied through finding measurable levels of Ti in various tissues not in direct contact with the lumen of the gut. 25 In Bockmann et al. (2000) normal human Ti blood concentrations were 11.2 ± 4.09 µg/L (n = 5) measured with inductively coupled plasma-atomic emission spectrometry (ICP-AES). Blood samples were taken out to 24 hr, maximum Ti concentration increases occurred 0.5 – 10 hours after ingestion. With a dose of 22.9 mg the maximum blood concentration was 43.2 ± 4.52 µg/L (n = 5). Doubling the dose (n = 2) did not result in twice the absorption. Body weights were not provided so dose as mg/kg could not be determined, AUCs were not calculated. Although the TiO2 capsule was given with 200 mL warm water before breakfast (i.e. in a fasted stated) it is not indicated how soon after dosing food was taken.

Page 29 of 106
(315 – 620 mg/person) than used by Bockmann et al. (2000). In the Jones et al. (2015) study
volunteers received a single dose (5 mg/kg) dispersed in water, none of the volunteers
showed typical absorption (via blood and plasma analysis) or elimination (urine analysis)
profiles, and there was no difference in measurements between pre- and post-dose TiO2
administration. The authors concluded the volunteer studies demonstrated very little TiO2 was
absorbed and there was no demonstrable difference between any of the three particle sizes
tested. It is not stated whether persons were fasted before dosing.27
A study often cited as demonstrating nano-TiO2 is absorbed from the GIT is Wang et al. (2007). This
investigation in mice given a gavage dose of 5,000 mg/kg (80, 25 and 155nm [i.e. fine] TiO2) found Ti
systemic tissue levels significantly increased. Overall the results do not point to important size
dependent difference (i.e. large vs small) in the spectrum of TiO2 adverse effects. Bachler et al. (2014)
using a PBPK model estimated the extent of absorption of Ti from this study was 0.060 ± 0.034% for
both 20 and 80 nm particles. The EU Scientific Committee on Consumer Safety (SCCP 2014) made
the following comments regarding Wang et al. (2007). “The study has a number of flaws, and is
therefore of little value to this assessment. Sufficient characterisation of the nanomaterials used was
not carried out, the administered dose (5 g/kg/bw) was very high, frequent oesophageal ruptures were
reported that led to animal deaths, translocation of TiO2 from GI tract was measured as titanium with
no evidence that it was in nanoparticulate form. It is not clear whether any of the effects observed
were due to TiO2 toxicity, or simply overloading the gut at high dose of the particulate material”.
At various times (15, 30, 45, 60, 75 and 90 days, n = 20/time) after initiating gavage dosing (10
mg/kg/d) of nano- TiO2 (5 – 6nm) to mice, Sang et al. (2013) showed progressive time related
increases in spleen Ti content. Severe splenomegaly was observed; histological changes included
lymphocyte proliferation, macrophage infiltration, fatty degeneration, and cell necrosis in the spleen.
The extent of histological changes approximately correlated with spleen Ti content which significantly
26 Particle size characterisation with centrifugal sedimentation and TEM. Ti in blood, serum, urine or cell culture medium was determined by ICP-MS. Volunteers were 30 – 56 yrs old, weight 63 – 124kg hence dose per person was 315 – 620 mg. 27 Apart from the different modes of administration, it is unclear why the Bockmann et al. (2000) and Jones et al. (2015) studies showed quite different results of Ti absorption from orally administered TiO2. Particle size does not appear to be a factor, it is possible the fasting state of volunteers in the Bockmann et al. (2000) study could have influenced absorption but this is unknown. Bockmann et al. (2000) is a German language publication with limited experimental detail and result reporting. Jones et al. (2015) characterised the administered TiO2 and carefully followed the plasma profile in subjects at many time points for 100 hours. Bockmann et al. (2000) do not appear to have characterised the administered TiO2. Overall the Jones et al. (2015) study is the better reported and returned results consistent with animal data showing very low GIT absorption.

Page 30 of 106
increased with the length of exposure, during this time body weight gain was significantly reduced. As
did increased levels of PGE2, COX-2 genes, and their protein expression. Similarly with increased
exposure duration, nano-TiO2 markedly increased the levels of AP-1, CRE, c-Jun, and c-Fos genes
and their proteins according to the period over which the nTiO2 was administered. In summary the
gavage administration of TiO2 nanoparticles resulted in increased spleen Ti content, increased
production of reactive oxygen species, time-dependent splenic inflammation, and necrosis. In this
study anatase nTiO2 was prepared ‘in house’ at the Chinese institution and was well characterised in
the medium in which it was given to mice. It is noted the crystalline particle size was very small and
the nTiO2 is likely not representative of TiO2 currently used as a food additive, nor of commercial
nTiO2 should it be used in food. Only female mice were dosed and only the spleen examined. While
gene expression changes in the spleen were well reported, the incidence of histological changes
(fatty degeneration, lymphocyte proliferation or cell necrosis) at each time point is not reported.
Other animal experiments demonstrating potential absorption of nano- TiO2 across the
gastrointestinal epithelium are described in Sections 4.1.3, 4.1.5 and Appendix A.
The extent of penetration of TiO2 across an in vitro model gut barrier28 was very low (0.02 – 0.05%)
with no difference whether the TiO2 was suspended in cell medium or formulated into food matrix
(Jones et al. 2015). Overall, the Jones et al. (2015) study found no evidence that nano-particulate
TiO2 is more likely to be absorbed in the gut than micron-sized particles. Three different commercial
samples of TiO2 were tested with nominal particle size 15nm, <100nm and <5 µm, these were
characterised as 10nm, 70nm and 1.8 µm respectively, with agglomerate sizes in the µm range.
MacNicoll et al. (2015) studied the uptake and biodistribution of nano- and larger-TiO2 in rats and also
in an in vitro model of gut epithelium29. Rats were gavaged with 4.6 mg/kg TiO2 (anatase or rutile in
either deionised water or 5% ovalbumin) of various measured sizes (40, 120 and <5,000nm). No
significant differences between TiO2 treatments were observed for measurement of blood and
systemic tissue Ti concentrations. Oral administration of TiO2 nano- (or larger) particles did not lead
to an increase of Ti in blood, urine, or distribution to liver, kidney, spleen, heart, or brain at any of the 28 The in vitro model gut barrier of Jones et al. (2015) was a monolayer (with tight cell junctions) of colorectal adenocarcinoma cell line (Caco-2 cells) that allowed sampling of fluid from both the basal and apical side of the monolayer. TiO2 was added to basal fluid at 50 and 100 µg/mL and cells incubated for 3 hours. 29 MacNicoll et al. (2015) used a gut in vitro model of an inverted monolayer co-culture of Caco-2 cells and M-cells. The rats used in the study were bred on a Ti-free diet but there is no indication in the paper whether they were fasted prior to dosing. The dose of TiO2 (40, 120 & <5,000nm) was 5 mg/kg as a suspension either in deionised water or 5 % ovalbumin solution.

Page 31 of 106
time intervals studied compared to control (non-TiO2) animals. Also neither of the nano- or larger TiO2
particles crossed the in vitro gut epithelium model. The overall conclusion by the authors both from
the rat study, and the in vitro human gut epithelium model, is that the TiO2 nanoparticles are not likely
to be absorbed in the GIT following oral intake. It was however acknowledged trace absorption of Ti
could not be measured.
TiO2 nanoparticles (26nm) suspended in water were given to rats via gavage at 260.4, 520.8, and
1041.5 mg/kg/day, 7 d/week for 13 weeks. Even at the highest dose no increase, relative to vehicle
treated controls, was observed in Ti content of liver, spleen, kidney, and brain (measured by ICP-MS).
The TiO2 nanoparticles remained stable in acidic gastric juice (Cho et al. 2013).
Overall the above studies show TiO2 of various particle size is poorly absorbed from the GIT, this is
consistent with the deliberations of JECFA (1969) and EFSA (2004a). The exception is the data from
Sang et al. (2013); there are however notable differences between this study and others described
above. Firstly the nTiO2 was prepared ‘in house’ by a method that appears to be unique by this
laboratory, secondly the particle size was much lower and uniform (5 – 6nm) than used in other
studies. It raises the possibility that nTiO2 of very small size may be relatively efficiently absorbed
from the GIT, however this needs to be confirmed by other studies. In addition the relevance of the
Sang et al. (2013) study to biological behaviour of nTiO2 added to food is not readily apparent.
4.1.3 Distribution Short term (single or daily for up to 14 days) intraperitoneal, intravenous or subcutaneous
administration of nano-TiO2 shows distribution, as Ti or particulates/agglomerates in liver, kidneys,
spleen, lung, brain and heart, and an ability to cross the placenta (Fabian et al. 2008, Liu et al. 2009,
2010, Li et al. 2010, Yamashita et al. 2011, Umbreit et al. 2012, Xie et al. 2011, Geraets et al. 2014,
Shinohara et al. 2014). Tissues, particularly the liver and spleen, with residential phagocytes (i.e. the
reticuloendothelial cell system30) tend to have the highest concentrations and retain Ti longer. For
example, after intravenous administration blood concentrations rapidly decline (only 2.8% and 0.3% of
dose at 5 and 15 minutes), at 6 hours 94% and 2% of the dose was in the liver and spleen
respectively. The concentrations in liver and spleen did not decrease for 30 days after administration
30 Also called the mononuclear phagocyte system.

Page 32 of 106
but TiO2 burden in the lung, kidney, heart and blood did decrease over time. No translocation to the
brain was observed (Shinohara et al. 2014)31.
TiO2-NPs have been shown in rodent studies to be absorbed and widely distributed to the same
tissues following oral dosing (Jani et al. 1994, Wang et al. 2007; 2013)32, but, not surprisingly, in
addition gut associated lymphoid tissue (GALT) tend to have relatively high concentrations.
From animal studies EFSA (2009b) concluded smaller particles of TiO2 are generally absorbed faster
and to greater extent than larger particles.
Bachler et al (2014) have developed a Physiologically Based Pharmacokinetic (PBPK) model for
absorption and distribution of nano- TiO2. The model was validated against the intravenous rodent
data of Xie et al. (2011)33 and the high oral dose data from Wang et al. (2007). Although not all tissue
concentrations were well predicted with the model it successfully described the distribution behaviour
of nano- TiO2 on the basis of two kinetic processes: (1) the ability of NPs to cross the capillary wall of
the organs; (2) the phagocytosis of nanoparticles by the Mononuclear phagocyte system (MPS). At
low levels of nano-TiO2 in the blood, the uptake by the reticuloendothelial system seems negligible.
Although the reason for this behaviour could not be definitively determined, the results of the PBPK
model suggest agglomeration of nanoparticles at high doses and a subsequent uptake of these
agglomerates by macrophages. The model was used to change the estimated mean Ti daily intake by
Germans into internal doses. The authors concluded that the resulting tissue concentrations were well
below those associated with organ damage in in vitro experiments, hence the risk from dietary Ti was
31 Shinohara et al. (2014) used Degussa P25 TiO2 nanoparticles with primary size 21nm. Rats received 0.95 mg/kg iv suspended in 0.5% disodium phosphate. 32 Jani et al. (1994) used TiO2 of nominal 500nm size and gave rats 12.5mg/kg/d by gavage for 10 days. Importantly animals were fasted overnight (8-10 hr) before each morning dose. Histological and chemical analysis showed the presence of TiO2 particles in all the major tissues of the gut associated lymphoid tissue (GALT), and demonstrated the TiO2-NPs were translocated to systemic organs such as the liver and the spleen. TiO2-NPs were also found in the lung and peritoneal tissues, but were not detected in the heart or the kidney. The authors made no comment on the clinical status of the animals. Wang et al. (2007) dosed fasted mice with a single bolus (5 g/kg) TiO2 dose of 25, 80 nm, and fine (155 ± 33 nm) in 0.5% hydroxypropylmethylcellulose (suspension made with 15 – 20 min ultrasonication & 2 -3 min mechanical stirring). Particle size determined by TEM. Tissues analysed for Ti by ICP-MS. No difference in erythrocyte Ti concentration but liver and kidney concentrations were 80nm> 20nm > fine. 33 Xie et al. (2014) used TiO2 of 20nm size fluorescently labelled or tagged with 125I. Mice and rats received 10 mg/kg intravenously. Tissue distribution and excretion were investigated by using ex vivo fluorescent imaging, ɣ-counter and TEM. TiO2-NPs mainly accumulated in liver and spleen and were retained for over 30 days in these tissues due to the phagocytosis by macrophages. With 125I -TiO2, 5 and 30 days after injection ~27% and ~45% of the dose was recovered in urine, but at 30d <10% in faeces.

Page 33 of 106
negligible. In relation to the TiO2 in chewing gum, Chen et al. (2013) also reached a conclusion of very
low risk to consumers.
4.1.4 Excretion Following oral administration, TiO2 nanoparticles are excreted in the faeces (MacNicoll et al. 2015,
Jones et al. 2015). Once absorbed, renal excretion is the main removal pathway (Xie et al. 2011).
Kinetic analysis after intravenous administration of different TiO2 nanoparticles revealed that for each
of the investigated tissues the Ti half-lives were long (range 28–650 days, depending on the TiO2-
particle and tissue investigated) (Geraets et al. 2014). The authors cautioned that although there was
limited uptake into the systemic circulation and tissues after ingestion, the very slow elimination from
tissues might result in long term tissue accumulation and toxicity.
4.1.5 Toxicity There have been only a limited number of studies conducted with TiO2 where exposure has occurred
via diet, most of these are quite old. While many gavage investigations for up to 90 day exposure
were found, no new dietary studies were located by the literature search.
Dietary toxicity/ADME studies:
• EFSA (2004a) evaluated an unpublished ADME investigation in which different forms of rutile
or anatase TiO2 were added to rat diet to give a dose of 30 mg/kg/d over 7 days (Colorcon
2003). As described by EFSA urinary excretion of Ti, and tissue concentrations were generally
below the limit of quantification and not different from controls. EFSA (2004a) concluded this
study indicated there was no accumulation of Ti in tissues following administration of diets
containing 200 mg TiO2/kg. Particle size and toxicological findings were not mentioned.
• EFSA (2004a) also describe another unpublished study (West and Wyzan 1963) in which low
accumulation of Ti in muscle was observed after 30 days exposure to a diet with very high
TiO2 concentrations (100,000 mg/kg diet). Particle size and toxicological findings are not
mentioned.
• The European Scientific Committee on Consumer Safety (SCCS 2014) reports National
Cancer Institute (NCI 1979a) studies in which rats and mice received diets with up to 100,000
mg TiO2/kg for 90 days. There were no deaths, no differences in body weight gains, no

Page 34 of 106
substance-related gross or microscopic pathological findings. For both species the NOAEL
was 100,000 ppm in the diet (dose not provided34). It was noted particle size was not reported.
• Bernard et al. (1990) used TiO2 coated mica (28% TiO2 and 72% mica) to give rats dietary
doses of 750, 1,500 and 3,700 mg/kg/d for 130 weeks35. Haematological and clinical
chemistry showed no important changes. There was a slightly increased incidence of adrenal
medullary hyperplasia in high dose males only. It was concluded there was no evidence of
carcinogenicity. The particles are described as flat platelets with the longest dimensions
ranging from 10 – 35 µm. This material is unlikely to be representative of TiO2 in food.
• NCI (1979b) exposed rats for 103 weeks with dietary TiO2 to give doses36 of 1,875 and 3,750
mg/kg bw/d. The rats had white faeces, there were no clinical signs were associated with the
test compound. There were no statistical differences in the evaluated parameters37 from
controls. A large number of tissues were examined histologically. It was concluded TiO2 was
not carcinogenic by the oral route for rats.
NCI (1979b) also exposed mice to dietary TiO2 at doses of 3,750 and 7,500 mg/kg/d. All
animals had white faeces, no clinical signs were associated with the test compound were
observed. Mortality in male mice was not affected but there was dose related increased
mortality in females. As with rats there were no statistical differences in the evaluated
parameters from controls. A large number of tissues were examined histologically. There was
no evidence of carcinogenicity. In the rat and mouse bioassay the TiO2 was anatase,
34 NCI (1979a) are subchronic studies conducted for the purpose of delineating the appropriate dose for use in long term exposure studies (NCI 1979b). The chronic toxicity studies were conducted using a maximum dietary TiO2 concentration of 50,000 ppm. Although the mg/kg bw/d doses and food consumption rates were not provided in NCI (1979b), SCCNFP (2000) indicate 50,000 ppm was equivalent to an intake of 3,750 mg/kg bw/d by rats and 7,500 mg/kg bw/d by mice. Thus the 100,000 ppm subchronic 90day NOAEL is probably approximately equivalent to 7,500 mg/kg bw/d in rats and 15,000 mg/kg bw/d in mice. 35 The Bernard et al. (1990) paper does not report on the doses administered, just the concentrations of TiO2 coated mica in the diet. The concentrations were 0, 1, 2, or 5%. The European Scientific Committee on Cosmetic products and Non-Food Products Intended for Cosmetics (SCCNFP 2000) indicated the corresponding doses were 0, 750, 1500, and 3700 mg/kg bw/d. 36 NCI (1979b) do not report on the doses administered, just the concentrations of TiO2 in the diet. The concentrations were 25,000 or 50,000 ppm. The SCCNFP (2000) indicated the corresponding doses were 1,875 and 3750 mg/kg bw/d. 37 Parameters subjected to statistical analysis included body weight, mortality and incidence of neoplastic changes. Non-neoplastic changes were not considered treatment-related.

Page 35 of 106
designated Unitane® 0 – 220, with 98% purity. While impurities were measured there was no
determination of particle size. According to SCCNFP (2000) it was retrospectively reported
that 10% of the TiO2 used in the NCI experiments had “small crystal diameter”.
In their safety evaluation of TiO2 for use as a food additive, JECFA (1969) concluded that: “Titanium
dioxide is a very insoluble compound. The studies in several species, including man, show neither
significant absorption nor tissue storage following ingestion of titanium dioxide. Studies on soluble
titanium compound have therefore not been reviewed. It is useful to note that following absorption of
small amounts of Ti ions no toxic effects were observed. Establishment of an acceptable daily intake
for man is considered unnecessary.”
Gavage studies:
Research groups investigating the absorption and toxicity of nano-TiO2 have exclusively employed
gavage administration to rats or mice that may or may not have been fasted. Large single doses
(5,000 mg/kg) of TiO2 with particle size ~5 – 300nm, and repeat exposure at lower doses (~ 1 – 250
mg/kg/d) for 5 – 60 days have been associated with histological changes in liver and/or kidney, and
sometimes other organs. For example, heart (Bu et al. 2010), spleen (Sang et al. 2013), thyroid and
ovary (Tassinari et al. 2014) and nervous system (Hu et al. 2011, Mohammadipour et al. 2014). The
toxicity has been variously assessed by serum chemistry, histology, indicators of oxidative stress,
immunological parameters, gene expression and metabolomics analysis (Wang et al. 2007, Duan et
al. 2010, Bu et al. 2010, Cui et al. 2010, 2012; Li et al. 2010, Gui et al. 2011, 2013; Wang et al. 2013,
Tassinari et al. 2014, Vasantharaja et al. 2014, Azim et al. 2015). Hepatic histological changes have
been observed in the absence of increased tissue Ti or TiO2 nanoparticles being found in hepatocytes
by TEM examination (Wang et al. 2013). Some of the histological changes have been observed at
relatively low doses, e.g. altered spleen, ovary and thyroid histology at 1 – 2 mg/kg/d for 5d (Tassinari
et al. 2014) although repeat doses of 10 – 100 mg/kg/d are more commonly employed.
The influence of exposure time on Ti tissue accumulation was shown by Sang et al. (2013). At
various times (15, 30, 45, 60, 75 and 90 days) after initiating gavage dosing (10 mg/kg/d) of mice with
nano- TiO2 (5 – 6nm) there was significant progressive time related increases in spleen Ti content.
Severe splenomegaly was observed; histological changes included lymphocyte proliferation,
macrophage infiltration, fatty degeneration, and cell necrosis in the spleen. The extent of histological
changes approximately correlated with spleen Ti content; as did increased levels of PGE2, COX-2
genes, and their protein expression. Similarly with increased exposure duration, the expression of

Page 36 of 106
AP-1, CRE, c-Jun, and c-Fos genes and their proteins markedly increased. In summary the oral
administration of TiO2 nanoparticles resulted in time dependent increased spleen Ti content,
increased production of reactive oxygen species, time-dependent splenic inflammation, and necrosis.
It is noted however (Section 4.1.2), that although 20 animals were in each time sacrifice, the
incidence of histological findings and gradation of severity was not reported. In addition the nTiO2
was prepared ‘in house’ by a method that appears to be unique by this laboratory and the particle size
was small (5 – 6nm) and unusually uniform. Although the molecular expression studies in this
investigation were well conducted there is however a reporting deficiency in toxicological parameters
traditionally examined in OECD test protocols. The study therefore has limited use for safety
assessment.
Brief descriptions of the above studies are provided in Appendix A.
With respect to using these studies for determining potential hazards associated with dietary
exposures some issues are:
• None of the studies identify the administered TiO2 as being food grade.
• None are dietary exposures.
• Some studies use very high doses.
• All studies rely on ultrasonication for up to 30 minutes to prepare stable suspensions. Usually
in water or hydroxypropyl methylcellulose.
• It is noted a number of studies showing toxicological effects originate from the same Chinese
University. These studies use colloidal nano-TiO2 of small (~5 - 6nm) and uniform size
prepared via controlled hydrolysis of titanium tetrabutoxide (Duan et al. 2010, Hu et al. 2011,
Liu et al. 2009, 2010a; Gui et al. 2011, 2013, Cui et al. 2010, 2012, Sang et al. 2013).
• Findings of tissue effects in rats at gavage doses of nTiO2 at 1 or 2 mg/kg for 5 days (e.g. from
the above Chinese laboratory and Tassinari et al. 2014) are in stark contrast to a subchronic
90-day gavage toxicity study in rats conducted according to OECD TG 408 with pigment-grade
TiO2 test particles which showed no adverse effects at doses up to 1000 mg/kg/d (described in
Warheit and Donner 2015). They are also in conflict with 90 day and 2 year TiO2 NCI studies
at high dietary exposure (in which faeces were white) described above in which no adverse
tissue effects were observed.
Under research conditions, gavage dosing of nano-TiO2 to rodents can be associated with systemic
organ toxicity. This occurs mainly in the liver to varying degrees, but on occasions also in the kidney
and other organs. However the method of administration, and type of TiO2-nanoparticles (i.e. non-

Page 37 of 106
food grade) used in the studies indicate extrapolation of their observations to human exposure via
food should be undertaken with caution.
4.1.6 Conclusions Food grade TiO2 material used as an additive to whiten foods contains a high percentage of
particulates in the nanoscale (<200nm), this may be ~10 – 20%. Assessment of the TiO2 particle size
in food also show nano-TiO2 particles are present. Depending on the study and analytical techniques
the proportion of nano-TiO2 in food relative to the food grade material may be similar or lower. The
TiO2 in chewing gum is easily extracted when chewing. Adult dietary exposure to TiO2 may be
approximately 1 mg TiO2 mg/kg/d but up to 2 mg TiO2 mg/kg/d for children. Chewing gum has the
highest concentrations of TiO2 and depending on the brand, the swallowed dose of nano-TiO2 per
piece of chewing gum may be up to 7 mg.
It appears that nano-sized particles of food grade TiO2 become agglomerated when in food.
Nevertheless around 10% may remain as nano-particles. Unlike other nano-metal oxides TiO2 does
not show ready dissolution in gastric juices. Nano- TiO2 tends to aggregate in the milieu of the
stomach and intestine.
There are conflicting data regarding the extent of absorption of nano- TiO2 from the gastrointestinal
tract of humans or animals. The disparity between studies may reflect the different exposure periods,
dose size and analytical sensitivity of the methods employed. The data does however show that it has
very poor bioavailability; this may be of the order of ~0.01% but there is marked uncertainty with this
estimation.
Parenteral administration of nano-TiO2 shows it is widely distributed to tissues, particularly those with
the highest level of fixed phagocytic cells, i.e. the liver and spleen. Tissue titanium concentrations
decline very slowly, half-lives are 28 – 650 days.
Information on the gastrointestinal absorption of nano-TiO2 by animals comes primarily from toxicity
studies. Information for food grade TiO2 was not found. In addition there are very few studies
investigating the toxicity of TiO2 by dietary exposure, those that exist are old (>20 years) and do not
specify the grade or particle size of the TiO2 used. Nevertheless, these studies have been used by

Page 38 of 106
regulatory bodies to conclude that even at very high dietary levels (e.g. 100,000 ppm in diet38) TiO2 is
poorly absorbed and has very low toxicity to animals when they are exposed in the diet for the
majority of their lifetime. TiO2 in the diet showed no evidence of carcinogenicity with oral exposure.
In contrast to the dearth of dietary studies there are many that have investigated various biochemical
and toxicological endpoints following gavage administration of single high doses, or lower doses of ~1
– 250 mg/kg/d for 5 – 90 days. Many have shown increased titanium concentrations in various organs
and associated degrees of tissue changes. The liver, spleen and kidney are the primary target organs.
But dose- and time-dependent toxicity has been observed in other organs, e.g. the heart, thyroid,
ovary and brain. Brain and behavioural effects were observed in off-spring after treatment of dams but
traditional developmental studies with nano-TiO2 were not located. It is noted that gavage dosing of a
substance to an animal provides a high pulse of material, whereas dietary exposure is much lower
and more evenly spread over the day. Furthermore dietary components are likely to have significant
effects on the availability of materials such as fine-TiO2 for absorption across the gastrointestinal
mucosa.
Summary conclusion:
There is marked uncertainty in extrapolating animal toxicological studies where the exposure has
been via gavage and food grade TiO2 has not been examined, to human dietary exposure. Old safety
studies, well conducted with respect to toxicological assessment but poor or no test material
characterisation, in which dietary exposure has been high over a long period have shown TiO2 has
very low absorption from the GIT and a lack of tissue effects. These studies have led authorities to
conclude TiO2 is a safe food additive.
Recent gavage studies with various size nTiO2 also generally show very low absorption from the GIT.
Nonetheless sensitive analytical methods have demonstrated increased tissue Ti concentrations,
although not large, and in some instances, the presence of TiO2 particles in tissues. The latter implies
absorption of at least some of the administered particles. Some of these gavage studies, at relatively
low doses, have also shown tissue effects that have included increased gene expression and
histological changes. These findings appear contradictory to the earlier dietary studies. However, the
current weight of evidence indicates that oral doses of nano-TiO2, at least by gavage, are potentially
38 As indicated in Section 4.1.5, this dietary concentration is likely to correspond to approximate doses of 7,500 mg/kg bw/d in rats and 15,000 mg/kg bw/d in mice, at which no adverse findings related to treatment with TiO2 were observed.

Page 39 of 106
associated with a range of tissue effects. Some of these effects have been observed at doses ≤ 200
mg/kg/d for exposure periods of 5 – 90 days.
The absence of modern dietary absorption and chronic toxicological studies with well characterised
food grade TiO2 means greater weight than otherwise is placed on the animal gavage studies with
non-food grade TiO2. Nonetheless extrapolation of gavage studies to assess hazards of a substance
in food is highly uncertain, this is particularly so for nano-particulates where food can significantly alter
the nano-nature of the substance. Overall this review concludes there is insufficient, directly relevant
information available to confidently support a contemporary risk assessment of nano-TiO2 in food.
It is noted that despite TiO2 being used as a food additive for many years there are no epidemiology
studies available regarding possible associations with adverse health outcomes (see Section 3.2). On
the other hand a long history of use of TiO2 as a food additive has not given rise to reports of adverse
effects.
4.2 Amorphous silica (SiO2) Amorphous SiO2 has been used as the food additive, E551, for decades. The Joint FAO/WHO Expert
Committee on Food Additives evaluated the safety of SiO2 as a food additive in 1974 and assigned a
“not limited” acceptance pending further studies (JECFA 1974). The “not limited” acceptance signifies
no explicit indication of an upper limit of intake was assigned to the substance due to its very low
toxicity. More recently, the European Food Safety Authority concluded exposures to SiO2 equating to
700 mg Si/day (i.e. 12 mg Si/kg/d) in food supplements and typical dietary intakes of 20-50 mg Si/day
(i.e. 0.3-0.8 mg/kg/d) are of no safety concern (EFSA 2009a). A recent review concluded synthetic
amorphous SiO2, such as that used as food additive, are not new nanomaterials with unknown
properties, but are well-studied materials which have been in use for decades (Fruijtier-Pölloth 2012).
Particle sizes 39 (including primary particles, agglomerates and aggregates) of nano-SiO2 in several
food products containing E551 ranged from 50-200 nm (Dekkers et al. 2011). The percentage of SiO2
in nano-form ranged from <4% in pancake mix to 33% in instant asparagus soup. The remaining SiO2
may be present in the form of larger aggregates or agglomerates, or may be bound to the organic
constituents of food items. In an example of a processed food product (coffee creamer added to hot 39 Deckers et al. (2011) based particle size characterisation on the retention time in hydrodynamic chromatography with inductively coupled plasma mass spectrometry (HDC-ICPMS).

Page 40 of 106
fresh black coffee), 43% of the SiO2 was in nano-form, with particles of 30-120 nm (Dekkers et al.
2011). These data demonstrate food containing the food additive E551 likely contains nano-sized
SiO2.
Dekkers et al. (2011), from the Dutch National Institute of Public Health and the Environment (RIVM),
reviewed data for nano-SiO2, with the aim of identifying the extent that risk assessment for nano-SiO2
in food could be performed. They determined the presence, particle size and concentration of nano-
SiO2 in food products, and estimated a consumer intake of nano-SiO2 via food.
Dutch consumer intake of SiO2 from food was estimated to be 9.4 mg/kg/d for a 70 kg adult (i.e. ~4.4
mg Si/kg/d), of which 1.8 mg/kg/d (i.e. ~0.8 mg Si/kg/d) could be in the nano-size range40 (Dekkers et
al. 2011). This estimate of total Si intake from food is approximately 6-15 times higher than that
reported by EFSA (2009a).
Due to lack of data for oral absorption of nano-SiO2, Dekkers et al. (2011) evaluated two scenarios for
risk assessment:
• The first assumed nano-SiO2 dissolves in the gastrointestinal tract and is absorbed as
dissolved SiO2.
• The second assumed nano-SiO2 particles themselves are absorbed.
For the first they concluded no adverse effects are expected to occur. For the second, there were too
many uncertainties to allow proper risk assessment for the particulates per se. Consequently, the
authors recommended prioritising research for absorption of nano-SiO2 from the gastrointestinal tract.
In 2014, the same research group from RIVM conducted a risk assessment for synthetic amorphous
SiO2 (SAS) in food (RIVM 2014, van Kesteren et al. 2014). Data from rat intravenous studies was
used to kinetically model the maximum (i.e. worst case) steady state concentration of Si in the human
liver that may be associated with lifelong intake of food products containing SAS. The modelling
included allometric scaling from rats to humans, an assumption of 0.1% gastrointestinal absorption in
humans, and the estimated Dutch consumer intake of SiO2 from Dekkers et al. (2011) (i.e. 9.4
mg/kg/d). The projected concentration of Si in human liver was 21-23 mg Si/kg liver. van Kesteren et
al. (2014) compared this with the concentration of Si in the livers of rats at which adverse effects were
40 Intake estimations were done using analytical data for some food products, assumptions for non-analysed food products, and daily consumption patterns of a high number of portions containing nano-SiO2.

Page 41 of 106
observed determined in the van der Zande et al. (2014) study41; this rat liver concentration was less
than the limit of detection, i.e. <75 mg SiO2/kg liver (corresponding to <37 mg Si/kg liver). Since the
estimated Si concentration in man was similar to the measured concentration in rats at which liver
fibrosis was observed, van Kesteren et al. (2014) concluded SAS in food may pose a health risk.
However, they noted due to the uncertainties and assumptions in the risk assessment, it was not
possible to draw firm conclusions.
4.2.1 Absorption Simulated in vitro digestion of different SiO2 nanomaterials (NMs) indicated ~15-20% dissolution (van
der Zande et al. 2014). Si from high dose (2500 mg/kg/d) food grade42 amorphous SiO2 administered
in the diet for 84 days was found to accumulate in rat spleen. Together with data from the in vitro
digestion model, this study suggests dissolved SiO2 is absorbed and distributed to tissues. However it
was not determined whether the nanoparticulate form per se was also absorbed.
In another study, transmission electron microscopy (TEM) of Caco-2 cells treated with 15 or 55-nm
colloidal nano-SiO2 in vitro showed significant internalisation of both particulate sizes after 24 hours
exposure. The 55 nm SiO2 NPs were mainly present as single particles, whereas the 15 nm NPs
tended to form agglomerates or aggregates within cells (size of agglomerates not provided). Particles
were located mainly within vesicles, presumably lysosomes, and none were found in the nucleus
(Tarantini et al. 2015). This is in contrast to Yang et al. (2014) where SiO2 NPs (10-50 nm)43 did not
pass through Caco-2 cells after 4 hours of contact. This may have been due to significant
agglomeration observed in the culture medium.
Sakai-Kato et al. (2014) incubated amorphous SiO2 NPs (50, 100 and 200 nm) with fasted- and fed-
state simulated gastric and intestinal fluids and then intracellular transport into Caco-2 cells was
monitored. The particles agglomerated in fed-state intestinal fluids (~2 µm), which inhibited the
particle’s absorption into Caco-2 cells. In contrast, in fasted-state intestinal fluids, the mean particle
sizes were not affected.
41 See Section 4.2.4 for description of this study. 42 The amorphous SiO2 material used in this study was a hydrophilic, pyrogenic synthetic amorphous SiO2 with a primary particle size of 7 nm. 43 Although the primary particle size was 10-50 nm, the NPs clearly agglomerated with hydrodynamic diameters of 225-570 nm in culture medium.

Page 42 of 106
In a study conducted by Peters et al. (2012), food products containing nano-SiO2 were introduced into
an in vitro digestion model simulating the human gastrointestinal tract. In the digestion mouth phase,
nano-SiO2 particles with size ranges of 5-50 and 50-500 nm were present. In the successive gastric
digestion stage, nano-sized SiO2 was no longer present in coffee and instant soup, while low amounts
were found in pancakes. This was due to large agglomeration under the conditions of low pH and high
electrolytes in the gastric phase. In the intestinal phase, however, the nano-SiO2 particles re-
appeared, with about 80% of all SiO2 from coffee creamer introduced into the system present as
undissolved nano-SiO2 (including primary NPs, agglomerates and aggregates up to 200 nm). For
soups and pancakes, undissolved nano-SiO2 ranged from 10-40% (w/w) of total SiO2. Thus the
presence of undissolved nano-SiO2 in the gut in vivo seems likely.
After administration of mesoporous SiO2 NPs (110 nm) dispersed in 5% glucose by gavage to ICR
mice at 50, 500, or 5000 mg/kg, transmission electron microscopy revealed NPs were present in the
liver, but no other organs (including the intestine) 24 hours after administration (Fu et al. 2014). It may
be the NPs had been eliminated from the gut prior to the 24-hour measurement time point. It is
unknown if these NPs are reflective of those used in food.
Another study used optical imaging to track the movement of positively and negatively charged
rhodamine B isothiocyanate (RITC)-incorporated SiO2 NPs (20 or 100 nm) through the gut after
gavage administration to nude mice at a dose of 100 mg/kg (Lee et al. 2014a). A preliminary in vitro
study had shown the fluorescent labelling was stable and did not dissociate from the NPs under
stomach conditions. In the in vivo studies, RITC-SiO2 NPs were found to flow into the small intestine
from the stomach and gradually moved along the gut. Mice were sacrificed after in vivo optical
imaging 2, 4, 6 and 10 hours following administration. Optical signals were observed mostly in the
lungs, liver, pancreas, and kidneys. As judged by fluorescence, the orally administered RITC-SiO2
NPs were clearly absorbed into the systemic circulation and eventually found in the kidneys 10 hours
after administration. The 20 nm NPs showed higher uptake into the lungs, whereas the 100 nm NPs
showed higher uptake in the liver (Lee et al. 2014a).
The absorption of amorphous SiO2 particles (70, 300 and 1000 nm) was investigated by Yoshida et al.
(2014). NPs (70 nm) were unmodified or surface-modified44. Intestinal absorption was studied using
rat everted gut sacs combined with inductively coupled plasma optical emission spectrometry.
44 Surface modification consisted of a carboxyl or amine group addition.
Page 43 of 106
Intestinal sacs were incubated in suspensions of SiO2 particles (12.5 mg/ml) in buffer for 45 minutes.
Absorption of surface-modified NPs into the inverted lumen, as measured by total Si content, was
significantly greater than for the other SiO2 particles, but Si from all particles sizes was absorbed to
some extent. This suggests surface properties of the NP are a determinant of the degree of
absorption.
Using TEM Lee et al. (2014b) found intact nano-SiO2 particles in rat liver and kidney 48 hours after a
high gavage dose (1000 mg/kg) of colloidal SiO2 (20 and 100nm). The authors estimated 10-15% of
the Si in administered NPs remained in body tissues 10 days post-administration. These authors cite
a study45 which they say absorption after single gavage doses (500 or 1000 mg/kg) of SiO2 NPs (20
or 100 nm) to rats was low, ranging from 6.6-9.7% and was unaffected by particle size or sex. On the
other hand Yun et al. (2015) found no changes in Si content of a range of tissues after 91 days
gavage dosing rats with ~500 and 1000 mg/kg/d nano-SiO2 (12nm). This suggests very limited,
negligible absorption.
van Kesteren et al. (2014) describe an unpublished repeated dose kinetic study with precipitated and
pyrogenic SiO2 NPs46 conducted as part of the NANOGENOTOX project. The SiO2 NPs were
administered to rats via gavage or intravenously at a dose of 20 mg/kg/d for five consecutive days
followed by a recovery period to day 14 or 90 for the oral and intravenous routes, respectively47. After
gavage dosing the elimination profile indicated the fraction of Si reaching the organs was slowly
eliminated. Corrected for control tissue concentrations, the authors estimated 0.06% absorption for
precipitated SiO2 NPs and 0.03% for pyrogenic SiO2 NPs.
van Kesteren et al. (2014) also used data from a 28 or 84-day dietary toxicity study in rats (van der
Zande et al. 2014, described in Section 4.2.4) to estimate the absorption of SiO2 NP. After 28 days,
they found the dose fraction absorbed decreased with increasing external dose; 0.2% at the low dose
(100 mg/kg/d) to 0.01-0.02% at the high dose (1000 or 2500 mg/kg/d). At day 84, the absorption for
the high dose group (only dose tested) was estimated to be 0.005% or <0.01% for synthetic
amorphous SiO2 and NM-202, respectively. The authors of the study suggested decreased absorption 45 The full text of the cited study (Paek et al. 2014) was not available to ToxConsult. 46 The particles in the unpublished study cited by van Kesteren et al. (2014) were NM-200 precipitated SiO2 (average primary particle size: 14, 18, or 23 nm) and NM-203 pyrogenic SiO2 (13, 16, 19 or 45 nm). 47 In the unpublished study blood was collected on day 5 at 9 time points after iv, and organs on day 6, 14, 30 and 90. The Si content in liver, spleen, gastrointestinal tract and mesenteric lymph nodes (gavage) and in liver, spleen, lungs, heart, brain, kidneys and testis/ovaries (i.v) was determined.

Page 44 of 106
at higher doses was due to gelation since they observed stronger gelation properties with increasing
dose in the gastrointestinal content compared to lower doses (van der Zande et al. 2014).
Overall the data indicate gastrointestinal absorption of Si from SiO2 NMs in vivo is likely to be low to
moderate; perhaps ~0.2% from diet and very low to ~10% from gavage administration depending on
the study. Although there is some in vitro evidence suggesting particles per se may pass through the
gastrointestinal wall, and limited evidence after high dose gavage there is insufficient information to
determine whether this occurs in vivo with dietary exposure.
4.2.2 Distribution After 84 days, but not 28 days, administration of a high dose in feed (2500 mg/kg/d) food-grade
amorphous SiO2 NPs to rats, Si accumulated in the spleen48. Due to analytical limitations, the authors
were unable to determine whether the accumulated Si was in nanoparticulate form (van der Zande et
al. 2014). However, Lee et al. (2014b) found nanoparticles with TEM examination in liver and kidney
after high dose (1000 mg/kg) gavage of colloidal SiO2 (20 and 100nm).
After administration of fluorescent mesoporous SiO2 NPs (110 nm) dispersed in 5% glucose by
gavage to ICR mice at 50, 500, or 5000 mg/kg, no fluorescence was found in the liver, spleen, lung,
kidney or intestine 1 or 7 days after administration. However, transmission electron microscopy (TEM)
revealed NPs were present in the liver, but no other organs (including the intestine) 1 day after
administration, but not after 7 days. Si content in excreted faeces was higher than controls after 1, but
not after 7 days. Si content in urine and intestinal tissue were not significantly different to that of the
vehicle controls at either 1 or 7 days. Histopathological examination 1 or 7 days after administration
revealed no effects on duodenum, jejunum, ileum, mesenteric lymph nodes, Peyer’s Patch, liver,
spleen, lung or kidney (Fu et al. 2014)49.
After gavage administration of positively and negatively charged rhodamine B isothiocyanate (RITC)-
incorporated SiO2 NPs (20 or 100 nm) at 100 mg/kg to nude mice, fluorescence was distributed to the 48 Concentration of SiO2 in spleen was 248 ± 81 mg/kg spleen (i.e. 116 mg Si/kg) compared to <75 mg/kg (i.e. <37 mg Si/kg) in controls. 49 The results in the paper are perplexing since at a high dose of 5000 mg/kg by gavage it would be expected that analysis of tissues, faeces and urine would reveal at least some of the administered material. However, the authors report no findings of fluorescence in tissues or measurement of Si in the gastrointestinal tract, faeces or urine at time points where it would be expected to be found, especially with the use of ICP-OES. It is somewhat unclear from the paper, however, whether organs were examined from mice in all doses groups, or only the low dose group (50 mg/kg).

Page 45 of 106
lungs, liver, pancreas, and kidneys (Lee et al. 2014a). The authors had demonstrated the fluorescent
tag on the NPs was stable in simulated gastric fluid hence it was implied the complete nanoparticles
had been absorbed.
The results of the repeat dose gavage toxicokinetic study in rats summarised by van Kesteren et al.
(2014) (see Section 4.2.1) showed Si levels of <0.3-2 mg and 0.4-1 mg Si/kg tissue in liver and
spleen, respectively, at day 6. Six days after completing repeated (5 x) i.v. dosing, concentrations of
Si were highest in the liver (100-340 mg Si/kg tissue), with levels slowly decreasing over a month to
50-100 mg Si/kg tissue, and decreasing further (10-30 mg Si/kg tissue) at day 90. The concentration
in control tissues was 0.4-0.7 mg Si/kg tissue.
At the conclusion of a 91-day rat gavage study with nano-SiO2 (12 nm)50 dispersed in water, Si
concentrations in blood, urine, and all tissues tested (liver, kidney, spleen, lung and brain) were not
significantly different compared with controls. Si concentrations in faeces of the middle (489.8 mg/kg/d)
and high (979.5 mg/kg/d) dose groups were significantly higher than controls, suggesting most of the
SiO2 NPs were excreted via faeces (Yun et al. 2015).
Data from the studies discussed above support the findings from intravenous and intraperitoneal
administration studies (Cho et al. 2009, Dekkers et al. 2012), in which distribution of Si from nano-
SiO2 occurs mainly to the liver and spleen, and to a limited extent to other tissues. Tissue retention is
discussed in Section 4.2.3.
4.2.3 Excretion The only study found that investigated excretion of SiO2 after oral administration was Lee et al.
(2014b). Excretion of colloidal SiO2 NPs (20 and 100 nm) administered as a single dose (500 or 1000
mg/kg) by gavage to rats was evaluated by measuring Si levels in urine and faeces. Size dependent
elimination kinetics were observed. Higher Si concentrations were found in urine 1-2 days and 1-5
days after administering 20 nm SiO2 at 500 or 1000 mg/kg, respectively than after 100nm. Elimination
in urine was slower for the 100 nm NPs. The overall extent of excretion was unaffected by particle
size, with 7-8% of NPs (measured as Si) excreted in urine and 75-80% in faeces for both particle
sizes. The authors estimated 10-15% of administered Si remained in body tissues 10 days post-
50 Primary particle size by TEM 12 nm. Hydrodynamic size by dynamic light scattering in aqueous suspension was similar at 33.5 ± 7.5 nm (Yun et al. 2015).
Page 46 of 106
administration (Lee et al. 2014b). A 91-day gavage study in rats with nano-SiO2 also indicates most of
the administered NPs are eliminated via faeces (Yun et al. 2015).
Cho et al. (2009) found 4 weeks after a single intravenous injection of 50 mg/kg 50-, 100- and 200-nm
fluorescent-labelled SiO2 to mice, that fluorescence in spleen and liver were still present. Excretion in
urine and faeces showed different patterns depending on particle sizes; excretion of fluorescence
from the 50 nm particles faster than for the larger sizes. Only limited characterisation of administered
NPs was undertaken.
Liu et al. (2011) found 50% of Si from mesoporous hollow SiO2 NPs (110 nm) disappeared from the
tissues of mice in 4 weeks after intravenous injection.
He et al. (2011) found the half-life of fluorescence from fluorescent-labelled mesoporous SiO2 after iv
in the blood of mice was 1-3 hours suggesting distribution into tissues was rapid; 1 month after
administration, fluorescence was still present in liver and spleen. The images of the liver and spleen
provided in the study appear as if more fluorescence was retained in tissues after 1 month for the
smaller particles (80 and 120 nm) compared to the larger particles (200 and 360 nm). The authors
indicate this was due to the relatively slow but continued capture and biodegradation of smaller
particles by the tissues. In another study from this group (He et al. 2008), only a small percentage of
fluorescence was excreted 24 hours after intravenous administration of 45nm fluorescent-labelled
SiO2 with three different surface modifications; half-lives for the fluorescent label in blood ranged from
0.5-3 hours.
In contrast, Lu et al. (2010) found 94% of fluorescent mesoporous SiO2 modified with addition of
phosphonate (100-130 nm) were excreted 4 days after daily intravenous injections for 10 days.
Excretion was measured as concentration of Si in urine and faeces. After 24 hours, 26% was
excreted mainly via urine. However in some tissues (spleen, intestine, lung), the Si concentration
increased rather than decreased 4-48 hours post-dosing. Dekkers et al. (2012) remarked that it
seems only a fraction of the nanomaterial reached these tissues, but once in the tissues, the Si was
retained for a long period of time, in line with slow elimination from tissues found in other studies.
These studies suggest some tissue accumulation of Si from nano-SiO2 is anticipated after oral
exposure as it is expected to be ingested daily in food (Dekkers et al. 2012, van Kesteren et al. 2014).
However, the majority of ingested nano-SiO2 is expected to be eliminated in urine and faeces within 1-
3 or 1-6 days of exposure, respectively.

Page 47 of 106
Summary:
Overall the studies indicate most of the oral administered nano-SiO2 is excreted in faeces, consistent
with low bioavailability. Once in the blood Si from nano-SiO2 is quickly removed by tissue uptake and
urinary excretion. Si in tissues, mainly liver and spleen, is only slowly removed. Although a few
studies have identified particulates in tissues after dosing animals with nano-SiO2 most rely on Si or
fluorescence from tagged NMs to infer it was particulates that could have been absorbed across the
gastrointestinal tract. However dissolution of nano-SiO2 has been shown to occur suggesting systemic
Si measurements may be due to absorption of soluble Si and SiO2 NPs. Gastrointestinal absorption of
Si from SiO2 NMs in vivo is likely to be low to moderate; perhaps ~0.2% from diet and very low to
~10% after gavage administration, depending on the study.
4.2.4 Toxicity Cytotoxicity and genotoxicity:
Amorphous SiO2 NPs are often used as a negative reference substance in cytotoxicity experiments
with other NPs due to their long history of safe use as food additives (Brunner et al. 2006)51. Although
in vitro cytotoxicity experiments may be useful for investigating the mechanistic aspects of nano-SiO2,
they add little information to understanding the toxicological effects and dose response of SiO2 after
oral exposure. For this reason, these studies are not further discussed in this review.
Conflicting results for genotoxicity assays have been found in the literature.
• Commercial colloidal and laboratory-synthesised SiO2 nanoparticles were not genotoxic in
mammalian cells in vitro when tested in two separate laboratories by Comet assay52 (Barnes
et al. 2008).
• One of four types of amorphous SiO2 NPs induced a minor, but dose related and statistically
significant increase in chromosomal aberrations in the in vitro micronucleus assay and two
induced gene mutations in mouse embryonic fibroblasts carrying the lacZ reporter gene (Park
et al. 2011).
• Tarantini et al. (2015) found size- and concentration-dependent effects of 15 and 55 nm
colloidal SiO2 NPs on chromosome damage in the cytokinesis-block in vitro micronucleus 51 Brunner et al. (2006) found no significant cytotoxic effects for exposures of mesothelioma MSTO-211H cells up to 15 ppm silica (mean 14 nm, 100% agglomerated to >200 nm in size) after 6 days and 30 ppm silica for 3 days. 52 Comet assays were performed on 3T3-L1 fibroblasts with 3, 6, and 24 hour incubations and 4 or 40 µg/mL silica NPs. Particle sizes by dynamic light scattering of the NPs used in the genotoxicity assays ranged from 20.5-269 nm.

Page 48 of 106
assay with human intestinal Caco-2 cells, with 15 nm NPs demonstrating a 1.5-3 fold increase
in micronucleus frequency. No induction above that of controls was found for the 55 nm NPs.
• In contrast, no genotoxicity was observed for amorphous SiO2 NPs (15 and 300 nm) when
tested in cell transformation and micronucleus assays using Balb/3T3 mouse fibroblasts
(Uboldi et al. 2012).
Summary:
In vivo genotoxicity information for SiO2 NMs is not readily available. However it is apparent that some
types of nano-SiO2 can be genotoxic to mammalian cells in in vitro test systems. Data for food grade
SiO2 was not found.
Systemic toxicity:
Several oral toxicity studies with SiO2 nanomaterials per se have become available in the last few
years.
Gavage and diet studies which show no adverse effects are:
• Buesen et al. (2014) investigated the subacute 28-day oral toxicity of four types of SiO2
nanomaterials53 via gavage dosing to rats (OECD 407 limit test) at 1,000 mg/kg/d. Whether
the rats were fasted prior to dosing was not indicated. In addition to the basic haematological
and clinical chemistry parameters, the acute phase proteins haptoglobin and α2-macroglobulin
as well as cardiac troponin I were also determined54, metabolomics was also undertaken.
Nanoparticles were administered by gavage in a phosphate buffered saline vehicle with bovine
serum albumin, and state of agglomeration within this vehicle was assessed for naked SiO2
and SiO2.PEG (polyethylene glycol). The SiO2 PEG formed large agglomerates above 1 µm
and significantly adsorbed proteins in the vehicle, whereas the naked SiO2 particles remained
stable forming only minimal agglomerates but nonetheless also significantly adsorbed protein.
The authors found no treatment-related adverse effects for any of the NMs. Since organ
burden was not analysed, it was not possible to establish whether the lack of findings related
to the absence of systemic exposure.
53 Nanomaterials tested had negative (SiO2.phosphate), neutral (SiO2.polyethylene glycol) and slightly positive (SiO2.amino) charges, or naked NPs with no surface modification. Mean particle size ranged from 40-50 nm. 54 These biomarkers had been previously suggested as useful in detecting nanoparticle-induced effects at very early stages preceding clinically observable effects (Buesen et al. 2014).

Page 49 of 106
• Yoshida et al. (2014) gavaged mice with unmodified and surface-modified amorphous SiO2
(70, 300 and 1000 nm)55 at 2.5 mg/mouse (~150 mg/kg/d)56 for 28 days. No adverse effects
were observed.
• A 90-day gavage study in which rats were administered negatively-charged colloidal SiO2 NPs
(20 or 100 nm) as per the OECD guideline (No. 408) found no treatment-related clinical
changes or histopathological findings at any dose tested (500, 1000 or 2000 mg/kg/d) (Kim et
al. 2014). A NOAEL of 2000 mg/kg/d was established by the study authors.
• Another 90-day study, in which rats were administered commercial SiO2 NPs (5-30 nm) for 30
days via gavage followed by 62 days via diet at concentrations to deliver the same daily dose
as received with gavage57. They found no clinically significant treatment-related effects at any
of the doses tested (0.1, 1, 10, and 100 mg/kg/d) (Shumakova et al. 2014).
• Yun et al. (2015) administered SiO2 NPs (12 nm)58 in distilled water to rats by gavage for 91
days at doses of 244.9, 489.8 and 979.5 mg/kg/d. The test was performed according to OECD
guidelines (No. 408). No treatment-related adverse effects were observed throughout the
study.
• The reproductive toxicity of NM-200 synthetic amorphous SiO2 (aggregated)59 was
investigated in a 2-generation study with rats (OECD guideline 416). Doses were 100, 300, or
1000 mg/kg/d by gavage for two consecutive generations. No adverse effects were observed
on reproductive performance or the growth and development of offspring into adulthood. The
NOAEL was 1000 mg/kg/d (Wolterbeek et al. 2015).
55 All sizes were tested for the unmodified particles. In addition, the 70 nm particles were surface-modified (carboxyl- or amine- group addition) and also used in the tests. 56 Body weight of mice not provided in this study (Yoshida et al. 2014), however female BALB/c mice 6 weeks of age as used in the study typically weigh on average 17 g (Sage Labs 2015). A dose of 2.5 mg/mouse would therefore equate to ~150 mg/kg/d. 57 Only an abstract of this paper was available to ToxConsult. 58 Primary particle size by TEM 12 nm. Hydrodynamic size by dynamic light scattering in aqueous suspension was similar at 33.5 ± 7.5 nm (Yun et al. 2015). 59 Particle size analysis of NM-200 in the vehicle (methylhydroxypropylcellulose, MHPC) revealed NPs were agglomerated; mean hydrodynamic diameters varied between 1076-1664 nm (in 10 mg/ml samples), 876-1216 nm (in 30 mg/ml samples) and 409-703 nm (in 100 mg/ml samples).

Page 50 of 106
• Other unpublished studies that have shown no effects after dietary exposure for 90d – 2 years
are Degussa (1969, 1981), Cabot et al. (1985) and Grace (1975b). These have been
described in a number of reviews and are briefly summarised in Table 4.2.1. While it is
presumed some of these studies have been conducted with food grade SiO2 it is not
necessarily clear from the reviews that this is the case.
Studies showing effects:
• van der Zande et al. (2014) exposed rats via diet to 100, 1000, or 2500 mg/kg/d of
commercially available food-grade hydrophilic pyrogenic amorphous SiO2 NMs60 or to 100,
500 or 1000 mg/kg pyrogenic SiO2 NM-20261 in feed mixtures62 for 28 days, or to the highest
dose of each type for 84 days. Total Si content was determined by inductively coupled plasma
mass spectroscopy (ICP-MS) in liver, kidney, spleen, brain and testis. Hydrodynamic
chromatography (HDC) ICP-MS was applied to detect SiO2 particles in gastrointestinal
contents after the 28-day exposure.
o Between 50-100% of the total Si content in the small intestines was present as nano-size
particles in most exposure groups compared with 17% in the control group63. In the large
intestines, ~80% of the total silica content was nanoparticles for the NM-202, whereas this
was more variable for the amorphous SiO2 (50, 100 and 50% for the three exposure
groups, respectively). Control rats had the lowest fraction (25%) of Si as particles in the
nano-size range in the large intestine. Clearly the non-nano SiO2 present in control feed is
present as nano-size, or becomes nanoparticulate after gastric solubilisation and
precipitation in the small intestine (see Peters et al. 2012, Section 4.2.1).
o The doses tested did not result in significantly elevated total Si levels in tissues after 28
days exposure, apart from in the livers of NM-202 treated rats in the low and medium dose 60 Primary particle size: 7nm. In water ≥78% of the material <100 nm (SEM). In feed matrix, approximately 40% was 5-200 nm (ICP-MS). 61 Primary particle size: 10-25nm. In water ≥61% of the material <100 nm (SEM). In feed matrix, approximately 100% was 5-200 nm (ICP-MS). NM-202 was included as it is the OECD reference compound for nano-silica applications in food. 62 Nanomaterials were mixed with ground standard feed pellets and chocolate milk added to increase palatability. A 2-hour fasting period took place prior to offering the prepared feed to animals. All animals consumed the complete amount of feed mixture they were offered within the two hour exposure time frame. Immediately thereafter, rats were offered standard feed pellets ad libitum. 63 The control group was fed a standard rodent diet which naturally contains silica, but not nano-sized silica.

Page 51 of 106
groups. No adverse effects, which included measures of immunotoxicity, were observed
after 28 days. After 84 days, however, amorphous SiO2, but not NM-202, accumulated in
the spleen of rats (see also Section 4.2.2). Histopathological analysis revealed an
increased incidence of hepatic fibrosis in the liver after 84 days of exposure, reaching
statistical significance only in NM-202 treated animals. This was accompanied by a
moderate, but significant increase in expression of fibrosis-related genes in liver samples.
The authors remarked that the liver effects observed in this study were of much lower
severity and incidence than in previous studies, in which SiO2 NPs (produced by
precipitation) had been systemically administered. The biological relevance of the
observations requires further study, especially at doses more relevant to human
exposure64 (van der Zande et al. 2014).
• In another repeat dose oral toxicity study, dietary exposure for 10 weeks of 1% nano-sized65
amorphous SiO2 obtained from rice husk (i.e. biogenic) (equivalent to 2000 mg/kg/d) in mice
resulted in liver toxicity (increased alanine aminotransferase [ALT] levels and some fatty liver
patterns after H&E staining) (So et al. 2008, as described in Dekkers et al. 2011, 2012)66. The
effect appeared particle-size dependent, since liver toxicity was less severe in mice exposed
to the same concentration of micron-sized67 SiO2. The Si content in the livers of the two
groups of mice were “almost the same”. A drawback of the study is the SiO2 was characterised
only to a limited extent, and the ALT was only measured in 3 mice. The increased ALT was
only found for Balb/c mice and not for C57BL/6J mice. Fruijtier-Polloth (2012) on reviewing the
So et al. (2008) study remarked the ALT value (102.5 vs. 52.5 U/L) is well within the normal
range of values reported for these mice in the literature (40.8±6.7 - 226±105). They also noted
because the SiO2 was of natural origin, it may have been contaminated with organic impurities
or crystalline SiO2 (Fruijtier-Polloth 2012).
64 Consumer intake of SiO2 from food was estimated at 9.4 mg/kg/d, of which 1.8 mg/kg/d was estimated to be in the nano-size range (Dekkers et al. 2011). Another estimate for typical dietary intake of silicon was 20-50 mg Si/day (i.e. 0.3-0.8 mg/kg/d); this equates to an equivalent daily intake of SiO2 of 0.6-1.7 mg/kg/d (EFSA 2009a).The dose in the 84-day oral toxicity study of van der Zande et al. (2014), where liver effects were observed, was 1,000 mg/kg/d (i.e. ~550-1,700 times higher than in consumers). 65 30-90 nm. 66 Only an abstract of the So et al. (2008) study was available to ToxConsult. The study description is primarily sourced from Dekkers et al. (2011, 2012). 67 0.5 - 30µm.

Page 52 of 106
• Other unpublished studies that have shown effects after dietary exposure are Degussa (1964
a, b), Cabot et al. (1970b) and Takizawa et al. (1988). These have been described in a
number of reviews and are briefly summarised in Table 4.2.1. While it is presumed these have
been conducted with food grade SiO2 it is not necessarily clear from the reviews that this is the
case.
Food-grade (presumably) micronised synthetic amorphous SiO2 has been tested in several repeat
oral toxicity studies by gavage and diet. Some of these are unpublished studies, but have been
summarised by Dekkers et al. (2012), Fruijtier-Pölloth (2012), UNEP (2004), EFSA (2004b), or van
Kesteren et al. (2014). Table 4.2.1 provides a summary of the relevant studies, along with the results
from studies conducted with nano-SiO2 (discussed in the previous text).
Table 4.2.1: Repeat oral toxicity studies with nano-SiO2 and food-grade amorphous SiO2
Type of SiO2
Test species
Exposure/ duration
Doses (mg/kg/d)
Endpoint (mg/kg/d)
Basis Reference
nano l Wistar rats
Gavage: 2-gen
100, 300, 1000
NOAEL: 1000
No adverse effects observed, standard parameters
Wolterbeek et al. 2015
nano & micro k
BALB/c mice
Gavage: 28 d
~150 NOAEL: 150
No effects observed Yoshida et al. 2014
3 different nano a
Wistar rats
Gavage: 28 d
1,000 NOAEL: 1000
No effects: - standard parameters & additional biomarkers - metabolomics
Buesen et al. 2014
nano h Sprague-Dawley rats
Gavage: 90 d
500, 1000, 2000
NOAEL: 2000
No treatment related effects on standard parameters
Kim et al. 2014
nano m Sprague-Dawley rats
Gavage: 91 d
244.9, 489.8, 979.5
NOAEL: 979.5
No adverse effects observed, standard parameters
Yun et al. 2015
nano i Rats (no further details)
Gavage: 30 d followed by diet: 62 d
0.1, 1, 10, 100
NOAEL: 100
No clinically significant treatment-related effects on standard parameters Shumakova
et al. 2014
Hydrophilic pyrogenic nano food grade b
Sprague-Dawley rats
Diet: 28 d
100, 1000, 2500
NOAEL: 2500
No effects: - standard parameters - immunotoxicity measures
van der Zande et al. 2014
nano c Diet: 28 d
100, 500 1000
NOAEL: 1000

Page 53 of 106
Type of SiO2
Test species
Exposure/ duration
Doses (mg/kg/d)
Endpoint (mg/kg/d)
Basis Reference
Hydrophobic pyrogenic SAS
Wistar rats
Diet: 35 – 56 d
500, 1000, 2000, 16000
NOAEL: 1000 LOAEL: 1000 j
or 2000
- “mild effects on liver” at 1000 mg/kg/d. - Severe atrophy of liver epithelium at top two doses.
Degussa 1964b, c e
nano (bio-) d Balb/c & C57B/6J mice
Diet: ~70 d
1% (i.e. 2000)
LOAEL: 2000
- slight ↑ ALT in Balb/c mice only. - fatty liver staining.
So et al. 2008 e
Hydrophilic pyrogenic nano food gradeb
Sprague-Dawley rats
Diet: 84 d
2500 LOAEL(?): 2500
- ↑ incidence of periportal fibrosis in liver. - ↑ expression of fibrosis-related genes in liver.
van der Zande et al. 2014
nano c Diet: 84 d
1000 LOAEL(?): 1000
Hydrophilic pyrogenic SAS
Charles River rats
Diet: 90 d
1000, 3000, 5000
NOAEL: 5000
No effects observed, details not provided Cabot
1985b e
Hydrophilic precip. SAS
Wistar rats
Diet: 90 d
250, 1000, 4000
NOAEL: 4000
No effects observed, details not provided
Degussa 1981 e
Hydrophobic pyrogenic SAS
Charles River rats
Diet: 90 d
1000, 2000, 4000
NOAEL: 1000 LOAEL: 2000
- Minimal changes in thyroid of male rats at 2000 and 4000 mg/kg/d
Cabot 1970b e
Gel CD mice Diet: 6 mths (180 d)
2170, 7950 (M) 2420, 8980 (F)
NOAEL: 7950
No effects observed, details not provided Grace
1975b e
Food-grade micronised SAS
B6C3F1 mice
Diet: 21 mths (630 d)
1900, 3800, 7500 f
NOAEL: 2500 g
- ↓ growth at top dose
Takizawa et al. 1988e
Fischer rats
Diet: 24 mths (720 d)
1250, 2500, 5000 f
- Slight ↓ liver weights at mid- and top dose (not dose-related). - ↓ body weight at mid- and top- dose
Hydrophobic pyrogenic SAS
Wistar rats
Diet: 24 mths (720 d)
100 NOAEL: 100
No effects observed, details not provided Degussa
1969 e
SAS = synthetic amorphous silica, no particle sizing provided; M = males; F = females. a SiO2.phosphate, SiO2.polyethylene glycol, SiO2.amino, or naked NPs. Mean particle size ranged from 40-50nm. b Primary particle size: 7nm. In water ≥78% of the material <100 nm (SEM). In feed matrix, approximately 40% was 5-200
nm (ICP-MS). c Pyrogenic NM-202. Primary particle size: 10-25nm. In water ≥61% of the material <100 nm (SEM). In feed matrix,
approximately 100% was 5-200 nm (ICP-MS). NM-202 was included as it is the OECD reference compound for nano-silica applications in food.
d Nano-SiO2 from rice husk. 30-90 nm. e As described in Dekkers et al. (2012), Fruijtier-Pölloth (2012), UNEP (2004), EFSA (2004b), or van Kesteren et al. (2014).

Page 54 of 106
f Top doses provided in Dekkers et al. (2012) did not match top doses reported by EFSA (2004b). The doses provided in table are as reported by EFSA (2009a).
g UNEP (2004) derived an overall NOAEL of 2,500 mg/kg/d from the Takizawa et al. (1988) study. h Negatively-charged colloidal SiO2 NPs (20 or 100 nm). i 5-30 nm. No further information provided (Abstract only). j The original unpublished study was not available to ToxConsult. According to Dekkers et al. (2012) and van Kesteren et al.
(2014), less severe effects on the liver (atrophy of the liver epithelium, decrease of the basophilic nuclei and glycogen content) were observed in two females of the mid dose group (1000 mg/kg/d). The original authors of the study suggested these findings at 1000 mg/kg/d could be the result of infection, observed frequently in rats used in this laboratory, and 1000 mg/kg/d was considered a NOAEL by Degussa (1964b, c). However, due to the uncertainties about the cause of the observed liver toxicity at 1000 mg/kg/d, van Kesteren et al. (2014) considered this dose to be a LOAEL, not a NOAEL.
k Unmodified amorphous SiO2 particles were tested with sizes of 70, 300 or 1000 nm. In addition, surface-modified 70 nm particles (carboxyl- or amine- group addition) were also tested.
l NM-200 synthetic amorphous SiO2 (aggregated). Particle size analysis of NM-200 in the vehicle (methylhydroxypropylcellulose, MHPC) revealed NPs were agglomerated; mean hydrodynamic diameters varied between 1076-1664 nm (in 10 mg/ml samples), 876-1216 nm (in 30 mg/ml samples) and 409-703 nm (in 100 mg/ml samples).
After reviewing the available oral toxicity information for SAS and nano-SiO2, Dekkers et al. (2012)
concluded there were no major differences between the two. They remarked, however, that the
effects of particle size and surface coating on the oral toxicity are unknown. The study by van der
Zande et al. (2014) was not yet published at the time Dekkers et al. (2012) made this conclusion.
The information in Table 4.2.1 indicates the following NOAELs after gavage of various nano-SiO2:
• 100 – 1000 mg/kg/d in 28d studies.
• ~1000 mg/kg/d in 90d studies.
• 1,000 mg/kg/d in a rat two generation study.
In dietary studies with food grade SiO2, specified as nano-SiO2 or synthetic amorphous silica, but no
particle sizing provided, the NOAELs are:
• 1000 – 5000 mg/kg/d in 28d and 90d studies.
• 2500 mg/kg/d in a 24 mth study.
Summary:
The gavage and dietary studies, up to 90 days, with nano-SiO2 (unspecified as to food grade) and
sub-chronic and chronic diet studies with SiO2 that is presumed to be food grade (but uncertain)
indicate low toxicity of the administered SiO2. The NOAELs are high, collectively around 1,000
mg/kg/d. It is concluded from a hazard aspect that there is no evidence to suggest at human dietary
exposures an unacceptable risk is likely. The database is however lacking in in vivo genotoxicity and
developmental studies.

Page 55 of 106
4.2.5 Conclusions Amorphous SiO2 has been used as a food additive for decades. It is designated as E551.
• The percentage of SiO2 foods that is ‘nano’ size ranges from <4% to approximately 40%.
• The nanoparticle size in food is typically 50 – 200nm.
• Consumer intake of SiO2 from food has been estimated to be 0.3 - 9.4 mg/kg/d for a 70 kg
adult (i.e. ~0.14 - 4.4 mg Si/kg/d), of which ~0.06 - 1.8 mg/kg/d (i.e. ~0.03 - 0.8 mg Si/kg/d)
could be in the nano-size.
In experimental animals most of the orally administered nano-SiO2 is excreted in faeces. This is
consistent with low bioavailability. Once in the blood Si from nano-SiO2 is quickly removed by tissue
uptake and urinary excretion. Si in tissues, mainly liver and spleen, is only slowly removed. Data for
tissue half-lives is not available. Although a few studies have identified particulates in tissues after
dosing animals with nano-SiO2 most studies rely on Si or fluorescence from the tagged nanoparticle
to infer particulates could have been absorbed across the gastrointestinal tract. However dissolution
of nano-SiO2 has been shown to occur in gastric fluids suggesting Si measurements in systemic
tissues may be due to absorption of soluble Si and/or SiO2 nano-particles. Gastrointestinal absorption
of Si from SiO2 NMs in vivo is likely to be low to moderate; perhaps ~0.2% from diet and very low to
~10% after gavage administration, depending on the study.
Some types of nano-SiO2 can cause chromosomal damage to mammalian cells in in vitro test
systems. Data for in vivo exposure or for food grade SiO2 was not found.
Gavage and dietary studies, up to 90 days, with nano-SiO2 (unspecified as to food grade) and sub-
chronic and chronic diet studies with SiO2 that is presumed to be food grade, (but uncertain) indicate
very low toxicity of the administered SiO2. The NOAELs are high, collectively ≥1,000 mg/kg/d. It is
concluded from a hazard aspect that there is no evidence to suggest at human dietary exposures an
unacceptable risk is likely. The database is however lacking in in vivo genotoxicity and developmental
studies.
The European Food Safety Authority concluded exposures to SiO2 in food supplements and from
typical dietary intakes are of no safety concern (EFSA 2009a).

Page 56 of 106
4.3 Nanosilver (nanoAg or Ag-NPs) Silver nanoparticles (Ag-NPs) are the most widely produced and marketed NPs. They are commonly
used in consumer products for to their antimicrobial properties, including food contact materials and
medical equipment (Gaillet and Rouanet 2015, US EPA 2010). They are incorporated as an
antibacterial coating in food packaging materials and food preparation equipment which means direct
contact with food could theoretically occur (Bouwmeester et al. 2009, Chaudhry et al. 2008). The
likelihood of this occurring is explored in ToxConsult (2016b). Information suggests nano-Ag may also
be currently used as a food additive or dietary supplement (Bouwmeester et al. 2009, Chaudhry et al.
2008, Gaillet and Rouanet 2015, US EPA 2014).
Colloidal silver (consisting of silver particles suspended in liquid) and formulations containing silver
salts were used by physicians in the late 19th century, but their use was largely discontinued in the
1940s following the development of modern antibiotics (Fung and Bowen 1996). Since the 1990s,
colloidal silver has been marketed as an alternative medicine, however its effectiveness for such uses
has not been proven (Fung and Bowen 1996). After chronic medical or occupational over-exposure to
silver, argyria (a permanent grey or blue grey discolouration of the skin and other organs) is the most
common finding (ATSDR 1990).
In Australia, silver is permitted for use as a food additive in confectionary, spirits and liqueurs to GMP.
It is also approved for use in food colouring68 (E174) in the European Union, also to GMP (EC 1994).
The Joint FAO/WHO Expert Committee on Food Additives evaluated silver in 1977, but did not set an
acceptable daily intake (JECFA 1977). The US EPA derived an oral reference dose (RfD) (i.e. the
dose that can be ingested daily for a lifetime without adverse effects) for silver in humans of
0.005mg/kg/d (i.e. 5 µg/kg/d) (US EPA IRIS 1996)69. This is similar to the daily dose that is equivalent
to the human lifetime NOAEL (10 g over a lifetime) for argyria from the WHO Guidelines for Drinking
Water Quality (WHO 2011)70.
68 Only allowed for external coating of confectionary, decoration of chocolates, and in liqueurs. 69 The RfD was based on the lowest dose (i.e. 1g of metallic Ag) resulting in argyria in one of 13 individuals following intravenous medical therapy over a 2 - 9.75 year period. This was converted to an oral dose of 25 g by accounting for oral absorption (i.e. 1 g ÷ 0.04 = 25 g), converting this to a lifetime dose [(25 g x 1000 mg/g) ÷ (70 kg body weight x 25,500 days) = 0.014 mg/kg/d] and applying an uncertainty factor of 3 for minimal effects in a subpopulation which has exhibited an increased propensity for the development of argyria (US EPA IRIS 1996). It is noted this RfD is old and was established well before many of the toxicological studies on nanosilver were available. 70 10 g over a lifetime = 10,000 mg ÷ 70 years ÷ 365 days/year ÷ 70 kg body weight = 0.0056 mg/kg/d.

Page 57 of 106
Daily human dietary Ag intake (assumed to be all forms, i.e. nano- and non-nano) has been estimated
to be <0.4 µg/day in an Italian population, 7 µg/day in Canadian women, and 27 µg/day in a UK
population, corresponding to 0.006-0.4 µg/kg/d71 (Hadrup and Lam 2013).
4.3.1 Behaviour in GIT Böhmert et al. (2014) monitored the size of nano-Ag particles72 during digestion simulated by
incubation with artificial saliva, gastric juice and intestinal juice. The artificial saliva had a minor effect
on the size of the particles (possibly due to the commercial stabilisers present in the commercial
preparation used in the experiments). However in gastric and intestinal juice a significant quantity of
micron-size aggregates or agglomerates were formed. Nonetheless the cytotoxicity of the starting and
digested nano-Ag was virtually the same when measured with conventional dye viability tests in
incubated Caco-2 cells. A more sensitive assay for cell viability using real time membrane impedance
measurements showed lower cytotoxicity with the digested material. The authors considered this was
due to the aggregates releasing lower amounts of silver ions than the nano-Ag particles. The authors
presumed the Ag-NPs can reach the intestinal epithelial cells after ingestion with only a slight
reduction in their cytotoxic potential. It is noted the cytotoxicity occurred at high concentrations of
added nano-Ag to the Caco-2 cells, and silver ions were not monitored. The effect of food was not
investigated.
Rogers et al. (2012) and Mwilu et al. (2013) have also investigated the fate of Ag-NPs with in vitro
digestion models. Although the synthetic gastric fluid used in these experiments was much less
complex (no protein present) than expected in vivo, the high acidity resulted in significant Ag-NP
transformations from the nano-Ag starting material. Ag-NPs with different stabilising capping agents
exposed were found to significantly aggregate, this likely occurred as a result of destruction or
removal of stabilising agents from their surface. As the aggregates oxidised and ionic silver was
released it precipitated as silver chloride and physically associated with the particle aggregates73.
71 Assuming a body weight of 70 kg in adults, these intakes would correspond to 0.006-0.4 µg/kg/d. 72 In Böhmert et al. (2014) the Ag nanoparticles were from a commercial source and described as 4% (w/w) Ag, stabilised with 4% polyoxyethylene glycerol trioleate and 4% Tween 20, this is presumably to prevent aggregation and/or oxidation (Prathna et al. 2011). The particles were characterised by the authors as 7.02±0.68nm silver core and 14.7±0.2nm hydrodynamic radius. 73 Rogers et al. (2012) and Mwilu et al. (2014) followed the Ag-NP transformations (morphology, size and chemical composition) during a 30 min exposure to synthetic human stomach fluid (SSF) using Absorbance Spectroscopy, High Resolution Transmission Electron and Scanning Electron Microscopy, Dynamic Light Scattering, and Nanoparticle Tracking Analysis. These authors also noted polyvinylpyrrolidone (pvp)-stabilised

Page 58 of 106
Reflective of their larger surface area and chemical reactivity the smaller sized Ag-NPs generally
showed higher rates of aggregation and physical transformation than larger particles.
Walczak et al. (2012) observed similar effects in the absence of proteins. After simulated gastric and
intestinal digestion, only a small fraction of the initial Ag-NPs survived solubilisation. With the
presence of protein the number of Ag-NPs dropped significantly after incubation in gastric fluid due to
agglomeration mediated by chloride ions, only to rise back to original values after the intestinal
digestion. It appeared the protein protected the Ag-NPs from solubilisation. Interestingly, while there
were no particles observed with soluble AgNO3 in synthetic saliva or gastric juice a large number of
small nano-size particles were observed when the gastric digests were transferred to intestinal fluid
with protein. Based on elemental analysis these ‘intestinal formed’ particles were considered to be
most probably Ag2S and/or AgCl fine precipitates. The authors noted that after oral administration of
Ag-NPs or Ag+, silver particles containing sulphur are found in tissues and intestinal epithelium.
Summary:
Overall it is possible larger Ag-NPs with more durable particle coatings may survive transit through
the stomach, or agglomerated Ag-NPs (with chlorine inter-particle bridges) may separate into
individual particles when transitioned into higher pH intestinal fluid (Walczak et al. 2012). The
formation of silver chloride in the stomach complicates ascribing any toxicity observed in oral toxicity
studies with Ag-NPs to their nano-nature.
4.3.2 Absorption The extent of absorption of Ag from ionic AgNO3 after oral administration has been estimated to be
0.4-10% depending on the species investigated; 10% and 6% for dogs and monkeys, respectively. Ag
retention in a woman with argyria was found to be 18% of an orally administered dose (Hadrup and
Lam 2013).
Studies which have compared the absorption of ionic Ag and Ag-NPs after oral administration have
found the latter to be less bioavailable based on higher faecal excretion and lower total Ag levels in
tissues (Loeschner et al. 2011, van der Zande et al. 2012, Hadrup et al. 2012a, Hadrup and Lam
2013). A possible explanation for a decreased absorption of Ag-NPs would be enhanced binding of
Ag-NPs prepared in house behaved differently in SSF than particles obtained from a commercial source despite having similar surface coating and size distribution characteristics.

Page 59 of 106
NPs, or Ag from NPs, to non-digestible food components. Preliminary investigations for the presence
of Ag-NPs in dried faeces by SEM provided no evidence for their presence (Loeschner et al. 2011).
Intestinal absorption of 0.12 - 0.88% for the Ag from Ag-NPs has been reported based on
physiologically based pharmacokinetic modelling (PBPK) (Bachler et al. 2013). These predictions also
agree with the results of Bouwmeester et al. (2011) who measured translocation of Ag from Ag-NPs
(20 and 30 nm) to be 0.2 - 0.6% in an in vitro intestinal epithelium coculture model over 4 hours. The
PBPK model also predicted a higher (3.25%) absorption for Ag acetate in rats (Bachler et al. 2013).
Whether Ag-NPs are absorbed as an entity, or as Ag dissolved in the gastrointestinal system, or
whether particles from re-deposition in the intestines are absorbed, remains unclear (Loeschner et al.
2011, Wijnhoven et al. 2009).
4.3.3 Distribution Hadrup and Lam (2014) reported in a recent review Ag from ingested Ag-NPs is distributed to all
organs examined, and as expected the highest levels are in the stomach and intestine. Particle
surface charge and coating seem to be of minor importance for nano-Ag distribution into organs,
except in the case of coating intended to alter protein binding (Bachler et al. 2013). This may be
because the binding of proteins to the surface of Ag-NPs (i.e. formation of protein corona) has the
effect of stabilising the particles and ultimately determines their biodistribution and clearance from
blood.
A 14-day gavage study in mice (Park et al. 2010a) with different sized74 bare Ag-NPs in deionised
water at 1 mg/kg/d resulted in size dependent distribution of silver (Ag-NPs not assessed) to brain,
lung, liver, kidney and testis after administration of small particles (22, 42, or 71nm) but not for large
size (323nm). Higher tissue concentrations of Ag were associated with the smaller particle size.
Loeschner et al. (2011) found after 28 days repeated gavage administration of Ag-NPs (14 ± 4 nm)
and Ag acetate in rats (both at a dose of 9 mg Ag/kg/d), the organ distribution pattern for Ag was
similar. However total Ag concentrations in tissues were lower75 after oral exposure to Ag-NPs, and
faecal excretion was higher. The highest Ag concentrations were detected in the small intestine, 74 Average diameters of Ag-NPs used by Park et al. (2010a) were 22, 42, 71, and 323 nm. 75 40-50% lower than concentrations in kidney, stomach, brain and plasma; 10-20% lower for muscle and lungs; ~60% lower for liver.

Page 60 of 106
stomach, kidneys, and liver. Ag was also found in the lungs and brain. Nano-sized (≤ 12 nm) granules
were detected with transmission electron microscopy (TEM) in the ileum of rats exposed to Ag
acetate or Ag-NPs, with particles mainly located in the basal lamina, in epithelial cell lysosomes of
macrophages within the lamina propria. Energy dispersive x-ray spectroscopy (EDX) showed there
was no qualitative difference between the elemental composition of the Ag granules in the ileum after
Ag acetate or Ag-NP administration. However whether the nano-granules were absorbed as Ag-NP,
or absorbed as dissolved ions followed by particle precipitation in tissues is unclear.
This was consistent with findings in another study by van der Zande et al. (2012). Rats were exposed
to one of two types of Ag-NPs76 (90 mg/kg/d) or AgNO3 (9 mg/kg/d)77 for 28 days via gavage. At day
29 animals were euthanized and organs collected; wash-out groups were euthanized at day 36 and
84. Results were normalised on the silver exposure dose. Ag content in the blood of animals treated
with AgNO3 was significantly higher than that of the Ag-NP groups, illustrating a higher uptake of Ag
from AgNO3. Faecal silver content was also slightly higher in the AgNO3 group than the Ag-NP groups.
In all three exposure groups, Ag concentrations were highest in the emptied tissues of the
gastrointestinal tract, followed by the liver, spleen, testis, kidney, brain and lungs. The normalised
tissue Ag concentrations were similar in the AgNO3 group compared to the uncoated Ag-NP group
except for in the testis and spleen, where the Ag-NP groups had statistically significantly higher
concentrations78. The NP coating had no influence on the tissue distribution profile. Results from day
29 indicated both Ag-NP groups and the AgNO3 group contained intact NPs in the liver, spleen and
lungs, as well as the gastrointestinal contents 1 day after the final exposure. No intact NPs were
detected at days 36 or 84. The data indicates nano-size particles are formed in vivo from soluble Ag.
Blood biochemical and immune parameter analysis revealed no significant differences between the
Ag-NP groups and the AgNO3 group.
At the conclusion of a 91-day rat gavage study with Ag-NPs (11 nm) dispersed in water, Ag
concentrations in blood, faeces, urine (high dose only), and all tissues tested (liver, kidney, spleen,
lung and brain) were increased compared with controls (Yun et al. 2015).
76 The two types of Ag-NPs used were uncoated (17.7 ± 3.3 nm, unimodal) and NPs coated with 75 wt % polyvinylpyrrolidone (12.1 ± 8 nm, bimodal). 77 According to the authors, the 10 times lower dose of AgNO3 was intentionally chosen in the range of the soluble silver content in the uncoated Ag-NP suspension (van der Zande et al. 2012). 78 Normalised tissue silver concentrations in the AgNO3 group were approximately 35 and 27 µg Ag/kg tissue in the spleen and testis, respectively. For the 17.7 nm Ag NP group, these concentrations were approximately 45 and 43 µg Ag/kg tissue, respectively. Thus the mean normalised tissue concentrations in the Ag NP group were ~30-60% higher.

Page 61 of 106
Lee et al. (2013) investigated the tissue clearance of Ag after gavage administration of 10 and 25 nm
Ag-NPs (100 or 500 mg/kg/d) for 28 days after a 4 month recovery period. For both NP sizes, tissue
Ag concentrations gradually decreased during the 4 months following cessation of exposure,
indicating tissue clearance of accumulated Ag was occurring. The reported tissue clearance half-lives
for male and female rats are provided in Table 4.3.1. The data suggest the residence time of silver in
the brain may be longer than in other tissues, however this is not immediately clear from the data and
requires additional studies to confirm. Nevertheless long retention in the brain is consistent with van
der Zande et al. (2012) who found silver in the brain 8 weeks after gavage of Ag-NPs or silver nitrate.
In this study brain silver concentrations were similar after the same administered dose of silver from
Ag-NP or silver nitrate.
Table 4.3.1: Clearance half-lives of Ag in rats after 28 days gavage administration of Ag-NPs a
Tissue Half-life (days) 100 mg/kg/d 500 mg/kg/d
Males Females Males Females 10 nm Blood 76.9 77.3 98.9 78.1 Brain 260.8 140.2 95.9 77.9 Kidneys 29.8 79.6 69.8 77.5 Liver 38.6 189.3 24.1 74.7 Spleen 48.7 56.1 54.9 56.0 Testes/ovaries 55.0 34.8 N/A 35.8 25 nm Blood 77.5 141.5 133.3 140.1 Brain 136.0 124.1 81.1 60.1 Kidneys 32.1 45.6 53.7 87.9 Liver 70.1 60.7 62.9 68.3 Spleen 30.9 66.3 164.9 66.9 Testes/ovaries 64.6 61.9 N/A 33.9
N/A = not applicable (Clearance half-life not obtainable). a Data from Lee et al. (2013), Table 1.
In an intravenous tissue distribution study, Ag-NPs (50 nm)79 were injected into pregnant mice on
gestation days (GD) 7, 8, and 9 at doses of 0, 35, or 66 µg Ag/mouse (i.e. 0, 0.4, 0.73 mg Ag/kg/d)
and tissue samples collected on GD 10 and analysed for Ag content (Austin et al. 2012). Silver
concentrations were significantly higher compared to controls in nearly all tissues, the highest being
liver, spleen, and visceral yolk sac; concentrations in brain and embryos were among the lowest
measured. Because high concentrations of Ag were found in visceral yolk sac tissue after Ag-NP 79 Although the average particle diameter was approximately 50 nm by transmission electron microscopy (TEM), particle agglomerates up to hundreds of nm in size were prevalent.

Page 62 of 106
exposure the location and form of the Ag were investigated using transmission electron microscopy
(TEM) and energy-dispersive x-ray spectroscopy (EDS). Ag-NPs (as individual particles and
aggregates) were identified in vesicles in endodermal cells of the visceral yolk sac, with none found
outside of the vesicles in the mesodermal layer.
Following single or repeated intravenous injections up to 16 days in rats, Lankveld et al. (2010) found
Ag from Ag-NPs (20, 80 and 110 nm) disappeared rapidly from the blood and distributed to all organs
evaluated (liver, lungs, spleen, brain, heart, kidneys and testes) regardless of size.
Summary:
The presence of secondary nano-sized particles in tissues after exposure to Ag acetate and in in vitro
investigations implies Ag-NPs may not only be a product of nanotechnology, but may also be present
in the human body following exposure to more traditional chemical forms of Ag.
Ag is absorbed from the gastrointestinal tract and widely distributed to tissues when administered to
animals as soluble salts of Ag or as Ag-NPs. With equivalent doses of Ag, less appears to be in
tissues from Ag-NP exposures compared with soluble Ag forms.
4.3.4 Excretion Excretion of Ag-NPs occurs via the bile and urine (Hadrup and Lam 2013).
Ag excretion was measured in faeces and urine during 24 hours in the third week of a rat 28-day
gavage study with Ag-NPs (14 ± 4 nm) and Ag acetate (both given at 9 mg Ag/kg/d) (Loeschner et al.
2011). Excretion of Ag in urine was low (<0.1%), whereas a high amount of Ag was excreted in
faeces. This was 63 ± 23% of the daily dose for Ag-NPs and 49 ± 21% for Ag acetate.
In the van der Zande et al. (2012) study (described in Section 4.3.3), Ag had cleared from blood and
faeces in both the Ag-NP and AgNO3 exposed groups within 1 week post-exposure. The excreted Ag
in faeces equated to >99% of the intake, implying only a minute fraction was absorbed. Elimination of
Ag occurred at a very slow rate from brain and testis, which still contained high concentrations 2
months after final exposures.

Page 63 of 106
4.3.5 Toxicity Genotoxicity:
An in vivo bone marrow micronucleus test in rats (OECD 474) with Ag-NPs (60 nm) was negative
(Kim et al. 2008).
Kim et al. (2013) reported the results of safety evaluation tests of commercial80 nano-Ag in
accordance with OECD test guidelines and GLP. Although there was cytotoxicity, genotoxicity was
not observed in the Ames test and chromosomal aberration test with Chinese hamster ovary cells.
Negative results in the Ames test have also been observed with silver salts (Hadrup and Lam 2013,
ATSDR 1990). Silver salts were also negative in a microsome test with cultured human lymphocytes,
as well as in P388 lymphocyte leukaemia cells cultured in the mouse peritoneal cavity (Hadrup and
Lam 2013).
Tavares et al. (2012) tested the genotoxicity of Ag-NPs (5-45 nm, avg. 19.7 nm) using the comet
assay in human peripheral blood cells and in mice. The in vitro test found DNA damage at all doses in
the initial hour of exposure, but only at the two highest doses after the first hour. DNA damage
decreased with time, indicating repair may have occurred. The in vivo study was negative; the authors
suggested this indicates activation of a cellular antioxidant network preventing in vivo DNA damage in
mice.
Kovvuru et al. (2014) found that 500 mg/kg/d polyvinylpyrrolidone (PVP)-coated Ag-NPs (5-150 nm)81
administered by gavage daily over 5 days induced DNA deletions in developing mouse embryos,
micronuclei in bone marrow, and double strand breaks and oxidative DNA damage in peripheral blood
and/or bone marrow.
Local toxicity:
There were no significant signs in standard OECD rabbit acute eye and dermal irritation/corrosion
tests with commercial nano-Ag (10 nm) (Kim et al. 2013) or pure Ag-NPs (10-20 nm)
80 The nano-Ag were used as received from the manufacturer; average diameter 10nm dispersed in 1% citric acid. 81 Transmission electron microscopy (TEM) imaging found particles had a wide size distribution and both single particles and agglomerates were found. The primary size of the particles ranged from 5-150 nm (avg. 33.6 ± 22.9 nm).

Page 64 of 106
(Maneewattanapinyo et al. 2011). In a skin sensitisation test82 using guinea pigs one animal (1 of 20)
showed discrete or patchy erythema, on this result the authors classified nano-Ag as a weak skin
sensitiser (Kim et al. 2013).
Changes in gastrointestinal tissues have been reported following oral exposure to rodents.
• In a 21-day experiment in mice, gavage administration of Ag-NPs (3-20 nm) at doses of 5, 10,
15 and 20 mg/kg/d resulted in damage of the epithelial cell microvilli and intestinal glands, as
well as a significant decrease in body weight in all treated groups (Shahare et al. 2013).
Histopathology was only reported for the 10 mg/kg/d group.
• Jeong et al. (2010) found increased numbers of goblet cells in the intestine that had released
their mucus granules following the oral administration of 30, 300 and 1000 mg/kg/d Ag-NPs
(60 nm) for 28 days (OECD No. 407 & GLP).
• Abnormal ileum pigmentation was reported in a 90-day gavage study with rats following
administration of 125 and 500 mg/kg/d of Ag-NPs (56 nm) (Kim et al. 2010).
• Williams et al. (2014) investigated changes in the populations of intestinal microbiota and
intestinal-mucosal gene expression in rats gavaged with citrate-stabilised Ag-NPs (10, 75, 110
nm) or Ag acetate83. Doses of Ag-NPs (9, 18, and 36 mg/kg/d) and Ag acetate (100, 200, and
400 mg/kg/d) were divided and administered twice daily (10 hours apart) for 91 days. Ileal
tissues from 5 animals from each experimental group were assessed for total gut mucosa-
associated bacteria. All male rats (10/10) and 8/10 female rats dosed with 400 mg/kg/d Ag
acetate died, and most dosed with 200 mg/kg/d had severe gastroenteritis. Administration of
both Ag-NPs and Ag acetate had significant antimicrobial effects on mucosa-associated
bacterial populations, as well as intestinal gene expression and induced an apparent shift in
the gut microbiota toward greater proportions of Gram-negative bacteria. Higher microbiocidal
activity was observed for the 10 nm Ag-NPs compared with the 75 nm NPs.
82 The skin sensitisation test was OECD 406. Twenty guinea pigs induced with 3 intradermal injection of nanoAg in Freund’s Complete Adjuvant. Skin shaved and painted with 10% sodium dodecyl sulphate (a known skin irritant) 24 hours before application of nanoAg in 1% sodium citrate occluded for 48 hours. Challenge was 21 days later with the nanoAg in citric acid occluded for 24 hr. Assessment was 24 hr after removing the challenge patch. 83 Ag-NPs were suspended in 2 nM sodium citrate with 0.1% carboxymethylcellulose; Ag acetate was dissolved in water with 0.1% methylcellulose.

Page 65 of 106
Systemic toxicity:
A few papers by the same research group summarise a study conducted in human volunteers with a
Ag nano-colloidal product (32 ppm Ag)84 (Munger et al. 2013, Smock et al. 2014, Munger et al. 2015).
Munger et al. (2013) describes a dose-time escalation scheme, in which subjects (n=60) were orally
exposed to placebo or 10 ppm silver particle for 3-, 7-, and 14-days; subsequently (and in the other
studies) 32 ppm was used for 14 days. Blinded subjects received 15 mL of study material daily from a
pre-mixed oral syringe. The doses of elemental silver colloid used in the study were 100 µg/day (i.e.
1.4 µg silver/kg/day) for 10ppm, and 480 µg/day (i.e. 6.9 µg silver/kg/day) for 32 ppm solutions. At
baseline and the end of each time period, subjects underwent a medical and drug history, complete
physical examination, comprehensive metabolic panel, blood count and urinalysis. Sputum induction,
and silver serum and urine content were also determined. Munger et al. (2013) found no clinically
important changes in metabolic, haematologic or urinalysis measures, no morphological changes in
the heart, lungs or abdominal organs, and no significant changes in pulmonary reactive oxygen
species or pro-inflammatory cytokine generation. Peak serum silver concentrations in the 14-day 32
ppm dosing was 6.8 ± 4.5 µg/L. No silver was detected in urine. In Smock et al. (2014), the results of
platelet aggregation were reported for 18 of the volunteers. Platelet aggregation was not observed in
the absence of platelet agonists. Munger et al. (2015) described the results for serum P450 enzyme
activity in 12 of the subjects (males). The colloidal silver had no effect on cytochrome P450 enzyme
inhibition or induction activity. The dose employed in this study is about 18-1,200 times higher than
the range of reported dietary intakes of silver (see Section 4.3), thus the lack of clinical findings in this
short-term study is reassuring.
Acute oral and dermal toxicity tests in experimental animals conducted in accordance with OECD
guidelines and to GLP in rats with commercial nano-Ag85 (10 nm) or pure Ag-NPs86 (10-20 nm) did
not show abnormal signs or mortality at a dose of ~2000 mg/kg (Kim et al. 2013) or 5000 mg/kg
(Maneewattanapinyo et al. 2011). In a non-guideline, non-GLP acute toxicity study, 7-week old Balb/C
84 The silver nanocolloidal study product (American Silver, LLC) is claimed to be a reduced elemental silver colloidal dispersion in water. The silver is in the form of zero-valent elemental silver NPs with a silver oxide surface layer and without exogenous particle stabilisers. The manufacturer claims the reduced Ag NP size averages 32.8 nm (25-40 nm range, 32 ppm). Authors determined average Ag NP size to be 59.8 ± 20 nm using dynamic light scattering. 85 Obtained from ABC Nanotech Co., Ltd in Korea, dispersed in 1% citric acid. 86 In Maneewattanapinyo et al. (2011), colloidal Ag-NPs were synthesised via chemical reduction using AgNO3, a reducing agent and soluble starch solution as a solvent. Purified Ag-NPs precipitated out during centrifugation and were washed 3 times with deionised water.

Page 66 of 106
mice were administered 2,500 mg of nano- or micro- sized Ag particles87 by gavage (Cha et al. 2008).
The livers were removed and examined 3 days after exposure, and the gene expression profile for the
liver cells was analysed. The authors did not report on body weights or clinical signs. Since body
weights of mice were not provided in this study, the dose administered to animals is unknown.
However BALB/c mice 7 weeks of age as used in the study typically weigh on average 20 g (Sage
Labs 2015). A dose of 2,500 mg/mouse would therefore equate to ~125,000 mg/kg. This dose is
extremely high, much higher than that recommended for acute toxicity testing by the OECD. Focal
lymphocyte infiltration was observed in both the nano- and micro- size particle-fed liver portal tracts.
In addition, mice fed nanoparticles had focal haemorrhage in the heart, focal lymphocyte infiltration in
the intestine and nonspecific medullary congestion in the spleen. Several genes related to apoptosis
and inflammation were either up- or down-regulated in nano-particle fed rats. Due to various
deficiencies in the study design and description, the study results cannot be reliably used to
characterise the hazard profile of Ag NPs.
In oral repeat dose toxicity studies with Ag-NPs in experimental animals, the liver was found to be the
target organ of toxicity. The vast majority of these are gavage studies, with only two found for another
oral route (i.e. drinking water or feed) (Espinosa-Cristobal et al. 2013, Fondevila et al. 2009).
• The only Ag NP feeding study found in the literature was conducted by Fondevila et al. (2009).
The authors investigated the potential of using Ag NPs as a feed additive for weanling pigs. In
one experiment, three groups of 5 weaned 28-day male piglets88 were given a diet containing
metallic silver (in colloidal form)89 at concentrations of 0, 20, or 40 mg Ag/kg for 14 days ad
libitum. On day 14, animals were slaughtered and effects on digestive microbiota and gut
morphology were studies. In another experiment, seventy-two 21-day old male piglets (6.3 ±
0.15 kg) were also distributed to the three experimental treatment groups and fed this diet for
5 weeks. Authors monitored daily pig growth, dietary digestibility, and in 18 pigs from each
group analysed liver, kidney and skeletal muscle tissue silver concentration at the end of the
experimental period (day 35). Overall, feeding the colloidal silver to piglets had no effect on
87 A silver NP solution was prepared in-house, with a typical colloidal particle size of 13 nm (as characterised by TEM). The maximum absorption was near 390 nm, suggesting the particles were also present as agglomerates. The preparation and source of the microparticle solution was not described, however the abstract states these particles were 2-3.5 µm in size. 88 Average weight 7.7 ± 0.16 kg. 89 The experimental diet was supplemented with Argenta (Laboratorios Argenol, Spain), consisting of Ag NPs (containing a minimum of 80% particles 60-100 nm in size) in sepiolite as carrier (10 g Ag/kg).
Page 67 of 106
intestinal histology or apparent digestibility. In the productivity experiment, feed intake was
highest in the piglets treated with 20 mg Ag/kg (p<0.05). After 5 weeks, there was no silver
retention in skeletal muscles or kidneys, but it was observed, although only in minimal
proportions, in liver. This study only examined a limited number of endpoints and was
specifically targeted towards productivity measurements, rather than toxicity and is not
suitable for safety assessment. However, it does indicate no overt or histopathological toxicity
is detectable at dietary doses of colloidal silver tested in this study (~0.6-0.9 mg/kg/d)90.
• Espinosa-Cristobal et al. (2013) administered two different sized Ag-NPs (14 and 36 nm) to
female rats (n = 10 per nanomaterial size) for 55 days ad libitum in drinking water91 at a dose
of 157.4 mg/kg/d. The authors observed no clinical effects, and no abnormal effects on body
weight, behaviour, food consumption, with limited histopathology evaluation (kidney, spleen,
liver, stomach small intestine, muscle, heart, lung and brain) in a small number of animals (n =
6). Mild changes to some haematology and clinical chemistry parameters were observed
including glucose, blood urea nitrogen, total proteins, mean corpuscular haemoglobin, and
lymphocytes. Since only one dose was tested, no NOAEL or LOAEL could be established.
• The data quality in Kim et al. (2008) was scored by Card et al. (2011) as reliable without
restriction although minimal information on the tested nanomaterial was provided. Rats
gavaged (30, 300, 1000 mg/kg/d) for 28 days with nano-Ag (60 nm) showed no effects on food
consumption or body weight gain. Dose related organ weight changes were not observed
however changed haematology and clinical chemistry92 was observed in mid- and high dose
animals. Liver histology showed bile-duct hyperplasia consistent with the observed clinical
90 Feed intake measured at 0-2 weeks of age was 154, 189 and 148 g dry matter/day in groups fed 0, 20 or 40 mg Ag/kg diets, respectively. At 3-5 weeks, intakes were 527, 670, and 630 g dry matter/day respectively. This would equate to a total Ag intake per day of 0, 3.8, and 5.9 mg Ag/day (0-2 weeks) and 0, 13.4, and 25.2 mg Ag/day (3-5 weeks).The average body weight of piglets at the beginning of the study was 6.3 kg. Thus administered doses in the first 2 weeks were approximately 0, 0.6, and 0.9 mg/kg/d. 91 Details of the administration method were not provided. The authors state rats were exposed to the Ag-NPs suspended in de-ionised water at a concentration of 535 µg/mL by “oral way (ad libitum for all groups)”. The taken suspension volume was recorded every day. 92 In Kim et al. (2008) OECD test guideline 407 was followed. There was increased alkaline phosphatase, increased serum cholesterol, lower total protein in mid- and/or high-dose animals (300 & 1,000 mg/kg/d respectively). Haematology changes were increased red blood cells, haemoglobin, and haematocrit counts in mid- and high-dose females. Activated partial thromboplastin time was significantly increased only in high-dose females. Ag measured in testes, kidneys, liver, brain, lungs, stomach and blood. Females had more Ag in kidneys than males but no gender differences for other organs.

Page 68 of 106
chemistry. The presence of nano-Ag particles was not investigated however there was a dose-
dependent accumulation of Ag in all tissues examined. No adverse effects were reported at
the low-dose of 30 mg/kg/d.
• Kim et al. (2010) extended the 28-day gavage study out to 90 days with doses of 30, 125 and
500 mg/kg/d suspended in methylcellulose (nano-Ag median diameter 56 ± 1.46 nm).
Comparable results to the 28-day study were found with a NOEL of 30 mg/kg/d. The authors
note similar effects are reported for silver ions but comment pigmentation in the tips of
intestinal villa observed in the top two doses in their 90-day nanoAg study, has not been seen
with silver ions.
• A 14-day gavage study in mice (Park et al. 2010a) with different sized93 uncoated Ag-NPs in
deionised water at 1 mg/kg/d resulted in the smaller particles inducing a stronger inflammatory
response as measured by serum TGF-β and increased B-cell distribution. These changes
were not observed for the larger Ag-NPs.
• As part of the Park et al. (2010a) study Ag-NPs of size 42 nm were gavage administered at
0.25, 0.5 and 1mg/kg/d for 28 days. The top dose resulted in mild liver and kidney toxicity as
judged by serum chemistry and slight cell infiltration in kidney cortex, no histopathology was
observed in liver or small intestine. On the other hand inflammatory responses were
significantly induced; there was a dose dependent increase in cytokine production and
increased B cell distribution. The authors did not nominate a NOAEL.
• Hadrup et al. (2012a) compared the toxicity of Ag acetate (9 mg Ag/kg/d) with Ag-NPs94 (2.25,
4.5 or 9 mg Ag/kg/d) to rats in a 28-day gavage study. They found no effects at any of the Ag-
NP doses on clinical, haematological, biochemical, organ weight, macro- or histopathological
observations. In rats administered Ag acetate, however, lower body weight gains, increased
plasma alkaline phosphatase (ALP), decreased plasma urea, and lower absolute and relative
thymus weights were recorded. The authors concluded oral Ag acetate resulted in higher Ag
plasma and organ concentrations than Ag-NPs at an equimolar dose of Ag.
93 Average diameters of Ag-NPs used by Park et al. (2010a) were 22, 42, 71, and 323 nm. 94 14 ± 4 nm.

Page 69 of 106
• The same group of researchers published the neurotoxicity investigations that were conducted
as part of the same 28-day study (Hadrup et al. 2012b). Total brain concentrations of
neurotransmitters (dopamine, noradrenaline and 5-hydroxytryptamine [5-HT]) were measured
at the end of the exposure period. In a preliminary dose range-finding study running over 14
days, dopamine concentrations in the Ag-NP groups (2.25 and 4.5 mg Ag/kg/d) were lower
than controls. In the 28-day experiment, an increase in dopamine was observed for both the
Ag-NP (at 4.5 and 9 mg Ag/kg/d, but not dose-related) and Ag acetate groups. Noradrenaline
was increased following Ag acetate administration, but not with Ag-NPs, whereas 5-HT was
increased with Ag-NPs (9 mg As/kg/d) but not Ag acetate. Upon inspection of the results, the
absolute differences between brain neurotransmitter concentrations are minimal. Brain weight
was unaffected by either treatment. The authors concluded their findings suggest similar
neurotoxic effects for both Ag-NPs and ionic Ag.
• Ebabe Elle et al. (2013) found increased cholesterolaemia (9.5%), LDL-cholesterol (30%), and
markers of liver inflammation (12% for IL-6, 9% for TNFα) after gavage administration of Ag-
NPs (20 nm)95 at a dose of 500 mg/kg/d for 81 days to rats. Food intake and body weight gain
were also significantly lower in Ag-NP fed rats (~18% and 20%, respectively), however organ
weights were unaffected.
• In another study, Ag-NPs (70 nm)96 were administered by gavage to rats for 30 days at doses
of 0.25, 0.5, 1 and 2 mg/kg/d. Pathological changes including atrophy of spleen cells, necrosis
of glomerular cells, and inflammation of parenchymal cells in the liver were observed in the
two highest dose groups (Sardari et al. 2012).
• Kulthong et al. (2012) administered Ag particles (181 nm)97 to rats by gavage at doses of 50,
100, 250, 500 and 1000 mg/kg/d for 14 days, and did not find any effects on alkaline
phosphatase (ALP), alanine aminotransferase (ALT), aspartate aminotransferase (AST),
cytochrome P450 enzymes, rat body or liver weights. The Ag content in liver of rats
95 No particle characterisation was undertaken. Reported size was as per the manufacturer claims (Ebabe Elle et al. 2013). 96 Suspended with sonication in de-ionised water. 97 Dynamic light scattering revealed Ag particles in distilled water of 181 ± 17 nm in size, which was considerably larger than indicated by the product’s information sheet (<100 nm). Transmission electron microscopy images of the anhydrous Ag-NPs did show particle sizes <100 nm in diameter.

Page 70 of 106
administered Ag-NPs was not significantly different from controls, and no Ag-NPs were
detected in the liver by TEM (Kulthong et al. 2012).
• Yun et al. (2015) administered citrate-capped Ag-NPs (11 nm)98 in distilled water to rats by
gavage for 91 days at doses of 257.6, 515.3 and 1030.5 mg/kg/d. The test was performed
according to OECD guidelines (No. 408). No clinical observations and no effects on body
weight, food or water consumption, or urinalysis were observed. Increased serum ALP and
calcium, as well as lymphocyte infiltration into liver and kidney were observed at the high dose.
These results indicate the NOAEL in this study was 515.3 mg/kg/d.
• In a developmental toxicity study (OECD No. 414), Ag-NPs99 were administered to pregnant
rats by gavage on gestation days (GD) 6-19 at doses of 100, 300, or 1000 mg/kg/d. On GD 20,
foetuses were examined for embryotoxic and teratogenic effects. Hepatic oxidant/antioxidant
balance and serum biochemistry were also carried out. Apart from a decrease in catalase and
glutathione reductase activities at ≥ 100 mg/kg/d and a reduction in glutathione content at
1000 mg/kg/d in maternal tissues, no treatment-related effects were found. The authors
concluded the NOAEL for Ag-NPs in their study was 1000 mg/kg/d for embryo-foetal
development, and <100 mg/kg/d for dams (Yu et al. 2014).
• In a combined repeat-dose and reproduction/developmental toxicity study (OECD No. 422 and
GLP), Hong et al. (2014) administered citrate-capped Ag-NPs100 to rats via gavage at doses of
62.5, 125, and 250 mg/kg/d for 42 days (males) and up to 52 days (females). No adverse
effects were observed for any of the parameters investigated101. In this study, Ag in dam livers
was 34-fold higher than in controls. Ag in lungs and kidneys of treated rats were also
significantly higher than controls.
98 Primary particle size by TEM 11 nm. Hydrodynamic size by dynamic light scattering in aqueous suspension was similar at 19.0 ± 4.6 nm (Yun et al. 2015). 99 Suspended in carboxy-methylcellulose at a particle size of 6.45 ± 2.55 nm. 100 7.9 ± 0.95 nm, based on manufacturer’s indications and confirmation in testing laboratory. 101 Clinical observations, body weight, functional observations, urinalysis, haematology, serum clinical chemistry, organ weight, histopathology, mating, fertility, implantation, delivery and foetal examinations.
Page 71 of 106
Due to the findings of accumulation of Ag-NPs in testis and brain in tissue distribution studies (van der
Zande et al. 2014, Lee et al. 2013; see Section 4.3.3), investigation of impacts to these organs has
become a recent focus of studies.
• Mathias et al. (2014) administered Ag-NPs102 by gavage at doses of 15 or 30 µg/kg/d to
prepubertal male rats from postnatal day 23 (PND23) to PND58 and sacrificed the rats at
PND102. They found reduced acrosome and plasma membrane integrities in sperm, reduced
mitochondrial activity and increased number of abnormalities in both treated groups compared
to controls. A delay in the onset of puberty was also noted, although no changes in body
growth were observed in either group. No changes in sexual behaviour or serum hormone
concentrations were found. In this study there was no comparative group dosed with ionic
silver (Ag++) and tissue content of either silver or Ag-NPs was not measured. At the very low
doses of Ag-NP given to the animals it is likely the administered nanoparticles were solubilised
in the stomach, hence the effects could be associated with ionic silver. However further
information from appropriately designed studies are required to confirm this possibility.
• Skalska et al. (2014) administered either a colloidal solution of Ag-NPs (10 ± 4 nm), stabilised
in sodium citrate, or Ag citrate to rats by gavage once daily (0.2 mg/kg/d) for 14 days. In
ultrastructural images of brain tissue from both the Ag-treated groups, but not the control
group, the authors observed synaptic damage, mainly in the hippocampus and to a lesser
extent the cerebral cortex. This was supported by the finding of reduced levels of proteins
associated with the structure of the synapse. The authors did not detect AgNPs in brain
homogenates, however they remarked this may be due to the low sensitivity of the methods
used for detection.
Chronic dietary exposure studies with nano-Ag were not found. Even though metallic (salts),
colloidal103 and ionic Ag have been used widely for their medicinal, antibacterial and antiviral
properties for decades, there is relatively limited information available on their toxicity in the literature.
The most common health effects associated with chronic exposure to Ag are a permanent grey or
blue grey discolouration of the skin (argyria) and other organs (ATSDR 1990, US EPA 2010,
Wijnhoven et al. 2009). This condition is considered medically benign but permanent. In patients with
102 The commercial Ag-NP aqueous suspension, by dynamic light scattering, contained particles with average diameters of 86-87 nm. 103 Colloidal Ag is typically a suspension containing Ag particles of different sizes, and may also include particles in the nano-range.

Page 72 of 106
argyria, silver containing granules have been observed during histopathologic examination of the skin
(ATSDR 1990, US EPA 2010, 2014).
The US EPA derived an oral reference dose (RfD) (i.e. the dose that can be ingested daily for a
lifetime without adverse effects) for Ag in humans of 0.005 mg/kg/d (i.e. 5 µg/kg/d) (US EPA IRIS
1996). The RfD was based on the lowest dose (i.e. 1g of metallic Ag) resulting in argyria in one of 13
individuals following intravenous medical therapy over a 2 - 9.75 year period. This was converted to
an oral dose of 25 g by accounting for oral absorption (i.e. 1 g ÷ 0.04 = 25 g), converting this to a
lifetime dose [(25 g x 1000 mg/g) ÷ (70 kg body weight x 25,500 days) = 0.014 mg/kg/d] and applying
an uncertainty factor of 3 for minimal effects in a subpopulation which has exhibited an increased
propensity for the development of argyria. It is noted this RfD is old and was established well before
many of the toxicological studies on Ag-NPs were available.
A summary of the various repeat oral toxicity studies with nanoAg is provided in Table 4.3.2.
Table 4.3.2: Repeat oral toxicity studies with nano-Ag (arranged by study duration)
Type of Ag-NPs
Test species
Exposure/ duration
Doses (mg/kg/d)
Endpoint (mg/kg/d)
Basis Reference
6.45 ± 2.55 nm in CMC
Sprague-Dawley rats
Gavage: GD 6-19 Developmental
100, 300, 1000
NOAEL: <100 (maternal) 1000 (develop-mental)
No clinical or developmental effects at any dose. ↓ catalase & glutathione reductase activities at ≥ 100 mg/kg/d & ↓ glutathione content at 1000 mg/kg/d in maternal tissues.
Yu et al. 2014
22, 42, 71, and 323 nm
ICR mice Gavage: 14 d
1 - Stronger serum inflammatory responses with smaller particle size.
Park et al. 2010a
10 ± 4 nm or non-nano Ag citrate
Wistar rats Gavage: 14 d
0.2 - Synaptic damage in brain, ↓ levels of proteins associated with structure of the synapse.
Skalska et al. 2014
181 Sprague-Dawley rats
Gavage: 14 d
50, 100, 250, 500, 1000
NOAEL: 50
No effects on body & liver weight, P450 enzymes, ALT, AST, or ALP.
Kulthong et al. 2012
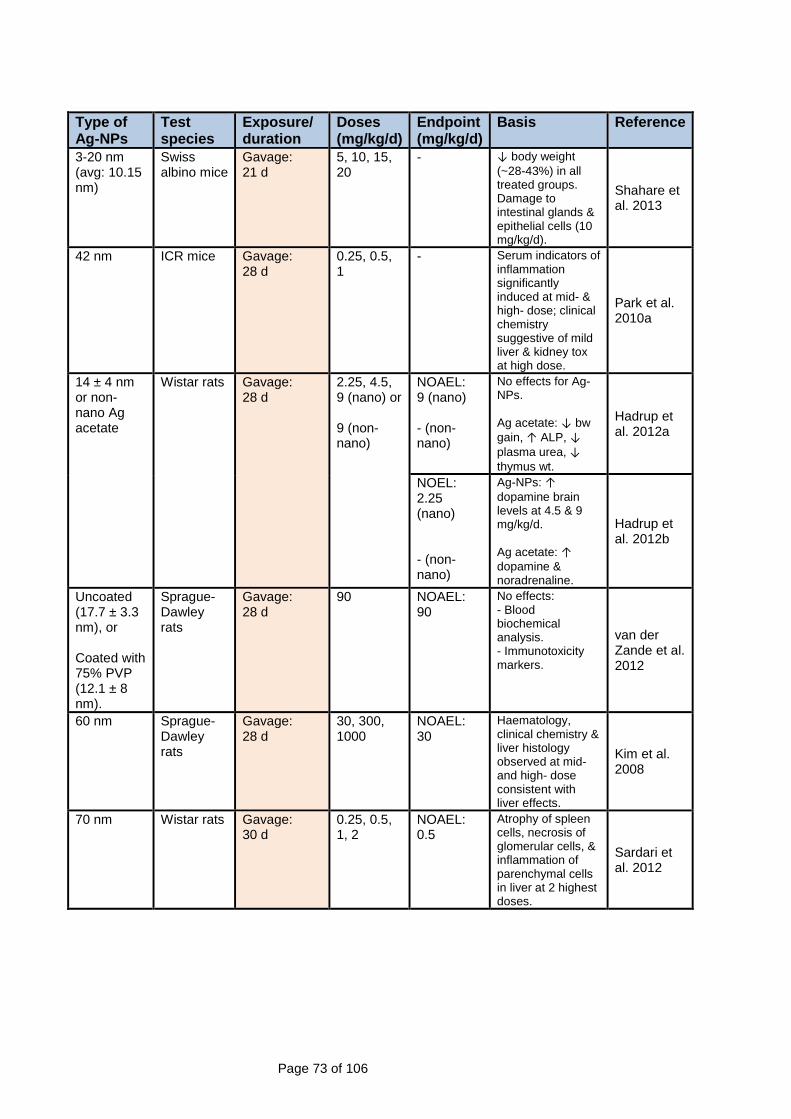
Page 73 of 106
Type of Ag-NPs
Test species
Exposure/ duration
Doses (mg/kg/d)
Endpoint (mg/kg/d)
Basis Reference
3-20 nm (avg: 10.15 nm)
Swiss albino mice
Gavage: 21 d
5, 10, 15, 20
- ↓ body weight (~28-43%) in all treated groups. Damage to intestinal glands & epithelial cells (10 mg/kg/d).
Shahare et al. 2013
42 nm ICR mice Gavage: 28 d
0.25, 0.5, 1
- Serum indicators of inflammation significantly induced at mid- & high- dose; clinical chemistry suggestive of mild liver & kidney tox at high dose.
Park et al. 2010a
14 ± 4 nm or non-nano Ag acetate
Wistar rats Gavage: 28 d
2.25, 4.5, 9 (nano) or 9 (non-nano)
NOAEL: 9 (nano) - (non-nano)
No effects for Ag-NPs. Ag acetate: ↓ bw gain, ↑ ALP, ↓ plasma urea, ↓ thymus wt.
Hadrup et al. 2012a
NOEL: 2.25 (nano) - (non-nano)
Ag-NPs: ↑ dopamine brain levels at 4.5 & 9 mg/kg/d. Ag acetate: ↑ dopamine & noradrenaline.
Hadrup et al. 2012b
Uncoated (17.7 ± 3.3 nm), or Coated with 75% PVP (12.1 ± 8 nm).
Sprague-Dawley rats
Gavage: 28 d
90 NOAEL: 90
No effects: - Blood biochemical analysis. - Immunotoxicity markers.
van der Zande et al. 2012
60 nm Sprague-Dawley rats
Gavage: 28 d
30, 300, 1000
NOAEL: 30
Haematology, clinical chemistry & liver histology observed at mid- and high- dose consistent with liver effects.
Kim et al. 2008
70 nm Wistar rats Gavage: 30 d
0.25, 0.5, 1, 2
NOAEL: 0.5
Atrophy of spleen cells, necrosis of glomerular cells, & inflammation of parenchymal cells in liver at 2 highest doses.
Sardari et al. 2012
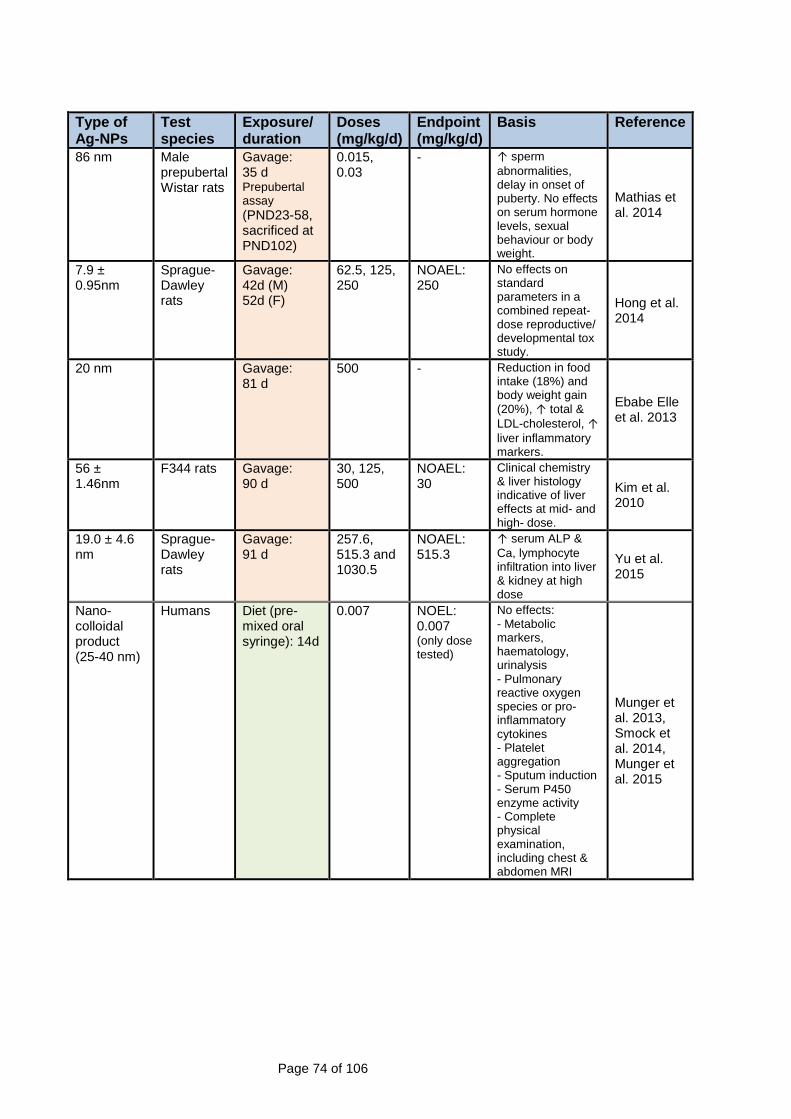
Page 74 of 106
Type of Ag-NPs
Test species
Exposure/ duration
Doses (mg/kg/d)
Endpoint (mg/kg/d)
Basis Reference
86 nm Male prepubertal Wistar rats
Gavage: 35 d Prepubertal assay (PND23-58, sacrificed at PND102)
0.015, 0.03
- ↑ sperm abnormalities, delay in onset of puberty. No effects on serum hormone levels, sexual behaviour or body weight.
Mathias et al. 2014
7.9 ± 0.95nm
Sprague-Dawley rats
Gavage: 42d (M) 52d (F)
62.5, 125, 250
NOAEL: 250
No effects on standard parameters in a combined repeat-dose reproductive/ developmental tox study.
Hong et al. 2014
20 nm Gavage: 81 d
500 - Reduction in food intake (18%) and body weight gain (20%), ↑ total & LDL-cholesterol, ↑ liver inflammatory markers.
Ebabe Elle et al. 2013
56 ± 1.46nm
F344 rats Gavage: 90 d
30, 125, 500
NOAEL: 30
Clinical chemistry & liver histology indicative of liver effects at mid- and high- dose.
Kim et al. 2010
19.0 ± 4.6 nm
Sprague-Dawley rats
Gavage: 91 d
257.6, 515.3 and 1030.5
NOAEL: 515.3
↑ serum ALP & Ca, lymphocyte infiltration into liver & kidney at high dose
Yu et al. 2015
Nano-colloidal product (25-40 nm)
Humans Diet (pre-mixed oral syringe): 14d
0.007 NOEL: 0.007 (only dose tested)
No effects: - Metabolic markers, haematology, urinalysis - Pulmonary reactive oxygen species or pro-inflammatory cytokines - Platelet aggregation - Sputum induction - Serum P450 enzyme activity - Complete physical examination, including chest & abdomen MRI
Munger et al. 2013, Smock et al. 2014, Munger et al. 2015

Page 75 of 106
Type of Ag-NPs
Test species
Exposure/ duration
Doses (mg/kg/d)
Endpoint (mg/kg/d)
Basis Reference
Commercial colloidal product (60-100 nm)
Weanling pigs
Diet (feed): 35d
~ 0.6, 0.9 NOAEL: 0.9
Feed intake highest in 0.9 mg/kg/d group. No effects: - Growth - Dietary digestibility - Intestinal histology
Fondevila et al. 2009
14, 36 nm Wistar rats Diet (drinking water): 55 d
157.4 - Mild changes to haematology & clinical chemistry.
Espinosa-Cristobal et al. 2013
- none provided/established; PVP = polyvinylpyrrolidone; GD = gestation day; PND = postnatal day; CMC = carboxymethylcellulose; M = males; F = females; wt = weight; bw = body weight; ALT = alanine aminotransferase; AST = aspartate aminotransferase; ALP = alkaline phosphatase.
After reviewing the oral toxicity of Ag ions, Ag-NPs and colloids, Hadrup and Lam (2013) concluded
substantial evidence exists suggesting the effects induced by particulate Ag are mediated via Ag ions
that are released from the particle surface. Although smaller particles should theoretically be more
likely than larger particles to release Ag ions from the surface, oral toxicity studies suggest the Ag in
Ag-NPs may in fact be less bioavailable than ionic Ag (Loeschner et al. 2011, van der Zande et al.
2012, Hadrup et al. 2012a), possibly due to enhanced binding of NPs to non-digestible food
components.
There is also a substantial amount of in vitro data supporting a mode of action for Ag-NPs being
mediated by Ag ions:
• Liu and Hurt (2010) found Ag+ is released from Ag-NPs by surface oxidation104.
• Kittler et al. (2010) showed the toxicity of Ag-NPs increases during storage due to the release
of Ag+.
• The initial Ag+ concentration in Ag-NP suspensions contributes greatly to the toxicity of Ag
NPs in vitro (Beer et al. 2011, 2012). The size of the Ag-NPs may still be important as it would
be expected more release of Ag+ from smaller particles.
• Studies suggest that the toxicity of Ag-NPs is due to a so-called Trojan-horse mechanism.
Ag-NPs are taken up by the cells, partition to lysosomes where the lower pH facilitates
subsequent intracellular release of Ag+. This leads to excess reactive oxygen species and
cytotoxicity mediated oxidative stress pathways being activated to initiate cell death (via 104 Removing dissolved oxygen completely inhibited dissolved Ag release in a colloid model system, indicating the essential role of nano-Ag surface oxidation initiated by O2 (Liu and Hurt 2010).

Page 76 of 106
apoptosis) and genotoxic damage (Miura and Shinohara 2009, Park et al. 2010b, c; Karlsson
et al. 2009, Liu et al. 2010b, Midander et al. 2009, Chairuangkitti et al. 2012, Foldbjerg et al.
2009, Cronholm et al. 2013).
• The cytotoxic effects of citrate-coated Ag-NPs on cultured rat brain endothelial cells was
explained by the intrinsic toxicity of the Ag+ released from the particles (Grosse et al. 2013).
• In some studies the cytotoxicity of AgNO3 is greater than Ag-NPs105 (e.g. Miura and
Shinohara 2009).
• Studies have shown the genotoxicity of Ag-NPs is likely due to Ag+ and associated oxidative
stress (e.g. Jiang et al. 2013, Eom and Choi 2010).
• The uptake of ‘solid’ particles and ensuing release of metal ions occurs with other metal-NPs,
e.g. CuO-NP, cobalt oxide (Co3O4)-NP and manganese oxide (Mn3O4)-NPs (Cronholm et al.
2013).
The European Food Safety Authority concluded in 2008 data were insufficient to assess the safety of
a nanoAg hydrosol added to food supplements (EFSA 2008). The United States Environmental
Protection Agency echoed this conclusion in 2010 in a broader sense for all uses of Ag-NPs,
indicating additional long term studies with different particle sizes are still needed (US EPA 2010).
Hadrup and Lam (2013) agreed that more data regarding different particle sizes is needed to draw a
firm conclusion as to whether small NPs are more toxic than large ones following oral administration.
Nevertheless, Hadrup and Lam (2013) conducted a preliminary assessment of likely consumer risks
from Ag-NP oral exposure. They derived a tolerable daily intake (TDI) of 2.5 µg/kg/d for nano-Ag by
dividing the lowest NOAEL available in the literature of 0.25 mg/kg/d (for increased plasma cytokine
concentrations in mice) from the study by Park et al. (2010a)106 by an uncertainty factor of 100. Since
dietary intakes of Ag in the literature range from approximately 0.007-0.5 µg/kg/d, there is a margin of
safety of 5 between this unofficial TDI for biochemical effects and the highest reported daily dose of
Ag. The reliability of the TDI is questionable since it is set on biochemical markers not traditionally
used as an indication for toxicity.
105 In Miura and Shinohara (2009) the higher cytotoxicity of Ag+ cultured HeLa cells may partially be due to agglomeration of the Ag-NPs in the culture medium. In ultra pure water the Ag-NPs were well dispersed with uniform diam 2 – 5 nm whereas in culture medium there were agglomerates >50nm diam. It is also noted the Ag-NPs were purchased from an industrial engineering company and included a protectant (patented material) to suppress ionising of Ag. Other studies with Ag-NPs purchased from commercial suppliers do not mention the inclusion of stabilisers, one wonders if this is a common practice and how it may influence toxicity studies. 106 It is noted Park et al. (2010a) did not nominate this concentration as a NOAEL. Hadrup and Lam (2013) tentatively used the dose as a NOAEL for calculation of their un-official TDI.

Page 77 of 106
Bachler et al. (2013) developed a PBPK model for Ag-NPs and ionic Ag, and validated it with
available in vivo data. They used the model to calculate internal organ Ag levels on the basis of five
different exposure scenarios for humans, one of which included exposure to Ag-NPs in the diet. In all
scenarios, the Ag levels of all organs were around or below the dietary background; the authors
concluded this indicates the risk of adverse health effects from exposure to Ag-NPs in diet and
consumer products is likely to be very small. They noted, however, there are still large uncertainties in
the model arising from the limited knowledge on the Ag form that is released from consumer products
and the amount of released Ag that is absorbed.
4.3.6 Conclusions Daily human dietary Ag intake has been estimated to be <0.4 to 27 µg/day for different populations.
Ag-NPs have complex interactions in the gastrointestinal tract. In the stomach agglomeration is
facilitated by chloride and/or protein bridges, and there is significant dissolution into Ag ions. The
formation of silver chloride in the stomach complicates ascribing any toxicity observed in oral toxicity
studies conducted with Ag-NPs to their nano-nature. In the small intestine the agglomerates may
revert back to nanoparticles, or nanoparticles may be formed from precipitation of soluble ions exiting
the stomach. The bioavailability of Ag from Ag-NPs is similar or less than from equimolar doses of
soluble Ag.
Significant increases in tissue Ag concentrations are observed after gavage administration of Ag-NPs.
Whether this is the result of absorption of the NPs or Ag ions is unknown. However from in vitro
studies it appears the nano-size facilitates passage across cell membranes and lysosomal uptake, the
lysosome acidic environment releases Ag ions which then cause toxicity.
Once absorbed the Ag from Ag-NPs is widely distributed to tissues. It is uncertain whether Ag
containing particulates found in tissues are from the dosed Ag-NP or have been formed by
precipitation of soluble Ag within the cells.
Short or long term dietary investigations with Ag-NPs are not available. Gavage dose studies using
traditional toxicological endpoints indicate potential effects in liver, kidney and spleen. These effects
are qualitatively similar to those observed with Ag salts, and in some studies are less severe. Both
Ag-NPs and Ag salts affect many biochemical parameters, when they have been investigated,
however the toxicological significance of some of these biochemical changes is obscure.

Page 78 of 106
• NOAELs from 28-90d gavage studies using traditional toxicological assessments with Ag-NPs
are 0.5 - ~500 mg Ag/kg/d.
• Special gavage studies (14d – 28d) investigating changes in brain biochemistry, inflammatory
responses or sperm development show effects with doses ≤ 2.25 mg/kg/d.
As for TiO2 there is a dearth of appropriately conducted dietary studies to facilitate a robust regulatory
risk assessment for nano-Ag used as a food additive, and it is less than ideal to use gavage
toxicological data. However, unlike nano-TiO2 a toxicological mode of action has been identified that
applies to all forms of nano- and fine Ag particles, and Ag salts. The available evidence indicates the
toxicological effects of Ag-particles, regardless of size, is likely mediated by Ag-ions. It is beyond the
scope of this review to recommend pivotal studies for use in a regulatory risk assessment.
Nevertheless the NOAELs listed in Table 4.3.2 enable an informal screening assessment. It is also
noted an exposure assessment is not available for Australian persons.
Tentative margins of exposure using the gavage NOAELs (0.5 – 500 mg/kg bw/d) and high end
human dietary exposure estimates (i.e. ~0.4 µg/kg bw/day) are high, in the order of 1,250 – 1,250,000,
suggesting low risk of health effects from use of nano-Ag as a food additive.
However, there is currently insufficient data to confidently determine if Ag-NPs in food may present a
toxicological hazard to humans at the dietary exposure levels so far estimated. Apart from there being
no dietary chronic studies, neurobehavioral studies are not available. The latter is an important data
gap given silver, from either Ag-NPs or soluble silver, has a long residence time in the brain. Similarly,
research investigations with Ag-NPs showing potential for sperm abnormalities and delay of puberty
onset need consideration. Toxicological data for reproductive impacts of Ag-NPs are not available.
Since the available information indicates the toxicity of nanoAg is similar to the ionic form, data for Ag
salts, if available, may assist with these data gaps.
In summary:
• Absorption of silver from Ag-NPs is likely to be very low. It is not clear whether absorption
occurs as a NP or as soluble silver. Nevertheless the latter is likely to significantly contribute to
absorption.
• Organ distribution of silver is similar after either Ag-NP or ionic silver, but tissue concentrations
appear generally higher for ionic silver (van der Zande et al. 2012).
• Nano-sized precipitates are formed in tissues when silver is administered as nanoparticles or
soluble silver.
Page 79 of 106
• In OECD tests for genotoxicity, Ag-NPs have been negative, which is similar for ionic silver.
At present there does not seem to be any robust scientific evidence indicating nanoAg may pose new
or novel risks that are not observed with ionic silver following oral ingestion. There is however an
incomplete toxicological database for both forms of silver.
References Aguilera, J. M. (2014). Where is the nano in our foods? Journal of Agricultural and Food Chemistry. 62: 9953-9956. APVMA (2016). Registrations and permits: Veterinary - Toxicology (Part 3). Australian Pesticides and Veterinary Medicines Authority. [Accessed 14/04/2016]. http://apvma.gov.au/node/905. Ashwood, P., Thompson, R. P. H. and Powell, J. J. (2007). Fine particles that adsorb lipopolysaccharide via bridging calcium cations may mimic bacterial pathogenicity towards cells. Experimental Biology and Medicine. 232: 107-117. Athinarayanan, J., Periasamy, V., Alsaif, M., Al-Warthan, A. and Alshatwi, A. (2014). Presence of nanosilica (E551) in commercial food products: TNF-mediated oxidative stress and altered cell cycle progression in human lung fibroblast cells. Cell Biology and Toxicology. 30: 89-100. ATSDR (1990). Toxicological profile for silver. Agency for Toxic Substance and Diseases Registry, US Dept Health & Human Services. Austin, C. A., Umbreit, T. H., Brown, K. M., Barber, D. S., Dair, B. J., Francke-Carroll, S., Feswick, A., Saint-Louis, M. A., Hikawa, H., Siebein, K. N. and Goering, P. L. (2012). Distribution of silver nanoparticles in pregnant mice and developing embryos. Nanotoxicology. 6: 912-922. Azim, S. A. A., Darwish, H. A., Rizk, M. Z., Ali, S. A. and Kadry, M. O. (2015). Amelioration of titanium dioxide nanoparticles-induced liver injury in mice: Possible role of some antioxidants. Experimental and Toxicologic Pathology. 67: 305-314. Bachler, G., von Goetz, N. and Hungerbuehler, K. (2013). A physiologically based pharmacokinetic model for ionic silver and silver nanoparticles. International Journal of Nanomedicine. 8: 3365-3382. Bachler, G., von Goetz, N. and Hungerbuhler, K. (2014). Using physiologically based pharmacokinetic (PBPK) modeling for dietary risk assessment of titanium dioxide (TiO2) nanoparticles. Nanotoxicology. Early Online: 1-8. Barnes, C. A., Elsaesser, A., Arkusz, J., Smok, A., Palus, J., Leśniak, A., Salvati, A., Hanrahan, J. P., Jong, W. H. d., Dziubałtowska, E. b., Stȩpnik, M., Rydzyński, K., McKerr, G., Lynch, I., Dawson, K. A. and Howard, C. V. (2008). Reproducible Comet Assay of Amorphous Silica Nanoparticles Detects No Genotoxicity. Nano Letters. 8: 3069-3074.

Page 80 of 106
Beer, C., Foldbjerg, R., Hayashi, Y., Sutherland, D. S. and Autrup, H. (2011). Toxicity of silver nanoparticles- nanoparticle or silver ion? Toxicology Letters. 208: 286-292. Beer, C., Foldbjerg, R., Hayashi, Y., Sutherland, D. S. and Autrup, H. (2012). Toxicity of silver nanoparticles-Nanoparticle or silver ion? Toxicology Letters. 208: 286-292. Bernard, B. K., Osheroff, M. R., Hofmann, A. and Mennear, J. H. (1990). Toxicology and carcinogenesis studies of dietary titanium dioxide coated mica in male and female Fischer 344 rats. Journal of Toxicology and Environmental Health. 29: 417-429. Bhattacharya, K., Farcal, L. and Fadeel, B. (2014). Shifting identities of metal oxide nanoparticles: Focus on inflammation. MRS Bulletin. 39: 970-975. Bockmann, J., Lahl, H., Eckert, T. and Unterhalt, B. (2000). Titan-Blutspiegel vor und nach Belastungsversuchen mit Titandioxid (in German). Die Pharmazie. 55: 140-143. Böhmert, L., Girod, M., Hansen, U., Maul, R., Knappe, P., Niemann, B., Weidner, S. M., Thünemann, A. F. and Lampen, A. (2014). Analytically monitored digestion of silver nanoparticles and their toxicity on human intestinal cells. Nanotoxicology. 8: 631-642. Bouwmeester, H., Dekkers, S., Noordam, M. Y., Hagens, W. I., Bulder, A. S., de Heer, C., ten Voorde, S. E. C. G., Wijnhoven, S. W. P., Marvin, H. J. P. and Sips, A. J. A. M. (2009). Review of health safety aspects of nanotechnologies in food production. Regulatory Toxicology and Pharmacology. 53: 52-62. Bouwmeester, H., Poortman, J., Peters, R. J., Wijma, E., Kramer, E., Makama, S., Puspitaninganindita, K., Marvin, H. J. P., Peijnenburg, A. A. C. M. and Hendriksen, P. J. M. (2011). Characterization of translocation of silver nanoparticles and effects on whole-genome gene expression using an in vitro intestinal epithelium coculture model. ACS Nano. 5: 4091-4103. Brunner, T. J., Wick, P., Manser, P., Spohn, P., Grass, R. N., Limbach, L. K., Bruinink, A. and Stark, W. J. (2006). In vitro cytotoxicity of oxide nanoparticles: comparison to asbestos, silica, and the effect of particle solubility. Environmental Science & Technology. 40: 4374-4381. Bu, Q., Yan, G., Deng, P., Peng, F., Lin, H., Xu, Y., Cao, Z., Zhou, T., Xue, A., Yanli, W., Cen, X. and Zhao, Y.-L. (2010). NMR-based metabonomic study of the sub-acute toxicity of titanium dioxide nanoparticles in rats after oral administration. Nanotechnology. 21: 125105. Buesen, R., Landsiedel, R., Sauer, U., Wohlleben, W., Groeters, S., Strauss, V., Kamp, H. and van Ravenzwaay, B. (2014). Effects of SiO2, ZrO2, and BaSO4 nanomaterials with or without surface functionalization upon 28-day oral exposure to rats. Archives of Toxicology. 88: 1881-1906. Butler, M., Boyle, J. J., Powell, J. J., Playford, R. J. and Ghosh, S. (2007). Dietary microparticles implicated in Crohn’s disease can impair macrophage phagocytic activity and act as adjuvants in the presence of bacterial stimuli. Inflammation Research. 56: 353-361. Buzea, C., Pacheco, I. I. and Robbie, K. (2007). Nanomaterials and nanoparticles: Sources and toxicity. Biointerphases. 2: MR17-MR71. Card, J. W. and Magnuson, B. A. (2009). Letter to the Editor: Proposed minimum characterization parameters for studies on food and food-related nanomaterials. Journal of Food Science. 74: vi-vii.

Page 81 of 106
Card, J. W. and Magnuson, B. A. (2010). A method to assess the quality of studies that examine the toxicity of engineered nanomaterials. International Journal of Toxicology. 29: 402-410. Card, J. W., Jonaitis, T. S., Tafazoli, S. and Magnuson, B. A. (2011). An appraisal of the published literature on the safety and toxicity of food-related nanomaterials. Critical Reviews in Toxicology. 41: 20-49. Chairuangkitti, P., Lawanprasert, S., Roytrakul, S., Aueviriyavit, S., Phummiratch, D., Kulthong, K., Chanvorachote, P. and Maniratanachote, R. (2013). Silver nanoparticles induce toxicity in A549 cells via ROS-dependent and ROS-independent pathways. Toxicology In Vitro. 27: 330-338. Chaudhry, Q., Scotter, M., Blackburn, J., Ross, B., Boxall, A., Castle, L., Aitken, R. and Watkins, R. (2008). Applications and implications of nanotechnologies for the food sector. Food Additives & Contaminants: Part A. 25: 241 - 258. Chen, X.-X., Cheng, B., Yang, Y.-X., Cao, A., Liu, J.-H., Du, L.-J., Liu, Y., Zhao, Y. and Wang, H. (2013). Characterization and preliminary toxicity assay of nano-titanium dioxide additive in sugar-coated chewing gum. Small. 9: 1765-1774. Cho, M., Cho, W.-S., Choi, M., Kim, S. J., Han, B. S., Kim, S. H., Kim, H. O., Sheen, Y. Y. and Jeong, J. (2009). The impact of size on tissue distribution and elimination by single intravenous injection of silica nanoparticles. Toxicology Letters. 189: 177-183. Cho, W.-S., Kang, B.-C., Lee, J. K., Jeong, J., Che, J.-H. and Seok, S. H. (2013). Comparative absorption, distribution, and excretion of titanium dioxide and zinc oxide nanoparticles after repeated oral administration. Particle and Fibre Toxicology. 10: 9. Colorcon (2003). Titanium dioxide absorption, distribution and excretion in the rat. Huntingdon Life Sciences Ltd. Report CNO 010/032886. As cited in EFSA 2004. Contado, C., Ravani, L. and Passarella, M. (2013). Size characterization by Sedimentation Field Flow Fractionation of silica particles used as food additives. Analytica Chimica Acta. 788: 183-192. Cronholm, P., Karlsson, H. L., Hedberg, J., Lowe, T. A., Winnberg, L., Elihn, K., Wallinder, I. O. and Möller, L. (2013). Intracellular uptake and toxicity of Ag and CuO nanoparticles: a comparison between nanoparticles and their corresponding metal ions. Small. 9: 970-982. Cui, Y., Gong, X., Duan, Y., Li, N., Hu, R., Liu, H., Hong, M., Zhou, M., Wang, L., Wang, H. and Hong, F. (2010). Hepatocyte apoptosis and its molecular mechanisms in mice caused by titanium dioxide nanoparticles. Journal of Hazardous Materials. 183: 874-880. Cui, Y., Liu, H., Ze, Y., Zhang, Z., Hu, Y., Cheng, Z., Cheng, J., Hu, R., Gao, G., Wang, L., Tang, M. and Hong, F. (2012). Gene expression in liver injury caused by long-term exposure to titanium dioxide nanoparticles in mice. Toxicological Sciences. 128: 171-185. Dekkers, S., Krystek, P., Peters, R. J. B., Lankveld, D. P. K., Bokkers, B. G. H., van Hoeven-Arentzen, P. H., Bouwmeester, H. and Oomen, A. G. (2011). Presence and risks of nanosilica in food products. Nanotoxicology. 5: 393-405. Dekkers, S., Bouwmeester, H., Bos, P. M. J., Peters, R. J. B., Rietveld, A. G. and Oomen, A. G. (2012). Knowledge gaps in risk assessment of nanosilica in food: evaluation of the dissolution and toxicity of different forms of silica. Nanotoxicology. 7: 367-377.

Page 82 of 106
Donaldson, K. and Poland, C. A. (2013). Nanotoxicity: challenging the myth of nano-specific toxicity. Current Opinion in Biotechnology. 24: 724-734. Duan, Y., Liu, J., Ma, L., Li, N., Liu, H., Wang, J., Zheng, L., Liu, C., Wang, X., Zhao, X., Yan, J., Wang, S., Wang, H., Zhang, X. and Hong, F. (2010). Toxicological characteristics of nanoparticulate anatase titanium dioxide in mice. Biomaterials. 31: 894-899. Ebabe Elle, R., Gaillet, S., Vidé, J., Romain, C., Lauret, C., Rugani, N., Cristol, J. P. and Rouanet, J. M. (2013). Dietary exposure to silver nanoparticles in Sprague–Dawley rats: Effects on oxidative stress and inflammation. Food and Chemical Toxicology. 60: 297-301. EC (1994). European Parliament and Council Directive 94/36/EC of 30 June 1994 on colours for use in foodstuffs. Official Journal of the European Communities. No L237/13. http://ec.europa.eu/food/fs/sfp/addit_flavor/flav08_en.pdf EFSA (2004a). Opinion of the Scientific Panel on Food Additives, Flavourings, Processing Aids and materials in Contact with food on a request from the Commission related to the safety in use of rutile titanium dioxide as an alternative to the presently permitted anatase form. Question No EFSA-Q-2004-103. Adopted 7 December 2004. The EFSA Journal (2004) 163:1-12. EFSA (2004b). Opinion of the Scientific Panel on Dietetic Products, Nutrition and Allergies on a request from the Commission related to the tolerable upper intake level of silicon. European Food Safety Authority. The EFSA Journal (2004) 60, 1-11. http://www.efsa.europa.eu/en/scdocs/doc/60.pdf. EFSA (2008). Inability to assess the safety of a silver hydrosol added for nutritional purposes as a source of silver in food supplements and the bioavailability of silver from this source based on the supporting dossier. Scientific Statement of the Panel on Food Additives and Nutrient Sources added to Food (ANS). The EFSA Journal (2008) 884, 1-3. http://www.efsa.europa.eu/en/efsajournal/doc/884.pdf. EFSA (2009a). Calcium silicate and silicon dioxide/silicic acid gel added for nutritional purposes to food supplements. Scientific Opinion of the Panel on Food Additives amd Nutrient Sources added to Food, European Food Safety Authority. The EFSA Journal (2009) 1132, 1-24. http://www.efsa.europa.eu/en/scdocs/doc/1132.pdf. EFSA (2009b). Scientific Opinion on the potential risks arising from nanoscience and nanotechnologies on food and feed safety. European Food Safety Authority. The EFSA Journal. 958: 1-39. enHealth (2012). Environmental health risk assessment guidelines for assessing human health risks from environmental hazards. Commissioned by the enHealth Council. http://www.health.gov.au/internet/main/publishing.nsf/Content/A12B57E41EC9F326CA257BF0001F9E7D/$File/DoHA-EHRA-120910.pdf. Eom, H.-J. and Choi, J. (2010). p38 MAPK activation, DNA damage, cell cycle arrest and apoptosis as mechanisms of toxicity of silver nanoparticles in Jurkat T cells. Environmental Science & Technology. 44: 8337-8342. Espinosa-Cristobal, L. F., Martinez-Castañon, G. A., Loyola-Rodriguez, J. P., Patiño-Marin, N., Reyes-Macías, J. F., Vargas-Morales, J. M. and Ruiz, F. (2013). Toxicity, distribution, and accumulation of silver nanoparticles in Wistar rats. Journal of Nanoparticle Research. 15: 1-12.

Page 83 of 106
Evans, S. M., Ashwood, P., Warley, A., Berisha, F., Thompson, R. P. H. and Powell, J. J. (2002). The role of dietary microparticles and calcium in apoptosis and interleukin-1β release of intestinal macrophages. Gastroenterology. 123: 1543-1553. Fabian, E., Landsiedel, R., Ma-Hock, L., Wiench, K., Wohlleben, W. and Van Ravenzwaay, B. (2008). Tissue distribution and toxicity of intravenously administered titanium dioxide nanoparticles in rats. Archives of toxicology. 82: 151-157. FAO/WHO (2010). FAO/WHO expert meeting on the application of nanotechnologies in the food and agriculture sectors: potential food safety implications. Food and Agriculture Organization of the United Nations and the World Health Organization. http://apps.who.int/iris/bitstream/10665/44245/1/9789241563932_eng.pdf. Farrera, C. and Fadeel, B. (2015). It takes two to tango: understanding the interactions between engineered nanomaterials and the immune system. European Journal of Pharmaceutics and Biopharmaceutics. In Press, Accepted Manuscript. FDA (2015). Summary of color additives for use in the United States in in foods, drugs, cosmetics, and medical devices. United States Food and Drug Administration. http://www.fda.gov/ForIndustry/ColorAdditives/ColorAdditiveInventories/ucm115641.htm#cfr. FoE (2014). Way too little: Our government's failure to regulate nanomaterials in food and agriculture. Friends of the Earth Australia. http://emergingtech.foe.org.au/wp-content/uploads/2014/05/FOE_nanotech_food_report_low_res1.pdf. Foldbjerg, R., Olesen, P., Hougaard, M., Dang, D. A., Hoffmann, H. J. and Autrup, H. (2009). PVP-coated silver nanoparticles and silver ions induce reactive oxygen species, apoptosis and necrosis in THP-1 monocytes. Toxicology Letters. 190: 156-162. Fondevila, M., Herrer, R., Casallas, M. C., Abecia, L. and Ducha, J. J. (2009). Silver nanoparticles as a potential antimicrobial additive for weaned pigs. Animal Feed Science and Technology. 150: 259-269. Fruijtier-Pölloth, C. (2012). The toxicological mode of action and the safety of synthetic amorphous silica—A nanostructured material. Toxicology. 294: 61-79. FSANZ (2014). Promoting international harmonisation of food standards, 2nd edition - December 2014. Food Standards Australia New Zealand. FSANZ (2016). Application handbook. 1 March 2016. Prepared by Food Standards Australia New Zealand. http://www.foodstandards.gov.au/code/changes/Documents/Application%20Handbook%20as%20at%201%20March%202016.pdf. Fu, C., Liu, T., Li, L., Liu, H., Chen, D. and Tang, F. (2014). The absorption, distribution, excretion and toxicity of mesoporous silica nanoparticles in mice following different exposure routes. Biomaterials. 34: 2565-2575. Fung, M. C. and Bowen, D. L. (1996). Silver products for medical indications: risk-benefit assessment. Clinical Toxicology. 34: 119-126.

Page 84 of 106
Gaillet, S. and Rouanet, J.-M. (2015). Silver nanoparticles: Their potential toxic effects after oral exposure and underlying mechanisms – A review. Food and Chemical Toxicology. 77: 58-63. Geraets, L., Oomen, A. G., Krystek, P., Jacobsen, N. R., Wallin, H., Laurentie, M., Verharen, H. W., Brandon, E. F. A. and de Jong, W. H. (2014). Tissue distribution and elimination after oral and intravenous administration of different titanium dioxide nanoparticles in rats. Particle and Fibre Toxicology. 11: 30. Grosse, S., Evje, L. and Syversen, T. (2013). Silver nanoparticle-induced cytotoxicity in rat brain endothelial cell culture. Toxicology in vitro. 27: 305-313. Gui, S., Zhang, Z., Zheng, L., Cui, Y., Liu, X., Li, N., Sang, X., Sun, Q., Gao, G., Cheng, Z., Cheng, J., Wang, L., Tang, M. and Hong, F. (2011). Molecular mechanism of kidney injury of mice caused by exposure to titanium dioxide nanoparticles. Journal of Hazardous Materials. 195: 365-370. Gui, S., Sang, X., Zheng, L., Ze, Y., Zhao, X., Sheng, L., Sun, Q., Cheng, Z., Cheng, J., Hu, R., Wang, L., Hong, F. and Tang, M. (2013). Intragastric exposure to titanium dioxide nanoparticles induced nephrotoxicity in mice, assessed by physiological and gene expression modifications. Particle and Fibre Toxicology. 10: 4. Hadrup, N., Loeschner, K., Bergström, A., Wilcks, A., Gao, X., Vogel, U., Frandsen, H., Larsen, E., Lam, H. and Mortensen, A. (2012a). Subacute oral toxicity investigation of nanoparticulate and ionic silver in rats. Archives of Toxicology. 86: 543-551. Hadrup, N., Loeschner, K., Mortensen, A., Sharma, A. K., Qvortrup, K., Larsen, E. H. and Lam, H. R. (2012b). The similar neurotoxic effects of nanoparticulate and ionic silver in vivo and in vitro. NeuroToxicology. 33: 416-423. Hadrup, N. and Lam, H. R. (2013). Oral toxicity of silver ions, silver nanoparticles and colloidal silver – a review. Regulatory Toxicology and Pharmacology. 68: 1-7. He, Q., Zhang, Z., Gao, F., Li, Y. and Shi, J. (2011). In vivo biodistribution and urinary excretion of mesoporous silica nanoparticles: effects of particle size and PEGylation. Small. 7: 271-280. Hong, J.-S., Kim, S., Lee, S. H., Jo, E., Lee, B., Yoon, J., Eom, I.-C., Kim, H.-M., Kim, P., Choi, K., Lee, M. Y., Seo, Y.-R., Kim, Y., Lee, Y., Choi, J. and Park, K. (2014). Combined repeated-dose toxicity study of silver nanoparticles with the reproduction/developmental toxicity screening test. Nanotoxicology. 8: 349-362. Hristozov, D. R., Gottardo, S., Critto, A. and Marcomini, A. (2012). Risk assessment of engineered nanomaterials: a review of available data and approaches from a regulatory perspective. Nanotoxicology. 6: 880-898. Hu, R., Zheng, L., Zhang, T., Gao, G., Cui, Y., Cheng, Z., Cheng, J., Hong, M., Tang, M. and Hong, F. (2011). Molecular mechanism of hippocampal apoptosis of mice following exposure to titanium dioxide nanoparticles. Journal of Hazardous Materials. 191: 32-40. Janer, G., del Molino, M., Fernandez-Rosas, E., Fernandez, A. and Vazquez-Campos, S. (2014). Cell uptake and oral absorption of titanium dioxide nanoparticles. Toxicology Letters. 228: 103-110.

Page 85 of 106
Jani, P. U., McCarthy, D. E. and Florence, A. T. (1994). Titanium dioxide (rutile) particle uptake from the rat GI tract and translocation to systemic organs after oral administration. International Journal of Pharmaceutics. 105: 157-168. JECFA (1969). Toxicological evaluation of some food colours, emulsifiers, stabilizers, anti-caking agents and certain other substances: Titanium dioxide. Joint FAO/WHO Expert Committee of Food Additives. 27 May-4 June 1969. FAO Nutrition Meeting Report Series No. 46A. http://www.inchem.org/documents/jecfa/jecmono/v46aje19.htm. JECFA (1974). Toxicological evaluation of certain food additives with a review of general principles and of specifications. Seventeenth report of the Joint FAO/WHO Expert Committee on Food Additives. World Health Organization. http://whqlibdoc.who.int/trs/WHO_TRS_539.pdf?ua=1. JECFA (1977). WHO food additive series No. 12. Silver. Joint FAO/WHO Expert Committee on Food Additives, Geneva. WHO Technical Report Series No. 617. http://www.inchem.org/documents/jecfa/jecmono/v12je19.htm. Jensen, L. S., Peterson, R. P. and Falen, L. (1974). Inducement of enlarged hearts and muscular dystrophy in turkey poults with dietary silver. Poultry Science. 53: 57-64. Jeong, G., Jo, U., Ryu, H., Kim, Y., Song, K. and Yu, I. (2010). Histochemical study of intestinal mucins after administration of silver nanoparticles in Sprague–Dawley rats. Archives of Toxicology. 84: 63-69. Jiang, X., Foldbjerg, R., Miclaus, T., Wang, L., Singh, R., Hayashi, Y., Sutherland, D., Chen, C., Autrup, H. and Beer, C. (2013). Multi-platform genotoxicity analysis of silver nanoparticles in the model cell line CHO-K1. Toxicology Letters. 222(1): 55-63. Jones, K., Morton, J., Smith, I., Jurkschat, K., Harding, A.-H. and Evans, G. (2015). Human in vivo and in vitro studies on gastrointestinal absorption of titanium dioxide nanoparticles. Toxicology Letters. 233: 95-101. Karlsson, H. L., Gustafsson, J., Cronholm, P. and Möller, L. (2009). Size-dependent toxicity of metal oxide particles—A comparison between nano- and micrometer size. Toxicology Letters. 188: 112-118. Kim, Y. S., Kim, J. S., Cho, H. S., Rha, D. S., Kim, J. M., Park, J. D., Choi, B. S., Lim, R., Chang, H. K., Chung, Y. H., Kwon, I. H., Jeong, J., Han, B. S. and Yu, I. J. (2008). Twenty-eight day oral toxicity, genotoxicity, and gender-related tissue distribution of silver nanoparticles in sprague-dawley rats. Inhalation Toxicology. 20: 575-583. Kim, Y., Song, M., Park, J., Song, K., Ryu, H., Chung, Y., Chang, H., Lee, J., Oh, K., Kelman, B., Hwang, I. and Yu, I. (2010). Subchronic oral toxicity of silver nanoparticles. Particle and Fibre Toxicology. 7: 20. Kim, J. S., Song, K. S., Sung, J. H., Ryu, H. R., Choi, B. G., Cho, H. S., Lee, J. K. and Yu, I. J. (2013). Genotoxicity, acute oral and dermal toxicity, eye and dermal irritation and corrosion and skin sensitisation evaluation of silver nanoparticles. Nanotoxicology. 7: 953-960. Kim, Y.-R., Lee, S.-Y., Lee, E. J., Park, S. H., Seong, N.-w., Seo, H.-S., Shin, S.-S., Kim, S.-J., Meang, E.-H., Park, M.-K., Kim, M.-S., Kim, C.-S., Kim, S.-K., Son, S. W., Seo, Y. R., Kang, B. H., Han, B. S., An, S. S. A., Lee, B.-J. and Kim, M.-K. (2014). Toxicity of colloidal silica nanoparticles administered orally for 90 days in rats. International Journal of Nanomedicine. 9: 67-78.

Page 86 of 106
Kittler, S., Greulich, C., Diendorf, J., Köller, M. and Epple, M. (2010). Toxicity of silver nanoparticles increases during storage because of slow dissolution under release of silver ions. Chemistry of Materials. 22: 4548-4554. Klimisch, H.-J., Andreae, M. and Tillman, U. (1997). A systematic approach for evaluating the quality of experimental toxicological and ecotoxicological data. Regulatory Toxicology and Pharamcology. 25: 1-5. Kovvuru, P., Mancilla, P. E., Shirode, A. B., Murray, T. M., Begley, T. J. and Reliene, R. (2014). Oral ingestion of silver nanoparticles induces genomic instability and DNA damage in multiple tissues. Nanotoxicology. Early Online: 1-10. Krug, H. F. and Wick, P. (2011). Nanotoxicology: An Interdisciplinary Challenge. Angewandte Chemie International Edition. 50: 1260-1278. Krug, H. F. (2014). Nanosafety research—are we on the right track? Angewandte Chemie International Edition. 53: 12304-12319. Kulthong, K., Maniratanachote, R., Kobayashi, Y., Fukami, T. and Yokoi, T. (2012). Effects of silver nanoparticles on rat hepatic cytochrome P450 enzyme activity. Xenobiotica. 42: 854-862. Lankveld, D. P. K., Oomen, A. G., Krystek, P., Neigh, A., Troost – de Jong, A., Noorlander, C. W., Van Eijkeren, J. C. H., Geertsma, R. E. and De Jong, W. H. (2010). The kinetics of the tissue distribution of silver nanoparticles of different sizes. Biomaterials. 31: 8350-8361. Lee, J. H., Kim, Y. S., Song, K. S., Ryu, H. R., Sung, J. H., Park, J. D., Park, H. M., Song, N. W., Shin, B. S., Marshak, D., Ahn, K., Lee, J. E. and Yu, I. J. (2013). Biopersistence of silver nanoparticles in tissues from Sprague-Dawley rats. Particle and Fibre Toxicology. 10: 36. Lee, C.-M., Lee, T. K., Kim, D.-I., Kim, Y.-R., Kim, M.-K., Jeong, H.-J., Sohn, M.-H. and Lim, S. T. (2014a). Optical imaging of absorption and distribution of RITC-SiO(2) nanoparticles after oral administration. International Journal of Nanomedicine. 9: 243-250. Lee, J.-A., Kim, M.-K., Paek, H.-J., Kim, Y.-R., Kim, M.-K., Lee, J.-K., Jeong, J. and Choi, S.-J. (2014b). Tissue distribution and excretion kinetics of orally administered silica nanoparticles in rats. International Journal of Nanomedicine. 9: 251-260. Lerner, A. (2007). Aluminum is a potential environmental factor for Crohn's disease induction. Annals of the New York Academy of Sciences. 1107: 329-345. Lerner, A. (2012). Aluminum as an adjuvant in Crohn's disease induction. Lupus. 21: 231-238. Lesniak, A., Fenaroli, F., Monopoli, M. P., Åberg, C., Dawson, K. A. and Salvati, A. (2012). Effects of the presence or absence of a protein corona on silica nanoparticle uptake and impact on cells. ACS Nano. 6: 5845-5857. Li, N., Duan, Y., Hong, M., Zheng, L., Fei, M., Zhao, X., Wang, J., Cui, Y., Liu, H., Cai, J., Gong, S., Wang, H. and Hong, F. (2010). Spleen injury and apoptotic pathway in mice caused by titanium dioxide nanoparticules. Toxicology Letters. 195: 161-168.

Page 87 of 106
Liu, H., Ma, L., Zhao, J., Liu, J., Yan, J., Ruan, J. and Hong, F. (2009). Biochemical toxicity of nano-anatase TiO2 particles in mice. Biological Trace Element Research. 129: 170-80. Liu, H., Ma, L., Liu, J., Zhao, J., Yan, J. and Hong, F. (2010a). Toxicity of nano-anatase TiO2 to mice: Liver injury, oxidative stress. Toxicological & Environmental Chemistry. 92: 175 - 186. Liu, W., Wu, Y., Wang, C., Li, H. C., Wang, T., Liao, C. Y., Cui, L., Zhou, Q. F., Yan, B. and Jiang, G. B. (2010b). Impact of silver nanoparticles on human cells: Effect of particle size. Nanotoxicology. 4: 319-330. Liu, J. and Hurt, R. H. (2010). Ion release kinetics and particle persistence in aqueous nano-silver colloids. Environmental Science & Technology. 44: 2169-2175. Liu, T., Li, L., Teng, X., Huang, X., Liu, H., Chen, D., Ren, J., He, J. and Tang, F. (2011). Single and repeated dose toxicity of mesoporous hollow silica nanoparticles in intravenously exposed mice. Biomaterials. 32: 1657-1668. Loeschner, K., Hadrup, N., Qvortrup, K., Larsen, A., Gao, X., Vogel, U., Mortensen, A., Lam, H. and Larsen, E. (2011). Distribution of silver in rats following 28 days of repeated oral exposure to silver nanoparticles or silver acetate. Particle and Fibre Toxicology. 8: 18. Lomer, M. C. E., Thompson, R. P. H., Commisso, J., Keen, C. L. and Powell, J. J. (2000). Determination of titanium dioxide in foods using inductively coupled plasma optical emission spectrometry. Analyst. 125: 2339-2343. Lomer, M. C. E., Harvey, R. S. J., Evans, S. M., Thompson, R. P. H. and Powell, J. J. (2001). Efficacy and tolerability of a low microparticle diet in a double blind, randomized, pilot study in Crohn's disease. European Journal of Gastroenterology & Hepatology. 13: 101-106. Lomer, M. C. E., Thompson, R. P. H. and Powell, J. J. (2002). Fine and ultrafine particles of the diet: influence on the mucosal immune response and association with Crohn's disease. Proceedings of the Nutrition Society. 61: 123-130. Lomer, M. C. E., Hutchinson, C., Volkert, S., Greenfield, S. M., Catterall, A., Thompson, R. P. H. and Powell, J. J. (2004a). Dietary sources of inorganic microparticles and their intake in healthy subjects and patients with Crohn's disease. British Journal of Nutrition. 92: 947-955. Lomer, M. C. E., Grainger, S. L., Ede, R., Catterall, A. P., Greenfield, S. M., Cowan, R. E., Vicary, R. F., Jenkins, A. P., Fidler, H., Harvey, R. S., Ellis, R., McNair, A., Ainley, C. C., Thompson, R. P. H. and Powell, J. J. (2005). Lack of efficacy of a reduced microparticle diet in a multi-centred trial of patients with active Crohn's disease. European Journal of Gastroenterology & Hepatology. 17: 377-384. Lomer, M. C. E. (2011). Dietary and nutritional considerations for inflammatory bowel disease. Proceedings of the Nutrition Society. 70: 329-335. Lu, J., Liong, M., Li, Z., Zink, J. I. and Tamanoi, F. (2010). Biocompatibility, biodistribution, and drug-delivery efficiency of mesoporous silica nanoparticles for cancer therapy in animals. Small. 6: 1794-1805.

Page 88 of 106
MacNicoll, A., Kelly, M., Aksoy, H., Kramer, E., Bouwmeester, H. and Chaudhry, Q. (2015). A study of the uptake and biodistribution of nano-titanium dioxide using in vitro and in vivo models of oral intake. Journal of Nanoparticle Research. 17: 1-20. Mahler, G. J., Esch, M. B., Tako, E., Southard, T. L., Archer, S. D., Glahn, R. P. and Shuler, M. L. (2012). Oral exposure to polystyrene nanoparticles affects iron absorption. Nat Nano. 7: 264-271. Mahmud, N. and Weir, D. G. (2001). The urban diet and Crohn's disease: is there a relationship? European Journal of Gastroenterology & Hepatology. 13: 93-95. Magnuson, B. A., Jonaitis, T. S. and Card, J. W. (2011). A brief review of the occurrence, use, and safety of food-related nanomaterials. Journal of Food Science. 76: R126-R133. Maneewattanapinyo, P., Banlunara, W., Thammacharoen, C., Ekgasit, S. and Kaewamatawong, T. (2011). An evaluation of acute toxicity of colloidal silver nanoparticles. Journal of Veterinary Medical Sciences. 73: 1417-1423. Mathias, F. T., Romano, R. M., Kizys, M. M. L., Kasamatsu, T., Giannocco, G., Chiamolera, M. I., Dias-da-Silva, M. R. and Romano, M. A. (2014). Daily exposure to silver nanoparticles during prepubertal development decreases adult sperm and reproductive parameters. Nanotoxicology. Early online: 1-7. Midander, K., Cronholm, P., Karlsson, H. L., Elihn, K., Möller, L., Leygraf, C. and Wallinder, I. O. (2009). Surface characteristics, copper release, and toxicity of nano- and micrometer-sized copper and copper(II) oxide particles: a cross-disciplinary study. Small. 5: 389-399. Mindell, J.A. (2012). Lysosomal acidification mechanisms. Ann. Rev. Physiol. 74: 69-86. Miura, N. and Shinohara, Y. (2009). Cytotoxic effect and apoptosis induction by silver nanoparticles in HeLa cells. Biochemical and Biophysical Research Communications. 390: 733-737. Mohammadipour, A., Fazel, A., Haghir, H., Motejaded, F., Rafatpanah, H., Zabihi, H., Hosseini, M. and Bideskan, A. E. (2014). Maternal exposure to titanium dioxide nanoparticles during pregnancy; impaired memory and decreased hippocampal cell proliferation in rat offspring. Environmental Toxicology and Pharmacology. 37: 617-625. Monopoli, M. P., Aberg, C., Salvati, A. and Dawson, K. A. (2012). Biomolecular coronas provide the biological identity of nanosized materials. Nat Nano. 7: 779-786. Munger, M. A., Radwanski, P., Hadlock, G. C., Stoddard, G., Shaaban, A., Falconer, J., Grainger, D. W. and Deering-Rice, C. E. (2013). In vivo human time-exposure study of orally dose commercial silver nanoparticles. Nanomedicine. 10: 1-9. Munger, M. A., Hadlock, G., Stoddard, G., Slawson, M. H., Wilkins, D. G., Cox, N. and Rollins, D. (2015). Assessing orally bioavailable commercial silver nanoparticle product on human cytochrome P450 enzyme activity. Nanotoxicology. Early Online: 1-8. Mwilu, S. K., El Badawy, A. M., Bradham, K., Nelson, C., Thomas, D., Scheckel, K. G., Tolaymat, T., Ma, L. and Rogers, K. R. (2013). Changes in silver nanoparticles exposed to human synthetic stomach fluid: Effects of particle size and surface chemistry. Science of The Total Environment. 447: 90-98.

Page 89 of 106
NAS (2009). Nanotechnology in food products: worskshop summary. Institute of Medicine, The National Academies. Washington DC: The National Academies Press. http://www.ncbi.nlm.nih.gov/books/NBK32730/pdf/TOC.pdf. NCI (1979a). I-NCI 1979 (22); DHS-NCI 1979 (9). As cited in SCCNFP 2000. NCI (1979b). Bioassay of titanium dioxide for possible carcinogenicity. CAS No. 13463-67-7, NCI-CG-TR-97. National Cancer Institute, Carcinogenesis Technical Report Series No. 97. NICNAS (2016). Data requirements and animal testing for new cosmetic ingredients. National Industrial Chemicals Notification and Assessment Scheme. [Accessed 14/04/2016]. http://www.nicnas.gov.au/communications/issues/animal-testing-and-cosmetics/data-requirements-and-animal-testing-for-new-cosmetic-ingredients. OECD (2013). Regulatory frameworks for nanotechnology in foods and medical products: summary results of a survey activity. Organsation for Economic Co-operation and Development. DSTI/STP/NANO(2012)22/FINAL. OECD (2015). Dossier on titanium dioxide. Series on the Safety of Manufactured Nanomaterials, No. 54. Organisation for Economic Co-operation and Development. ENV/JM/MONO(2015)17. http://www.oecd.org/chemicalsafety/nanosafety/titanium-dioxide-nm100-nm105-manufactured-nanomaterial.htm. Paek, H., Chung, H., Lee, J. and al., E. (2014). Quantitative determination of silica nanoparticles in biological matrices and their pharmacokinetics and toxicokinetics in rats. Adv Sci Mater. In Press: As cited in Lee et al. 2014b. Park, E.-J., Bae, E., Yi, J., Kim, Y., Choi, K., Lee, S. H., Yoon, J., Lee, B. C. and Park, K. (2010a). Repeated-dose toxicity and inflammatory responses in mice by oral administration of silver nanoparticles. Environmental Toxicology and Pharmacology. 30: 162-168. Park, E.-J., Kim, H., Kim, Y., Yi, J., Choi, K. and Park, K. (2010b). Inflammatory responses may be induced by a single intratracheal instillation of iron nanoparticles in mice. Toxicology. 275: 65-71. Park, E.-J., Yi, J., Kim, Y., Choi, K. and Park, K. (2010c). Silver nanoparticles induce cytotoxicity by a Trojan-horse type mechanism. Toxicology in vitro. 24: 872-878. Park, M. V. D. Z., Verharen, H. W., Zwart, E., Hernandez, L. G., van Benthem, J., Elsaesser, A., Barnes, C., McKerr, G., Howard, C. V., Salvati, A., Lynch, I., Dawson, K. A. and de Jong, W. H. (2011). Genotoxicity evaluation of amorphous silica nanoparticles of different sizes using the micronucleus and the plasmid lacZ gene mutation assay. Nanotoxicology. 5: 168-181. Pereira, D., Couto Irving, S., Lomer, M. and Powell, J. (2014). A rapid, simple questionnaire to assess gastrointestinal symptoms after oral ferrous sulphate supplementation. BMC Gastroenterology. 14: 103. Pereira, D. I. A., Aslam, M. F., Frazer, D. M., Schmidt, A., Walton, G. E., McCartney, A. L., Gibson, G. R., Anderson, G. J. and Powell, J. J. (2015). Dietary iron depletion at weaning imprints low microbiome diversity and this is not recovered with oral nano Fe(III). MicrobiologyOpen. 4: 12-27. Periasamy, V. S., Athinarayanan, J., Al-Hadi, A. M., Juhaimi, F. A., Mahmoud, M. H. and Alshatwi, A. A. (2015). Identification of titanium dioxide nanoparticles in food products: induce intracellular

Page 90 of 106
oxidative stress mediated by TNF and CYP1A genes in human lung fibroblast cells. Environmental Toxicology and Pharmacology. 39: 176-186. Perl, D. P., Fogarty, U., Harpaz, N. and Sachar, D. B. (2004). Bacterial-metal interactions: The potential role of aluminum and other trace elements in the etiology of Chrohn's disease. Inflammatory Bowel Diseases. 10: 881-883. Peters, R., Kramer, E., Oomen, A. G., Herrera Rivera, Z. E., Oegema, G., Tromp, P. C., Fokkink, R., Rietveld, A., Marvin, H. J. P., Weigel, S., Peijnenburg, A. A. C. M. and Bouwmeester, H. (2012). Presence of nano-sized silica during in vitro digestion of foods containing silica as a food additive. ACS Nano. 6: 2441-2451. Peters, R. J. B., van Bemmel, G., Herrera-Rivera, Z., Helsper, H. P. F. G., Marvin, H. J. P., Weigel, S., Tromp, P. C., Oomen, A. G., Rietveld, A. G. and Bouwmeester, H. (2014). Characterization of titanium dioxide nanoparticles in food products: analytical methods To define nanoparticles. Journal of Agricultural and Food Chemistry. 62: 6285-6293. Powell, J. J., Ainley, C. C., Harvey, R. S., Mason, I. M., Kendall, M. D., Sankey, E. A., Dhillon, A. P. and Thompson, R. P. (1996). Characterisation of inorganic microparticles in pigment cells of human gut associated lymphoid tissue. Gut. 38: 390-395. Powell, J. J., Harvey, R. S. J., Ashwood, P., Wolstencroft, R., Gershwin, M. E. and Thompson, R. P. H. (2000). Immune potentiation of ultrafine dietary particles in normal subjects and patients with inflammatory bowel disease. Journal of Autoimmunity. 14: 99-105. Powell, J. J., Thoree, V. and Pele, L. C. (2007). Dietary microparticles and their impact on tolerance and immune responsiveness of the gastrointestinal tract. British Journal of Nutrition. 98: S59-S63. Powell, J. J., Faria, N., Thomas-McKay, E. and Pele, L. C. (2010). Origin and fate of dietary nanoparticles and microparticles in the gastrointestinal tract. Journal of Autoimmunity. 34: J226-J233. Powell, J. J., Cook, W. B., Chatfield, M., Hutchinson, C., Pereira, D. I. A. and Lomer, M. C. E. (2013a). Iron status is inversely associated with dietary iron intakes in patients with inactive or mildly active inflammatory bowel disease. Nutrition & Metabolism. 10: 18. Powell, J. J., Cook, W. B., Hutchinson, C., Tolkien, Z., Chatfield, M., Pereira, D. I. A. and Lomer, M. C. E. (2013b). Dietary fortificant iron intake is negatively associated with quality of life in patients with mildly active inflammatory bowel disease. Nutrition & Metabolism. 10: 1-9. Powell, J. J., Bruggraber, S. F. A., Faria, N., Poots, L. K., Hondow, N., Pennycook, T. J., Latunde-Dada, G. O., Simpson, R. J., Brown, A. P. and Pereira, D. I. A. (2014). A nano-disperse ferritin-core mimetic that efficiently corrects anemia without luminal iron redox activity. Nanomedicine. 10: 1529-1538. Prathna, T. C., Chandrasekaran, N. and Mukherjee, A. (2011). Studies on aggregation behaviour of silver nanoparticles in aqueous matrices: Effect of surface functionalization and matrix composition. Colloids and Surfaces A: Physicochemical and Engineering Aspects. 390: 216-224. Priestly, B. G., Bartholomaeus, A. and Drew, R. (2014). Nanotechnologies and Nanomaterials. In: Hazards of Food Contact Material, Encyclopedia of Food Safety, Volume 2. Motarjemi Y, Moy G, Todd E (eds). Elsevier Inc. pg. 444-448.

Page 91 of 106
RIVM (2014). Safety of the nanomaterial SAS (silica) in food still uncertain. National Institute for Public Health and the Environment (RIVM), the Netherlands. http://www.rivm.nl/en/Documents_and_publications/Common_and_Present/Newsmessages/2014/Safety_of_the_nanomaterial_SAS_silica_in_food_still_uncertain. Rogers, K. R., Bradham, K., Tolaymat, T., Thomas, D. J., Hartmann, T., Ma, L. and Williams, A. (2012). Alterations in physical state of silver nanoparticles exposed to synthetic human stomach fluid. Science of The Total Environment. 420: 334-339. Rungby, J. and Danscher, G. (1984). Hyperactivity in silver exposed mice. Acta Pharmacologica et Toxicologica. 55: 398-401. SafeWork (2009). Engineered nanomaterials: a review of the toxicology and health hazards. Prepared for Safe Work Australia. http://www.safeworkaustralia.gov.au/NR/rdonlyres/47D5968D-4A11-45A0-8121-8C992E111447/0/ToxicologyReview.pdf. SafeWork (2015). Engineered nanomaterials: an update on the toxicology and work health hazards. Prepared by ToxConsult for Safe Work Australia. http://www.safeworkaustralia.gov.au/sites/SWA/about/Publications/Documents/899/engineered-nanomaterials-update-toxicology.pdf. Sage Labs (2015). Balc/c inbred mouse. SAGE Labs. [Accessed 27/04/2015]. http://www.sageresearchlabs.com/research-models/inbred-mice/balbc. Sakai-Kato, K., Hidaka, M., Un, K., Kawanishi, T. and Okuda, H. (2014). Physicochemical properties and in vitro intestinal permeability properties and intestinal cell toxicity of silica particles, performed in simulated gastrointestinal fluids. Biochimica et Biophysica Acta (BBA) - General Subjects. 1840: 1171-1180. Sang, X., Li, B., Ze, Y., Hong, J., Ze, X., Gui, S., Sun, Q., Liu, H., Zhao, X., Sheng, L., Liu, D., Yu, X., Wang, L. and Hong, F. (2013). Toxicological mechanisms of nanosized titanium dioxide-induced spleen injury in mice after repeated peroral application. Journal of Agricultural and Food Chemistry. 61: 5590-5599. Sardari, R. R. R., Zarchi, S. R., Talebi, A., Nasri, S., Imani, S., Khoradmehr, A. and Sheshde, S. A. R. (2012). Toxicological effects of silver nanoparticles in rats. African Journal of Microbiology Research. 6: 5587-5593. SCCNFP (2000). Opinion of the scientific committee on cosmetic products and non-food products intended for consumers concerning titanium dioxide. Scientific Committee on Cosmetic Products and Non-food Products. SCCS (2014). Opinion on titanium dioxide (nano form). Scientific Committee on Consumer Safety, European Commission. SCCS/1516/13. Revision of 22 April 2014. http://ec.europa.eu/health/scientific_committees/consumer_safety/docs/sccs_o_136.pdf. Schneider, K., Schwarz, M., Burkholder, I., Kopp-Schneider, A., Edler, L., Kinsner-Ovaskainen, A., Hartung, T. and Hoffmann, S. (2009). “ToxRTool”, a new tool to assess the reliability of toxicological data. Toxicology Letters. 189: 138-144. Seok, S. H., Cho, W.-S., Park, J. S., Na, Y., Jang, A., Kim, H., Cho, Y., Kim, T., You, J.-R., Ko, S., Kang, B.-C., Lee, J. K., Jeong, J. and Che, J.-H. (2013). Rat pancreatitis produced by 13-week

Page 92 of 106
administration of zinc oxide nanoparticles: biopersistence of nanoparticles and possible solutions. Journal of Applied Toxicology. 33: 1089-1096. Shahare, B., Yashpal, M. and Singh, G. (2013). Toxic effects of repeated oral exposure of silver nanoparticles on small intestine mucosa of mice. Toxicology Mechanisms and Methods. 23: 161-167. Shepherd, N. A., Crocker, P. R., Smith, A. P. and Levison, D. A. (1987). Exogenous pigment in Peyer's patches. Human Pathology. 18: 50-54. Shinohara, N., Danno, N., Ichinose, T., Sasaki, T., Fukui, H., Honda, K. and Gamo, M. (2014). Tissue distribution and clearance of intravenously administered titanium dioxide (TiO2) nanoparticles. Nanotoxicology. 8: 132-141. Shumakova, A., Arianova, E., Shipelin, V., Sidorova, I., Selifanov, A., Trushina, E., Mustafina, O., Safenkova, I., Gmoshinskii, I., Khotimchenko, S. and Tute'ian, V. (2014). Toxicological assessment of nanostructured silica. I. Integral indices, adducts of DNA, tissue thiols and apoptosis in liver (in Russian). Voprosy pitaniia. 83: 52-62. Abstract only. Skalska, J., Frontczak-Baniewicz, M. and Strużyńska, L. (2014). Synaptic degeneration in rat brain after prolonged oral exposure to silver nanoparticles. NeuroToxicology. 46: 145-154. Smock, K. J., Schmidt, R. L., Hadlock, G., Stoddard, G., Grainger, D. W. and Munger, M. A. (2014). Assessment of orally dosed commercial silver nanoparticles on human ex vivo platelet aggregation. Nanotoxicology. 8: 328-333. So, S. J., Jang, I. S. and Han, C. S. (2008). Effect of micro/nano silica particle feeding for mice. Journal of Nanoscience and Nanotechnology. 8: 5367-5371. Abstract only. Tarantini, A., Lanceleur, R., Mourot, A., Lavault, M. T., Casterou, G., Jarry, G., Hogeveen, K. and Fessard, V. (2015). Toxicity, genotoxicity and proinflammatory effects of amorphous nanosilica in the human intestinal Caco-2 cell line. Toxicology in Vitro. 29: 398-407. Tassinari, R., Cubadda, F., Moracci, G., Aureli, F., D’Amato, M., Valeri, M., De Berardis, B., Raggi, A., Mantovani, A., Passeri, D., Rossi, M. and Maranghi, F. (2014). Oral, short-term exposure to titanium dioxide nanoparticles in Sprague-Dawley rat: focus on reproductive and endocrine systems and spleen. Nanotoxicology. 8: 654-662. Tavares, P., Balbinot, F., de Oliveira, H., Fagundes, G., Venâncio, M., Ronconi, J., Merlini, A., Streck, E., da Silva Paula, M. and de Andrade, V. (2012). Evaluation of genotoxic effect of silver nanoparticles (Ag-Nps) in vitro and in vivo. Journal of Nanoparticle Research. 14: 1-7. Tenzer, S., Docter, D., Kuharev, J., Musyanovych, A., Fetz, V., Hecht, R., Schlenk, F., Fischer, D., Kiouptsi, K., Reinhardt, C., Landfester, K., Schild, H., Maskos, M., Knauer, S. K. and Stauber, R. H. (2013). Rapid formation of plasma protein corona critically affects nanoparticle pathophysiology. Nat Nano. 8: 772-781. Thoree, V., Skepper, J., Deere, H., Pele, L. C., Thompson, R. P. H. and Powell, J. J. (2008). Phenotype of exogenous microparticle-containing pigment cells of the human Peyer’s patch in inflamed and normal ileum. Inflammation Research. 57: 374-378. ToxConsult (2016b). Nanotechnologies in Food Packaging: an Exploratory Appraisal of Safety and Regulation. ToxCR010615-TF, dated 13th May 2016.

Page 93 of 106
Uboldi, C., Giudetti, G., Broggi, F., Gilliland, D., Ponti, J. and Rossi, F. (2012). Amorphous silica nanoparticles do not induce cytotoxicity, cell transformation nor genotoxicity in Balb/3T3 mouse fibroblasts. Mutation Research/Genetic Toxicology and Environmental Mutagenesis. 745: 11-20. Umbreit, T. H., Francke-Carroll, S., Weaver, J. L., Miller, T. J., Goering, P. L., Sadrieh, N. and Stratmeyer, M. E. (2012). Tissue distribution and histopathological effects of titanium dioxide nanoparticles after intravenous or subcutaneous injection in mice. Journal of Applied Toxicology. 32: 350-357. UNEP (2004). Synthetic amorphous silica and silicates. Organisation for Economic Co-operation and Development Screening Information Dataset. http://www.chem.unep.ch/irptc/sids/oecdsids/Silicates.pdf. Urbanski, S., Arsenault, A., Green, F. and Haber, G. (1989). Pigment resembling atmospheric dust in Peyer's patches. Moderna Pathology. 2: 222-226. Abstract only. US EPA IRIS (1996). Silver (CASRN 7440-22-4) Oral RfD Assessment. United States Environmental Protection Agency Integrated Risk Information System. http://www.epa.gov/iris/subst/0099.htm. US EPA (2010). State of the Science literature review: everything nanosilver and more. United States Environmental Protection Agency. Scientific, Technical, Research, Engineering and Modeling Support (STREAMS). Final report. EPA/600/R-10/084. August 2010. US EPA (2014). Research in action: nanosilver and consumer products. United States Environmental Protection Agency. http://www.epa.gov/heasd/research/nanosilver.html. van der Zande, M., Vandebriel, R. J., van Doren, E., Kramer, E. J., Herrera Rivera, Z., Serrano-Rojero, C. S., Gremmer, E. R., Mast, J., Peters, R. J. B., Hollman, P. C. H., Hendriksen, P. J. M., Marvin, H. J. P., Peijnenburg, A. A. C. M. and Bouwmeester, H. (2012). Distribution, elimination, and toxicity of silver nanoparticles and silver ions in rats after 28-day oral exposure. ACS Nano. 6: 7427-7442. van der Zande, M., Vandebriel, R., Groot, M., Kramer, E., Herrera Rivera, Z., Rasmussen, K., Ossenkoppele, J., Tromp, P., Gremmer, E., Peters, R., Hendriksen, P., Marvin, H., Hoogenboom, R., Peijnenburg, A. and Bouwmeester, H. (2014). Sub-chronic toxicity study in rats orally exposed to nanostructured silica. Particle and Fibre Toxicology. 11: 8. van Kesteren, P. C. E., Cubadda, F., Bouwmeester, H., van Eijkeren, J. C. H., Dekkers, S., de Jong, W. H. and Oomen, A. G. (2014). Novel insights into the risk assessment of the nanomaterial synthetic amorphous silica, additive E551, in food. Nanotoxicology. Early Online: 1-10. Vasantharaja, D., Ramalingam, V. and Reddy, G. A. (2014). Oral toxic exposure of titanium dioxide nanoparticles on serum biochemical changes in adult male Wistar rats. Nanomedicine Journal. 2: 46-53. Walczak, A. P., Fokkink, R., Peters, R., Tromp, P., Herrera Rivera, Z. E., Rietjens, I. M. C. M., Hendriksen, P. J. M. and Bouwmeester, H. (2012). Behaviour of silver nanoparticles and silver ions in an in vitro human gastrointestinal digestion model. Nanotoxicology. Early Online: 1-13. Walkey, C. D. and Chan, W. C. W. (2012). Understanding and controlling the interaction of nanomaterials with proteins in a physiological environment. Chemical Society Reviews. 41: 2780-2799.

Page 94 of 106
Walter, D. (2013). Primary Particles – Agglomerates – Aggregates. In: Nanomaterials. Wiley-VCH Verlag GmbH & Co. KGaA. pg. 9-24. Wang, J., Zhou, G., Chen, C., Yu, H., Wang, T., Ma, Y., Jia, G., Gao, Y., Li, B., Sun, J., Li, Y., Jiao, F., Zhao, Y. and Chai, Z. (2007). Acute toxicity and biodistribution of different sized titanium dioxide particles in mice after oral administration. Toxicology Letters. 168: 176-185. Wang, Y., Chen, Z., Ba, T., Pu, J., Chen, T., Song, Y., Gu, Y., Qian, Q., Xu, Y., Xiang, K., Wang, H. and Jia, G. (2013). Susceptibility of young and adult rats to the oral toxicity of titanium dioxide nanoparticles. Small. 9: 1742-1752. Warheit, D. B. and Donner, E. M. (2015). How meaningful are risk determinations in the absence of a complete dataset? Making the case for publishing standardized test guideline and 'no effect' studies for evaluating the safety of nanoparticulates versus spurious 'high effect' results from single investigative studies. Sci Technol Adv Mater. 16: 034603 (5 pg). Weir, A., Westerhoff, P., Fabricius, L., Hristovski, K. and von Goetz, N. (2012). Titanium dioxide in food and personal care products. Environmental Science & Technology. 46: 2242-2250. West, B. and Wyzan, H. (1963). Investigations of the possible absorption of titanium dioxide from the gastrointestinal tract. American Cyanamid Company. Wayne, New Jersey. November 1963 (Unpublished studies). As cited in EFSA 2004. Wijnhoven, S. W. P., Peijnenburg, W. J. G. M., Herberts, C. A., Hagens, W. I., Oomen, A. G., Heugens, E. H. W., Roszek, B., Bisschops, J., Gosens, I., Van De Meent, D., Dekkers, S., De Jong, W. H., van Zijverden, M., Sips, A. n. J. A. M. and Geertsma, R. E. (2009). Nano-silver - a review of available data and knowledge gaps in human and environmental risk assessment. Nanotoxicology. 3: 109 - 138. Williams, K., Milner, J., Boudreau, M. D., Gokulan, K., Cerniglia, C. E. and Khare, S. (2014). Effects of subchronic exposure of silver nanoparticles on intestinal microbiota and gut-associated immune responses in the ileum of Sprague-Dawley rats. Nanotoxicology. Early online: 1-11. Wolterbeek, A., Oosterwijk, T., Schneider, S., Landsiedel, R., de Groot, D., van Ee, R., Wouters, M. and van de Sandt, H. (2015). Oral two-generation reproduction toxicity study with NM-200 synthetic amorphous silicia in Wistar rats. Reproductive Toxicology. In Press, Accepted Manuscript. Xie, G., Wang, C., Sun, J. and Zhong, G. (2011). Tissue distribution and excretion of intravenously administered titanium dioxide nanoparticles. Toxicology Letters. 205: 55-61. Yada, R. Y., Buck, N., Canady, R., DeMerlis, C., Duncan, T., Janer, G., Juneja, L., Lin, M., McClements, D. J., Noonan, G., Oxley, J., Sabliov, C., Tsytsikova, L., Vázquez-Campos, S., Yourick, J., Zhong, Q. and Thurmond, S. (2014). Engineered nanoscale food ingredients: evaluation of current knowledge on material characteristics relevant to uptake from the gastrointestinal tract. Comprehensive Reviews in Food Science and Food Safety. 13: 730-744. Yamashita, K., Yoshioka, Y., Higashisaka, K., Mimura, K., Morishita, Y., Nozaki, M., Yoshida, T., Ogura, T., Nabeshi, H., Nagano, K., Abe, Y., Kamada, H., Monobe, Y., Imazawa, T., Aoshima, H., Shishido, K., Kawai, Y., Mayumi, T., Tsunoda, S.-i., Itoh, N., Yoshikawa, T., Yanagihara, I., Saito, S. and Tsutsumi, Y. (2011). Silica and titanium dioxide nanoparticles cause pregnancy complications in mice. Nat Nano. 6: 321-328.

Page 95 of 106
Yang, Y.-X., Song, Z.-M., Cheng, B., Xiang, K., Chen, X.-X., Liu, J.-H., Cao, A., Wang, Y., Liu, Y. and Wang, H. (2014). Evaluation of the toxicity of food additive silica nanoparticles on gastrointestinal cells. Journal of Applied Toxicology. 34: 424-435. Yoshida, T., Yoshioka, Y., Takahashi, H., Misato, K., Mori, T., Hirai, T., Nagano, K., Abe, Y., Mukai, Y., Kamada, H., Tsunoda, S.-i., Nabeshi, H., Yoshikawa, T., Higashisaka, K. and Tsutsumi, Y. (2014). Intestinal absorption and biological effects of orally administered amorphous silica particles. Nanoscale Research Letters. 9: 1-7. Yu, W.-J., Son, J.-M., Lee, J., Kim, S.-H., Lee, I.-C., Baek, H.-S., Shin, I.-S., Moon, C., Kim, S.-H. and Kim, J.-C. (2014). Effects of silver nanoparticles on pregnant dams and embryo-fetal development in rats. Nanotoxicology. 8: 85-91. Yun, J.-W., Kim, S.-H., You, J.-R., Kim, W. H., Jang, J.-J., Min, S.-K., Kim, H. C., Chung, D. H., Jeong, J., Kang, B.-C. and Che, J.-H. (2015). Comparative toxicity of silicon dioxide, silver and iron oxide nanoparticles after repeated oral administration to rats. Journal of Applied Toxicology. 35: 681-693.
Page 96 of 106
Appendix A: Descriptions of TiO2 toxicity gavage studies
Single dose:
Wang et al. (2007) reported that 5,000 mg/kg TiO2 NPs (25 and 80 nm) with a single oral gavage
induced the significant lesions of the liver and kidney in mice. The EU Scientific Committee on
Consumer Safety (SCCP 2014) made the following comments regarding Wang et al. (2007). “The
study has a number of flaws, and is therefore of little value to this assessment. Sufficient
characterisation of the nanomaterials used was not carried out, the administered dose (5 g/kg/bw)
was very high, frequent oesophageal ruptures were reported that led to animal deaths, translocation
of TiO2 from GI tract was measured as titanium with no evidence that it was in nanoparticulate form. It
is not clear whether any of the effects observed were due to TiO2 toxicity, or simply overloading the
gut at high dose of the particulate material”.
5 day repeat dosing:
In a well conducted study, Tassinari et al. (2014) gavaged rats at doses of 1 and 2 mg/kg/d for 5 days
to rats (n = 7/dose/sex) with nano- TiO2 purchased from Sigma Aldrich. The authors determined the
size in water was on average 284±43 nm, but there were also agglomerates up to 1.5µm, 13% of the
particles were <100nm. 24 hours after treatment blood was taken for analysis of testosterone (T),
17b estradiol (E2), and triiodothyronine (T3). Histopathological examination was done on uterus,
ovary, testes, thyroid and adrenals. Spleen was sampled both for histopathological examination and
for studying tissue deposition of TiO2 nanoparticles. Total Ti tissue content was measured by ICP-MS
after tissue digestion, particles in spleen slices were detected by SEM and identified as TiO2 by
energy dispersive X-ray (EDX). A small increase in spleen total Ti, significant at the top dose, was
observed (0.036 ± 0.009, 0.040 ± 0.009 and 0.046 ± 0.008 µg/g for control, low dose and high dose
respectively). TiO2 nanoparticles and aggregates were observed in the spleen.
• A significant increase in total Ti in ovary at the higher dose (0.28 ± 0.07 vs. controls 0.12 ±
0.04 mg/g) appeared to be accompanied by an increased incidence of apoptosis in granulosa
cells.
• Although there was no significant increase in thyroid Ti, histological changes were observed.
The changes were desquamation of the follicular epithelium into the lumen in males and
increased follicular epithelium height in females.
• At the high dose testosterone levels were significantly increased in males and decreased in
females.

Page 97 of 106
14 day repeat dosing:
Azim et al. (2015) administered nano-anatase TiO2 (21 nm) to rats in a 1% sonicated Tween 80
suspension at 150 mg/kg/day for 2 weeks. At the end of dosing serum liver enzymes were elevated
and massive focal degeneration of hepatocytes with mononuclear cellular infiltration was observed
histologically. There were also liver biochemistry changes indicative of oxidative stress damage. The
effects were ameliorated with various antioxidant treatments.
Bu et al. (2010) observed dose-dependent increases in the levels of the serum enzyme markers for
liver and heart damage after the administration of TiO2 nanoparticles (<50nm) to rats. Gavage doses
in sonicated water were 0, 160, 400 and 1,000 mg/kg/d for 14 days. Routine histopathology did not
show damage to any organ examined although cardiac mitochondrial swelling was observed with
TEM. From a NMR-based metabolomics analysis of many parameters in urine the authors concluded
the slight liver and heart injuries may be attributed to disturbances in energy and amino acid
metabolism, and to the gut microflora.
Vasantharaja et al. (2014) suspended, with sonication, Sigma Aldrich nano-TiO2 (<100nm) in 0.9%
saline and administered to rats at 50 and 100 mg/kg/d for 14 days. Serum biomarkers for liver and
kidney function were significantly elevated at both doses.
Mohammadipour et al. (2014) gavage dosed pregnant rats with 100 mg/kg with nano-TiO2 (~10 nm)
purchased from a commercial supplier on gestation days 2 – 21. Proliferating cell marker (Ki-67
protein) was significantly reduced in the hippocampus of day 1 neonates. At postnatal day 21,
weaned rats had significantly impaired learning tested with the passive avoidance test and Morris
water maze.
30 day repeat dosing:
Duan et al. (2010) gavaged mice with suspensions of colloidal nanoparticulate anatase TiO2 (5nm)
made via controlled hydrolysis of titanium tetrabutoxide. Doses were 62.5,125 and 250 mg/kg/d for 30
days. At 125 mg/kg, serum enzyme changes indicative of liver effects were observed, at 250 mg/kg/d
there were also hepatic histological changes. There were also changes in haematological and
immunological parameters.
In a gavage (in water suspension) study Wang et al. (2013) exposed young (3 week) and adult (8
week old) rats at doses of 0, 10, 50, 200 mg/kg/d for 30 days. At the end of the treatment regime with

Page 98 of 106
the high dose, Ti (measured by ICP-MS) in blood, liver, kidney and spleen of young and adult rats
were not significantly different to the control groups. The authors concluded the rate and extent of
absorption of TiO2 from the gastrointestinal tract is very low, and nanoparticles observed by TEM to
be in the stomach and small intestine mucosa did not translocate into the systemic circulation.
Intriguingly, the high dose TiO2 treatment was associated with liver cell hydropic swelling and vacuolar
degeneration in young rats and vacuolar degeneration in adult rats, despite no particles being found
in the respective livers. Changes in serum liver and heart biomarkers suggested a more marked
response in young versus adult rats. It was confirmed the liver was the target organ for TiO2
nanoparticles.
60 day repeat dosing:
Cui et al. (2010) gavaged mice with 5, 10 and 50 mg/kg/d nano- TiO2 (average size 7 nm) every other
day for 60 days. Hepatocyte ultrastructure examination indicated slight mitochondria swelling (5
mg/kg/d), apoptotic cells with chromatin condensation (10 mg/kg/d), and apoptotic cells (50 mg/kg/d).
Gene expression analysis and biochemical measurements were typical of oxidative stress.
Hu et al. (2011) investigated the neurological effects of gavaging female mice with 5, 10, and 50
mg/kg/d nano-TiO2 (~6 nm) for 60 days. Ti content of mouse hippocampus significantly increased with
all doses, the high dose increasing the Ti level more than 100 fold higher than control animals.
Various methods, including TEM, showed cellular apoptosis in the hippocampus at 10 and 50 mg/kg/d.
Dose dependent decrements in spacing learning were demonstrated with the Y-maze.
90 day repeat dosing:
Cui et al. (2012) gavaged mice with 10 mg/kg TiO2 NPs (~200 – 300nm in hydroxypropyl
methylcellulose vehicle) for 90 days. There was titanium accumulation in the liver and TiO2 NP
aggregation in hepatocyte nuclei (TEM), an inflammatory response, hepatocyte apoptosis, and liver
inflammation with increases in serum levels of biomarkers of liver damage.
In a 90 day mouse gavage study (2.5, 5 and 10 mg/kg/d in 0.5% methyl cellulose) with nano- TiO2
(avg. size 5 -6 nm), Gui et al. (2011) found increased kidney Ti concentrations that may have been
the result of renal toxicity. The latter was identified biochemically and histologically (inflammation and
tubular cell necrosis). The authors surmised the administered TiO2 caused nephritic injury by
alteration of inflammatory cytokine expression contributing to the oxidative stress and inflammation
(Gui et al. 2013).

Page 99 of 106
References for Appendix A Azim, S. A. A., Darwish, H. A., Rizk, M. Z., Ali, S. A. and Kadry, M. O. (2015). Amelioration of titanium dioxide nanoparticles-induced liver injury in mice: Possible role of some antioxidants. Experimental and Toxicologic Pathology. 67: 305-314. Bu, Q., Yan, G., Deng, P., Peng, F., Lin, H., Xu, Y., Cao, Z., Zhou, T., Xue, A., Yanli, W., Cen, X. and Zhao, Y.-L. (2010). NMR-based metabonomic study of the sub-acute toxicity of titanium dioxide nanoparticles in rats after oral administration. Nanotechnology. 21: 125105. Cui, Y., Gong, X., Duan, Y., Li, N., Hu, R., Liu, H., Hong, M., Zhou, M., Wang, L., Wang, H. and Hong, F. (2010). Hepatocyte apoptosis and its molecular mechanisms in mice caused by titanium dioxide nanoparticles. Journal of Hazardous Materials. 183: 874-880. Cui, Y., Liu, H., Ze, Y., Zhang, Z., Hu, Y., Cheng, Z., Cheng, J., Hu, R., Gao, G., Wang, L., Tang, M. and Hong, F. (2012). Gene expression in liver injury caused by long-term exposure to titanium dioxide nanoparticles in mice. Toxicological Sciences. 128: 171-185. Duan, Y., Liu, J., Ma, L., Li, N., Liu, H., Wang, J., Zheng, L., Liu, C., Wang, X., Zhao, X., Yan, J., Wang, S., Wang, H., Zhang, X. and Hong, F. (2010). Toxicological characteristics of nanoparticulate anatase titanium dioxide in mice. Biomaterials. 31: 894-899. Gui, S., Zhang, Z., Zheng, L., Cui, Y., Liu, X., Li, N., Sang, X., Sun, Q., Gao, G., Cheng, Z., Cheng, J., Wang, L., Tang, M. and Hong, F. (2011). Molecular mechanism of kidney injury of mice caused by exposure to titanium dioxide nanoparticles. Journal of Hazardous Materials. 195: 365-370. Gui, S., Li, B., Zhao, X., Sheng, L., Hong, J., Yu, X., Sang, X., Sun, Q., Ze, Y., Wang, L. and Hong, F. (2013). Renal injury and Nrf2 modulation in mouse kidney following chronic exposure to TiO2 nanoparticles. Journal of Agricultural and Food Chemistry. 61: 8959-8968. Hu, R., Zheng, L., Zhang, T., Gao, G., Cui, Y., Cheng, Z., Cheng, J., Hong, M., Tang, M. and Hong, F. (2011). Molecular mechanism of hippocampal apoptosis of mice following exposure to titanium dioxide nanoparticles. Journal of Hazardous Materials. 191: 32-40. Mohammadipour, A., Fazel, A., Haghir, H., Motejaded, F., Rafatpanah, H., Zabihi, H., Hosseini, M. and Bideskan, A. E. (2014). Maternal exposure to titanium dioxide nanoparticles during pregnancy; impaired memory and decreased hippocampal cell proliferation in rat offspring. Environmental Toxicology and Pharmacology. 37: 617-625. Tassinari, R., Cubadda, F., Moracci, G., Aureli, F., D’Amato, M., Valeri, M., De Berardis, B., Raggi, A., Mantovani, A., Passeri, D., Rossi, M. and Maranghi, F. (2014). Oral, short-term exposure to titanium dioxide nanoparticles in Sprague-Dawley rat: focus on reproductive and endocrine systems and spleen. Nanotoxicology. 8: 654-662. Vasantharaja, D., Ramalingam, V. and Reddy, G. A. (2014). Oral toxic exposure of titanium dioxide nanoparticles on serum biochemical changes in adult male Wistar rats. Nanomedicine Journal. 2: 46-53.

Page 100 of 106
Wang, J., Zhou, G., Chen, C., Yu, H., Wang, T., Ma, Y., Jia, G., Gao, Y., Li, B., Sun, J., Li, Y., Jiao, F., Zhao, Y. and Chai, Z. (2007). Acute toxicity and biodistribution of different sized titanium dioxide particles in mice after oral administration. Toxicology Letters. 168: 176-185. Wang, Y., Chen, Z., Ba, T., Pu, J., Chen, T., Song, Y., Gu, Y., Qian, Q., Xu, Y., Xiang, K., Wang, H. and Jia, G. (2013). Susceptibility of young and adult rats to the oral toxicity of titanium dioxide nanoparticles. Small. 9: 1742-1752.

Page 101 of 106
Appendix B: Regulatory Aspects
Summary:
• No legislation specific to nanomaterials; nanomaterials managed under existing legislation.
• Food producers who intend to use nanomaterials must (as with other foods) ensure that they are safe and have no detrimental effect on
human health.
• Apart from the EU, none of the jurisdictions subject to this review currently have explicit requirements for reassessing listed food
additives which are nanoscale versions of approved macro-scale substances.
Jurisdiction Regulatory strategy for nanomaterials Reference Australia & New Zealand (Food Standards Australia New Zealand)
- Currently managed using existing food safety standards (Australia New Zealand Food Standards Code). - New foods manufactured using NT will undergo comprehensive safety
assessment, where there is no presumption or demonstration of safety. - New applications must provide information on particle size.
FSANZ 2013 Fletcher & Bartholomaeus 2011
European Union (European Commission, Parliament and Council) - Commission advised by European Food Safety Authority (EFSA), which provides guidance on risk assessment of NMs in food & conducts risk assessments at request of Commission.
- Managed using existing regulation, as well as amended legislation. (e.g. Novel Foods EC No 258/97, 178/2002, 1935/2004, 1907/2006,
1331/2008, 1169/2011; Directive 2000/13/EC, 2001/101/EC, 2003/89/EC)
- All new approvals based on toxicological evaluation of listed substances (includes NT).
- Existing food additives, changed to NM form or production process, must first be re-evaluated and re-approved before they can be added to food (i.e. a change to NM form is treated as a new substance).
- Nano-ingredients must be listed on label with the word ‘nano’.
BMELV 2013 Coles & Frewer 2013 Holmqvist 2014 EC 1997, 2000, 2002, 2003, 2004, 2006, 2008a, b, c; 2011 EFSA 2011, 2012
United States (Food and Drug Administration)
- Managed under existing regulation (Toxic Substances Control Act, Federal Food, Drug and Cosmetic Act).
- Review of new chemicals before they are commercialised (i.e. pre-
Alwood 2014 FDA 2011, 2014a, b, c
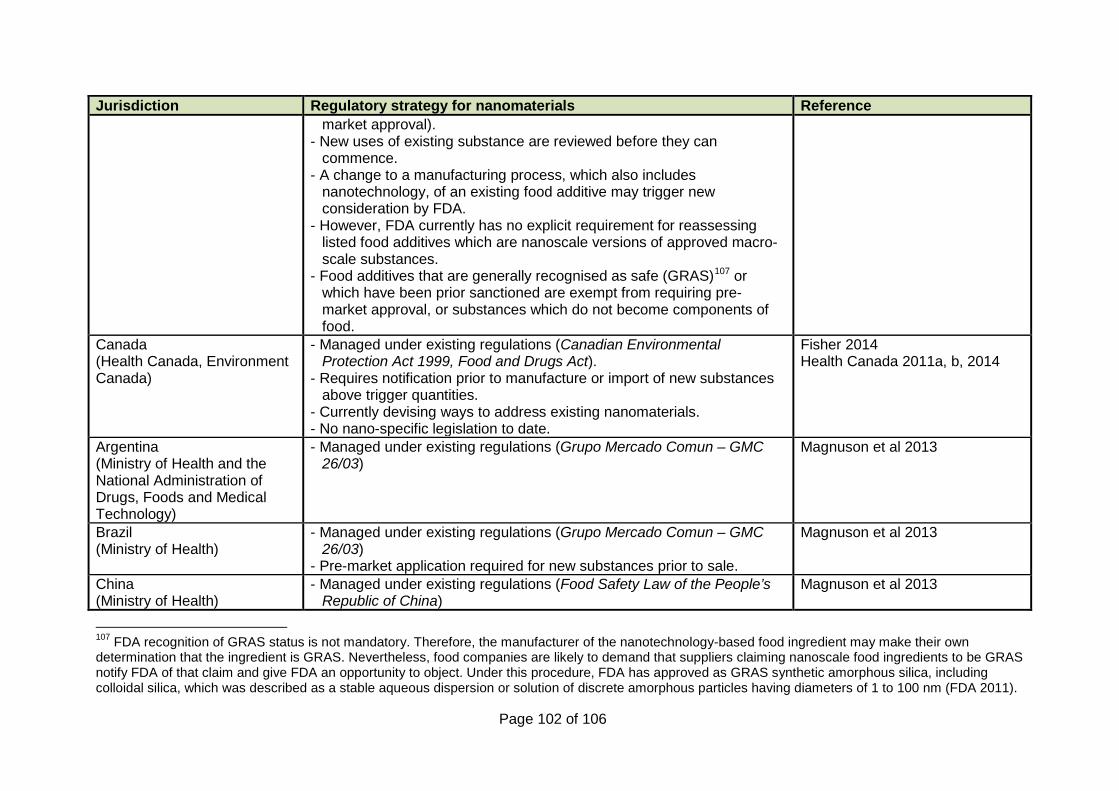
Page 102 of 106
Jurisdiction Regulatory strategy for nanomaterials Reference market approval).
- New uses of existing substance are reviewed before they can commence.
- A change to a manufacturing process, which also includes nanotechnology, of an existing food additive may trigger new consideration by FDA.
- However, FDA currently has no explicit requirement for reassessing listed food additives which are nanoscale versions of approved macro-scale substances.
- Food additives that are generally recognised as safe (GRAS)107 or which have been prior sanctioned are exempt from requiring pre-market approval, or substances which do not become components of food.
Canada (Health Canada, Environment Canada)
- Managed under existing regulations (Canadian Environmental Protection Act 1999, Food and Drugs Act).
- Requires notification prior to manufacture or import of new substances above trigger quantities.
- Currently devising ways to address existing nanomaterials. - No nano-specific legislation to date.
Fisher 2014 Health Canada 2011a, b, 2014
Argentina (Ministry of Health and the National Administration of Drugs, Foods and Medical Technology)
- Managed under existing regulations (Grupo Mercado Comun – GMC 26/03)
Magnuson et al 2013
Brazil (Ministry of Health)
- Managed under existing regulations (Grupo Mercado Comun – GMC 26/03)
- Pre-market application required for new substances prior to sale.
Magnuson et al 2013
China (Ministry of Health)
- Managed under existing regulations (Food Safety Law of the People’s Republic of China)
Magnuson et al 2013
107 FDA recognition of GRAS status is not mandatory. Therefore, the manufacturer of the nanotechnology-based food ingredient may make their own determination that the ingredient is GRAS. Nevertheless, food companies are likely to demand that suppliers claiming nanoscale food ingredients to be GRAS notify FDA of that claim and give FDA an opportunity to object. Under this procedure, FDA has approved as GRAS synthetic amorphous silica, including colloidal silica, which was described as a stable aqueous dispersion or solution of discrete amorphous particles having diameters of 1 to 100 nm (FDA 2011).

Page 103 of 106
Jurisdiction Regulatory strategy for nanomaterials Reference
Japan (Ministry of Health, Labour and Welfare)
- Managed under existing regulations (Food Sanitation Law)
Magnuson et al 2013
Mexico (Ministry of Health)
- Managed under existing regulations (General Health Law)
Magnuson et al 2013
International (Codex Alimentarius)
- Recommendations, not binding legislation. - Expert Meeting (FAO/WHO) concluded current risk assessment
approaches used in Codex are suitable for ENMs in food.
FAO/WHO 2009

Page 104 of 106
References for Appendix B Alwood, J. (2014). Assessment and management of nanomaterials under the Toxic Substances Control Act. Office of Pollution Prevention and Toxics. ECHA Topical Scientific Workshop on Regulatory Challenges in Risk Assessment of Nanomaterial. 22-23 October 2014. http://echa.europa.eu/documents/10162/5399565/2_alwood_ws_nanomaterials_en.pdf. BMELV (2013). Food safety strategies. Bundesministerium fuer Ernaehrung, Landwirtschaft und Verbraucherschutz (Federal Ministry of Food, Agriculture and Consumer Protection), Germany. http://www.bmel.de/SharedDocs/Downloads/EN/Publications/FoodSafetyStrategies.pdf?__blob=publicationFile. Coles, D. and Frewer, L. J. (2013). Nanotechnology applied to European food production – A review of ethical and regulatory issues. Trends in Food Science & Technology. 34: 32-43. EC (1997). Regulation (EC) No 258/97 of the European Parliament and of the Council of 27 January 1997 concerning novel foods and novel food ingredients. Official Journal of the European Communities. L43/1. http://eur-lex.europa.eu/legal-content/EN/TXT/PDF/?uri=CELEX:31997R0258&from=EN. EC (2000). Directive 2000/13/EC of the European Parliament and of the Council of 20 March 2000 on the approximation of the laws of the Member States relating to the labelling, presentation and advertising of foodstuffs. Official Journal of the European Communities. L109/29. http://eur-lex.europa.eu/LexUriServ/LexUriServ.do?uri=OJ:L:2000:109:0029:0042:EN:PDF. EC (2002). Regulation (EC) No 178/2002 of the European Parliament and of the Council of 28 January 2002 laying down the general principles and requirements of food law, establishing the European Food Safety Authority and laying down procedures in matters of food safety. Official Journal of the European Communities. L31/1. http://eur-lex.europa.eu/LexUriServ/LexUriServ.do?uri=OJ:L:2002:031:0001:0024:en:PDF. EC (2003). Directive 2003/89/EC of the European Parliament and of the Council of 10 November 2003 amending Directive 2000/13/EC as regards indication of the ingredients present in foodstuffs. Official Journal of the European Communities. L308/15. http://eur-lex.europa.eu/LexUriServ/LexUriServ.do?uri=OJ:L:2003:308:0015:0018:EN:PDF. EC (2004). Regulation (EC) No 1935/2004 of the European Parliament and of the Council of 27 October 2004 on materials and articles intended to come into contact with food and repealing Directives 80/590/EEC and 89/109/EEC. Official Journal of the European Union. L338/4. http://eur-lex.europa.eu/LexUriServ/LexUriServ.do?uri=OJ:L:2004:338:0004:0017:en:PDF. EC (2006). Regulation (EC) No 1907/2006 of the European Parliament and of the Council of 18 December 2006 concerning the Registration, Evaluation, Authorisation and Restriction of Chemicals (REACH), establishing a European Chemicals Agency, amending Directive 1999/45/EC and repealing Council Regulation (EEC) No 793/93 and Commission Regulation (EC) No 1488/94 as well as Council Directive 76/769/EEC and Commission Directives 91/155/EEC, 93/67/EEC, 93/105/EC and 2000/21/EC. Official Journal of the European Union. L396/1. http://eur-lex.europa.eu/legal-content/EN/TXT/PDF/?uri=CELEX:32006R1907&from=EN.

Page 105 of 106
EC (2008a). Communication from the Commission to the European Parliament, the Council and the European Economic and Social Committee. Regulatory aspects of nanomaterials. European Commission. Brussels, 17.6.2008. COM(2008) 366 final. http://ec.europa.eu/nanotechnology/pdf/comm_2008_0366_en.pdf. EC (2008b). Regulation (EC) No 1331/2008 of the European Parliament and of the Council of 16 December 2008 on establishing a common authorisation procedure for food additives, food enzymes and food flavourings. Official Journal of the European Union. L 354/1. http://eur-lex.europa.eu/LexUriServ/LexUriServ.do?uri=OJ:L:2008:354:0001:0006:EN:PDF. EC (2008c). Regulation (EC) No 1333/2008 of the European Parliament and of the Council of 16 December 2008 on food additives. Official Journal of the European Union. L 354/16. http://eur-lex.europa.eu/LexUriServ/LexUriServ.do?uri=OJ:L:2008:354:0016:0033:en:PDF. EC (2011). Regulation (EU) No 1169/2011 of the European Parliament and of the Council of 25 October 2011 on the provision of food information to consumer, amending Regulations (EC) No 1924/2006 and (EC) No 1925/2006 of the European Parliament and of the Council, and repealing Commission Directive 87/250/EEC, Council Directive 90/496/EEC, Commission Directive 1999/10/EC, Directive 2000/13/EC of the European Parliament and of the Council, Commission Directives 2002/67/EC and 2008/5/EC and Commission Regulation (EC) No 608/2004. Official Journal of the European Union. L 304/18. http://eur-lex.europa.eu/LexUriServ/LexUriServ.do?uri=OJ:L:2011:304:0018:0063:EN:PDF. EFSA (2011). Guidance on the risk assessment of the application of nanoscience and nanotechnologies in the food and feed chain. EFSA Scientific Committee. EFSA Journal. 9(5): 2140. http://www.efsa.europa.eu/en/efsajournal/doc/2140.pdf. EFSA (2012). Guidance for submission for food additive evaluations. EFSA Panel on Food Additives and Nutrient Sources added to Food (ANS). EFSA journal 2012: 10(7):2760. European Food Safety Authority. http://www.efsa.europa.eu/en/efsajournal/doc/2760.pdf. FAO/WHO (2009). FAO/WHO expert meeting on the application of nanotechnologies in the food and agriculture sectors: potential food safety implications. Food and Agriculture Organization of the United Nations and the World Health Organization. Available: http://www.worldvet.org/docs/FAO_WHO_Nano_Expert_Meeting_Report_Final.pdf. FDA (2011). FDA regulation of nanotechnology. Edited by Mark N Duvall and Kathleen Knight. December 2011. http://blog.verdantlaw.com/wp-content/uploads/2011/12/FDA-REGULATION-OF-NANOTECHNOLOGY-DOC1.pdf. FDA (2014a). FDA's approach to regulation of nanotechnology products. US Food and Drug Administration. [Accessed 16/01/2015]. http://www.fda.gov/ScienceResearch/SpecialTopics/Nanotechnology/ucm301114.htm. FDA (2014b). Guidance for industry: Assessing the effects of significant manufacturing process changes, including emerging technologies, on the safety and regulatory status of food ingredients and food contact substances including food ingredients that are color additives. US Food and Drug Administration. June 2014. http://www.fda.gov/downloads/cosmetics/guidancecomplianceregulatoryinformation/guidancedocuments/ucm300927.pdf. FDA (2014c). Guidance for industry: Considering whether an FDA-regulated product involves the application of nanotechnology. Food and Drug Administration. June 2014. http://www.fda.gov/downloads/regulatoryinformation/guidances/ucm401695.pdf.
Page 106 of 106
Fisher, B. (2014). Canada's experience with chemicals assessment and management and its application to nanomaterials. Environment Canada. ECHA Topical Scientific Workshop on Regulatory Challenges in Risk Assessment of Nanomaterial. 23 October 2014. http://echa.europa.eu/documents/10162/5399565/3_fisher_ws_nanomaterials_en.pdf. Fletcher, N. and Bartholomaeus, A. (2011). Regulation of nanotechnologies in food in Australia and New Zealand. International Food Risk Analysis Journal. 1: 33-40. FSANZ (2013). Application handbook. 1 September 2013 (amended 18 September 2013). Prepared by Food Standards Australia New Zealand. http://www.foodstandards.gov.au/code/changes/Documents/A-Handbook-1Sep2013.pdf. Health Canada (2011a). Nanotechnology-based health products and food. Health Canada. [Accessed 16/01/2015]. http://www.hc-sc.gc.ca/dhp-mps/nano-eng.php. Health Canada (2011b). Policy statement of Health Canada's working definition for nanomaterial. Health Canada. [Accessed 16/01/2015]. http://www.hc-sc.gc.ca/sr-sr/pubs/nano/pol-eng.php. Health Canada (2014). Science and Research: food and food packaging. Health Canada. http://www.hc-sc.gc.ca/sr-sr/tech/nanotech/food-alimentation-eng.php. Holmqvist, J. (2014). Nano challenges in the EU. European Chemicals Agency. ECHA Topical Scientific Workshop on Regulatory Challenges in Risk Assessment of Nanomaterial. 22-23 October 2014. http://echa.europa.eu/documents/10162/5399565/1_holmqvist_ws_nanomaterials_en.pdf. Magnuson, B., Munro, I., Abbot, P., Baldwin, N., Lopez-Garcia, R., Ly, K., McGirr, L., Roberts, A. and Socolovsky, S. (2013). Review of the regulation and safety assessment of food substances in various countries and jurisdictions. Food Additives & Contaminants: Part A. 30: 1147-1220.