powerpoint-presentation€¦ · 1.7 112 exploration assets oman block 3 & 4 34,610 30% cc...
TRANSCRIPT

Q3 2014 4 November 2014
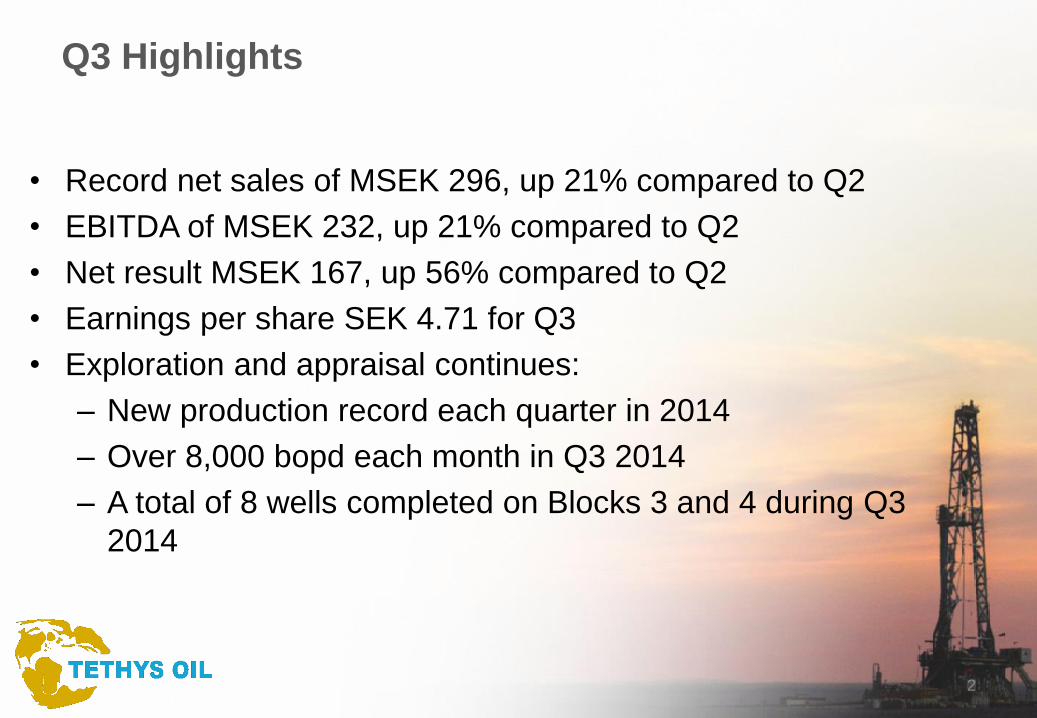
Q3 Highlights
• Record net sales of MSEK 296, up 21% compared to Q2
• EBITDA of MSEK 232, up 21% compared to Q2
• Net result MSEK 167, up 56% compared to Q2
• Earnings per share SEK 4.71 for Q3
• Exploration and appraisal continues:
– New production record each quarter in 2014
– Over 8,000 bopd each month in Q3 2014
– A total of 8 wells completed on Blocks 3 and 4 during Q3
2014
2

Tethys’ assets
Producing
Assets
Country Licence Area,
km2
Tethys
share
Partners* 2P reserves
31 Dec 2013
(mmbo)
Production
Q3 2014
(bopd)
Oman Block 3 & 4 34,610 30% CC Energy, Mitsui 15.2** 8,287
Lithuania Gargzdai 884 25% Odin Energi,
Geonafta
1.7 112
Exploration
assets
Oman Block 3 & 4 34,610 30% CC Energy, Mitsui
Oman Block 15 1,389 40% Odin Energy
Lithuania Rietavas 1,594 30% Odin Energi, Private
investors
Lithuania Raseiniai 1,535 30% Odin Energi, Private
investors
Other
assets
France Attila 1,986 40% Galli Coz
France Alès 215 37.5% Private investors
* Operator in bold
** Not including interim report of Lower Buah reserves as at 30 June 2014
3

Reserves Oman
(31 Dec 2013, mmbo)
1P 2P 3P
Farha South 8.9 11.7 13.5
Saiwan East 0.7 1.3 2.8
Area 4
(Lower Buah) 1.2 2.2 3.7
Total 10.8 15.2 20.0
Reserves Lithuania* (mmbo)
1P 2P 3P
Gargzdai 0.8 1.7 2.8
Reserves Independent petroleum consultant
DeGolyer and MacNaughton
(“D&M”) reviews Tethys Oil’s reserves in
Oman annually.
Following successful drilling during the
first six months of 2014 of the Lower
Buah reservoirs on Block 4, D&M has
delivered an interim report of Lower Buah
reserves as at 30 June 2014.
* As per reserve report 31 Dec 2012, by Miller and
Lents, Ltd., reduced with 2013 year’s production.
Development of the Lower Buah reserves
(30 Jun 2014, mmbo)
1P 2P 3P
Total 31 Dec 2013 1.2 2.2 3.7
Production from Lower
Buah 2014
-0.4 -0.4 -0.4
Revisions/discoveries 1.5 3.2 4.1
Total 30 Jun 2014 2.3 5.0 7.4
4

• Over 8,000 bopd each month in Q3-14
• 16% higher production in Oman compared with Q2-14
• Lithuanian production amounted to 112 bopd in Q3-14
Average daily production in Oman
5
8 239 8 221 8 404
0
1 000
2 000
3 000
4 000
5 000
6 000
7 000
8 000
9 000
July
Augu
st
Septe
mb
er
Octo
be
r
No
ve
mbe
r
De
ce
mbe
r
Janu
ari
Feb
ruary
Ma
rch
April
Ma
y
June
July
Augu
st
Septe
mb
er
Q3-13 Q4-13 Q1-14 Q2-14 Q3-14

6
• Total production in Q3 2014 highest ever
• 75% increase in average daily production compared with Q3-13
0
500
1 000
1 500
2 000
2 500
3 000
3 500
4 000
4 500
5 000
0
200 000
400 000
600 000
800 000
1 000 000
1 200 000
1 400 000
1 600 000
1 800 000
2011 2012 2013
Total production Ave daily production
Production
Barrels Barrels
0
1 000
2 000
3 000
4 000
5 000
6 000
7 000
8 000
9 000
0
100 000
200 000
300 000
400 000
500 000
600 000
700 000
800 000
900 000
Q3 2013 Q4 2013 Q1 2014 Q2 2014 Q3 2014
Total production Ave daily production

• Record net oil sales of 399,352 barrels
• Underlift position decreased with 2,917 bbl to 27,188 bbl from Q2-14
to Q3-14
Barrels Barrels
7
Sold barrels
147 228
776 248 850 926
0
100 000
200 000
300 000
400 000
500 000
600 000
700 000
800 000
900 000
2011 2012 2013
Sold volumes
Sold volumes
213 397
271 175
280 782
350 059
399 352
0
50 000
100 000
150 000
200 000
250 000
300 000
350 000
400 000
450 000
Q3 2014 Q4 2014 Q1 2014 Q2 2014 Q3 2014
Sold volumes
Sold volumes

• Net oil sales of MSEK 296 in Q3-14, up 21% compared to Q2-14
• The Q-o-Q sales increase is composed of 14% increase in barrels sold,
5% USD/SEK change and 2% oil price increase
MSEK MSEK
8
Sales MSEK
104
584 592
0
100
200
300
400
500
600
700
2011 2012 2013
Sales of oil and gas
142
193 195
245
296
0
50
100
150
200
250
300
350
Q3 2013 Q4 2013 Q1 2014 Q2 2014 Q3 2014
Sales of oil and gas
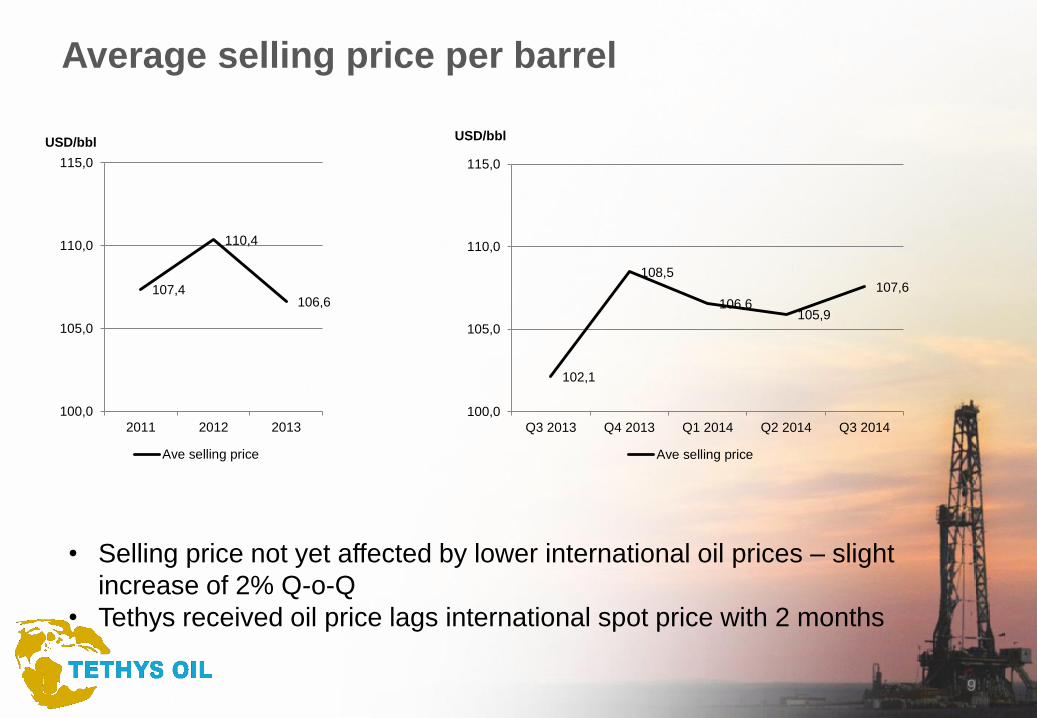
Average selling price per barrel
• Selling price not yet affected by lower international oil prices – slight
increase of 2% Q-o-Q
• Tethys received oil price lags international spot price with 2 months
USD/bbl
107,4
110,4
106,6
100,0
105,0
110,0
115,0
2011 2012 2013
Ave selling price
USD/bbl
9
102,1
108,5
106,6 105,9
107,6
100,0
105,0
110,0
115,0
Q3 2013 Q4 2013 Q1 2014 Q2 2014 Q3 2014
Ave selling price

EBITDA
• EBITDA of MSEK 232 in Q3, up 21% compared to Q2-14
• EBITDA margin the last five quarters has been in the range 67%-78%
10
MSEK MSEK
96
148
130
192
232
68%
77%
67%
78%
78%
60%
62%
64%
66%
68%
70%
72%
74%
76%
78%
80%
0
50
100
150
200
250
Q3 2013 Q4 2013 Q1 2014 Q2 2014 Q3 2014
EBITDA EBITDA Margin
84
509 479
553
0
100
200
300
400
500
600
2011 2012 2013 9M 2014
EBITDA

Expenses
• Operating expenses increased 24% compared with Q2-14, in line with
the sales development
• Opex in Q1-14 affected by late incoming expenses from 2013
• Most opex is fixed
MSEK MSEK
11
0
96
152
20
28
31
0
25
50
75
100
125
150
175
200
2011 2012 2013
Operating expenses Administrative expenses
42 37
59
46
57
6 8
6
8
8
0
10
20
30
40
50
60
70
Q3 2013 Q4 2013 Q1 2014 Q2 2014 Q3 2014
Operating expenses Administrative expenses

Adjusted net back and opex per barrel*
12 * After current government take
• Adjusted for timing differences, net back has been stable around
USD 40-45 per barrel last 5 quarters
• Adjusted opex between USD 10 and 15 per barrel, of which direct
lifting cost accounts for 50-60%
USD/bbl USD/bbl
11,9 14,1
45,5 41,3
0,0
10,0
20,0
30,0
40,0
50,0
60,0
70,0
2012 2013
Opex/bbl (USD/bbl) Netback (USD/bbl)
13,2 14,5 11,0 11,9 10,5
40,0 41,9
44,4 43,2 45,4
0,0
10,0
20,0
30,0
40,0
50,0
60,0
Q3 2013 Q4 2013 Q1 2014 Q2 2014 Q3 2014
Opex/bbl (USD/bbl) Netback (USD/bbl)

Net result after tax
• Result is up 56% Q-o-Q mainly due to strong sales development,
lower DD&A per barrel and significantly lower financial expenses
69
314
240
0
50
100
150
200
250
300
350
2011 2012 2013
Result for the period
13
MSEK MSEK
52 45
58
107
167
0
20
40
60
80
100
120
140
160
180
Q3 2013 Q4 2013 Q1 2014 Q2 2014 Q3 2014
Result for the period

Balance Sheet Q3 2014
• Strong cash position of MSEK 194
• The MUSD 100 senior revolving reserve based lending facility is not
used by the end of the third quarter
14
(MSEK) 2014-09-30 2014-06-30 2013-12-31
Cash 194 33 295
Long term debt 33* 30* 422
Net debt -161 -3 127
Total assets 1,619 1,367 1,563
Shareholders’ equity 1,547 1,284 1,100
* Provision for site restauration costs

• Majority of investments were development, appraisal and exploration of Blocks 3&4
• Given the below budget investments ( MSEK 164) in relation to full year budget on Blocks 3&4 (MSEK 400) so far during the nine months 2014, it is unlikely that the full budget amount will be invested during 2014
– some infrastructure investments have been pushed forward
– fewer wells due to changes to the drilling programme following new data
15
MSEK MSEK
Oil and gas investments
44
875
290
0
200
400
600
800
1000
2011 2012 2013
Oil and Gas Investments
59
73
45
79
44
0
10
20
30
40
50
60
70
80
90
Q3 2013 Q4 2013 Q1 2014 Q2 2014 Q3 2014
Oil and Gas Investments

Wells in Oman
• 8 wells drilled in Q3 2014, including, 2 production wells, 3 wells in
previously undrilled fault blocks, 1 appraisal well and 2 water source
wells
• Exploration well in eastern part of Block 4 completed after Q3
22
37 35
0
5
10
15
20
25
30
35
40
2011 2012 2013
Wells drilled
16
8
10
15
12
8
0
2
4
6
8
10
12
14
16
Q3 2013 Q4 2013 Q1 2014 Q2 2014 Q3 2014
Wells drilled

Current activities
17
• Drilling on Raseiniai license
in Lithuania later this year or
early next year
• Farha South water injection
programme nearing
completion
• Exploration/appraisal along
Farha trend
• Exploration well LE-1 in
eastern part of Block 4 under
evaluation
• Further appraisal of Lower
Buah reservoir section
• Central Block 4 seismic study
ongoing
Ongoing 3D
seismic
Ongoing
exploration well
B4EW7

18
Current operations
Lower Buah areas and Saiwan East field (Khufai)
Q3 2014 4 November 2014

Important notice
This presentation and the information contained herein is being presented by Tethys Oil AB (publ) (the “Company”). By attending a meeting where this
presentation is presented, or by reading this presentation, you agree to be bound by the following limitations and notifications.
This presentation does not constitute an offer or invitation to purchase or subscribe for any securities and does not constitute any form of commitment or
recommendation on the part of the Company.
This presentation does not purport to be all-inclusive or to contain all the information that prospective investors may desire in analysing and deciding
whether or not to hold or transact in the Company’s shares.
Recipients of this presentation must rely on their own examination of the legal, taxation, financial and other consequences of any possible holding or
transaction involving the Company’s shares or other securities, including the merits and risks involved. Recipients should not treat the contents of this
presentation as advice relating to legal, taxation or other matters and are advised to consult their own professional advisors concerning the acquisition,
holding or disposal of shares or other securities in the Company.
Certain information contained in this presentation has been obtained from published sources prepared by other parties that the Company has deemed to be
relevant. However, neither the Company nor any other person assumes any responsibility whatsoever and makes no representation or warranty, express
or implied, for the contents of this presentation, including its accuracy, completeness or verification for any other statement made or purported to be made
by any of them, or on their behalf. Nothing in this presentation is, or shall be relied upon as, a representation or promise made, whether as to the past,
present or future. Accordingly, no responsibility is accepted by the Company, its subsidiaries or associates or any of their directors, officers, employees or
agents, in respect thereof.
This presentation contains forward-looking statements that reflect the Company’s current views with respect to certain future events and potential financial
performance. Although the Company believes that the expectations reflected in such forward-looking statements are reasonable, no assurance can be
given that such expectations will materialise. Accordingly, results could differ materially from those set out in the forward-looking statements as a result of
various factors. To the extent that this presentation contains opinions, estimates, forecasts or other forward looking statements, no guarantees or
undertakings that these are correct or complete are given by the Company or any of its members, advisors, officers or employees or any other person.
Forecasts and assumptions which are subject to economic and competitive uncertainty are outside such person’s control and no guarantee can be given
that projected results will be achieved or that outcomes will correspond with forecasts. Information in this presentation may be changed, added to or
corrected without advance notification. The Company does not undertake any obligation to publicly update or revise any information contained herein.
This presentation as well as any other information provided by or on behalf of the Company shall be governed by Swedish law. Any dispute, controversy or
claim arising out of or in connection with such information or related matters shall be finally settled by arbitration in accordance with the Arbitration Rules of
the Arbitration Institute of the Stockholm Chamber of Commerce. The place of arbitration shall be Stockholm and the language to be used in the arbitration
proceedings shall be English.
IMPORTANT NOTICE
20