powerpoint presentation 15 february 2018. ... assets with life insurance policyholders’ own risk,...
TRANSCRIPT
2017 Annual Results
Translation of Investors’ Presentation
15 February 2018
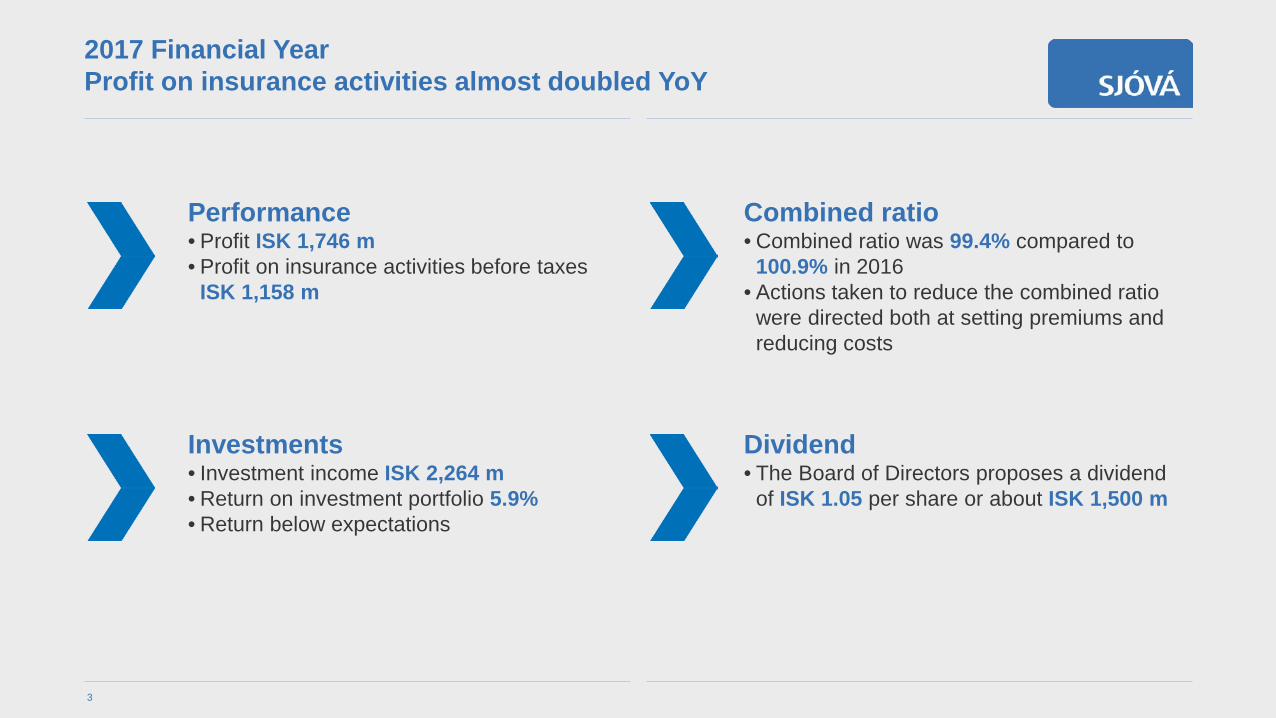
2017 Financial Year Profit on insurance activities almost doubled YoY
Combined ratio• Combined ratio was 99.4% compared to
100.9% in 2016• Actions taken to reduce the combined ratio
were directed both at setting premiums and reducing costs
Performance• Profit ISK 1,746 m • Profit on insurance activities before taxes
ISK 1,158 m
Dividend • The Board of Directors proposes a dividend
of ISK 1.05 per share or about ISK 1,500 m
Investments• Investment income ISK 2,264 m • Return on investment portfolio 5.9%• Return below expectations
3

Q4 in briefCore operations steadily improving
Combined ratio• Combined ratio was 99.6% compared to
100.1% in Q4 2016
Performance• Profit ISK 416 m• Profit on insurance activities before taxes ISK 274 m
Claims• Claims ratio 75.4%• Increasing average claim amount and claim
frequency account for the high claims ratio
Investments• Investment income ISK 649 m • Return on portfolio 1.7%
4
10,2%
26,6%
Annualised return on equity
4F 2017 4F 2016
1,641,48
SCR solvency margin
31.12.2017 30.9.2017
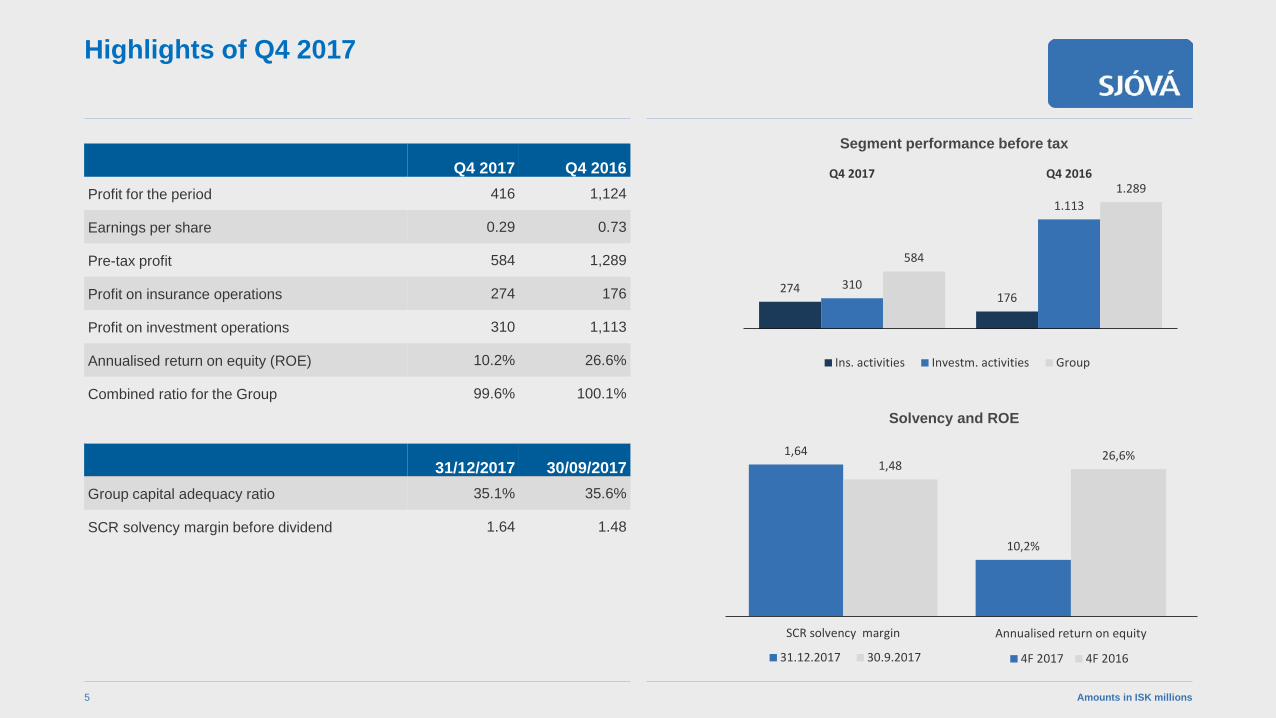
Q4 2017 Q4 2016Profit for the period 416 1,124
Earnings per share 0.29 0.73
Pre-tax profit 584 1,289
Profit on insurance operations 274 176
Profit on investment operations 310 1,113
Annualised return on equity (ROE) 10.2% 26.6%
Combined ratio for the Group 99.6% 100.1%
31/12/2017 30/09/2017Group capital adequacy ratio 35.1% 35.6%
SCR solvency margin before dividend 1.64 1.48
Highlights of Q4 2017
Amounts in ISK millions5
Solvency and ROE
Segment performance before tax
274176
310
1.113
584
1.289Q4 2017 Q4 2016
Ins. activities Investm. activities Group
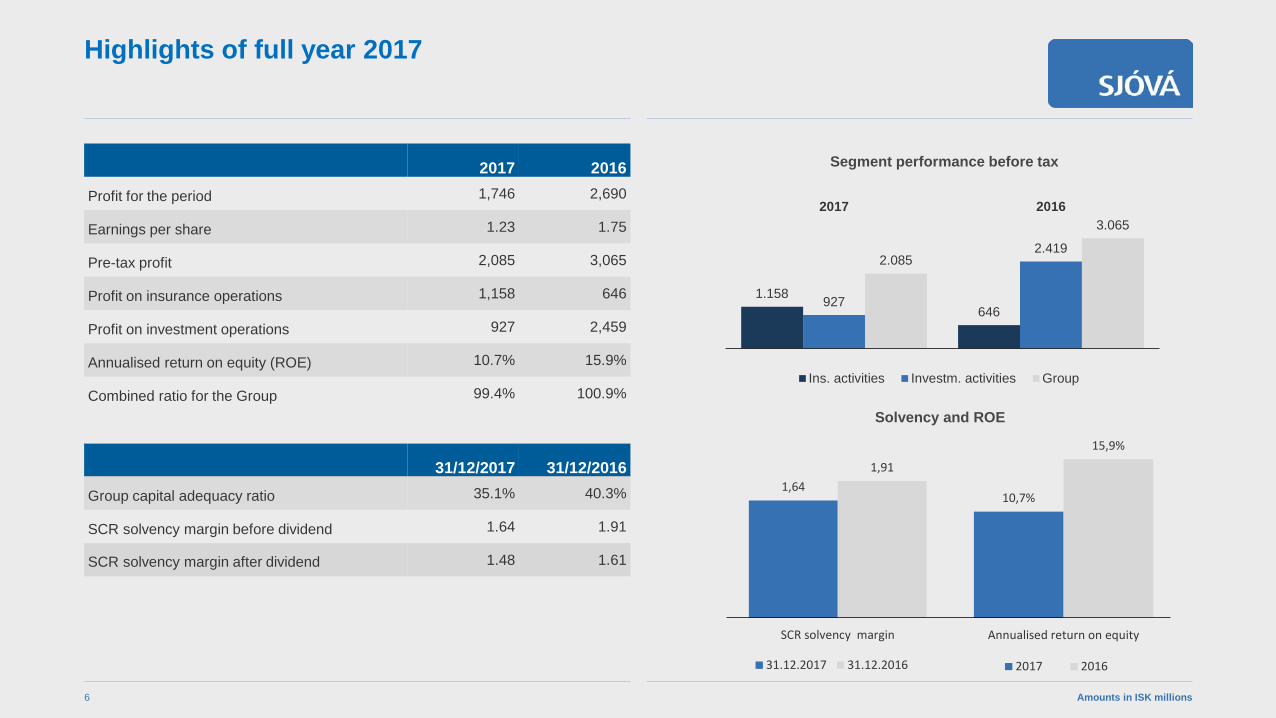
10,7%
15,9%
Annualised return on equity
2017 2016
1,641,91
SCR solvency margin
31.12.2017 31.12.2016
2017 2016Profit for the period 1,746 2,690
Earnings per share 1.23 1.75
Pre-tax profit 2,085 3,065
Profit on insurance operations 1,158 646
Profit on investment operations 927 2,459
Annualised return on equity (ROE) 10.7% 15.9%
Combined ratio for the Group 99.4% 100.9%
31/12/2017 31/12/2016Group capital adequacy ratio 35.1% 40.3%
SCR solvency margin before dividend 1.64 1.91
SCR solvency margin after dividend 1.48 1.61
Highlights of full year 2017
Amounts in ISK millions6
Solvency and ROE
Segment performance before tax
1.158646
927
2.4192.085
3.0652017 2016
Ins. activities Investm. activities Group

Income statementHealthy premium growth and cost restraint
Amounts in ISK millions7
Q4 2017 Q4 2016 % 12M 2017 12M 2016 %Premiums earned 4,211 4,051 3.9% 16,383 15,399 6.4%Earned premiums, net of reinsurance 3,997 3,841 4.0% 15,539 14,488 7.3%Investment income 649 1,359 -52.2% 2,264 3,434 -34.1%Total income 4,691 5,243 -10.5% 17,876 18,072 -1.1%Claims during the period -3,177 -3,008 5.6% -12,160 -11,259 8.0%Claims incurred, net of reinsurance -3,096 -2,999 3.2% -11,901 -11,261 5.7%Operating expenses -1,010 -964 4.7% -3,889 -3,746 3.8%Total expenses -4,107 -3,964 3.6% -15,790 -15,007 5.2%Pre-tax profit 584 1,279 -54.3% 2,085 3,065 -32.0%After-tax profit 416 1,123 -63.0% 1,746 2,690 -35.1%
Claims ratio 75.4% 74.2% 74.2% 73.1%
Reinsurance ratio 2.1% 3.9% 3.1% 5.0%
Claims and reinsurance ratio 77.5% 78.2% 77.4% 78.1%Cost-income ratio 22.1% 22.0% 22.1% 22.8%Combined ratio 99.6% 100.1% 99.4% 100.9%

Investment income declined YoY while core operations improved
8
1.124
416
157
710
97 46
Q4 2016result
Premiumsearned
Inv. Income Claims netof reins.
Expenses Taxes Q4 2017result
Bridge analysis Q4 2016 to Q4 2017
2.690
1.746
974 1.170
640
183
2016 12Mresult
Premiumsearned
Inv. Income Claims netof reins.
Expenses Taxes 2017 12Mresult
Bridge analysis 2016 to 2017
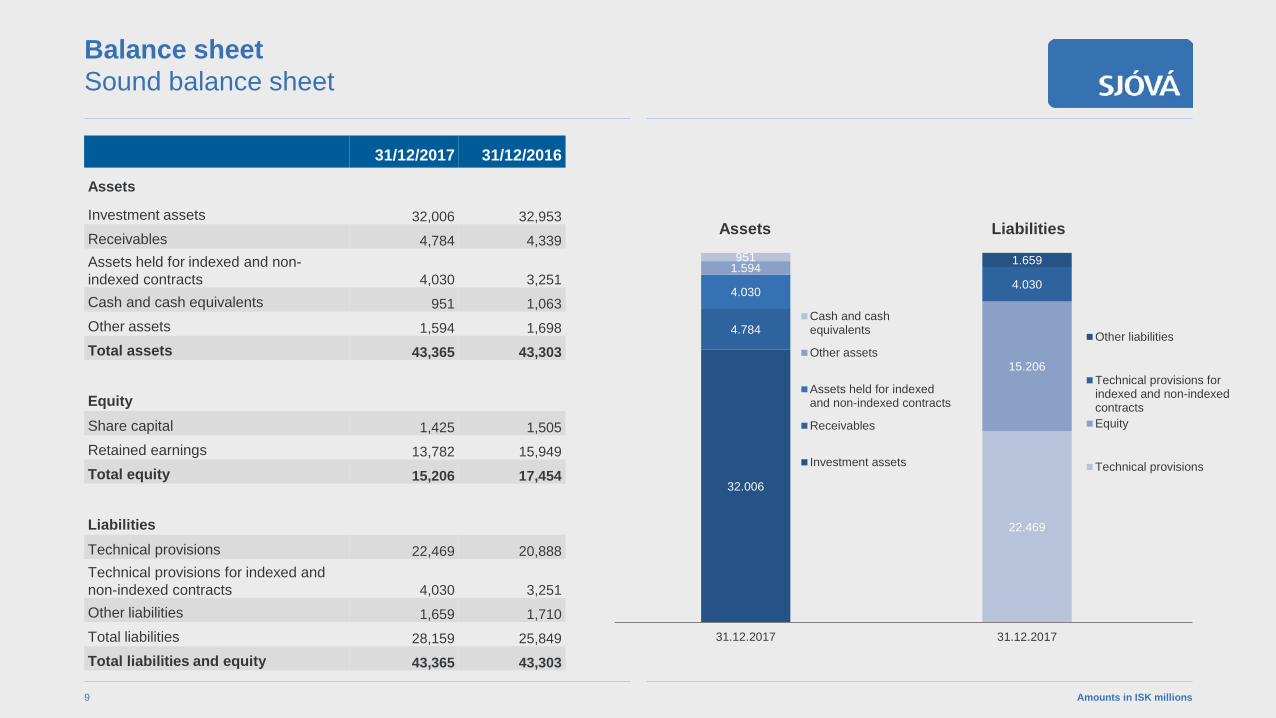
22.469
15.206
4.030
1.659
31.12.2017
Other liabilities
Technical provisions forindexed and non-indexedcontractsEquity
Technical provisions32.006
4.784
4.030
1.594951
31.12.2017
Cash and cashequivalents
Other assets
Assets held for indexedand non-indexed contracts
Receivables
Investment assets
Balance sheetSound balance sheet
Amounts in ISK millions9
31/12/2017 31/12/2016
Assets
Investment assets 32,006 32,953Receivables 4,784 4,339Assets held for indexed and non-indexed contracts 4,030 3,251Cash and cash equivalents 951 1,063Other assets 1,594 1,698Total assets 43,365 43,303
Equity Share capital 1,425 1,505Retained earnings 13,782 15,949Total equity 15,206 17,454
LiabilitiesTechnical provisions 22,469 20,888Technical provisions for indexed and non-indexed contracts 4,030 3,251Other liabilities 1,659 1,710Total liabilities 28,159 25,849Total liabilities and equity 43,365 43,303
Assets Liabilities
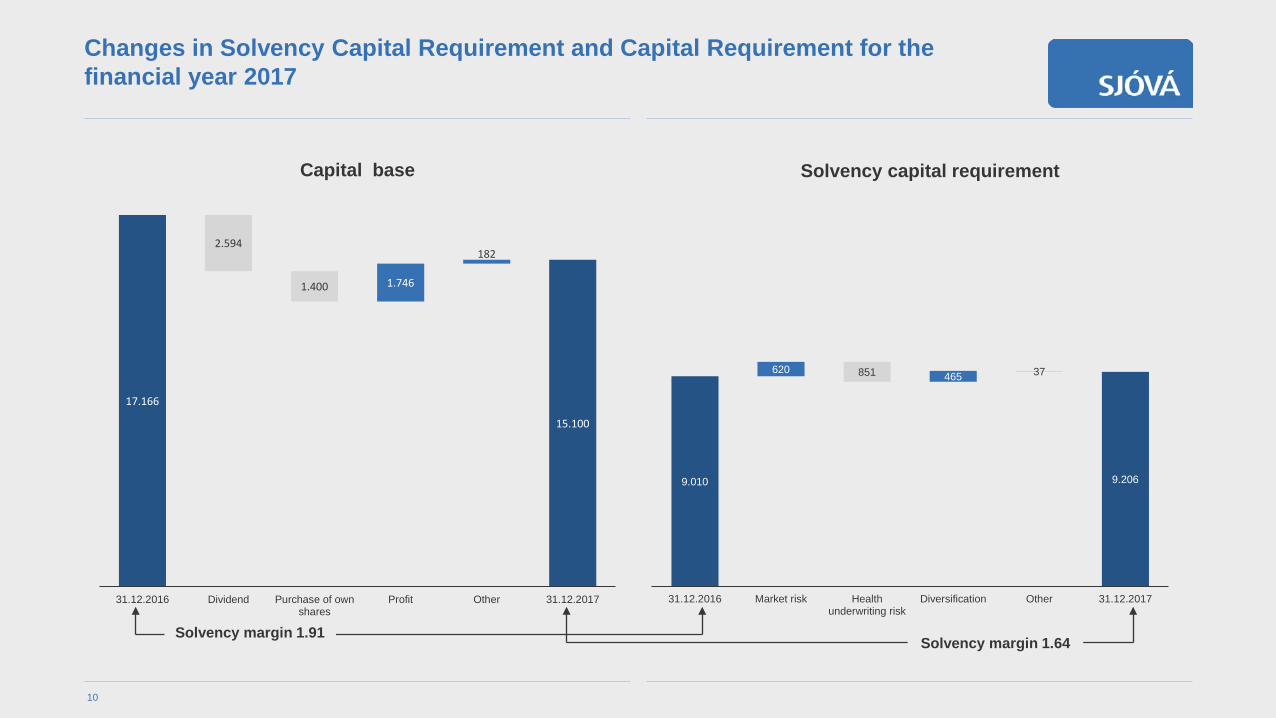
9.010 9.206
620 465851 37
31.12.2016 Market risk Healthunderwriting risk
Diversification Other 31.12.2017
Solvency capital requirement
17.166
15.100
1.746
1822.594
1.400
31.12.2016 Dividend Purchase of ownshares
Profit Other 31.12.2017
Capital base
Changes in Solvency Capital Requirement and Capital Requirement for the financial year 2017
10
Solvency margin 1.91Solvency margin 1.64
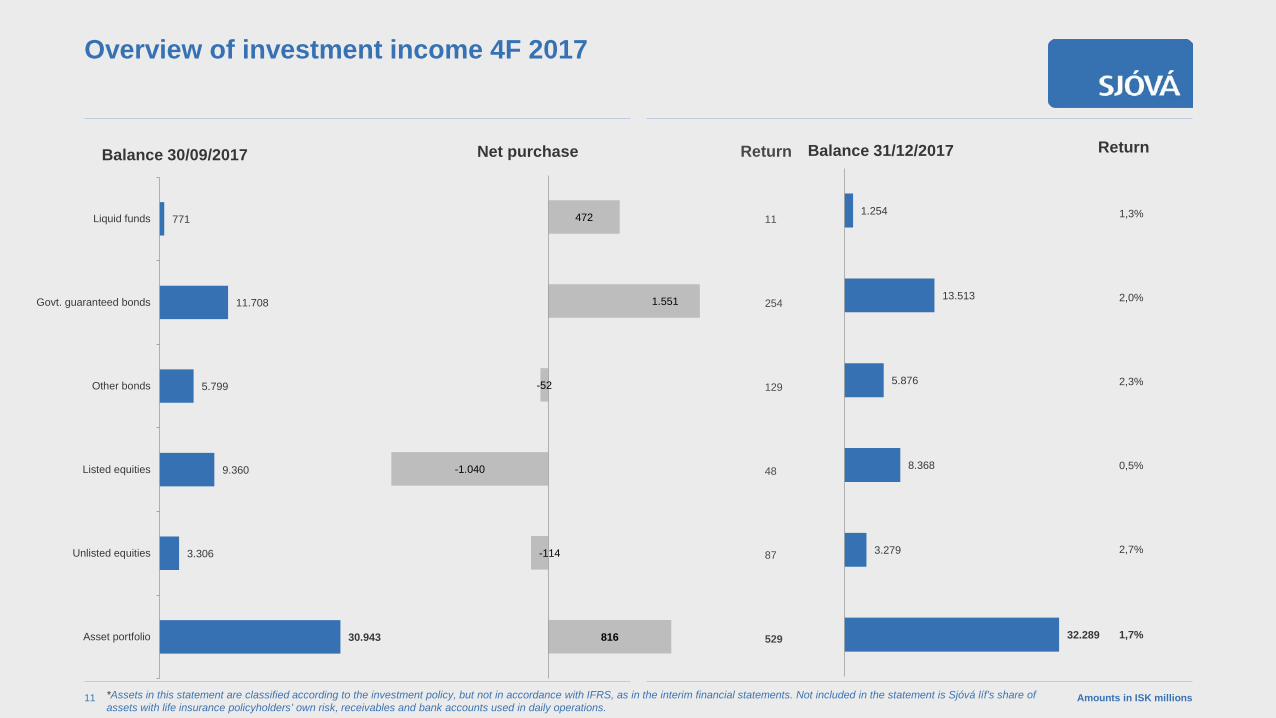
Overview of investment income 4F 2017
Amounts in ISK millions11 *Assets in this statement are classified according to the investment policy, but not in accordance with IFRS, as in the interim financial statements. Not included in the statement is Sjóvá líf’s share of assets with life insurance policyholders’ own risk, receivables and bank accounts used in daily operations.
1,3%
2,0%
2,3%
0,5%
2,7%
1,7%
Return
1.254
13.513
5.876
8.368
3.279
32.289
Balance 31/12/2017
472
1.551
-52
-1.040
-114
816
Net purchase
771
11.708
5.799
9.360
3.306
30.943
Liquid funds
Govt. guaranteed bonds
Other bonds
Listed equities
Unlisted equities
Asset portfolio
Balance 30/09/2017
11
254
129
48
87
529
Return
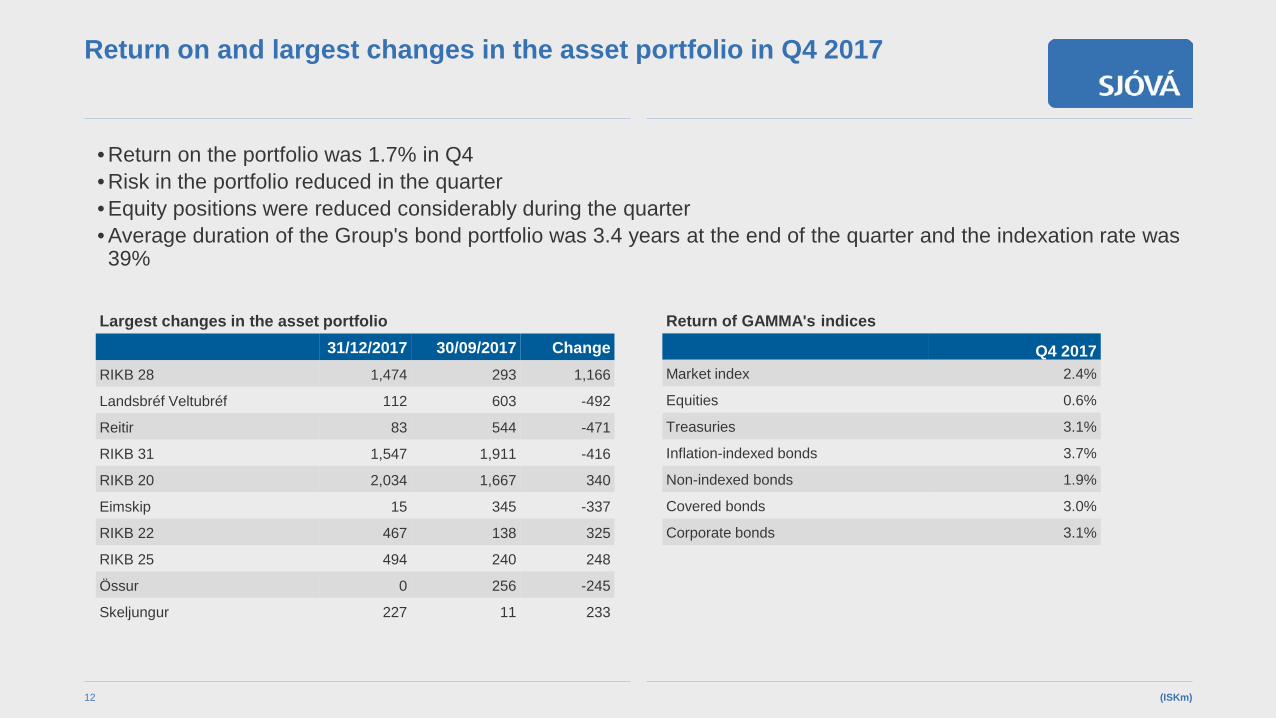
Return on and largest changes in the asset portfolio in Q4 2017
• Return on the portfolio was 1.7% in Q4 • Risk in the portfolio reduced in the quarter • Equity positions were reduced considerably during the quarter• Average duration of the Group's bond portfolio was 3.4 years at the end of the quarter and the indexation rate was 39%
(ISKm)12
Largest changes in the asset portfolio 31/12/2017 30/09/2017 Change
RIKB 28 1,474 293 1,166
Landsbréf Veltubréf 112 603 -492
Reitir 83 544 -471
RIKB 31 1,547 1,911 -416
RIKB 20 2,034 1,667 340
Eimskip 15 345 -337
RIKB 22 467 138 325
RIKB 25 494 240 248
Össur 0 256 -245
Skeljungur 227 11 233
Return of GAMMA's indices
Q4 2017Market index 2.4%
Equities 0.6%
Treasuries 3.1%
Inflation-indexed bonds 3.7%
Non-indexed bonds 1.9%
Covered bonds 3.0%
Corporate bonds 3.1%
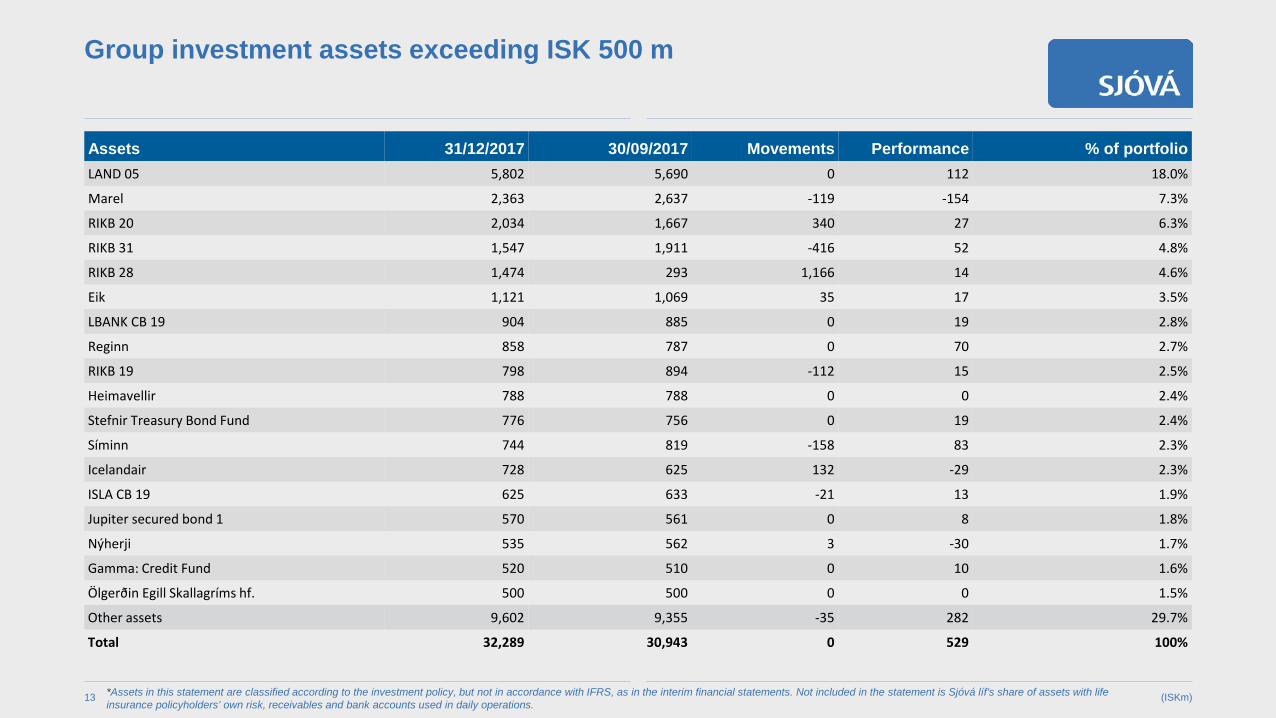
Group investment assets exceeding ISK 500 m
(ISKm)13
Assets 31/12/2017 30/09/2017 Movements Performance % of portfolioLAND 05 5,802 5,690 0 112 18.0%
Marel 2,363 2,637 -119 -154 7.3%
RIKB 20 2,034 1,667 340 27 6.3%
RIKB 31 1,547 1,911 -416 52 4.8%
RIKB 28 1,474 293 1,166 14 4.6%
Eik 1,121 1,069 35 17 3.5%
LBANK CB 19 904 885 0 19 2.8%
Reginn 858 787 0 70 2.7%
RIKB 19 798 894 -112 15 2.5%
Heimavellir 788 788 0 0 2.4%
Stefnir Treasury Bond Fund 776 756 0 19 2.4%
Síminn 744 819 -158 83 2.3%
Icelandair 728 625 132 -29 2.3%
ISLA CB 19 625 633 -21 13 1.9%
Jupiter secured bond 1 570 561 0 8 1.8%
Nýherji 535 562 3 -30 1.7%
Gamma: Credit Fund 520 510 0 10 1.6%
Ölgerðin Egill Skallagríms hf. 500 500 0 0 1.5%
Other assets 9,602 9,355 -35 282 29.7%
Total 32,289 30,943 0 529 100%
*Assets in this statement are classified according to the investment policy, but not in accordance with IFRS, as in the interim financial statements. Not included in the statement is Sjóvá líf’s share of assets with life insurance policyholders’ own risk, receivables and bank accounts used in daily operations.
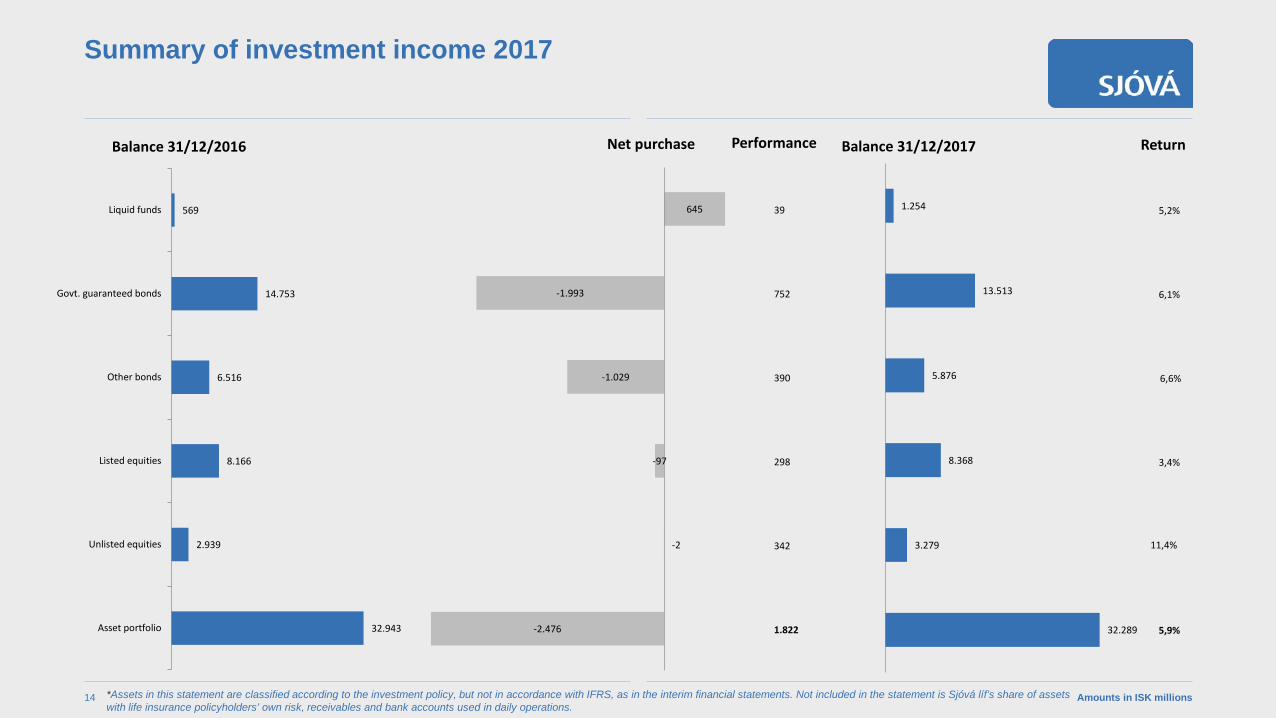
Summary of investment income 2017
Amounts in ISK millions14 *Assets in this statement are classified according to the investment policy, but not in accordance with IFRS, as in the interim financial statements. Not included in the statement is Sjóvá líf’s share of assets with life insurance policyholders’ own risk, receivables and bank accounts used in daily operations.
1.254
13.513
5.876
8.368
3.279
32.289
Balance 31/12/2017
645
-1.993
-1.029
-97
-2
-2.476
Net purchase
569
14.753
6.516
8.166
2.939
32.943
Liquid funds
Govt. guaranteed bonds
Other bonds
Listed equities
Unlisted equities
Asset portfolio
Balance 31/12/2016
5,2%
6,1%
6,6%
3,4%
11,4%
5,9%
Return
39
752
390
298
342
1.822
Performance
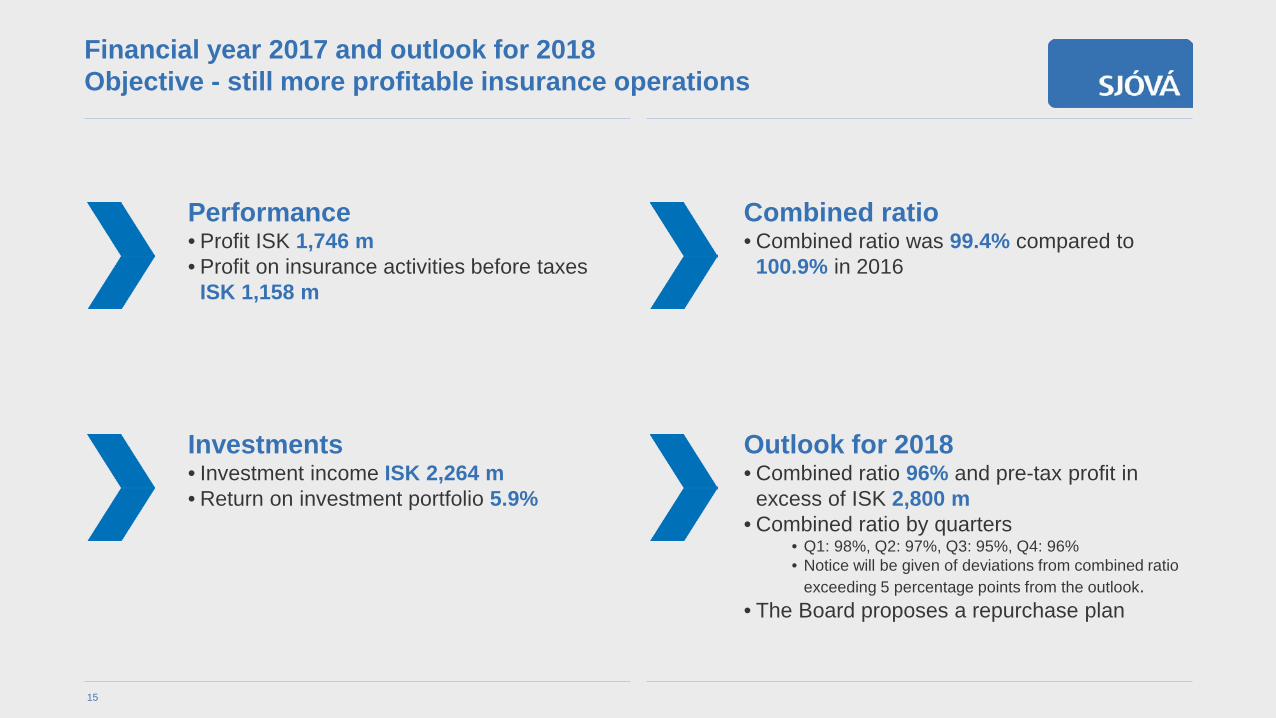
Financial year 2017 and outlook for 2018Objective - still more profitable insurance operations
Combined ratio• Combined ratio was 99.4% compared to
100.9% in 2016
Performance• Profit ISK 1,746 m • Profit on insurance activities before taxes
ISK 1,158 m
Outlook for 2018• Combined ratio 96% and pre-tax profit in
excess of ISK 2,800 m• Combined ratio by quarters
• Q1: 98%, Q2: 97%, Q3: 95%, Q4: 96%• Notice will be given of deviations from combined ratio
exceeding 5 percentage points from the outlook. • The Board proposes a repurchase plan
Investments• Investment income ISK 2,264 m • Return on investment portfolio 5.9%
15

Questions

Investors’ Presentation
Appendices and Disclaimer
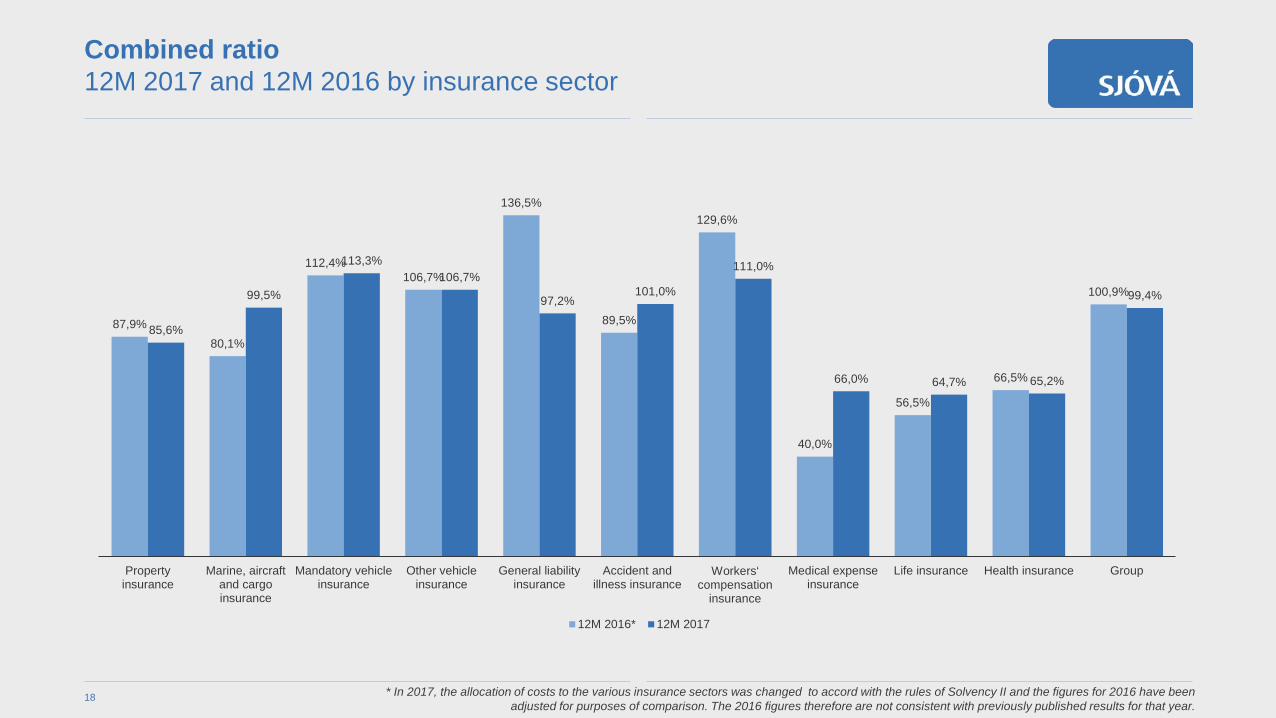
Combined ratio 12M 2017 and 12M 2016 by insurance sector
18 * In 2017, the allocation of costs to the various insurance sectors was changed to accord with the rules of Solvency II and the figures for 2016 have been adjusted for purposes of comparison. The 2016 figures therefore are not consistent with previously published results for that year.
87,9%80,1%
112,4%106,7%
136,5%
89,5%
129,6%
40,0%
56,5%
66,5%
100,9%
85,6%
99,5%
113,3%106,7%
97,2%101,0%
111,0%
66,0% 64,7% 65,2%
99,4%
Propertyinsurance
Marine, aircraftand cargoinsurance
Mandatory vehicleinsurance
Other vehicleinsurance
General liabilityinsurance
Accident andillness insurance
Workers‘ compensation
insurance
Medical expenseinsurance
Life insurance Health insurance Group
12M 2016* 12M 2017
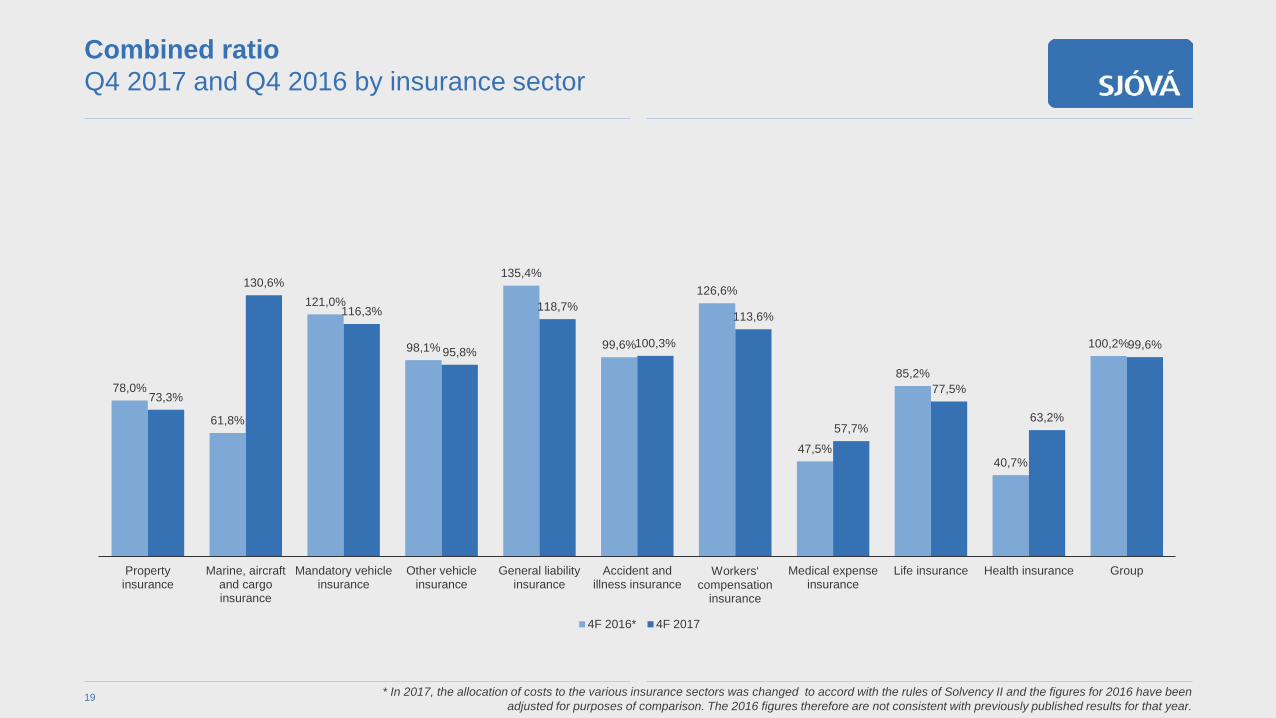
Combined ratio Q4 2017 and Q4 2016 by insurance sector
19 * In 2017, the allocation of costs to the various insurance sectors was changed to accord with the rules of Solvency II and the figures for 2016 have been adjusted for purposes of comparison. The 2016 figures therefore are not consistent with previously published results for that year.
78,0%
61,8%
121,0%
98,1%
135,4%
99,6%
126,6%
47,5%
85,2%
40,7%
100,2%
73,3%
130,6%
116,3%
95,8%
118,7%
100,3%
113,6%
57,7%
77,5%
63,2%
99,6%
Propertyinsurance
Marine, aircraftand cargoinsurance
Mandatory vehicleinsurance
Other vehicleinsurance
General liabilityinsurance
Accident andillness insurance
Workers‘ compensation
insurance
Medical expenseinsurance
Life insurance Health insurance Group
4F 2016* 4F 2017
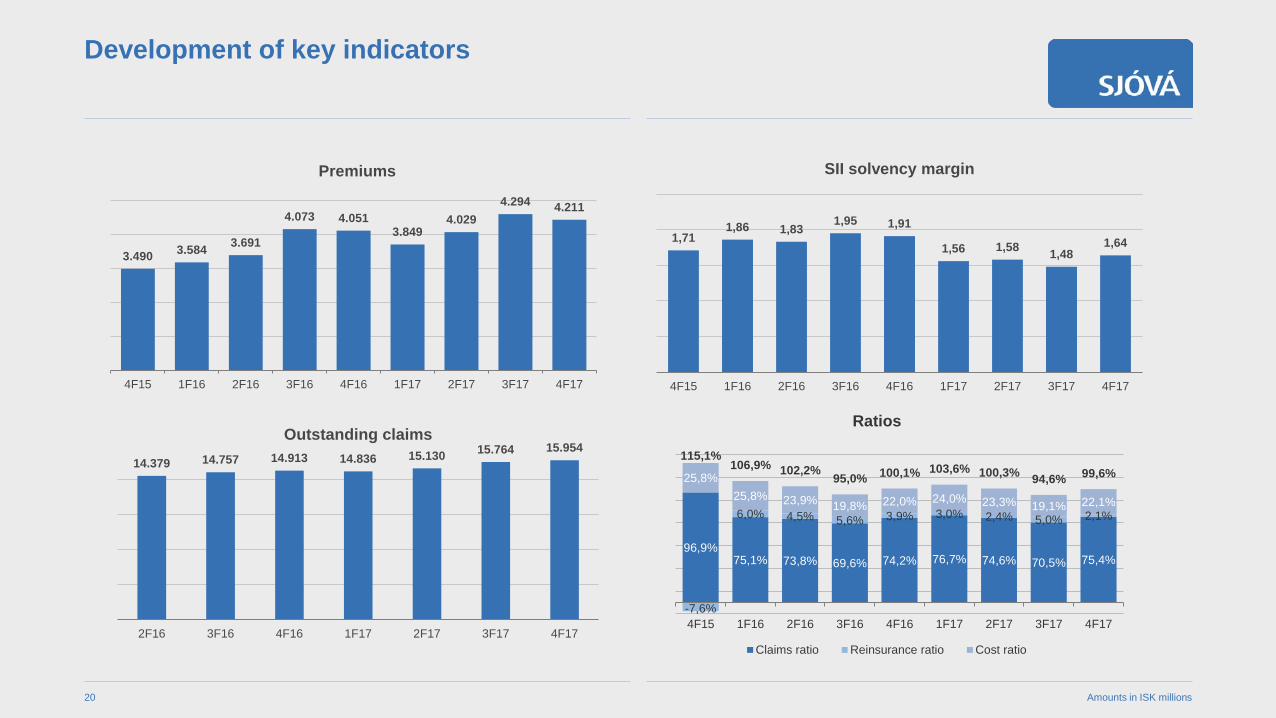
Development of key indicators
Amounts in ISK millions20
3.490 3.584 3.691
4.073 4.0513.849
4.0294.294 4.211
4F15 1F16 2F16 3F16 4F16 1F17 2F17 3F17 4F17
Premiums
14.379 14.757 14.913 14.836 15.130 15.764 15.954
2F16 3F16 4F16 1F17 2F17 3F17 4F17
Outstanding claims
1,711,86 1,83 1,95 1,91
1,56 1,58 1,481,64
4F15 1F16 2F16 3F16 4F16 1F17 2F17 3F17 4F17
SII solvency margin
96,9%75,1% 73,8% 69,6% 74,2% 76,7% 74,6% 70,5% 75,4%
-7,6%
6,0% 4,5% 5,6% 3,9% 3,0% 2,4% 5,0% 2,1%
25,8%25,8% 23,9% 19,8% 22,0% 24,0% 23,3% 19,1% 22,1%
115,1%106,9% 102,2% 95,0% 100,1% 103,6% 100,3% 94,6% 99,6%
4F15 1F16 2F16 3F16 4F16 1F17 2F17 3F17 4F17
Ratios
Claims ratio Reinsurance ratio Cost ratio

Development of key indicators in recent quarters
(ISKm)21
Q4 2017 Q3 2017 Q2 2017 Q1 2017 Q4 2016 Q3 2016 Q2 2016 Q1 2016 Q4 2015
Premiums earned 4,211 4,294 4,029 3,849 4,051 4,073 3,691 3,584 3,490
Earned premiums, net of reinsurance 3,997 4,058 3,815 3,669 3,841 3,761 3,482 3,403 3,263
Investment income 649 -619 870 1,364 1,359 789 578 709 1,207
Total income 4,691 3,447 4,689 5,050 5,243 4,642 4,064 4,123 4,477
Claims during the period -3,177 -3,028 -3,004 -2,951 -3,008 -2,836 -2,723 -2,692 -3,381
Claims incurred, net of reinsurance -3,096 -3,013 -2,890 -2,902 -2,999 -2,843 -2,684 -2,735 -2,897
Operating expenses on insurance operations -931 -819 -941 -924 -892 -808 -882 -925 -871
Total expenses -4,107 -3,894 -3,900 -3,890 -3,964 -3,710 -3,606 -3,727 -7,254
After-tax profit 416 -472 702 1,100 1,124 858 286 423 -2,016
Total assets 43,977 43,609 44,466 44,314 43,303 43,956 43,413 43,185 41,435
Securities 36,649 35,187 35,540 34,465 36,204 34,649 34,403 33,400 33,785
Cash and cash equivalents 951 930 797 1,300 1,063 1,882 1,211 1,554 1,385
Equity 15,206 14,899 15,832 15,472 17,454 16,900 16,197 15,940 16,291
Technical provisions 22,469 23,254 23,306 23,335 20,888 21,828 21,992 22,297 20,153
Claims ratio 75.4% 70.5% 74.6% 76.7% 74.2% 69.6% 73.8% 75.11% 96.9%
Reinsurance ratio 2.1% 5.0% 2.4% 3.0% 3.9% 5.6% 4.5% 6.0% -7.6%
Cost-income ratio 22.1% 19.1% 23.3% 24.0% 22.0% 19.8% 23.9% 25.8% 25.8%
Combined ratio 99.6% 94.6% 100.3% 103.6% 100.1% 95.0% 102.1% 106.9% 115.2%
Return on equity (ROE) 10.2% -12.7% 16.9% 26.7% 26.6% 20.7% 7.0% 10.5% -23.2%
Adjusted ROE 10.2% -12.7% 16.9% 26.7% 26.6% 20.7% 7.0% 10.5% 15.8%
SII solvency margin 1.64 1.48 1.58 1.56 1.91 1.95 1.93 1.83 1.86
Solvency margin of parent company SI

Distribution of shareholdings1,266 shareholders as of 11 February 2018
47,3%
29,8%
12,3%
4,3%2,0% 4,4%
Shareholding
Pension funds
Individuals and corporates
Foreign funds
Domestic funds
Financial undertakings
Own shares
13%
66%
87%
97%100%
1 10 20 50 1.242Number of shareholders
Cumulative shareholdings
22
Disclaimer
Although every effort is made to ensure accuracy, in the case of any inconsistencies between the Icelandic and English versions of thecompany's announcement of results, please note that it is the Icelandic original which is authentic and valid and all Englishannouncements and presentations are translations provided as assistance for investors and other users.
The information in this presentation is based on sources that Sjóvá believes to be reliable at present but can not be guaranteed to be free of errors. All information in this presentation is the property of Sjóvá. Neither information contained therein nor the entire presentation may be reproduced, modified or distributed in any manner, in whole or in part.
This presentation is intended solely for information purposes. It is not in any respect intended to imply a promise or advice nor to serve by any means as the basis for decision-making by persons who may receive it. Many different factors may cause the picture presented in the presentation of the company’s situation and future prospects to change significantly. These include, but are not limited to, general economic developments, claims developments, changes in the competitive environment, reinsurance markets or financialmarkets, legislative changes and changes in judicial practice. Should any of these risks factors or uncertainties materialise, or should the underlying management assumptions concerning the future prove incorrect, this could result in significant deviations in the company's financial position and performance in its operations as described in this presentation.
Sjóvá emphasises that statements contained in this presentation are valid only at the time of the presentation and their value is limited to what is stated in this disclaimer. Sjóvá is not obliged to update in any manner management opinions concerning the company's future outlook, which may appear in this presentation, nor issue corrections to errors or inaccurate information, which may subsequently be revealed, unless required by law. In receiving this presentation, the person agrees to be bound by the foregoing reservations and restrictions.
23