preassessment screen for the sheboygan river and … screen for the sheboygan river ... to the...
TRANSCRIPT

Preassessment Screen
for the
Sheboygan River and Harbor
Prepared by
U.S. Department of Commerce (National Oceanic and Atmospheric Administration) U.S. Department of the Interior (Fish and Wildlife Service)
Wisconsin Department of Natural Resources
May 24, 2012
May 24, 2012
2
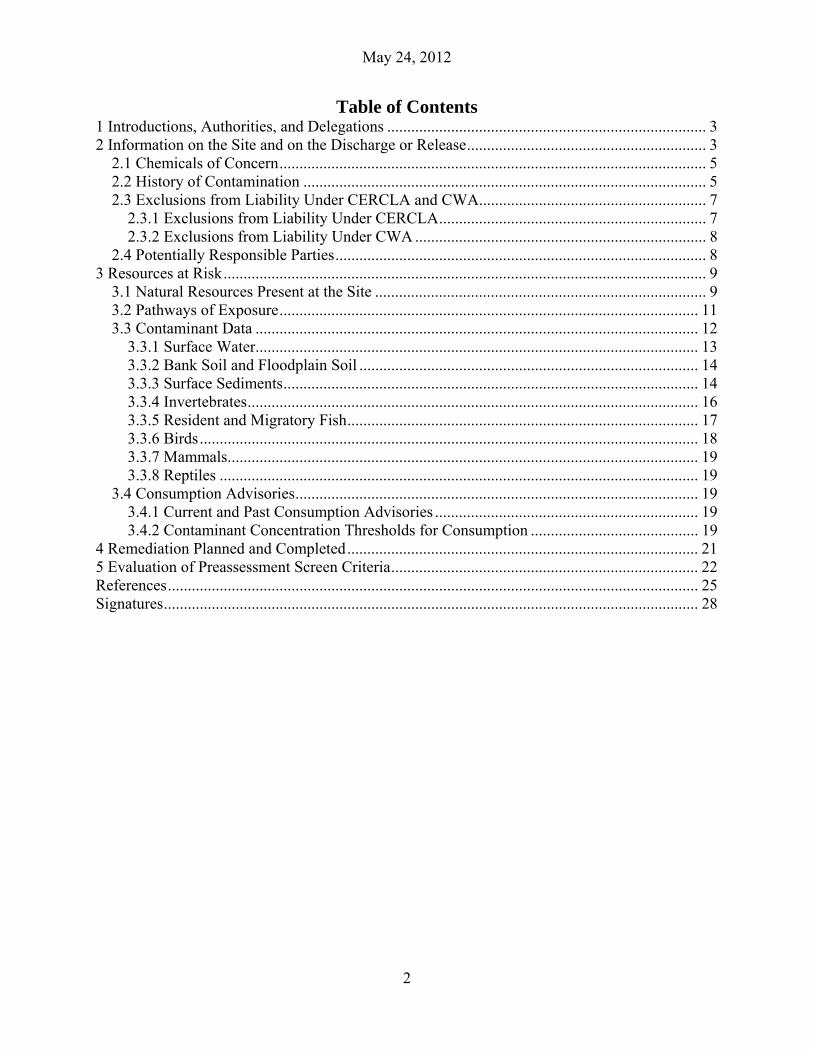
Table of Contents 1 Introductions, Authorities, and Delegations ................................................................................ 3 2 Information on the Site and on the Discharge or Release ............................................................ 3
2.1 Chemicals of Concern ........................................................................................................... 5 2.2 History of Contamination ..................................................................................................... 5 2.3 Exclusions from Liability Under CERCLA and CWA......................................................... 7
2.3.1 Exclusions from Liability Under CERCLA ................................................................... 7 2.3.2 Exclusions from Liability Under CWA ......................................................................... 8
2.4 Potentially Responsible Parties ............................................................................................. 8 3 Resources at Risk ......................................................................................................................... 9
3.1 Natural Resources Present at the Site ................................................................................... 9 3.2 Pathways of Exposure ......................................................................................................... 11 3.3 Contaminant Data ............................................................................................................... 12
3.3.1 Surface Water ............................................................................................................... 13 3.3.2 Bank Soil and Floodplain Soil ..................................................................................... 14 3.3.3 Surface Sediments ........................................................................................................ 14 3.3.4 Invertebrates ................................................................................................................. 16 3.3.5 Resident and Migratory Fish ........................................................................................ 17 3.3.6 Birds ............................................................................................................................. 18 3.3.7 Mammals...................................................................................................................... 19 3.3.8 Reptiles ........................................................................................................................ 19
3.4 Consumption Advisories ..................................................................................................... 19 3.4.1 Current and Past Consumption Advisories .................................................................. 19 3.4.2 Contaminant Concentration Thresholds for Consumption .......................................... 19
4 Remediation Planned and Completed ........................................................................................ 21 5 Evaluation of Preassessment Screen Criteria ............................................................................. 22 References ..................................................................................................................................... 25 Signatures ...................................................................................................................................... 28

May 24, 2012
3
1 Introductions, Authorities, and Delegations This document is a preassessment screen (PAS) prepared pursuant to 43 CFR Part 11 for the Sheboygan River and Harbor. The site extends approximately 14 river miles through the communities of Sheboygan Falls, Kohler, and Sheboygan, Wisconsin, and includes Sheboygan Harbor, located on Lake Michigan, and the lower Sheboygan River. The site is more fully described in Section 2 below. The purpose of this PAS is to provide a rapid review of readily available information on natural resources at the Site to ensure that there is a reasonable probability of making a successful claim before monies and efforts are expended in carrying out a natural resource damage assessment (NRDA) as authorized by the Comprehensive Environmental Response, Compensation, and Liability Act of 1980 (CERCLA), 42 U.S.C. § 9601 et seq., as amended and the Clean Water Act, 33 U.S.C. § 1251 et seq. The criteria on which to base the decision to proceed past the preassessment phase to full assessment are listed below.
1) A discharge of oil or a release of a hazardous substance has occurred; 2) Natural resources for which a state or federal agency or Indian tribe may assert
trusteeship under CERCLA have been or are likely to have been adversely affected by the discharge or release;
3) The quantity and concentration of the discharged oil or released hazardous substances is sufficient to potentially cause injury to those natural resources;
4) Data sufficient to pursue an assessment are readily available or likely to be obtained at reasonable cost; and
5) Response actions carried out or planned do not or will not sufficiently remedy the injury to natural resources without further action.
This PAS has been prepared pursuant to 43 CFR §§ 11.23 - 11.24 by the Department of Commerce/National Oceanic and Atmospheric Administration (NOAA), the Department of the Interior/U.S. Fish and Wildlife Service (USFWS), and the Wisconsin Department of Natural Resources (WDNR). Collectively, pursuant to CERCLA Section 107 (f) and Section 300.600 of the National Contingency Plan, these sovereign entities are trustees for all of the natural resources in the environment potentially injured by releases from and into the Sheboygan River and Harbor. 2 Information on the Site and on the Discharge or Release The Sheboygan River and Harbor site is located on the western shore of Lake Michigan, approximately 55 miles north of Milwaukee, Wisconsin (Figure 1). It includes the lower 14 miles of the Sheboygan River from Sheboygan Falls to, and including, the Sheboygan Harbor on Lake Michigan. The site includes the Sheboygan River and Harbor Superfund site (added to the National Priorities List [NPL] in 1986), the Kohler Company Landfill Superfund site in the middle reach of the river (added to the NPL in 1984), and the former Campmarina manufactured gas plant site in the downstream reach of the river (not listed on the NPL; addressed by the U.S. Environmental Protection Agency [U.S. EPA] as a Superfund Alternative Site). Hereinafter the reference to the Site includes both the NPL sites and the Alternative Site. See Section 2.2 for further information on the history of contamination and responsible parties. The Sheboygan

May 24, 2012
4
River area has been listed as one of 43 Great Lakes Areas of Concern (AOCs) by the U.S. and Canada.
Figure 1. Sheboygan River and Harbor area map (Image adapted from U.S. EPA 2007) For the remediation, the Site has been divided into upper, middle and lower reaches as shown in Figure 1. The upper and middle reaches of the river are shallow and relatively fast-flowing, and the riverbed is primarily rock and gravel with isolated soft sediment deposits. The lower river and the inner and outer harbors are slow-flowing with continuous soft sediment beds (PRS 2009). Three dams are present within the site boundaries: the Sheboygan Falls Dam at the upstream end of the upper reach, the River Bend Dam in the upper reach, and the Waelderhaus Dam at the boundary between the upper and middle reaches. Land use upstream of the site is primarily agricultural. Upstream of the Sheboygan Falls dam, other than agricultural inputs, there are no known industrial sources of contaminants (EVS and NOAA 1998). Land use adjacent to the site is industrial, recreational (i.e., parks and a wildlife preserve), and residential. The Sheboygan River is a major tributary to Lake Michigan, and the lower river and harbor are subject to seiche (standing wave) effects from Lake Michigan. In 1974, U.S. EPA identified elevated levels of mercury, cadmium, chromium, lead, and zinc in sediments in Sheboygan Harbor (Appendix A to Blasland, Bouck, and Lee [BBL] 1990). In 1977, WDNR identified elevated concentrations of polychlorinated biphenyls (PCBs) in Sheboygan Harbor fish as part of its statewide monitoring program (WDNR 1995), prompting U.S. EPA to test for and confirm the presence of PCBs in Sheboygan Harbor sediments that same year (BBL 1990). Subsequent sampling found PCBs unevenly distributed throughout the river, with the highest concentrations (4,500 parts per million [ppm] and 4,300 ppm) in sediment immediately downstream from the Tecumseh Products Company facility in Sheboygan Falls (BBL 1990). Additional sources of chemical contamination to the Sheboygan River and Harbor include the Kohler Company facility and landfill, the Thomas Industries site, and the Campmarina manufactured gas plant site (see Figure 1 above) (U.S. EPA 2000a and NRT 2009).
Kohler landfill
Thomas Industries
Campmarina MGP

May 24, 2012
5
Since 1979, high PCB levels in fish have prompted WDNR to issue fish consumption advisories for zero consumption of all resident fish species between Sheboygan Falls and the mouth of the Sheboygan River. WDNR also advises only limited consumption of chinook salmon, coho salmon, brown trout, lake trout, rainbow trout, yellow perch, whitefish, chubs and smelt from Lake Michigan and the Sheboygan River downstream of the first dam because of PCB contamination (WDNR 2011a). Additionally, wildlife consumption advisories on birds have been in effect since 1987 for the area due to PCB contamination (WDNR 2011b). See Appendix A for past consumption advisories. The U.S. Army Corps of Engineers ceased its previously routine dredging of the river channel in 1969 to avoid disturbing and spreading contaminated sediment (WDNR 1995). The restrictions on dredging have resulted in limitations on use of these waters by private marinas and recreational boaters as well as commercial shipping. 2.1 Chemicals of Concern Hazardous substances found in the Sheboygan River and Harbor include, but are not limited to, the following substances that have been designated as hazardous substances under CERCLA sections 101 and 102 and as set forth in 40 CFR 302.4:
Organic Chemicals Chemical Abstracts Service Number Polychlorinated biphenyls (PCBs) 1336363 Polycyclic aromatic hydrocarbons (PAHs ) a broad category, including e.g. 50328 Acetone 67641 Toluene 108883 Vinyl chloride 75014 Trichloroethylene 79016 Benzene 71432 Dioxins/Furans a broad category, including e.g. 1746016 Metals
Chemical Abstracts Service Number
Arsenic (As) 7440382 Cadmium (Cd) 7440439 Chromium (Cr) 7440473 Copper (Cu) 7440508 Lead (Pb) 7439921 Mercury (Hg) 7439976 Nickel (Ni) 7440020 Silver (Ag) 7440224 Cyanides
57125
2.2 History of Contamination Contamination found in the Sheboygan River and Harbor is consistent with the manufacturing processes that took place nearby. Industrial activities that have or may have resulted in releases of hazardous substances noted above include die-casting operations, disposal of foundry and manufacturing wastes, manufacture of gas from coal or oil, and manufacture of compressors, vacuum pumps, and liquid pumps.

May 24, 2012
6
Tecumseh Products Company Plant Tecumseh Products Company acquired the Die Cast Corporation in 1966, including the plant site adjacent to the upper river in Sheboygan Falls. Metal die casting operations began at the site in 1958 and ended in 2003 when Tecumseh Products Company closed the plant. The facility used hydraulic fluids containing PCBs from about 1966 to 1971, and unused PCB materials remained onsite until a WDNR-ordered cleanup in 1978, described below. To control flooding of the Tecumseh facility’s low-lying land next to the Sheboygan River, Tecumseh and the City of Sheboygan Falls jointly constructed a flood control dike in the early 1970s from on-site fill. Prior to the construction of the dike, PCB-contaminated materials that had been disposed in the yard behind the Tecumseh plant may have come in contact with Sheboygan River floodwaters (BBL 1990). The fill used to build the dike was later found to contain PCBs, and during periods of rain or high river flow it was a source of PCBs to the River (BBL 1990). In 1978, WDNR ordered Tecumseh to stop disposing of solid waste on its property and to excavate, collect, and properly store all materials likely to contain PCBs. The company complied with the order and excavated contaminated soils and disposed of them in an EPA-licensed PCB disposal facility offsite (U.S. EPA 2009a). The dike was removed and replaced in 1979 (WDNR 1995). The Kohler Company
The Kohler Company owns and operates a landfill bounded on three sides by the Sheboygan River. It has been in operation since the 1950s, primarily for the disposal of foundry and manufacturing wastes associated with the manufacture of bathroom fixtures. These included chrome plating sludges, enamel powder, hydraulic oils, solvents and paint wastes (WDNR 1995). The Kohler landfill leached contamination, including heavy metals, PCBs, PAHs, and volatile organic compounds (VOCs) including trichloroethylene (TCE) and vinyl chloride into surrounding soils and groundwater (WDNR 2007). Sediment samples from a small tributary to the Sheboygan River near Kohler had elevated levels of cadmium, chromium, copper, lead, and zinc, indicating a potential release from the Kohler facility (BBL 1995). Groundwater in the shallow aquifer beneath the site previously flowed into the Sheboygan River, carrying hexavalent chromium and other chemicals (Geraghty and Miller 1992), but in 1998, a collection system was constructed to divert contaminated leachate to the city wastewater treatment facility (WDNR 2007). As part of the same remedial action, the landfill was capped to contain remaining contamination onsite (WDNR 2007). Thomas Industries Thomas Industries manufactured compressors, vacuum pumps, and liquid pumps. Its machine shop operations consisted of milling, drilling, boring and tapping of aluminum, steel, powder metal, cast iron, zinc and brass materials, and finishing and cleaning aluminum parts by acid wash, degreasing, vibratory and spindle finishing (U.S. EPA 2000a). The Thomas Industries facility had outfalls that were found to contain PCBs at 200 ng/L in direct surface water discharge to the Sheboygan River and 140,000 ng/L in effluent discharged to the City of Sheboygan wastewater treatment plant (Kleinert et al. 1978).

May 24, 2012
7
Campmarina Plant Campmarina, a former Wisconsin Public Service Corporation coal gasification plant located along the east bank of the lower river, operated from 1872 to 1929 (WDNR 1995). Runoff from the gas plant released tars into nearby soil and groundwater. Groundwater at the site showed levels of arsenic, total cyanide and benzene above the state enforcement standard (Simon Hydro-Search 1992 cited in WDNR 1995). Cyanide was also detected in the soil. The coal gasification plant is the suspected source of PAHs found in sediments near the Pennsylvania Avenue Bridge (BBL 1990) and the Eighth Street Bridge (RMT 1993 cited in WDNR 1995). 2.3 Exclusions from Liability Under CERCLA and CWA Pursuant to 43 CFR 11.24, the Trustees must determine whether natural resource damages being considered are excluded from liability under CERCLA or the CWA. If the damages being considered are excluded from liability under CERCLA or the CWA, the Trustees cannot pursue an assessment of potential injuries to natural resource damages under the CERCLA Natural Resource Damage Assessment Regulations (NRDA regulations).
2.3.1 Exclusions from Liability Under CERCLA The NRDA regulations, 43 C.F.R. § 11.24(b), list the following specific damages that are excluded from liability under CERCLA:
1) Damages resulting from a discharge or release that was specifically identified as an irreversible and irretrievable commitment of natural resources in an environmental impact statement or comparable environmental analysis;
2) Damages from a release of hazardous substances that occurred wholly before the enactment of CERCLA;
3) Damages resulting from the application of a pesticide registered under the Federal Insecticide, Fungicide, and Rodenticide Act (FIFRA), 7 U.S.C. § 135-135k;
4) Damages resulting from any other federally-permitted release as defined in Section 101(10) of CERCLA; and
5) Damages resulting from the release or threatened release of recycled oil, as described in 43 CFR § 11.24(b)(1)(v).
Discharge(s) or release(s) of the hazardous substances at the Sheboygan River and Harbor site have not been specifically identified as an irreversible and irretrievable commitment of natural resources in an environmental impact statement or comparable environmental analysis.
Damages from a release(s) of hazardous substances did not occur wholly before the enactment of CERCLA. The hazardous substances at the Sheboygan River and Harbor site are not pesticide products registered under the Federal Insecticide, Fungicide, and Rodenticide Act (7 U.S.C. § 135-135k),
May 24, 2012
8
and therefore damages resulting from the release(s) of these hazardous substances are not excluded from liability under CERCLA. The discharge(s) or release(s) of the hazardous substances at the Sheboygan River and Harbor site was not a federally permitted release as defined in CERCLA § 101 (10). The Trustees are not pursuing damages resulting from the release or threatened release of recycled oil at the Sheboygan River and Harbor site. At this time the Trustees are not aware of any other possible defenses or exclusions from liability under applicable laws that would preclude initiating a natural resource damage assessment. 2.3.2 Exclusions from Liability Under CWA The NRDA regulations, 43 C.F.R. § 11.24(b), require the Trustees to determine whether a discharge meets one or more of the following exclusions provided in Sections 311(a)(2) or (b)(3) of the Clean Water Act:
1) Discharges in compliance with a permit under section 402 of the Clean Water Act; 2) Discharges resulting from circumstances identified and reviewed and made a part of the public record with respect to a permit issued or modified under section 402 of the Clean Water Act, and subject to a condition in such permit; 3) Continuous or anticipated intermittent discharges from a point source, identified in a permit or permit application under section 402 of the Clean Water Act, which are caused by events occurring within the scope of relevant operating or treatment systems; 4) Discharges incidental to mechanical removal authorized by the President under subsection (c) of this section; and 5) Discharges into the waters of the contiguous zone or which may affect natural resources belonging to, appertaining to, or under the exclusive management authority of the United States (including resources under the Magnuson-Stevens Fishery Conservation and Management Act of 1976), where permitted under the Protocol of 1978 Relating to the International Convention for the Prevention of Pollution from Ships, 1973, and where permitted in quantities and at times and locations or under such circumstances or conditions as the President may, by regulation, determine not to be harmful.
The Trustees have evaluated the discharges into the Sheboygan River and Harbor Site, and will not be pursuing damages for any discharge(s) that meets any of the criteria listed above. 2.4 Potentially Responsible Parties Tecumseh Products Company, Thomas Industries, Kohler Company, Die-Cast Corporation (former owner of Tecumseh site), and Wisconsin Public Service Corporation are potentially responsible parties (PRPs) known at this time. Current and former owners and/or operators of these sites may also be PRPs.
May 24, 2012
9
3 Resources at Risk 3.1 Natural Resources Present at the Site NOAA, USFWS, and WDNR collectively have trusteeship over all natural resources within and adjacent to the Sheboygan River and Harbor. The natural resources potentially affected by releases or discharges of hazardous substances include, but are not limited to, the resources listed below:
Resident and migratory fish Migratory birds Benthic and aquatic invertebrates Terrestrial mammals Reptiles and amphibians Sediment Soil Surface water Groundwater Aquatic plants Wetlands and upland habitats
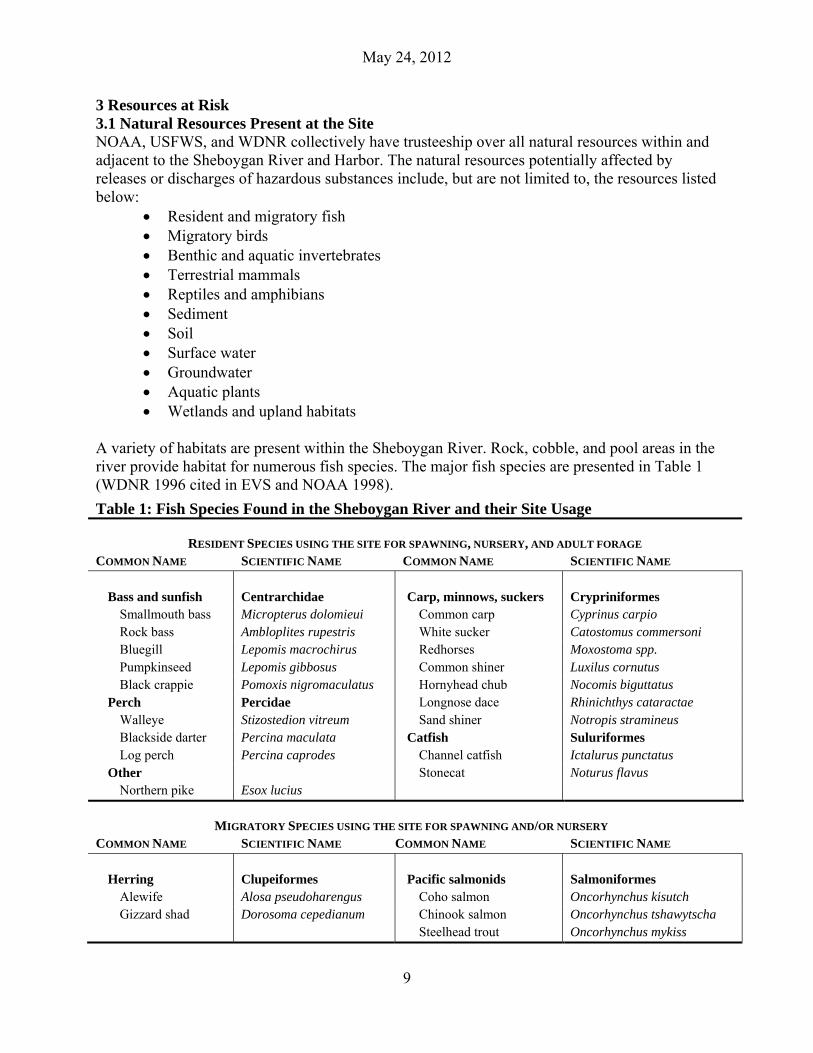
A variety of habitats are present within the Sheboygan River. Rock, cobble, and pool areas in the river provide habitat for numerous fish species. The major fish species are presented in Table 1 (WDNR 1996 cited in EVS and NOAA 1998).
Table 1: Fish Species Found in the Sheboygan River and their Site Usage
RESIDENT SPECIES USING THE SITE FOR SPAWNING, NURSERY, AND ADULT FORAGE COMMON NAME SCIENTIFIC NAME COMMON NAME SCIENTIFIC NAME
Bass and sunfish
Centrarchidae
Carp, minnows, suckers
Crypriniformes
Smallmouth bass Micropterus dolomieui Common carp Cyprinus carpio Rock bass Ambloplites rupestris White sucker Catostomus commersoni Bluegill Lepomis macrochirus Redhorses Moxostoma spp. Pumpkinseed Lepomis gibbosus Common shiner Luxilus cornutus Black crappie Pomoxis nigromaculatus Hornyhead chub Nocomis biguttatus
Perch Percidae Longnose dace Rhinichthys cataractae Walleye Stizostedion vitreum Sand shiner Notropis stramineus Blackside darter Percina maculata Catfish Suluriformes Log perch Percina caprodes Channel catfish Ictalurus punctatus
Other Stonecat Noturus flavus Northern pike Esox lucius
MIGRATORY SPECIES USING THE SITE FOR SPAWNING AND/OR NURSERY COMMON NAME SCIENTIFIC NAME COMMON NAME SCIENTIFIC NAME
Herring Clupeiformes Pacific salmonids Salmoniformes Alewife Alosa pseudoharengus Coho salmon Oncorhynchus kisutch Gizzard shad Dorosoma cepedianum Chinook salmon Oncorhynchus tshawytscha
Steelhead trout Oncorhynchus mykiss

May 24, 2012
10
A large number of bird species use the river and harbor and floodplain habitats for foraging and/or breeding. These include resident and migratory species as listed below: Table 2: Avian Species Using the Sheboygan River for Breeding and/or Foraging (data from EVS and NOAA 1998 and from Casper and Havel 2012)
Common Name and Food Guild
Scientific Name Common Name and
Food Guild Scientific Name
Piscivorous Species Omnivorous Species Water Birds Dabbling Ducks
Double-crested Cormorant
Phalacrocorax auritus Mallard Anas platyrhynchos
Pied-billed Grebe Podilymbus podiceps Black duck Anas rubripes
Caspian Tern Hydroprogne caspia Northern shoveler Anas clypeata
Forster’s Tern Sterna forsteri Blue-wing teal Anas discors
Common Tern Sterna hirundo Green-wing teal Anas carolinensis
Rails Wood duck Aix sponsa
American Coot Fulica americana Northern pintail Anas acuta
Diving Ducks Canada goose Branta canadensis
Hooded Merganser Lophodytes cucullatus Diving Ducks
Common Merganser Mergus merganser Ring-necked duck Aythya collaris
Red-breasted Merganser Mergus serrator Lesser scaup Aythya affinis
Wading Birds Bufflehead Aythya affinis
Great Blue Heron Ardea herodias Common goldeneye Bucephala clangula
Green Heron Butorides striata Gulls
Black-crowned Night Heron
Nycticorax nycticorax Herring gull Larus argentatus
Raptors Ring-billed gull Larus delawarensis
Osprey Pandion haliaetus Bonaparte’s gull Chroicocephalus philadelphia
Bald Eagle Haliaeetus leucocephalus
Raptors
Passerines Peregrine falcon Falco peregrinus
Belted Kingfisher Megaceryle alcyon
Insectivorous Species
Passerines
Red-winged blackbird Agelaius phoeniceus
Tree swallow Tachycineta bicolor
Cliff swallow American Robin
Petrochelidon pyrrhonota
Shorebirds
Killdeer Charadrius vociferus
Spotted sandpiper Actitis macularius
Common snipe Gallinago gallinago
Solitary sandpiper Tringa solitaria

May 24, 2012
11
Forested areas along the banks provide habitat for a range of small mammals and white-tailed deer. Mammalian species associated with aquatic and semi-aquatic habitats of the Sheboygan River include bats, muskrat, raccoon, mink, and beaver. Other animals of interest because of their role in the food web include turtles, insects, and benthic invertebrates such as insect larvae, mussels, and crayfish. The biotic and abiotic resources identified above provide numerous services, including, but not limited to:
Habitat for trust resources, including food, shelter, breeding, foraging areas, rearing areas, and other factors essential for survival;
Fishing and hunting; Non-consumptive uses such as wildlife viewing and photography and other outdoor
recreation activities; and Primary and secondary contact activities such as swimming and boating.
3.2 Pathways of Exposure As described above, hazardous substances were released to soil, surface water, and groundwater. Flooding and other transport processes redistribute these contaminants to other media, including sediments, and may make them available to biota such as benthic organisms, aquatic plants and fish. Additional biological receptors such as birds and mammals may come in contact with the contaminants through the food web. The exposure pathways of concern for this site include (1) uptake from contaminated sediments and water and (2) uptake via the food web. These pathways are the most likely to be relevant at this site because many of the contaminants of concern (COCs) at this site tend to have a high affinity for solids and because some of the COCs bioaccumulate. PCBs, PAHs, and many metals tend to partition to sediments, while other pathways are of greater importance for VOCs and cyanide. Chlorinated hydrocarbons, such as PCBs, persist in the environment and biomagnify (i.e., are present in higher concentrations at higher levels of the food web) because of their hydrophobic nature and general resistance to metabolism. The primary exposure pathway for these compounds is via accumulation directly from sediment and sediment pore water into the skin and gills of benthic invertebrates and fish, and through subsequent ingestion of these organisms by upper trophic level organisms. In addition, some exposure will occur through ingestion of contaminated sediments and water. See Figure 2. High molecular weight PAHs and metals are also persistent in sediments. The route by which benthic organisms and bottom fish are exposed to PAHs and metals is similar to that for PCBs: through direct contact and ingestion of sediment and sediment pore water. Direct uptake can also occur in the water column by pelagic organisms. For upper trophic level organisms, exposure to metals and PAHs occurs primarily through ingestion of contaminated food sources, with less exposure through incidental ingestion of contaminated sediments. Mercury biomagnifies through the food web, posing a threat to higher-level consumers. In organisms that are incapable of metabolizing PAHs, such as invertebrates, these compounds bioaccumulate (Eisler 1987). Fish, birds, and mammals can metabolize PAHs to some extent.

May 24, 2012
12
VOCs tend to partition more to air and water than sediment, thus inhalation and ingestion and dermal contact with water are more important exposure pathways for these compounds. Contamination originating from discharges along the Sheboygan River and other tributaries in the watershed can end up in Lake Michigan. Based on data from April 1994 through October 1995, the average annual PCB load from the Sheboygan River to Lake Michigan was approximately 10 kilograms per year (U.S. EPA 2006). Once contaminants enter Lake Michigan, trust resources are exposed to contaminants by pathways similar to those described above.
Figure 2. Exposure pathways for hydrophobic contaminants in the aquatic food web. (Figure from EVS and NOAA 1998.) 3.3 Contaminant Data Hazardous substances released to the Sheboygan River and Harbor have contaminated water, bottom sediments, shorelines, floodplains, wetlands, and biota over 14 miles of river. Additionally, biological populations in a broader area may have been exposed to contamination as a result of moving through the site. In some areas, the contaminants are commingled (e.g., PAHs and PCBs in the lower river and harbor) while in other areas, it is possible to identify a single contaminant class that predominates (e.g., PCBs in the upper river). Contaminant concentrations in specific media within the Sheboygan River and Harbor, as well as a discussion of the impacts of contaminants to trust resources, are presented below.

May 24, 2012
13
For the purposes of this preassessment screen, trustees are comparing contaminant concentrations measured at the Sheboygan site to a variety of screening levels to evaluate the potential for the contamination to affect natural resources. These screening levels come from the scientific literature on laboratory and field toxicology research as well as from environmental agencies’ regulations and guidance documents. There are numerous values that could be used as screening levels for each contaminant in the different media, because the results of toxicity tests will vary among different species and with different environmental conditions. Trustees have not yet identified which levels will be used to quantify injury for this site; that determination would be made after completing the preassessment screen. The screening levels used differ by media and species and are described in more detail in the sections that follow. 3.3.1 Surface Water Total PCB concentrations in the water column of the Sheboygan River under moderate and high flow conditions (which capture contamination caused by sediment resuspension) vary sitewide. The highest concentrations have been found at the River Bend Dam in the upper river reach (Table 3). Concentrations range from below detection limits to 270 ng/L, with the highest concentration detected in a total water (i.e., dissolved and particulate phase) sample from the River Bend Dam site. Table 3. Water Column PCB Concentrations in the Sheboygan River (ng/L) Under Moderate and High Flow Conditions Compared to Various Water Quality Thresholds River Reach
Site Phase Total PCB, moderate flow
Total PCB, high flow
Date (Source)
Upstream Sheboygan Falls Dam total nd nd 1987-88 (1) Upstream Onion River total nd nd 1987-88 (1)
filtered nd nd 1987-88 (1) Upper River Bend Dam total 270 198 1987-88 (1)
filtered 120 nd 1987-88 (1) Upper Waelderhaus Dam total 150 nd 1987-88 (1)
filtered 80 nd 1987-88 (1) Middle USGS Gage total 90 nd 1987-88 (1)
filtered 80 nd 1987-88 (1) Lower 14th Street Bridge total 160 nd 1987-88 (1)
filtered 60 nd 1987-88 (1) Harbor Harbor total nd nd 1987-88 (1)
total 9 1995 (2) filtered 5.5 1994 (2)
Harbor Mouth total 115 1981-83 (3)
Final water quality guidance for the Great Lakes 0.074 U.S. EPA 1995 National Recommended Water Quality Criteria 0.064 U.S. EPA 2009b Surface water quality criterion for protection of fish and wildlife
0.12 WDNR 2008
Human Cancer Criteria- warm water sport fish 0.010 WDNR 2008 Human Cancer Criteria- cold water 0.003 WDNR 2008 (1) BBL 1990 (2) WDNR data available through EPA’s STORET database (3) Marti & Armstrong 1990. Median concentration from three samplings under differing flow conditions

May 24, 2012
14
total = dissolved and particulate phase; filtered = dissolved phase only nd = not detected at a detection limit of 50 ng/L (Note: this detection limit is greater than current water quality standards) U.S. EPA has determined water column PCB concentrations in the Great Lakes Basin should be below 0.074 ng/L for the protection of wildlife species (U.S. EPA 1995). U.S. EPA has also derived national ambient water quality criteria for the protection of human health when consuming organisms (U.S. EPA 2009b); the recommended water quality criterion for PCBs in surface water for the protection of human health where organisms are consumed is 0.064 ng/L. The State of Wisconsin has established a PCB water quality criterion of 0.12 ng/L for the protection of fish and wildlife species, and criteria of 0.010 and 0.003 ng/L for the protection of human health in warm and cold water fisheries, respectively (WDNR 2008). Water column PCB concentrations measured in the Sheboygan River and Harbor exceed these values by orders of magnitude. The Lake Michigan Mass Balance Project studied PCB levels in eleven tributaries: the Sheboygan River and nine other rivers selected for their high levels of contamination and one background site. These represent more than 90% of total river flow to Lake Michigan. Of the rivers studied, Sheboygan had the highest mean concentration of particulate-sorbed PCBs in water (55 ng/L) and the second-highest mean concentration of dissolved-phase PCBs (26 ng/L) (McCarty et al. 2004). Estimated PCB loading from the Sheboygan River to Lake Michigan was approximately 10 kg/year in 1994-1995 (McCarty et al. 2004). 3.3.2 Bank Soil and Floodplain Soil Total PCB concentrations in river bank soils ranged from <0.5 to 71 ppm dry weight in the upper river and from <0.08 to 5.5 ppm dry weight in the lower river (Table 4). Table 4. PCB Concentration Ranges in Sheboygan River Bank Soils (ppm dry weight) River Reach Aroclor 1242 Aroclor 1248 Aroclor 1254 Total PCB Date
Upper River <0.5 – 71 3.3 – 30 3.0 - <15 6.3 – 71 1986-87 Middle River <0.025 – 1.3 <0.025 – 3.5 <0.025 – 5.3 <0.025 – 8.8 1986-87 Lower River <0.08 – 2.7 <0.08 – 1.0 0.83 – 2.8 1.32 – 5.5 1986-87 Data Source: BBL 1990 Floodplain soils in the upper reach of the river (upstream of the Waelderhaus Dam) had high PCB concentrations, with a maximum of 272.5 ppm (BBL 1995). The U.S. EPA has specified a remedial objective of 10 ppm PCBs in floodplain soils (U.S. EPA 2000a). 3.3.3 Surface Sediments Although contamination levels in sediments vary with depth, this preassessment screen focuses primarily on surface sediments rather than subsurface sediments because the likelihood of exposure to ecological receptors is greater for surface sediments. PCBs Multiple sampling efforts have been undertaken over the past decades to quantify PCB contamination in sediments (Table 5). Sampling for the remedial investigation (BBL 1990) was

May 24, 2012
15
conducted during the 1980s. NOAA’s Query Manager database contains results of seven sediment studies covering the period 1990-1997. Post-dredge monitoring was conducted in the upper river in 2006-07 and the middle and lower river were sampled in 2009 to develop plans for Superfund, Great Lakes Legacy Act, and U.S. Army Corps of Engineers dredging projects.
Table 5. Concentration Ranges of Total PCBs in Sheboygan River Surface Sediments (ppm dry weight) Data Source
and Time Period
Remedial Investigation sampled 1986-87
NOAA’s Query Manager multiple sampling efforts
1990-1997
PRS upper river post-dredge sampling 2007/
middle and lower river pre-dredge 2009
Location Min Median Max Min Median Max Min Median Max Upstream 0.046 0.067 1.2 0.006 0.011 0.050 na na na
Upper River <0.025 15.5 4,500 0.022 3.5 754.9 0.017 1.96* 19.1Middle River <0.025 1.0 8.8 0.306 2.6 9.9 0.10 0.63 14.2Lower River 0.064 2.0 16.6 0.191 2.1 4.2 0.01 0.89 56.8Inner Harbor <0.025 1.2 5.8 0.360 0.4 1.6 0.02 0.67 48.2
Data Sources: Remedial Investigation data from BBL 1990. NOAA’s Query Manager sediment dataset includes (1) Burzynski 2000, (2) Wawrzyn 1995, (3)Aartila 1993,
(4) EVS and NOAA 1998 ERA Triad study, (5) Talbot 1990-91, (6) EVS and NOAA 1997 Floodplain Study, and (7) EVS and NOAA 1998 ERA Fish Bioaccumulation study.
PRS data from PRS 2007 and 2009. na = no data available * This value is the upper river post-dredge surface-weighted average concentration (SWAC). Elsewhere, the median is presented.
WDNR has developed consensus-based sediment quality guidelines (CBSQGs) for use at contaminated sediment sites which can be used to assess the likelihood of the contaminant affecting invertebrates (WDNR 2003). Integrating results from multiple studies of benthic effects of contamination in sediments, WDNR identifies both a threshold effect concentration (TEC) and a probable effect concentration (PEC) for each chemical of concern. For PCBs, WDNR’s TEC is 0.060 ppm and the PEC is 0.676 ppm. Sheboygan River sediment PCB concentrations frequently exceed both these benchmarks. PAHs Sediment sampling detected PAHs throughout the river, with the highest concentrations in the lower river and harbor. Data on total PAHs from NOAA’s Query Manager database covering 1990-1997 ranges from 0.095 ppm upstream to 31.38 ppm in the harbor, and 1998 sampling by Wisconsin Public Service Corporation (WPSC) found concentrations up to 9,294 ppm near the former manufactured gas plant site (U.S. EPA 2009c). Wisconsin’s CBSQGs for total PAHs are 1.6 ppm (TEC) and 22.8 ppm (PEC). In data collected in NOAA’s Query Manager database, 38 of 63 samples exceed the TEC, indicating potential for injury to benthic organisms. Sample results from sampling conducted by WPSC near the former manufactured gas plant exceed the PEC and TEC by several orders of magnitude.
May 24, 2012
16
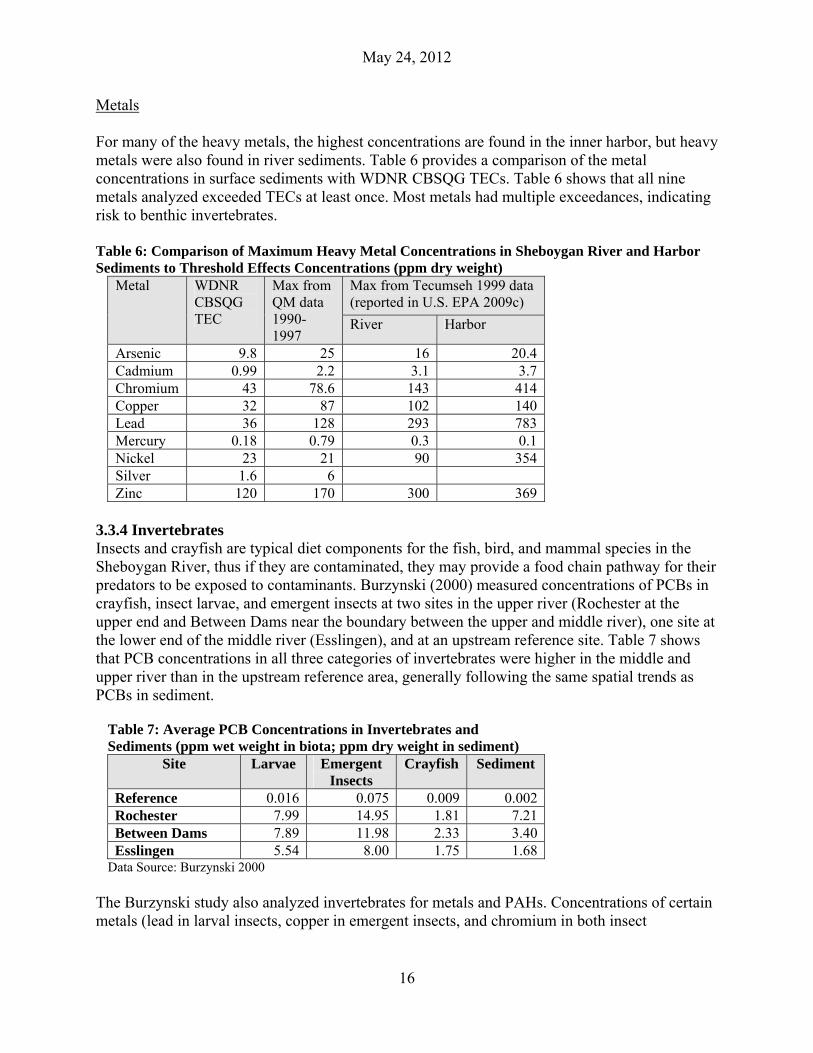
Metals For many of the heavy metals, the highest concentrations are found in the inner harbor, but heavy metals were also found in river sediments. Table 6 provides a comparison of the metal concentrations in surface sediments with WDNR CBSQG TECs. Table 6 shows that all nine metals analyzed exceeded TECs at least once. Most metals had multiple exceedances, indicating risk to benthic invertebrates. Table 6: Comparison of Maximum Heavy Metal Concentrations in Sheboygan River and Harbor Sediments to Threshold Effects Concentrations (ppm dry weight)
Metal WDNR CBSQG TEC
Max from QM data 1990-1997
Max from Tecumseh 1999 data (reported in U.S. EPA 2009c)
River Harbor
Arsenic 9.8 25 16 20.4 Cadmium 0.99 2.2 3.1 3.7 Chromium 43 78.6 143 414 Copper 32 87 102 140 Lead 36 128 293 783 Mercury 0.18 0.79 0.3 0.1 Nickel 23 21 90 354 Silver 1.6 6 Zinc 120 170 300 369
3.3.4 Invertebrates Insects and crayfish are typical diet components for the fish, bird, and mammal species in the Sheboygan River, thus if they are contaminated, they may provide a food chain pathway for their predators to be exposed to contaminants. Burzynski (2000) measured concentrations of PCBs in crayfish, insect larvae, and emergent insects at two sites in the upper river (Rochester at the upper end and Between Dams near the boundary between the upper and middle river), one site at the lower end of the middle river (Esslingen), and at an upstream reference site. Table 7 shows that PCB concentrations in all three categories of invertebrates were higher in the middle and upper river than in the upstream reference area, generally following the same spatial trends as PCBs in sediment.
Table 7: Average PCB Concentrations in Invertebrates and Sediments (ppm wet weight in biota; ppm dry weight in sediment)
Site Larvae Emergent Insects
Crayfish Sediment
Reference 0.016 0.075 0.009 0.002Rochester 7.99 14.95 1.81 7.21Between Dams 7.89 11.98 2.33 3.40Esslingen 5.54 8.00 1.75 1.68
Data Source: Burzynski 2000 The Burzynski study also analyzed invertebrates for metals and PAHs. Concentrations of certain metals (lead in larval insects, copper in emergent insects, and chromium in both insect

May 24, 2012
17
categories) were higher at the three on-site sampling stations than at the reference site (Burzynski 2000). In insects, PAH concentrations increased going downstream and were higher at the three on-site sampling stations than at the reference site. PAH levels in insect tissue were higher than in co-located sediment samples. Crayfish samples did not contain detectable levels of PAHs (Table 8).
Table 8. Average PAH Concentrations in Invertebrates and Sediments (ppm wet weight in biota; ppm dry weight in sediment)
Site Larvae Emergent Insects
Crayfish Sediment
Reference 6.50 15.05 nd nd Rochester 37.10 30.98 nd 8.06 Between Dams 32.95 42.58 nd 0.83 Esslingen 104.15 89.10 nd 3.48
Data Source: Burzynski 2000 3.3.5 Resident and Migratory Fish WDNR fish data collected between 1975 and 2009 show that fish species sampled from the Sheboygan River below Sheboygan Falls contained PCBs ranging from below detection limits to 970 ppm wet weight. Table 9 shows data on PCB concentrations in fish tissue sampled in or near the Sheboygan River. For each section of the river, minimum and maximum concentrations are shown along with other relevant values.
Table 9. PCB Concentration Ranges in Fish from Sheboygan River and Harbor (ppm wet weight) Location PCB Species Sample Type Year sampled Upstream 0.008 White Sucker Whole body 1994
0.573 Smallmouth Bass Whole body 1994 0.800 Common Carp Whole body 1978
Upper River 0.2 Multiple species Multiple preparations 1987 and 199237.5 Common Carp Fillet with skin 2009 94 White Sucker Fillet with skin 2000 900 Walleye Whole body 1979
Middle River ND Multiple species Whole Body 1994 0.06 Rainbow Trout Fillet with skin 1993 19.8 Longnose Dace Whole body 1994
Lower River ND Multiple species Multiple preparations 1989 and 19940.09 Rainbow Trout Fillet with skin 1992 3.5 White Sucker Fillet with skin 2004 32 Channel Catfish Fillet with skin 1988
Inner Harbor 0.4 Coho Salmon Fillet with skin 1981 5.3 White Sucker Whole body 1994 970 Common Carp Fillet with skin 1978
Outer Harbor & Lake
0.25 Coho Salmon Whole body 1992 17 Channel Catfish Fillet without skin 1990 28 Common Carp Fillet with skin 1975
Data source: WDNR fish monitoring and PRS post-remediation monitoring in Upper River ND= non-detect

May 24, 2012
18
The Sheboygan River and Harbor Ecological Risk Assessment (EVS and NOAA 1998) assessed potential for PCBs to pose risk to fish and cited a range of PCB concentrations from the scientific literature that had been linked to deleterious effects on fish survival and reproduction in laboratory and field studies. These concentrations ranged from 13.7 ppm to several hundred ppm wet weight. Concentrations observed in the Sheboygan River frequently exceeded these effects thresholds, indicating a potential for adverse impacts to fish. Additionally, the International Joint Commission has established a goal of 0.1 ppm PCBs (wet weight) in whole fish for protection of fish-eating wildlife (BBL 1990). PCB concentrations in Sheboygan River fish greatly exceed this concentration. Mercury has also been detected at elevated concentrations in Sheboygan River and Harbor fish. Beckvar et al. (2005) evaluated reports from the scientific literature on mercury concentrations associated with adverse effects on a variety of fish species and identified 0.2 ppm as a representative threshold level for screening purposes. As shown in Table 10, mercury concentrations in Sheboygan River fish frequently exceed this level. Table 10: Mercury Concentration Ranges (minimum and maximum values) in Fish from Sheboygan River and Harbor (ppm wet weight)
Location Hg Species Sample Type Date Upstream 0.05 White Sucker Whole body 1994
0.97 Smallmouth Bass Fillet with skin 2006 Upper River 0.12 Common Carp Whole body 1979
0.95 Channel Catfish Fillet without skin 2004 Middle River 0.52 Walleye Fillet without skin 1986 Lower River 0.06 White Sucker Whole body 1994
0.64 Smallmouth Bass Fillet with skin 2004 Inner Harbor 0.01 White Sucker Whole body 1977
0.32 Rock bass Whole body 1982 Data source: WDNR fish monitoring 3.3.6 Birds Between 1976 and 1980, WDNR collected herons, kingfishers, and sandpipers within the riparian zone of the Sheboygan River adjacent to the study area and analyzed tissues for PCBs. Concentrations ranged from 23 to 218 ppm in whole carcasses and 220 ppm in the brain (Heinz et al. 1984). These body burdens are similar to concentrations found to be associated with mortality in other bird species (Stickel et al. 1984). Because some of the herons and kingfishers collected were juveniles, it is likely that they fledged in the Sheboygan area and received most or all of their contaminant exposure from the Sheboygan River and Harbor, though some of the other birds collected may have received contaminants from other areas (BBL 1990). PCB levels in birds’ stomach contents ranged from 12 to 58 ppm (Heinz et al. 1984), which is consistent with PCB levels in Sheboygan River fish at the time of the study. WDNR collected tree swallows in 1995-1997 and analyzed tissues for PCBs. Tree swallows feed heavily on aquatic insects emerging from the river. In the study area, tree swallows were found to accumulate as much as 2 to 3 ppm of PCBs in 10 days. PCB concentrations between 3 and 10

May 24, 2012
19
ppm were observed in eggs. In 1995, impaired hatching and induction of liver enzymes in 12-day old nestlings were documented (Patnode pers. comm. cited in EVS and NOAA 1998). 3.3.7 Mammals Tissue chemistry testing on mink (a top-level predator) found 1.9 ppm PCBs in muscle and fat tissue (BBL 1990), indicating exposure to PCBs. PCBs have been demonstrated to cause reproductive problems in mink. Aulerich and Ringer (1977) found that kit mortality is increased when mink are exposed to PCBs. In a study of reproductive effects of a PCB congener on mink, Beckett et al. (2008) observed that fetal death was common in mink fed more than 0.0024 ppm PCB in their diet. Anecdotal historical accounts from a local trapper indicate that mink were present in the area prior to the late 1970s. Today, however, mink are rarely seen (Katsma pers comm). Mink are more scarce within the Sheboygan River Area of Concern (AOC) than would normally be expected given the available habitat (Burzynski 2000). Small mammal trapping by the WDNR in 1993 recovered no mink within the AOC, and although occasional mink are seen in this area, they are suspected to be transients that are not breeding in the area (Katsma pers. comm. cited in Burzynski 2000). 3.3.8 Reptiles A 1996 WDNR study investigating the hatching success and behavior of snapping turtles from the Sheboygan River found PCB concentrations in eggs from Sheboygan Marsh (miles upstream of the site) ranged from 0.07 to 0.45 ppm, while those in eggs below Sheboygan Falls (downstream of the former Tecumseh plant) ranged from 6.6 to 28 ppm. Hatching success was reduced from a baseline of 94 percent (males) and 92 percent (females) to 73 percent (males) and 86 percent (females) in eggs with PCB concentrations greater than 15 ppm. Righting response, a measure of behavior and agility, was reduced from 64 percent immediate response in hatchlings from upstream of the site to 40 percent downstream (Patnode pers. comm. cited in EVS and NOAA 1998). 3.4 Consumption Advisories 3.4.1 Current and Past Consumption Advisories Since 1979, high PCB levels in fish have prompted WDNR to advise against consumption of all resident fish species between Sheboygan Falls and the mouth of the Sheboygan River (see Appendix A). WDNR also advises only limited consumption of chinook salmon, coho salmon, brown trout, lake trout, rainbow trout, yellow perch, whitefish, chubs and smelt from Lake Michigan and the Sheboygan River downstream of the first dam because of PCB contamination (WDNR 2011a). Additionally, wildlife consumption advisories on birds have been in effect since 1987 for the area due to PCB contamination (WDNR 2011b). 3.4.2 Contaminant Concentration Thresholds for Consumption The U.S. EPA published recommended monthly fish consumption limits for PCBs (U.S. EPA 2000b). For unrestricted consumption (in this case considered to be greater than 16 meals per month or 192 meals per year), the U.S. EPA advised that fish tissue should not contain greater than 0.0059 g PCB/g wet weight for protection against noncancer health endpoints or greater than 0.0015 g PCB/g wet weight for protection against cancer health endpoints. It

May 24, 2012
20
recommended no consumption of fish (i.e., < 0.5 meals per month) when tissue concentrations exceed 0.094 g PCB/g wet weight. Data indicate Sheboygan River fish tissue concentrations frequently exceed these values. Table 11 shows the range of PCB concentrations detected in edible-type fish samples (i.e. fillets) from each of the Sheboygan River reaches. In reaches where a whole-body sample has a lower concentration than the minimum fillet sample, the whole-body value is shown. Table 11. PCB Concentration Ranges in Edible-type Fish Samples from Sheboygan River and Harbor (ppm wet weight)
Location PCB Species Sample Type Date sampled Upstream
Background 0.008 White Sucker Whole body 1994 0.600 Common Carp Fillet with skin 1978
Upper River 0.2 Multiple species Multiple preparations, including fillet
1987 and 1992
37.5 Common Carp Fillet with skin 200994 White Sucker Fillet with skin 2000
250 Common Carp Fillet with skin 1978 Middle River 0.06 Rainbow Trout Fillet with skin 1993
1.8 Chinook Salmon Fillet with skin 19977.5 Walleye Fillet without skin 19867.7 Brook Trout Fillet with skin 1979
Lower River 0.09 Rainbow Trout Fillet with skin 1992 3.9 Common Carp Fillet with skin 200432 Channel Catfish Fillet without skin 1988
Inner Harbor 0.4 Coho Salmon Fillet with skin 1981 970 Common Carp Fillet with skin 1978
Outer Harbor & Lake
0.25 Coho Salmon Whole body 1992 8 Lake Trout Fillet with skin 1985
28 Common Carp Fillet with skin 1975Data source: WDNR fish monitoring. The U.S. EPA also published recommendations for methylmercury, advising that fish tissue should not contain greater than 0.029 ppm (by wet weight) for protection against noncancer health endpoints when consumption is unrestricted (i.e., greater than 16 meals per month or 192 meals per year). It recommended no consumption of fish (i.e., < 0.5 meals per month) when tissue concentrations exceed 1.9 ppm (by wet weight). Data in Table 12 show that Sheboygan River fish tissue concentrations frequently exceed these values.

May 24, 2012
21
Table 12. Mercury Concentration Ranges in Edible-type Fish Samples from Sheboygan River and Harbor (ppm wet weight)
Location Hg Species Sample Type Date Upstream
Background 0.05 White Sucker Whole body 1994 0.74 Smallmouth Bass Fillet with skin 1994
Upper River 0.12 Common Carp Whole body 1979 0.48 Walleye Fillet with skin 1994 0.87 Rock Bass Fillet with skin 1988
Middle River 0.52 Walleye Fillet without skin 1986 Lower River 0.06 White Sucker Whole body 1994
0.35 Walleye Fillet with skin 1988 Inner Harbor 0.01 White Sucker Whole body 1977
0.24 Coho salmon Fillet with skin 1981 Data source: WDNR fish monitoring. WDNR has also advised against human consumption of mallards from the Sheboygan River downstream of Sheboygan Falls and lesser scaup from the Sheboygan Harbor due to PCB concentrations above the Food and Drug Administration (FDA) standard of 3 ppm fat basis (BBL 1990 Appendix H). In 1985-86, PCB concentrations in edible tissue of mallards in the Sheboygan River averaged 214 ppm on a fat basis, higher than any other site sampled in Wisconsin and almost two orders of magnitude higher than the FDA’s action level of 3 ppm fat basis for PCBs in poultry and meat. Concentrations in lesser scaup in Sheboygan Harbor averaged 25 ppm fat basis. 4 Remediation Planned and Completed Several remedial actions have been or are planned to be implemented in or along the lower 14 miles of the Sheboygan River and Harbor. In 1997, the Kohler landfill was capped and a drain installed to capture contaminated groundwater and leachate and divert it to the wastewater treatment plant. Contamination remains onsite but the groundwater contamination is expected to fully recover through active treatment and monitored natural attenuation within 30 years (WDNR 2007). The five-year review for the Kohler Landfill Superfund site determined that the remedy is protective of human health and the environment, but that institutional controls are still required to prevent groundwater use (WDNR 2007). At the Campmarina manufactured gas plant (MGP) site, excavation of contaminated upland soil was conducted in 2001 and a containment system consisting of a sheetpile wall and a geosynthetic cover was put in place to prevent remaining contamination from migrating offsite. A biosparge system was also implemented to enhance natural degradation of contaminants within the containment wall. In 2011, sediment and soils were excavated to remove additional PAHs (U.S. EPA 2011).
In May 2000, U.S. EPA issued a Record of Decision (ROD) for the Sheboygan River and Harbor Superfund site. Of the multiple contaminants present, U.S. EPA determined PCBs to be the greatest risk driver for the site. The ROD called for the removal of sufficient PCB-contaminated

May 24, 2012
22
soft sediment in the upper, middle, and lower river and inner harbor to allow the site to reach a surface weighted average concentration (SWAC) of 0.5 ppm or less over time. Pollution Risk Services (PRS) completed sediment dredging in the upper river in 2007. The calculated SWAC in the upper river based on post-dredge sampling was 1.96 ppm (PRS 2007 and U.S. EPA 2009c). The SWAC is projected to meet the target of 0.5 ppm over time.
Dredging was not selected for the middle river, due in part to anticipated difficulty in implementation. The remedy stipulated, however, that if baseline characterization revealed PCB concentrations ≥ 26 ppm, the associated soft sediment deposits were to be removed. In the pre-design investigation for the middle river, PRS found no sediment deposits with PCBs ≥ 26 ppm; however, 24 of 33 sites sampled were between 0.5 and 26 ppm (PRS 2009). In 2011, PRS began dredging contaminated sediments in the lower river and inner harbor. Because the Superfund selected remedy will leave behind contamination, additional dredging is planned for 2012 under the Great Lakes Legacy Act, to be overseen by U.S. EPA’s Great Lakes National Program Office.
The Sheboygan River and Harbor Superfund Site ROD also calls for the removal of floodplain soils containing PCB concentrations above 10 ppm. Additionally, it calls for investigation and mitigation of potential groundwater contamination and possible continuing sources at the former Tecumseh plant, along with placement of institutional controls to limit access to the Tecumseh plant’s groundwater as a drinking water source (U.S. EPA 2000a). 5 Evaluation of Preassessment Screen Criteria Based on information gathered for this preassessment screen, the Trustees have made the following determinations under the NRDA regulations criteria (43 CFR § 11.23(e)) for proceeding with a natural resource damage assessment:
1) A discharge of oil or a release of a hazardous substance has occurred. Information reviewed by the Trustees indicates that hazardous substances have been released directly or indirectly into the Sheboygan River and Harbor. Over the past decades, hundreds of samples have been collected from surface water, groundwater, soil, sediments, and biota at the site and analyzed for chemical contamination. Hazardous substances identified in samples include, but are not limited to, PCBs, PAHs, metals, and volatile organic compounds. These contaminants are consistent with industrial and manufacturing processes operated at or near the site.
2) Natural resources for which a state or federal agency or Indian tribe may assert trusteeship under CERCLA have been or are likely to have been adversely affected by the discharge or release. Natural resources over which state and federal agencies may assert trusteeship have been and are likely to continue to be adversely impacted. Existing data indicate that hazardous substance concentrations in sediment, water, and tissue of invertebrates, fish, birds, mammals, and reptiles are sufficient to cause adverse impacts and are elevated near areas

May 24, 2012
23
with known releases. In addition, losses due to contamination of recreationally important fish and birds are likely.
3) The quantity and concentration of the discharged oil or released hazardous
substances is sufficient to potentially cause injury to those natural resources. Hazardous substance concentrations documented for the Sheboygan River and Harbor in sediment, water, and tissue are sufficient to cause injury to natural resources. The issuance of state fish consumption advisories is evidence of an injury under the NRDA regulations (43 CFR § 11.62 (f)). An injury to biological trust resources is also evidenced when the concentration of a hazardous substance is sufficient to cause an adverse change in viability to the organism or its offspring (43 CFR § 11.64 (f)(l)). These adverse changes include but are not limited to cancer, genetic mutations, physiological impacts, and reproductive impairment. Some data at the Sheboygan River and Harbor site suggest impairments in wildlife as identified above.
4) Data sufficient to pursue an assessment are readily available or likely to be obtained
at reasonable cost. Data currently exist from the site that will be helpful and cost-effective to use to further assess injury of natural resources. Additional studies may be necessary to better quantify injury and service losses for some resources; these data could be obtained at reasonable costs.
5) Response actions carried out or planned do not or will not sufficiently remedy the
injury to natural resources without further action. The natural resource Trustees expect the remedies for the Site will greatly reduce exposure to hazardous substances. However, trustees are concerned that the natural resources may continue to incur injuries at the cleanup levels specified. Because the cleanup target is an area-wide average, some areas of higher concentration may be left behind by the cleanup and may continue to cause injuries to natural resources. Further, because the ROD does not identify an immediate post-remediation concentration and relies on natural recovery for an unspecified period of time to reach the cleanup level, injury may continue to accrue during that period. Finally, remedial actions are intended to reduce risk in the present and future, but do not account for past injuries, whereas NRDA is intended to account for injuries between the time of the enactment of CERCLA (1980) and the full recovery of the natural resources. Thus, additional restoration, replacement, and rehabilitation of natural resources will be necessary under CERCLA.
Conclusion Based on a review of readily available data and an evaluation of the preassessment determination criteria summarized in this document, the Trustees conclude that the five criteria for proceeding with a natural resource damage assessment have been satisfied. The Trustees hereby determine that further investigation and assessment is warranted at this site in accordance with federal regulations at 43 CFR Part 11, Subparts C and E. The Trustees further determine that current information indicates that there is a reasonable probability of making a successful natural

May 24, 2012
24
resources damage claim pursuant to section 107 of CERCLA and section 311 of the Federal Water Pollution Control Act and that all criteria and requirements in 43 CFR part 11, generally, and 43 CFR § 11.23 (a)-(g), § 11.24 and § 11.25, specifically, have been satisfied. The information provided and conclusions made in this preassessment screen shall be used to direct further investigations and assessments and shall not preclude consideration of other resources later found to be affected or other parties found to be responsible for releases. A copy with all signature pages affixed shall constitute the preassessment screen. The date of execution shall be the date of the final Trustee signature.

May 24, 2012
25
References Aartila. 1993. Data obtained from the National Oceanic and Atmospheric Administration, Office of
Response and Restoration Query Manager 2.61 available for download from http://response.restoration.noaa.gov/watersheddownloads
Aulerich, R., and R. Ringer. 1977. Current status of PCB toxicity to mink, and effect on their reproduction. Archives of Environmental Contamination and Toxicology 6:279-292.
Beckett, K.J., B. Yamini, and S. J. Bursian. 2008. The effects of 3,3',4,4',5-pentachlorobiphenyl (PCB 126) on mink (Mustela vison) reproduction and kit survivability and growth. Arch Environ Contam Toxicol 54:123–129.
Beckvar, N., T.M. Dillon, and L.B. Read. 2005. Approaches for linking whole-body fish tissue residues of mercury or DDT to biological effects thresholds. Environmental Toxicology and Chemistry 24:2094-2105.
Blasland, Bouck, and Lee, Inc (BBL). 1990. Remedial Investigation/Enhanced Screening Report - Sheboygan River and Harbor. Prepared for Tecumseh Products Company.
Blasland, Bouck, and Lee, Inc. 1995. Alternative-Specific Remedial Investigation- Sheboygan River and Harbor. Prepared for Tecumseh Products Company.
Buchman, M.F. 2008. NOAA Screening Quick Reference Tables, NOAA OR&R Report 08-1, Seattle. Office of Response and Restoration, National Oceanic and Atmospheric Administration, 34 pp. http://response.restoration.noaa.gov/sites/default/files/SQuiRTs.pdf
Burzynski, M. 2000. Sheboygan River Food Chain and Sediment Contaminant Assessment. Prepared for the U.S. EPA Great Lakes National Program Office, Chicago, IL.
Casper, G., and J. Havel. Sheboygan River AOC: Wildlife Technical Review. Report prepared for Wisconsin DNR.
Eisler, R. 1987. Polycyclic aromatic hydrocarbon hazards to fish, wildlife, and invertebrates: a synoptic review. Biological Report 85(1.11). U.S. Department of the Interior, Fish and Wildlife Service, Patuxent Wildlife Research Center, Laurel, MD. 81 pp.
EVS Environmental Consultants (EVS) and National Oceanic and Atmospheric Administration (NOAA). 1998. Sheboygan River and Harbor Aquatic Ecological Risk Assessment, volumes 1 through 3. Prepared for U.S. Environmental Protection Agency. EVS project no. 2/575-37, 2/789-10.
Geraghty and Miller. 1992. Environmental contamination assessment and groundwater remedial action alternatives report. Kohler Company Landfill Superfund Site.
Heinz, G.H., D.M. Swineford, and D.E. Katsma. 1984. High PCB Residues in Birds from the Sheboygan River, Wisconsin. Environmental Monitoring and Assessment. 4:155-161.
Kleinert, SJ, TB Sheffy, J Addis, J Bode, P Shultz, JJ Delfino, and L Lueschow. 1978. Final Report on the Investigation of PCBs in the Sheboygan River System. Wisconsin Department of Natural Resources.
Marti, E.D. and D.E. Armstrong. 1990. Polychlorinated biphenyls in Lake Michigan tributaries. J. Great Lakes Res. 16: 396-405.
McCarty, H., J. Schofield, .K Miller, R. Brent, P. Van Hoof and B. Eadie. 2004. Results of the Lake Michigan Mass Balance Study: Polychlorinated Biphenyls and trans-Nonachlor Data Report. Prepared for U.S. EPA Great Lakes National Program Office, EPA 905 R-01-011, http://www.epa.gov/glnpo/lmmb/results/pcb/lmmbpcb.pdf
May 24, 2012
26
Natural Resource Technology (NRT). 2009. WPSC Sheboygan-Campmarina Former Manufactured Gas Plant Site River Operable Unit Remedial Investigation Report. http://www.epa.gov/region5/cleanup/campmarina/pdfs/campmarina_ri_pt1.pdf
Pollution Risk Services (PRS). 2007. Sheboygan River and Harbor Superfund Site Phase II – Upper River Sediment Removal. Final Construction Documentation Report.
PRS. 2009. Sheboygan River and Harbor Superfund Site, Lower River Pre-Design Investigation Report.
Stickel, W.H., L.F. Stickel, R.A. Dyrland, and D.L. Hughes. 1984. Aroclor 1254 residues in birds: lethal levels and loss rates. Arch. Environ. Contam. Toxicol. 13:7-13.
Talbot. 1990. Data obtained from the National Oceanic and Atmospheric Administration, Office of Response and Restoration Query Manager 2.61 available for download from http://response.restoration.noaa.gov/watersheddownloads
U.S. Environmental Protection Agency (U.S. EPA). 1995. 40 CFR 9, 122, 123, 131, 132 Final water quality guidance for the Great Lakes system. Final Rule. Federal Register 60: 15366-15425.
U.S. EPA. 2000a. Record of Decision for the Sheboygan Harbor & River Superfund Site, Sheboygan, Wisconsin. U.S. EPA Region 5 Superfund Office.
U.S. EPA. 2000b. Guidance for Assessing Chemical Contaminant Data for Use in Fish Advisories, Volume 2: Risk Assessment and Fish Consumption Limits, Third Edition. U.S. EPA Office of Water, EPA 823-B-00-008.
U.S. EPA. 2006. Great Lakes Monitoring, Lake Michigan Mass Balance, Tributary Loadings. Retrieved August 11, 2010 from http://www.epa.gov/glnpo/lmmb/results/loadpcbs.html
U.S. EPA. 2007. Completion of Upper River Cleanup Scheduled for this Summer—Sheboygan River and Harbor Site, Sheboygan County, Wisconsin. Retrieved November 16, 2009 from http://www.epa.gov/region5/sites/sheboygan/
U.S. EPA. 2009a. NPL Site Narrative for the Sheboygan Harbor & River, Sheboygan, Wisconsin, Federal Register Notice: June 10, 1986. Retrieved November 20, 2009 from http://www.epa.gov/superfund/sites/npl/nar734.htm
U.S. EPA. 2009b. National Recommended Water Quality Criteria. U.S. EPA Office of Water, Office of Science and Technology (4304T).
U.S. EPA. 2009c. First Five-Year Review Report for the Sheboygan River and Harbor Superfund Site, Sheboygan, Wisconsin. U.S. EPA Region 5 Superfund Office.
U.S. EPA. 2011. WPSC Campmarina MGP site webpage, Region 5 Superfund, U.S. EPA, last updated September 2011. Retrieved December 5, 2011 from http://www.epa.gov/region5/cleanup/campmarina/index.htm
Wawrzyn. 1995. Data obtained from the National Oceanic and Atmospheric Administration, Office of Response and Restoration Query Manager 2.61 available for download from http://response.restoration.noaa.gov/watersheddownloads
Wisconsin Department of Natural Resources (WDNR). 1995. Sheboygan River Remedial Action Plan. http://www.epa.gov/greatlakes/aoc/sheboygn/SHEB_1995_RAP.pdf
WDNR. 1996. Sheboygan River fisheries and habitat survey, 1994. Memorandum from John E. Nelson, Plymouth, WI, to Randy Schumacher, Eagle, WI, dated April 1, 1996. File ref: 3600.
WDNR. 2003. Consensus-Based Sediment Quality Guidelines. Interim Guidance. http://dnr.wi.gov/topic/Brownfields/documents/cbsqg_interim_final.pdf. Accessed December 2009.

May 24, 2012
27
WDNR. 2007. Second Five- Year Review Report for Kohler Company Landfill.
WDNR. 2008. Wisconsin Administrative Code NR 105: Surface Water Quality Criteria and Secondary Values for Toxic Substances. http://www.legis.state.wi.us/rsb/code/nr/nr105.pdf
WDNR. 2011a. Fish Consumption Advisory Pamphlet. http://dnr.wi.gov/fish/consumption/FishAdvPCBs2011.pdf. Accessed Jan 30, 2012. Consumption advisories for previous years are available through DNR’s website.
WDNR. 2011b. Migratory Bird Regulations. http://dnr.wi.gov/org/land/wildlife/hunt/regs/waterfowl.pdf. Accessed May 1, 2012.