proceedings of the institution of mechanical engineers ... · pdf fileproceedings of the...
TRANSCRIPT
http://pib.sagepub.com/Manufacture
Engineers, Part B: Journal of Engineering Proceedings of the Institution of Mechanical
http://pib.sagepub.com/content/227/12/1874The online version of this article can be found at:
DOI: 10.1177/0954405413493901
originally published online 24 July 2013 2013 227: 1874Proceedings of the Institution of Mechanical Engineers, Part B: Journal of Engineering Manufacture
Yung-Chia Chang, Kuei-Hu Chang and Chuan-Yung ChenRisk assessment by quantifying and prioritizing 5S activities for semiconductor manufacturing
Published by:
http://www.sagepublications.com
On behalf of:
Institution of Mechanical Engineers
can be found at:ManufactureProceedings of the Institution of Mechanical Engineers, Part B: Journal of EngineeringAdditional services and information for
http://pib.sagepub.com/cgi/alertsEmail Alerts:
http://pib.sagepub.com/subscriptionsSubscriptions:
http://www.sagepub.com/journalsReprints.navReprints:
http://www.sagepub.com/journalsPermissions.navPermissions:
http://pib.sagepub.com/content/227/12/1874.refs.htmlCitations:
What is This?
- Jul 24, 2013OnlineFirst Version of Record
- Dec 2, 2013Version of Record >>
at NATIONAL CHIAO TUNG UNIV LIB on April 28, 2014pib.sagepub.comDownloaded from at NATIONAL CHIAO TUNG UNIV LIB on April 28, 2014pib.sagepub.comDownloaded from

Original Article
Proc IMechE Part B:J Engineering Manufacture227(12) 1874–1887� IMechE 2013Reprints and permissions:sagepub.co.uk/journalsPermissions.navDOI: 10.1177/0954405413493901pib.sagepub.com
Risk assessment by quantifying andprioritizing 5S activities forsemiconductor manufacturing
Yung-Chia Chang1, Kuei-Hu Chang2 and Chuan-Yung Chen1
Abstract5S practice follows structured 5S activities from structurize, systematize, sanitize, standardize, and self-discipline to dealwith scene management in shop floor control, and it is regarded as the most troublesome aspect with respect to envi-ronmental safety and health for a semiconductor manufacturing fabrication. The improved action items for 5S activitiescan amount to thousands from messy paper filing to untightened chemical piping. However, there is no clear key perfor-mance indicator to evaluate how good (safe) the fab is and how to be good (safe) for 5S practice. Failure modes andeffects analysis is an effective and efficient way to deal with risk assessment for 5S activities and to prioritize the actionrequests from the improved result of continuous improvement. However, when failure modes and effects analysis isapplied to the risk assessment of 5S audit, the conventional risk priority number lacks of all comprehensive informationand misleads to a bias for not considering weights of severity (S), occurrence (O), and detectability (D). In order toimprove the method of risk priority number evaluation, this article combining 2-tuple fuzzy linguistic representationmodel and weighted geometric averaging operators to quantify 5S audit findings is proposed to eliminate the bias fromdifferent 5S auditors. This is the first approach for the numerous 5S action items to be quantified and prioritized withresource constraints to sustain 5S practice robust. A case study in a fab was demonstrated to show how the model wasimplemented to approve its validity.
Keywords2-tuple fuzzy linguistic representation model, 5S practice, failure modes and effects analysis, risk assessment, semicon-ductor fabrication, weighted geometric averaging
Date received: 17 December 2012; accepted: 7 May 2013
Introduction
5S practice has long been implemented to establish andmaintain quality environment in an organizationworldwide from service to industry.1,2 5S practice is abaseline leading to total quality management (TQM)3–7
and safety.8 An enterprise may adopt 5S principles toachieve higher productivity and quality standards asmove toward TQM.7 TQM is a manufacturing pro-gram aimed at continuously improving quality and toimprove firm performance.9,10 When a semiconductormanufacturing fabrication is audited, 5S practice is oneof the topics on the audit checklist. ISO/TS 16949:2002is an International Organization for Standardization(ISO) technical specification that represents a compre-hensive quality management system for continualimprovement with emphasis on defect prevention, thereduction of variation, and waste for the global auto-motive industry.11
Many international semiconductor manufacturingcompanies (e.g. Intel Corporation, SamsungElectronics, STMicroelectronics) have affiliated andregistered the certification of ISO/TS 16949 to becomeworld-class semiconductor manufacturers. Taking theISO/TS 16949:20026 standard as a reference, theclauses of 6.4.1 (personal safety to achieve productquality) and 6.4.2 (cleanliness of premises) are clearlystated in the sub-checkpoints of clause 6.4 (work
1Department of Industrial Engineering and Management, National Chiao
Tung University, Hsinchu, Taiwan2Department of Management Sciences, R.O.C. Military Academy,
Kaohsiung, Taiwan
Corresponding author:
Kuei-Hu Chang, Department of Management Sciences, R.O.C. Military
Academy, Kaohsiung 830, Taiwan.
Email: [email protected]
at NATIONAL CHIAO TUNG UNIV LIB on April 28, 2014pib.sagepub.comDownloaded from
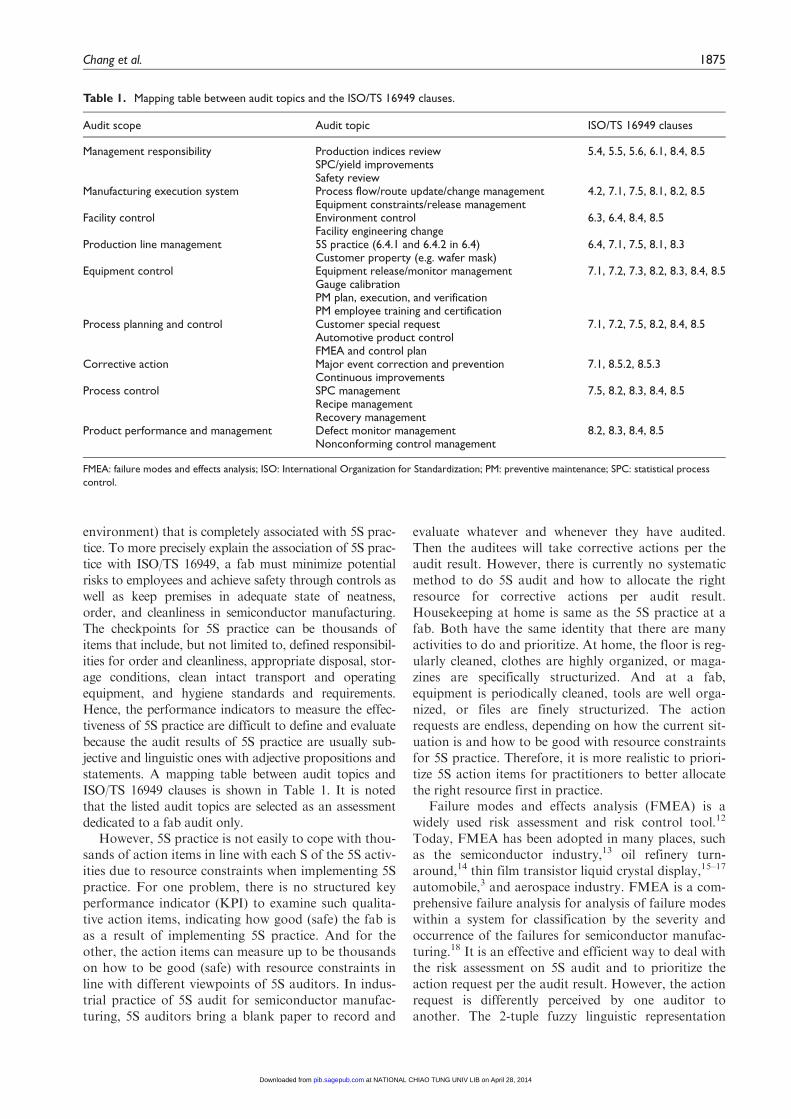
environment) that is completely associated with 5S prac-tice. To more precisely explain the association of 5S prac-tice with ISO/TS 16949, a fab must minimize potentialrisks to employees and achieve safety through controls aswell as keep premises in adequate state of neatness,order, and cleanliness in semiconductor manufacturing.The checkpoints for 5S practice can be thousands ofitems that include, but not limited to, defined responsibil-ities for order and cleanliness, appropriate disposal, stor-age conditions, clean intact transport and operatingequipment, and hygiene standards and requirements.Hence, the performance indicators to measure the effec-tiveness of 5S practice are difficult to define and evaluatebecause the audit results of 5S practice are usually sub-jective and linguistic ones with adjective propositions andstatements. A mapping table between audit topics andISO/TS 16949 clauses is shown in Table 1. It is notedthat the listed audit topics are selected as an assessmentdedicated to a fab audit only.
However, 5S practice is not easily to cope with thou-sands of action items in line with each S of the 5S activ-ities due to resource constraints when implementing 5Spractice. For one problem, there is no structured keyperformance indicator (KPI) to examine such qualita-tive action items, indicating how good (safe) the fab isas a result of implementing 5S practice. And for theother, the action items can measure up to be thousandson how to be good (safe) with resource constraints inline with different viewpoints of 5S auditors. In indus-trial practice of 5S audit for semiconductor manufac-turing, 5S auditors bring a blank paper to record and
evaluate whatever and whenever they have audited.Then the auditees will take corrective actions per theaudit result. However, there is currently no systematicmethod to do 5S audit and how to allocate the rightresource for corrective actions per audit result.Housekeeping at home is same as the 5S practice at afab. Both have the same identity that there are manyactivities to do and prioritize. At home, the floor is reg-ularly cleaned, clothes are highly organized, or maga-zines are specifically structurized. And at a fab,equipment is periodically cleaned, tools are well orga-nized, or files are finely structurized. The actionrequests are endless, depending on how the current sit-uation is and how to be good with resource constraintsfor 5S practice. Therefore, it is more realistic to priori-tize 5S action items for practitioners to better allocatethe right resource first in practice.
Failure modes and effects analysis (FMEA) is awidely used risk assessment and risk control tool.12
Today, FMEA has been adopted in many places, suchas the semiconductor industry,13 oil refinery turn-around,14 thin film transistor liquid crystal display,15–17
automobile,3 and aerospace industry. FMEA is a com-prehensive failure analysis for analysis of failure modeswithin a system for classification by the severity andoccurrence of the failures for semiconductor manufac-turing.18 It is an effective and efficient way to deal withthe risk assessment on 5S audit and to prioritize theaction request per the audit result. However, the actionrequest is differently perceived by one auditor toanother. The 2-tuple fuzzy linguistic representation
Table 1. Mapping table between audit topics and the ISO/TS 16949 clauses.
Audit scope Audit topic ISO/TS 16949 clauses
Management responsibility Production indices review 5.4, 5.5, 5.6, 6.1, 8.4, 8.5SPC/yield improvementsSafety review
Manufacturing execution system Process flow/route update/change management 4.2, 7.1, 7.5, 8.1, 8.2, 8.5Equipment constraints/release management
Facility control Environment control 6.3, 6.4, 8.4, 8.5Facility engineering change
Production line management 5S practice (6.4.1 and 6.4.2 in 6.4) 6.4, 7.1, 7.5, 8.1, 8.3Customer property (e.g. wafer mask)
Equipment control Equipment release/monitor management 7.1, 7.2, 7.3, 8.2, 8.3, 8.4, 8.5Gauge calibrationPM plan, execution, and verificationPM employee training and certification
Process planning and control Customer special request 7.1, 7.2, 7.5, 8.2, 8.4, 8.5Automotive product controlFMEA and control plan
Corrective action Major event correction and prevention 7.1, 8.5.2, 8.5.3Continuous improvements
Process control SPC management 7.5, 8.2, 8.3, 8.4, 8.5Recipe managementRecovery management
Product performance and management Defect monitor management 8.2, 8.3, 8.4, 8.5Nonconforming control management
FMEA: failure modes and effects analysis; ISO: International Organization for Standardization; PM: preventive maintenance; SPC: statistical process
control.
Chang et al. 1875
at NATIONAL CHIAO TUNG UNIV LIB on April 28, 2014pib.sagepub.comDownloaded from
model is proposed to combine numerical and linguisticinformation without loss of information in the trans-formation processes to normalize the conventional riskpriority number (RPN). Then weighted geometric aver-aging (WGA) is implemented to provide and generalizea parameterized class of geometric mean type aggrega-tion operators that have the ability to model linguisti-cally expressed aggregation instructions. This studyproposed a novel method combining the 2-tuple fuzzylinguistic representation model and the WGA opera-tors to quantify 5S action items, so that the numerous5S action items could be prioritized with resource con-straints to sustain 5S practice robustness.
The organization of this article is categorized into fivesections. In section ‘‘Introduction,’’ the motivation forquantifying and prioritizing 5S activities for semiconduc-tor manufacturing is introduced. Section ‘‘Material andmethods’’ reviews 5S practice in a semiconductor manu-facturing fabrication, introduces FMEA, and inducesthe theory of computation for the 2-tuple fuzzy linguisticrepresentation model and WGA. A novel method com-bining the 2-tuple fuzzy linguistic representation modeland the WGA operator is proposed in section ‘‘Proposedmethod.’’ A case study in a fab was demonstratedhow the model was implemented to approve its validityin section ‘‘Case study.’’ The final section drawsconclusions.
Material and methods
5S practice in a semiconductor manufacturingfabrication
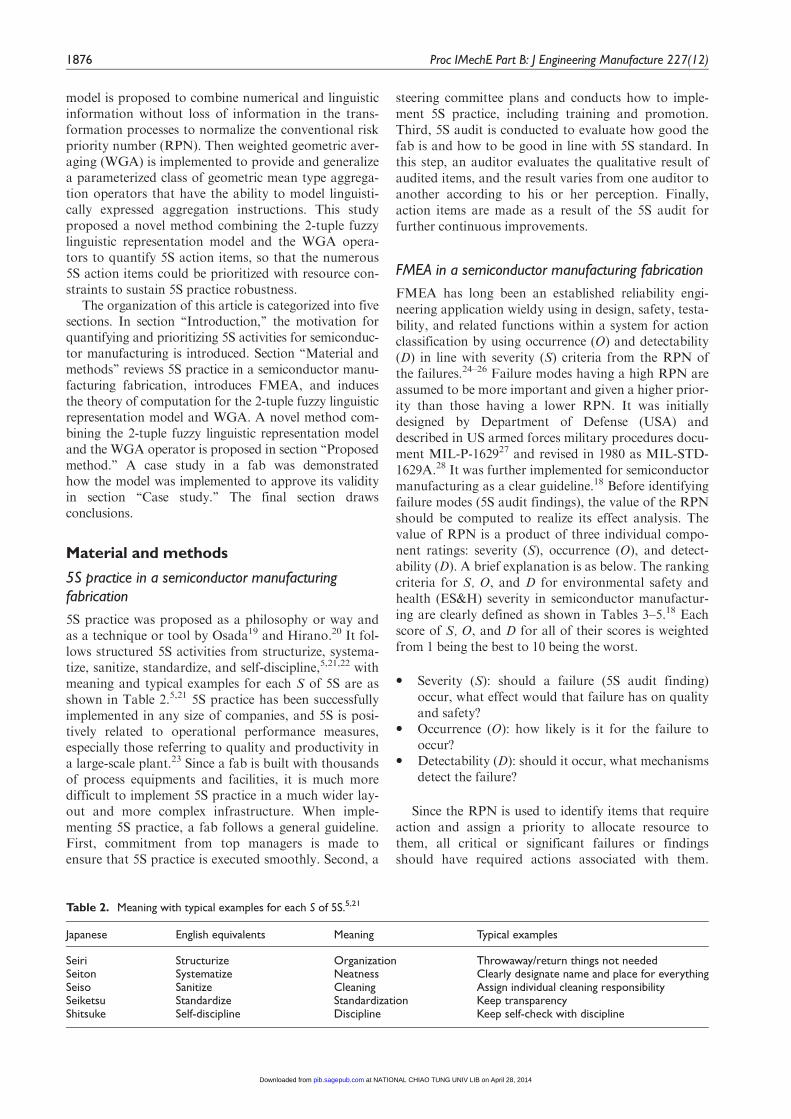
5S practice was proposed as a philosophy or way andas a technique or tool by Osada19 and Hirano.20 It fol-lows structured 5S activities from structurize, systema-tize, sanitize, standardize, and self-discipline,5,21,22 withmeaning and typical examples for each S of 5S are asshown in Table 2.5,21 5S practice has been successfullyimplemented in any size of companies, and 5S is posi-tively related to operational performance measures,especially those referring to quality and productivity ina large-scale plant.23 Since a fab is built with thousandsof process equipments and facilities, it is much moredifficult to implement 5S practice in a much wider lay-out and more complex infrastructure. When imple-menting 5S practice, a fab follows a general guideline.First, commitment from top managers is made toensure that 5S practice is executed smoothly. Second, a
steering committee plans and conducts how to imple-ment 5S practice, including training and promotion.Third, 5S audit is conducted to evaluate how good thefab is and how to be good in line with 5S standard. Inthis step, an auditor evaluates the qualitative result ofaudited items, and the result varies from one auditor toanother according to his or her perception. Finally,action items are made as a result of the 5S audit forfurther continuous improvements.
FMEA in a semiconductor manufacturing fabrication
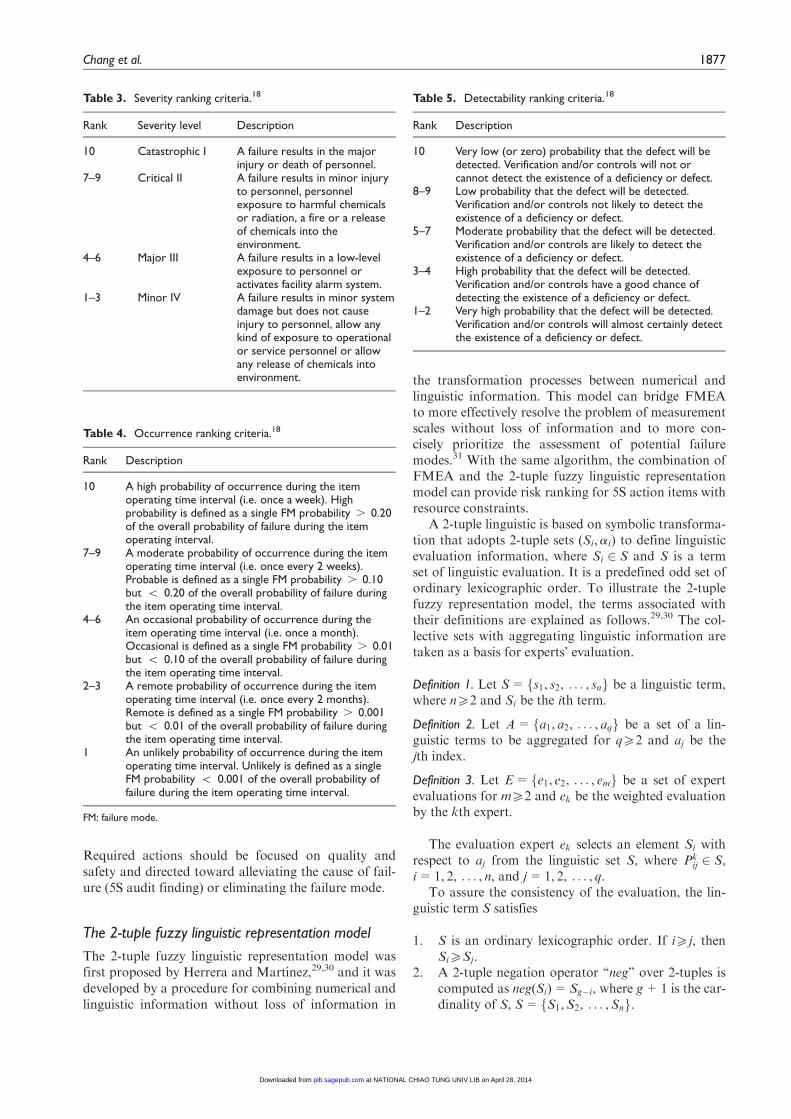
FMEA has long been an established reliability engi-neering application wieldy using in design, safety, testa-bility, and related functions within a system for actionclassification by using occurrence (O) and detectability(D) in line with severity (S) criteria from the RPN ofthe failures.24–26 Failure modes having a high RPN areassumed to be more important and given a higher prior-ity than those having a lower RPN. It was initiallydesigned by Department of Defense (USA) anddescribed in US armed forces military procedures docu-ment MIL-P-162927 and revised in 1980 as MIL-STD-1629A.28 It was further implemented for semiconductormanufacturing as a clear guideline.18 Before identifyingfailure modes (5S audit findings), the value of the RPNshould be computed to realize its effect analysis. Thevalue of RPN is a product of three individual compo-nent ratings: severity (S), occurrence (O), and detect-ability (D). A brief explanation is as below. The rankingcriteria for S, O, and D for environmental safety andhealth (ES&H) severity in semiconductor manufactur-ing are clearly defined as shown in Tables 3–5.18 Eachscore of S, O, and D for all of their scores is weightedfrom 1 being the best to 10 being the worst.
� Severity (S): should a failure (5S audit finding)occur, what effect would that failure has on qualityand safety?
� Occurrence (O): how likely is it for the failure tooccur?
� Detectability (D): should it occur, what mechanismsdetect the failure?
Since the RPN is used to identify items that requireaction and assign a priority to allocate resource tothem, all critical or significant failures or findingsshould have required actions associated with them.
Table 2. Meaning with typical examples for each S of 5S.5,21
Japanese English equivalents Meaning Typical examples
Seiri Structurize Organization Throwaway/return things not neededSeiton Systematize Neatness Clearly designate name and place for everythingSeiso Sanitize Cleaning Assign individual cleaning responsibilitySeiketsu Standardize Standardization Keep transparencyShitsuke Self-discipline Discipline Keep self-check with discipline
1876 Proc IMechE Part B: J Engineering Manufacture 227(12)
at NATIONAL CHIAO TUNG UNIV LIB on April 28, 2014pib.sagepub.comDownloaded from
Required actions should be focused on quality andsafety and directed toward alleviating the cause of fail-ure (5S audit finding) or eliminating the failure mode.
The 2-tuple fuzzy linguistic representation model
The 2-tuple fuzzy linguistic representation model wasfirst proposed by Herrera and Martınez,29,30 and it wasdeveloped by a procedure for combining numerical andlinguistic information without loss of information in
the transformation processes between numerical andlinguistic information. This model can bridge FMEAto more effectively resolve the problem of measurementscales without loss of information and to more con-cisely prioritize the assessment of potential failuremodes.31 With the same algorithm, the combination ofFMEA and the 2-tuple fuzzy linguistic representationmodel can provide risk ranking for 5S action items withresource constraints.
A 2-tuple linguistic is based on symbolic transforma-tion that adopts 2-tuple sets (Si,ai) to define linguisticevaluation information, where Si 2 S and S is a termset of linguistic evaluation. It is a predefined odd set ofordinary lexicographic order. To illustrate the 2-tuplefuzzy representation model, the terms associated withtheir definitions are explained as follows.29,30 The col-lective sets with aggregating linguistic information aretaken as a basis for experts’ evaluation.
Definition 1. Let S= fs1, s2, . . . , sng be a linguistic term,where n52 and Si be the ith term.
Definition 2. Let A= fa1, a2, . . . , aqg be a set of a lin-guistic terms to be aggregated for q52 and aj be thejth index.
Definition 3. Let E= fe1, e2, . . . , emg be a set of expertevaluations for m52 and ek be the weighted evaluationby the kth expert.
The evaluation expert ek selects an element Si withrespect to aj from the linguistic set S, where Pk
ij 2 S,i=1, 2, . . . , n, and j=1, 2, . . . , q.
To assure the consistency of the evaluation, the lin-guistic term S satisfies
1. S is an ordinary lexicographic order. If i5j, thenSi5Sj.
2. A 2-tuple negation operator ‘‘neg’’ over 2-tuples iscomputed as neg(Si)=Sg�i, where g+1 is the car-dinality of S, S= fS1,S2, . . . ,Sng.
Table 3. Severity ranking criteria.18
Rank Severity level Description
10 Catastrophic I A failure results in the majorinjury or death of personnel.
7–9 Critical II A failure results in minor injuryto personnel, personnelexposure to harmful chemicalsor radiation, a fire or a releaseof chemicals into theenvironment.
4–6 Major III A failure results in a low-levelexposure to personnel oractivates facility alarm system.
1–3 Minor IV A failure results in minor systemdamage but does not causeinjury to personnel, allow anykind of exposure to operationalor service personnel or allowany release of chemicals intoenvironment.
Table 4. Occurrence ranking criteria.18
Rank Description
10 A high probability of occurrence during the itemoperating time interval (i.e. once a week). Highprobability is defined as a single FM probability . 0.20of the overall probability of failure during the itemoperating interval.
7–9 A moderate probability of occurrence during the itemoperating time interval (i.e. once every 2 weeks).Probable is defined as a single FM probability . 0.10but \ 0.20 of the overall probability of failure duringthe item operating time interval.
4–6 An occasional probability of occurrence during theitem operating time interval (i.e. once a month).Occasional is defined as a single FM probability . 0.01but \ 0.10 of the overall probability of failure duringthe item operating time interval.
2–3 A remote probability of occurrence during the itemoperating time interval (i.e. once every 2 months).Remote is defined as a single FM probability . 0.001but \ 0.01 of the overall probability of failure duringthe item operating time interval.
1 An unlikely probability of occurrence during the itemoperating time interval. Unlikely is defined as a singleFM probability \ 0.001 of the overall probability offailure during the item operating time interval.
FM: failure mode.
Table 5. Detectability ranking criteria.18
Rank Description
10 Very low (or zero) probability that the defect will bedetected. Verification and/or controls will not orcannot detect the existence of a deficiency or defect.
8–9 Low probability that the defect will be detected.Verification and/or controls not likely to detect theexistence of a deficiency or defect.
5–7 Moderate probability that the defect will be detected.Verification and/or controls are likely to detect theexistence of a deficiency or defect.
3–4 High probability that the defect will be detected.Verification and/or controls have a good chance ofdetecting the existence of a deficiency or defect.
1–2 Very high probability that the defect will be detected.Verification and/or controls will almost certainly detectthe existence of a deficiency or defect.
Chang et al. 1877
at NATIONAL CHIAO TUNG UNIV LIB on April 28, 2014pib.sagepub.comDownloaded from

3. A maximization and a minimization operators aredefined as max (Si,Sj)=Si and min(Si,Sj)=Sj,respectively, where Si5Sj.
After the symbolic translation is analyzed, the2-tuple linguistic term with associated operators is pre-sented for further computational techniques to operatewith the 2-tuples without information loss.
Definition 4. The symbolic translation of a linguistic termset Si 2 S that can be transformed to linguistic term bythe function u to obtain as follows32
u : S! S3 ½�0:5, 0:5)u Sið Þ= Si, uð Þ, Si 2 S ð1Þ
Definition 5. Let S= fS0,S1, . . . ,Sgg be a linguistic termset and b 2 ½0, g� be a value expressing the result of asymbolic aggregation operation, such that 2-tuple rep-resents the equivalent information to b is obtainedfrom the following function D32
D : 0, g½ � ! S3 �0:5, 0:5½ Þ ð2Þ
D(b)= (Si,a), withsi, i= round(b)
a=b� i,a 2 ½�0:5, 0:5)
�
where round is the rounding operation, Si has the clo-sest index label to a, and b is the value of the symbolictranslation.
Definition 6. Let S= fS0,S1, . . . ,Sgg be a linguistic termset and (Si,a) be a 2-tuple. The negation function isD�1 from a 2-tuple, and it returns its equivalent numer-ical value b 2 ½0, g�,32 that is
D�1 : S3 ½�0:5, 0:5)! ½0, g�D�1(si,a)= i+ai =b ð3Þ
Definition 7. Let X= f(r1,a1), (r2,a2), . . . , (rn,an)g be aset of 2-tuples and W=(w1,w2, . . . ,wn),wi 2 ½0, 1� betheir associated weights. The 2-tuple weighted arith-metic mean X
e
w is calculated as follows32
Xe
w ri,aið Þ,wi½ �=D
PIi=1
D�1 ri,aið Þ � wi
PIi=1
wi
0BBB@
1CCCA
=D
PIi=1
D�1bi � wi
PIi=1
wi
0BBB@
1CCCA ð4Þ
Definition 8. Let X= (r1,a1), (r2,a2), . . . , (rn,an)f g be aset of 2-tuples and W= f(r
1,aw1), . . . , (rn,awn)g
be their associated linguistic weights. The 2-tuple lin-guistic weighted arithmetic mean X
e
lw is calculated asfollows32
Xe
lw=D
Pni=1
D�1 ri,aið Þ � D�1 wi,awið Þ
Pni=1
D�1 wi,awið Þ
0BB@
1CCA
=D
Pni=1
bi � bwi
Pni=1
bwi
0BB@
1CCA ð5Þ
The 2-tuple weighted arithmetic mean and the 2-tuple linguistic weighted arithmetic mean can computethe mean of a set of linguistic values without any lossof information.
Suppose that (si,ai) and (sj,aj) are random two 2-tuples, the assumptions will be made according to anordinary lexicographic order as follows
If i. j, then (si,ai) ‘‘.’’ (sj,aj). The symbol ‘‘.’’ means‘‘better than.’’If i= j, then
1. If ai . aj, then (si,ai) ‘‘.’’ (sj,aj). The symbol ‘‘.’’means ‘‘bigger.’’
2. If ai =aj, then (si,ai) ‘‘=’’ (sj,aj). The symbol‘‘=’’ means ‘‘equal to,’’ which represents (si,ai)and (sj,aj) share the same information.
3. If ai \ aj, then (si,ai) ‘‘\ ’’ (sj,aj). The symbol‘‘\’’ means ‘‘worse than.’’
WGA operators
Before WGA operators will be discussed, geometricaveraging (GA) is introduced and its definition for GAis explained and expressed as below.33,34
Definition 9. A GA operator of dimension n is a mappingGA: f : R+n ! R+
f(a1, a2, . . . , an)=Ynj=1
aj
!1n
ð6Þ
then f is called the GA operator.
Definition 10. A WGA operator of dimension n is a map-ping WGA35,36f : R+n ! R+
f(a1, a2, . . . , an)=Ynj=1
awj
j ð7Þ
which is associated with an exponential weighting vec-tor w=(w1,w2, . . .wn)
T of the aj, with wj 2 0, 1½ �,14j4n, and
Pnj=1 wj =1,then f is called the WGA
operator.
Proposed method
As reviewed in section ‘‘Material and methods,’’ thou-sands of 5S checkpoints must be examined in order to
1878 Proc IMechE Part B: J Engineering Manufacture 227(12)
at NATIONAL CHIAO TUNG UNIV LIB on April 28, 2014pib.sagepub.comDownloaded from

take remedial and corrective actions for continualimprovements. A method to quantify and prioritize 5Sactivities for semiconductor manufacturing was pro-posed and constructed as shown in Figure 1. It com-bined 2-tuple method and WGA operators in FMEAfor 5S audit in a fab.
Criteria of evaluation for S, O, and D
Before action requests will be quantified and prioritizedfor 5S activities, the S, O, and D for failure modes(findings) are defined with their quantified rules. Theserules are dedicated for 5S findings in semiconductormanufacturing. With the identity of subjective, linguis-tic, and qualitative characteristics for the 5S audit find-ings, the ranking criteria for S, O, and D of failuremodes (findings) are used as references per audit resultof 5S practice.
Severity (S). It is necessary that many chemicals are usedin semiconductor manufacturing, and most of them aredangerous: toxic, poisonous, corrosive, or volatile. Anyaccident or incident could cause a catastrophic result,such as human injury, fatal death, and even ecologicaldisaster. In addition to those findings associated withsafety, those involved with wafer yield are regarded asa decisive determinant due to wafers being the onlyproduct in semiconductor manufacturing. Hence, thosefindings related to the ES&H as well as wafer yield areemphasized more in the evaluation on the score ofseverity in this study. The available resources should be
allocated to those with higher S scores. For example, itis scored as 10 for severity with a finding related to thedeath of personnel. Table 6 illustrates the ranking cri-teria of 5S S score.
Occurrence (O). In the audit process of shop floor, anaudit team usually consists of 3–8 auditors accompa-nied by an escort that is teamed up with experiencedauditees from equipment, facility, and manufacturingdepartments of the auditee fab. All of these auditorshave their preferences, concerns, and attentions onwhatever or whenever they have been auditing. Thus,the auditors are altogether guided in the same auditpath to focus on the same scope as a result of yieldingsimilar findings. In the evaluation table for ranking O,the total count of finding(s) and recurrence or repeti-tion per the same finding of 5S audit are two factors todetermine the O score. For instance, the score is evalu-ated as 4 if the same findings have been found by thedifferent auditors twice. The ranking criteria of 5S Oscore are described in Table 7.
Detectability (D). Similar to the mechanisms in place (ifany) to detect a failure if it were to occur, the behaviorto detect findings is possibly subjective with respect to5S findings. Thus, the quantified rule ranks the D scorein accordance with the extent of effort to detect. Takinga pod (wafer container) as an example, the D score is 10if auditors easily detect without any effort that a pod isput on the ground, resulting in negative quality con-cerns. Table 8 states the ranking criteria of 5S D score.
Figure 1. Proposed method for quantifying and prioritizing 5S activities.GRPN: generalized risk priority number; WGA: weighted geometric averaging.
Chang et al. 1879
at NATIONAL CHIAO TUNG UNIV LIB on April 28, 2014pib.sagepub.comDownloaded from

Procedure for generalized RPN by 2-tuple and WGA
Now that the S, O, and D can be numericalized basedon the predefined rule as Tables 5–7, a generalizedRPN (GRPN) can be transformed to a specific numberbased on conventional RPN calculation (S3O3D).However, the conventional RPN lacks of all compre-hensive information and misleads to bias for not con-sidering weights for each S, O, and D. This GRPNmethodology can be compensated by the 2-tuplemethod and WGA operators to resolve this problem asfollows. In the following, a stepwise (Steps 1–4) proce-dure was proposed to be further followed for quantify-ing and prioritizing 5S activities, and each of the RPNscore is revisited and computed to yield GRPN by the2-tuple method and WGA operators. According to theRPN, all scores can be ranked in descendent order andavailable resource should be allocated based onGRPNs with higher numbers, meaning that the 5Sfindings with higher GRPNs require action requestfirst.
Step 1: record of 5S findings. At this step, an actual one-shoot audit for 5S practice was conducted by differentauditors. Each of these auditors would be distributedwith a blank paper to record whatever and wheneverthey had been auditing during the auditing. To preventthe failure modes (findings) from diversity and variety,the escort team was built to guide the audited route formore focused checkpoints in such a large fabrication.By doing so, the result of failure modes (findings)would be more objective and aligned. For example, allof these auditors were brought to lithography area bythe escort team, and they would record whether theusage of photo resist (PR) was complied with the PRmanagement, for example, the expiry date of the chemi-cal, first-in-first-out inventory, and cleanliness of PRcabinet.
Table 6. Ranking criteria of 5S severity.
Rank Criteria of evaluation(linguistic statement)
Quantified rule (impact onsafety and quality)
10 Completelyunacceptable
Noncompliance withgovernment regulation, deathof personnel, or a batch ofscrapped wafers
9 Catastrophic Out of control on any humanor ecological hazardsassociated withmanufacturing or a batch ofscrapped wafers
8 Disastrous Failure to follow safetyprocedures endangering thepublic at large or scrappedwafers
7 Terrible Significant loss of function onsafety and quality
6 Critical Failure to follow safetyprocedures potentiallyendangering workers orpotentially scrapped wafers
5 Serious Noticeable impact to safetyand quality but can berecovered by continuousimprovement
4 Minor Little impact to personnelinjury or wafer quality
3 Very minor A very minor impactto affect safety andwafers
2 Negligible A trivia finding unworthy tocorrect due to resourceconstraints
1 No impact Barely impact
Table 7. Ranking criteria of 5S occurrence.
Rank Criteria ofevaluation (totalcount of finding(s)per audit)
Quantified rule (recurrence orrepetition of the same finding)
10 Frequent: fivetimes of findings
The same findings have beenfound by the different auditors.
9 The same findings have beenfound by the same auditor.
8 Probable: fourtimes of findings
The same findings have beenfound by the different auditors.
7 The same findings have beenfound by the same auditor.
6 Occasional: threetimes of findings
The same findings have beenfound by the different auditors.
5 The same findings have beenfound by the same auditor.
4 Remote: twice offindings
The same findings have beenfound by the different auditors.
3 The same findings have beenfound by the same auditor.
2 Improbable: onceof finding
The same finding has been foundonce.
1 Never: none ofoccurrence
The finding has never beenfound regardless of the amountof auditors.
Table 8. Ranking criteria of 5S detectability.
Rank Criteria of evaluation(subjective viewpoint)
Quantified rule (theextent of efforts todetect)
10 Completely certain Without any efforts at all9 Fairly certain With very little efforts8 Almost certain With somewhat little
effort7 Almost somewhat certain With little efforts6 Moderately certain With further very little
efforts5 Very moderate certain With further somewhat
little efforts4 Low certain With further little efforts3 Very low certain With further somewhat
much efforts2 Potentially certain With further much
efforts1 Completely certain With all efforts to make
1880 Proc IMechE Part B: J Engineering Manufacture 227(12)
at NATIONAL CHIAO TUNG UNIV LIB on April 28, 2014pib.sagepub.comDownloaded from
Step 2: computation of GRPN by 2-tuple method withWGA. Once all findings were listed and recorded, allRPNs with possibly different values at the same findingwould be calculated by the 2-tuple method from differentauditors with their weighted values (by WGA operators)for S, O, and D to obtain a GRPN in the one-shootaudit. Taking a finding on wafer mask management bythree auditors as an example, these auditors evaluate theoverall status for wafer masks and record all scores of S,O, and D. Then each S, O, and D will be calculated bythe 2-tuple method to induce a new value for each.Before computing the new value by WGA, each of S, O,and D will be assigned a weight ranging from 0.1 to 0.8,depending on how significant the S, O, and D are to thefab. Finally, each new value of S, O, and D will be com-puted by WGA to obtain a GRPN for the finding.
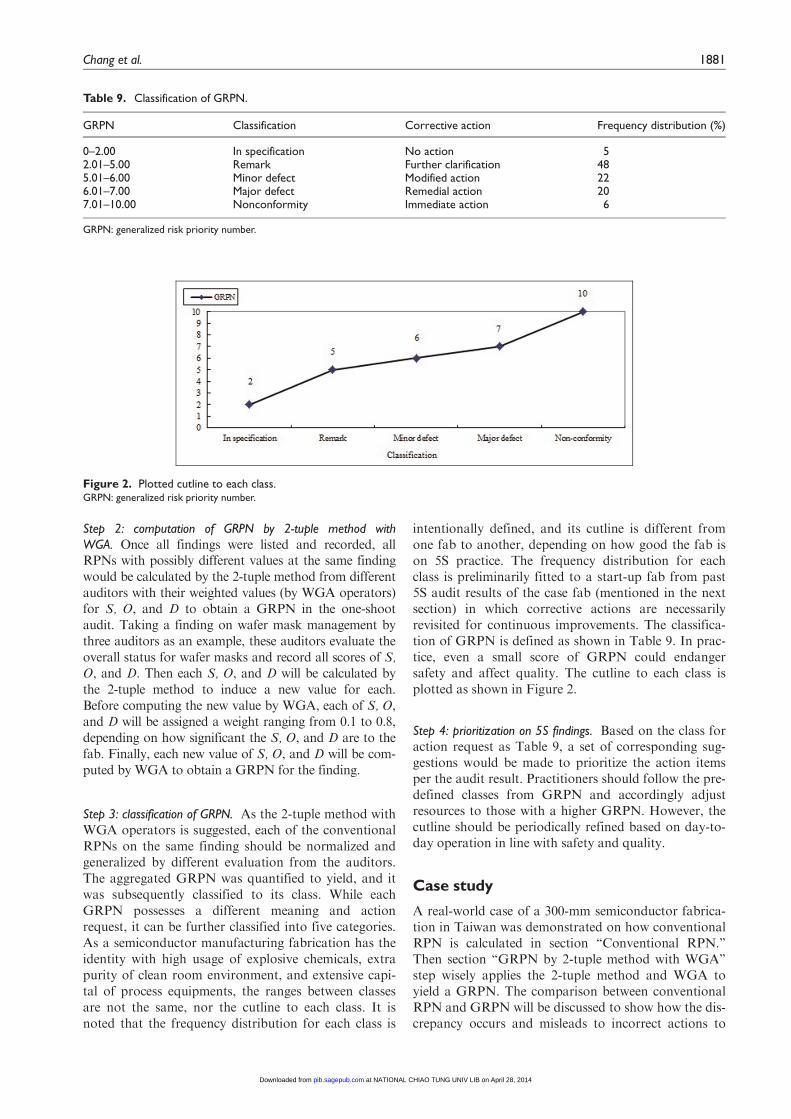
Step 3: classification of GRPN. As the 2-tuple method withWGA operators is suggested, each of the conventionalRPNs on the same finding should be normalized andgeneralized by different evaluation from the auditors.The aggregated GRPN was quantified to yield, and itwas subsequently classified to its class. While eachGRPN possesses a different meaning and actionrequest, it can be further classified into five categories.As a semiconductor manufacturing fabrication has theidentity with high usage of explosive chemicals, extrapurity of clean room environment, and extensive capi-tal of process equipments, the ranges between classesare not the same, nor the cutline to each class. It isnoted that the frequency distribution for each class is
intentionally defined, and its cutline is different fromone fab to another, depending on how good the fab ison 5S practice. The frequency distribution for eachclass is preliminarily fitted to a start-up fab from past5S audit results of the case fab (mentioned in the nextsection) in which corrective actions are necessarilyrevisited for continuous improvements. The classifica-tion of GRPN is defined as shown in Table 9. In prac-tice, even a small score of GRPN could endangersafety and affect quality. The cutline to each class isplotted as shown in Figure 2.
Step 4: prioritization on 5S findings. Based on the class foraction request as Table 9, a set of corresponding sug-gestions would be made to prioritize the action itemsper the audit result. Practitioners should follow the pre-defined classes from GRPN and accordingly adjustresources to those with a higher GRPN. However, thecutline should be periodically refined based on day-to-day operation in line with safety and quality.
Case study
A real-world case of a 300-mm semiconductor fabrica-tion in Taiwan was demonstrated on how conventionalRPN is calculated in section ‘‘Conventional RPN.’’Then section ‘‘GRPN by 2-tuple method with WGA’’step wisely applies the 2-tuple method and WGA toyield a GRPN. The comparison between conventionalRPN and GRPN will be discussed to show how the dis-crepancy occurs and misleads to incorrect actions to
Table 9. Classification of GRPN.
GRPN Classification Corrective action Frequency distribution (%)
0–2.00 In specification No action 52.01–5.00 Remark Further clarification 485.01–6.00 Minor defect Modified action 226.01–7.00 Major defect Remedial action 207.01–10.00 Nonconformity Immediate action 6
GRPN: generalized risk priority number.
Figure 2. Plotted cutline to each class.GRPN: generalized risk priority number.
Chang et al. 1881
at NATIONAL CHIAO TUNG UNIV LIB on April 28, 2014pib.sagepub.comDownloaded from
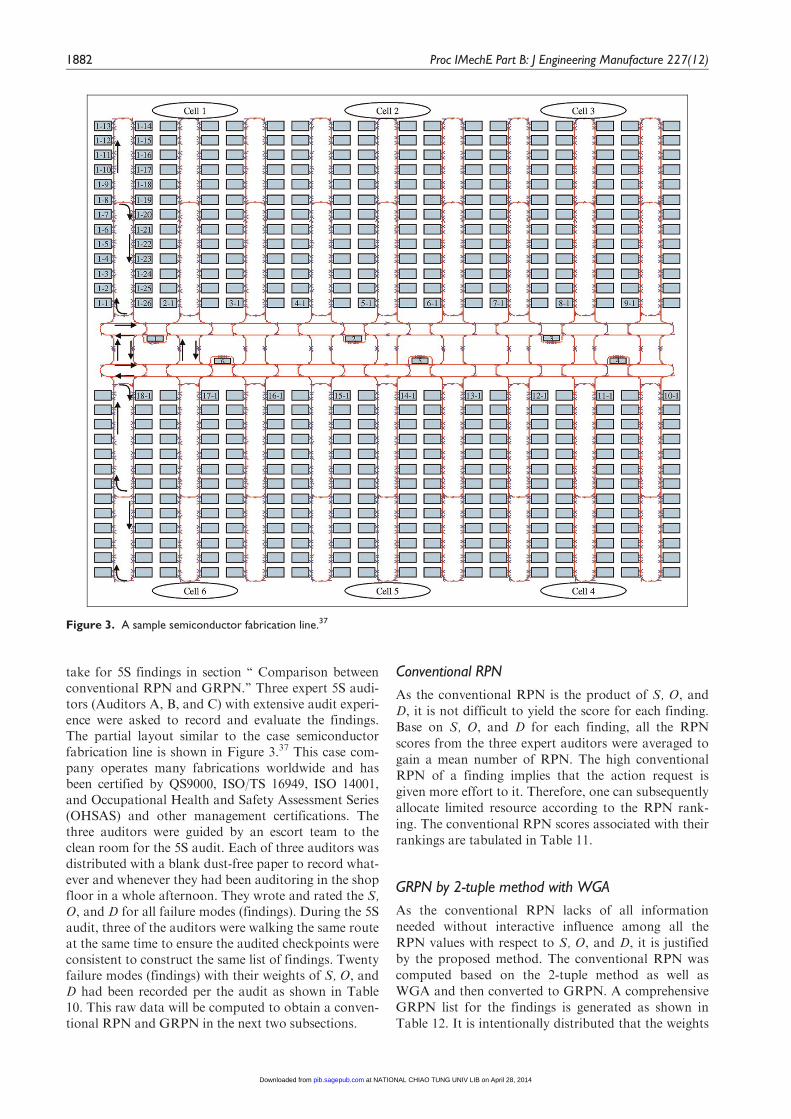
take for 5S findings in section ‘‘ Comparison betweenconventional RPN and GRPN.’’ Three expert 5S audi-tors (Auditors A, B, and C) with extensive audit experi-ence were asked to record and evaluate the findings.The partial layout similar to the case semiconductorfabrication line is shown in Figure 3.37 This case com-pany operates many fabrications worldwide and hasbeen certified by QS9000, ISO/TS 16949, ISO 14001,and Occupational Health and Safety Assessment Series(OHSAS) and other management certifications. Thethree auditors were guided by an escort team to theclean room for the 5S audit. Each of three auditors wasdistributed with a blank dust-free paper to record what-ever and whenever they had been auditoring in the shopfloor in a whole afternoon. They wrote and rated the S,O, and D for all failure modes (findings). During the 5Saudit, three of the auditors were walking the same routeat the same time to ensure the audited checkpoints wereconsistent to construct the same list of findings. Twentyfailure modes (findings) with their weights of S, O, andD had been recorded per the audit as shown in Table10. This raw data will be computed to obtain a conven-tional RPN and GRPN in the next two subsections.
Conventional RPN
As the conventional RPN is the product of S, O, andD, it is not difficult to yield the score for each finding.Base on S, O, and D for each finding, all the RPNscores from the three expert auditors were averaged togain a mean number of RPN. The high conventionalRPN of a finding implies that the action request isgiven more effort to it. Therefore, one can subsequentlyallocate limited resource according to the RPN rank-ing. The conventional RPN scores associated with theirrankings are tabulated in Table 11.
GRPN by 2-tuple method with WGA
As the conventional RPN lacks of all informationneeded without interactive influence among all theRPN values with respect to S, O, and D, it is justifiedby the proposed method. The conventional RPN wascomputed based on the 2-tuple method as well asWGA and then converted to GRPN. A comprehensiveGRPN list for the findings is generated as shown inTable 12. It is intentionally distributed that the weights
Figure 3. A sample semiconductor fabrication line.37
1882 Proc IMechE Part B: J Engineering Manufacture 227(12)
at NATIONAL CHIAO TUNG UNIV LIB on April 28, 2014pib.sagepub.comDownloaded from
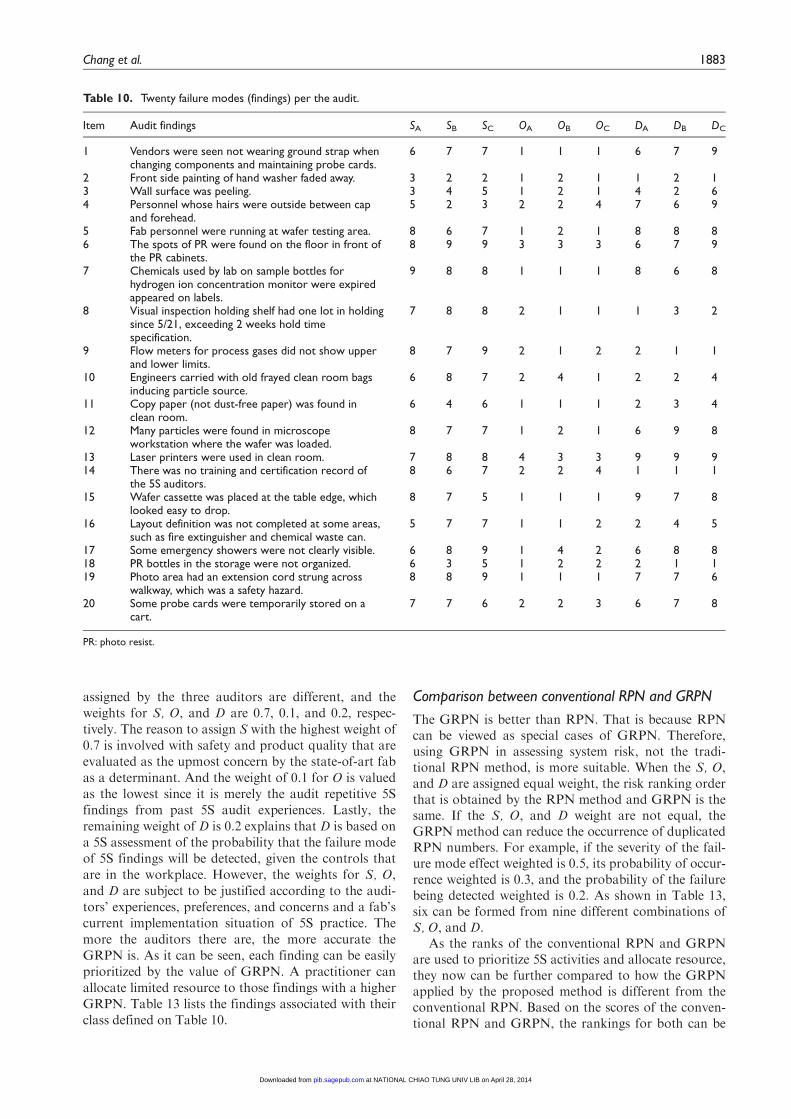
assigned by the three auditors are different, and theweights for S, O, and D are 0.7, 0.1, and 0.2, respec-tively. The reason to assign S with the highest weight of0.7 is involved with safety and product quality that areevaluated as the upmost concern by the state-of-art fabas a determinant. And the weight of 0.1 for O is valuedas the lowest since it is merely the audit repetitive 5Sfindings from past 5S audit experiences. Lastly, theremaining weight of D is 0.2 explains that D is based ona 5S assessment of the probability that the failure modeof 5S findings will be detected, given the controls thatare in the workplace. However, the weights for S, O,and D are subject to be justified according to the audi-tors’ experiences, preferences, and concerns and a fab’scurrent implementation situation of 5S practice. Themore the auditors there are, the more accurate theGRPN is. As it can be seen, each finding can be easilyprioritized by the value of GRPN. A practitioner canallocate limited resource to those findings with a higherGRPN. Table 13 lists the findings associated with theirclass defined on Table 10.
Comparison between conventional RPN and GRPN
The GRPN is better than RPN. That is because RPNcan be viewed as special cases of GRPN. Therefore,using GRPN in assessing system risk, not the tradi-tional RPN method, is more suitable. When the S, O,and D are assigned equal weight, the risk ranking orderthat is obtained by the RPN method and GRPN is thesame. If the S, O, and D weight are not equal, theGRPN method can reduce the occurrence of duplicatedRPN numbers. For example, if the severity of the fail-ure mode effect weighted is 0.5, its probability of occur-rence weighted is 0.3, and the probability of the failurebeing detected weighted is 0.2. As shown in Table 13,six can be formed from nine different combinations ofS, O, and D.
As the ranks of the conventional RPN and GRPNare used to prioritize 5S activities and allocate resource,they now can be further compared to how the GRPNapplied by the proposed method is different from theconventional RPN. Based on the scores of the conven-tional RPN and GRPN, the rankings for both can be
Table 10. Twenty failure modes (findings) per the audit.
Item Audit findings SA SB SC OA OB OC DA DB DC
1 Vendors were seen not wearing ground strap whenchanging components and maintaining probe cards.
6 7 7 1 1 1 6 7 9
2 Front side painting of hand washer faded away. 3 2 2 1 2 1 1 2 13 Wall surface was peeling. 3 4 5 1 2 1 4 2 64 Personnel whose hairs were outside between cap
and forehead.5 2 3 2 2 4 7 6 9
5 Fab personnel were running at wafer testing area. 8 6 7 1 2 1 8 8 86 The spots of PR were found on the floor in front of
the PR cabinets.8 9 9 3 3 3 6 7 9
7 Chemicals used by lab on sample bottles forhydrogen ion concentration monitor were expiredappeared on labels.
9 8 8 1 1 1 8 6 8
8 Visual inspection holding shelf had one lot in holdingsince 5/21, exceeding 2 weeks hold timespecification.
7 8 8 2 1 1 1 3 2
9 Flow meters for process gases did not show upperand lower limits.
8 7 9 2 1 2 2 1 1
10 Engineers carried with old frayed clean room bagsinducing particle source.
6 8 7 2 4 1 2 2 4
11 Copy paper (not dust-free paper) was found inclean room.
6 4 6 1 1 1 2 3 4
12 Many particles were found in microscopeworkstation where the wafer was loaded.
8 7 7 1 2 1 6 9 8
13 Laser printers were used in clean room. 7 8 8 4 3 3 9 9 914 There was no training and certification record of
the 5S auditors.8 6 7 2 2 4 1 1 1
15 Wafer cassette was placed at the table edge, whichlooked easy to drop.
8 7 5 1 1 1 9 7 8
16 Layout definition was not completed at some areas,such as fire extinguisher and chemical waste can.
5 7 7 1 1 2 2 4 5
17 Some emergency showers were not clearly visible. 6 8 9 1 4 2 6 8 818 PR bottles in the storage were not organized. 6 3 5 1 2 2 2 1 119 Photo area had an extension cord strung across
walkway, which was a safety hazard.8 8 9 1 1 1 7 7 6
20 Some probe cards were temporarily stored on acart.
7 7 6 2 2 3 6 7 8
PR: photo resist.
Chang et al. 1883
at NATIONAL CHIAO TUNG UNIV LIB on April 28, 2014pib.sagepub.comDownloaded from
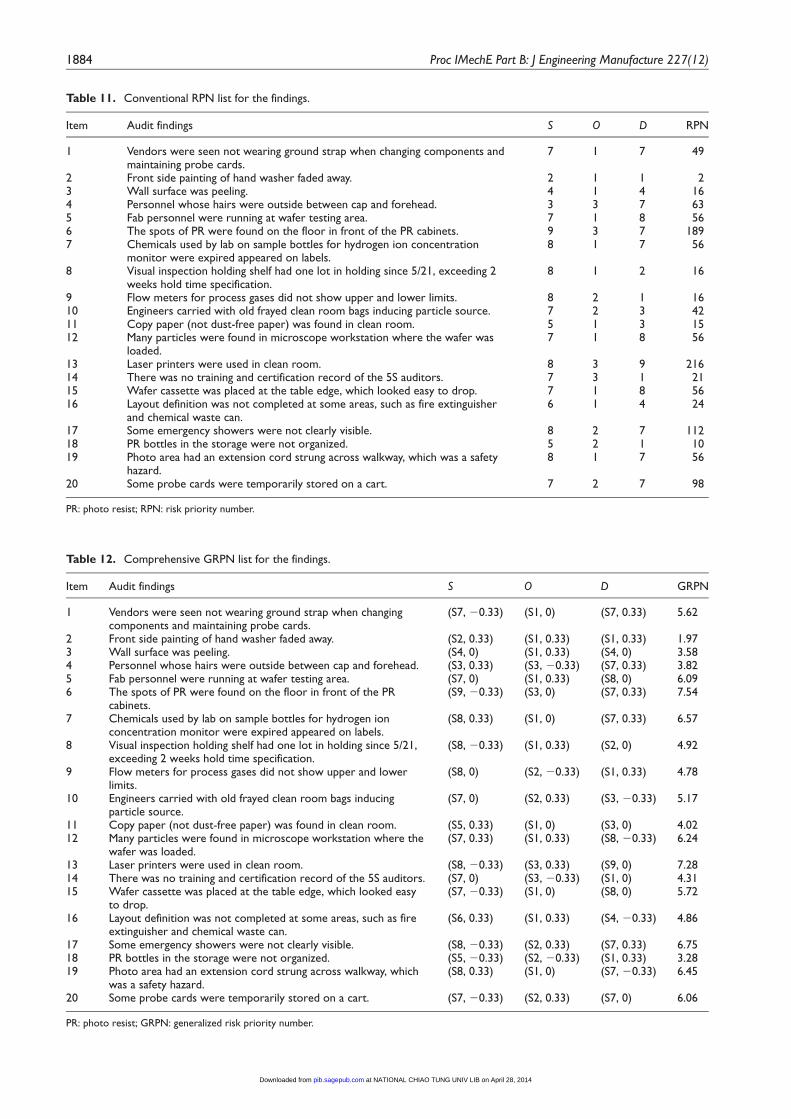
Table 11. Conventional RPN list for the findings.
Item Audit findings S O D RPN
1 Vendors were seen not wearing ground strap when changing components andmaintaining probe cards.
7 1 7 49
2 Front side painting of hand washer faded away. 2 1 1 23 Wall surface was peeling. 4 1 4 164 Personnel whose hairs were outside between cap and forehead. 3 3 7 635 Fab personnel were running at wafer testing area. 7 1 8 566 The spots of PR were found on the floor in front of the PR cabinets. 9 3 7 1897 Chemicals used by lab on sample bottles for hydrogen ion concentration
monitor were expired appeared on labels.8 1 7 56
8 Visual inspection holding shelf had one lot in holding since 5/21, exceeding 2weeks hold time specification.
8 1 2 16
9 Flow meters for process gases did not show upper and lower limits. 8 2 1 1610 Engineers carried with old frayed clean room bags inducing particle source. 7 2 3 4211 Copy paper (not dust-free paper) was found in clean room. 5 1 3 1512 Many particles were found in microscope workstation where the wafer was
loaded.7 1 8 56
13 Laser printers were used in clean room. 8 3 9 21614 There was no training and certification record of the 5S auditors. 7 3 1 2115 Wafer cassette was placed at the table edge, which looked easy to drop. 7 1 8 5616 Layout definition was not completed at some areas, such as fire extinguisher
and chemical waste can.6 1 4 24
17 Some emergency showers were not clearly visible. 8 2 7 11218 PR bottles in the storage were not organized. 5 2 1 1019 Photo area had an extension cord strung across walkway, which was a safety
hazard.8 1 7 56
20 Some probe cards were temporarily stored on a cart. 7 2 7 98
PR: photo resist; RPN: risk priority number.
Table 12. Comprehensive GRPN list for the findings.
Item Audit findings S O D GRPN
1 Vendors were seen not wearing ground strap when changingcomponents and maintaining probe cards.
(S7, 20.33) (S1, 0) (S7, 0.33) 5.62
2 Front side painting of hand washer faded away. (S2, 0.33) (S1, 0.33) (S1, 0.33) 1.973 Wall surface was peeling. (S4, 0) (S1, 0.33) (S4, 0) 3.584 Personnel whose hairs were outside between cap and forehead. (S3, 0.33) (S3, 20.33) (S7, 0.33) 3.825 Fab personnel were running at wafer testing area. (S7, 0) (S1, 0.33) (S8, 0) 6.096 The spots of PR were found on the floor in front of the PR
cabinets.(S9, 20.33) (S3, 0) (S7, 0.33) 7.54
7 Chemicals used by lab on sample bottles for hydrogen ionconcentration monitor were expired appeared on labels.
(S8, 0.33) (S1, 0) (S7, 0.33) 6.57
8 Visual inspection holding shelf had one lot in holding since 5/21,exceeding 2 weeks hold time specification.
(S8, 20.33) (S1, 0.33) (S2, 0) 4.92
9 Flow meters for process gases did not show upper and lowerlimits.
(S8, 0) (S2, 20.33) (S1, 0.33) 4.78
10 Engineers carried with old frayed clean room bags inducingparticle source.
(S7, 0) (S2, 0.33) (S3, 20.33) 5.17
11 Copy paper (not dust-free paper) was found in clean room. (S5, 0.33) (S1, 0) (S3, 0) 4.0212 Many particles were found in microscope workstation where the
wafer was loaded.(S7, 0.33) (S1, 0.33) (S8, 20.33) 6.24
13 Laser printers were used in clean room. (S8, 20.33) (S3, 0.33) (S9, 0) 7.2814 There was no training and certification record of the 5S auditors. (S7, 0) (S3, 20.33) (S1, 0) 4.3115 Wafer cassette was placed at the table edge, which looked easy
to drop.(S7, 20.33) (S1, 0) (S8, 0) 5.72
16 Layout definition was not completed at some areas, such as fireextinguisher and chemical waste can.
(S6, 0.33) (S1, 0.33) (S4, 20.33) 4.86
17 Some emergency showers were not clearly visible. (S8, 20.33) (S2, 0.33) (S7, 0.33) 6.7518 PR bottles in the storage were not organized. (S5, 20.33) (S2, 20.33) (S1, 0.33) 3.2819 Photo area had an extension cord strung across walkway, which
was a safety hazard.(S8, 0.33) (S1, 0) (S7, 20.33) 6.45
20 Some probe cards were temporarily stored on a cart. (S7, 20.33) (S2, 0.33) (S7, 0) 6.06
PR: photo resist; GRPN: generalized risk priority number.
1884 Proc IMechE Part B: J Engineering Manufacture 227(12)
at NATIONAL CHIAO TUNG UNIV LIB on April 28, 2014pib.sagepub.comDownloaded from

compared as shown in Table 14 to approve GRPN ismore reliable than the conventional RPN. For example,the corrective action can be mistaken by the conven-tional RPN with a rank of 14, instead of GRPN with arank of 4, in the item 4 ‘‘Personnel whose hair was
outside between cap and forehead.’’ A typical 28-nmprocess wafer is made by over 1500 workstations/machines in manufacturing process in the clean roomof a fab. Clean room condition (Class 100) is necessaryfor this extra-pure manufacturing process to ensure
Table 13. Combinations of S, O, and D that yield an RPN of 6.
S O D Arithmetic average method Geometric average method
1 1 6 0.18 0.361 2 3 0.18 1.531 3 2 0.18 1.601 6 1 0.18 1.712 1 3 0.18 1.762 3 1 0.18 1.973 1 2 0.18 1.993 2 1 0.18 2.136 1 1 0.18 2.45
Table 14. Comparison between conventional RPN and GRPN for the findings.
Item Audit findings Class Corrective action Rank (RPN) Rank (GRPN)
1 Vendors were seen not wearing ground strapwhen changing components and maintainingprobe cards.
Minor defect Modified action 10 11
2 Front side painting of hand washer faded away. In specification No action 1 13 Wall surface was peeling. Remark Further clarification 7 34 Personnel whose hairs were outside between
cap and forehead.Remark Further clarification 14 4
5 Fab personnel were running at wafer testingarea.
Major defect Remedial action 15 14
6 The spots of PR were found on the floor in frontof the PR cabinets.
Nonconformity Immediate action 19 20
7 Chemical used by lab on sample bottles for ionconcentration monitor were expired appearedon labels.
Major defect Remedial action 13 17
8 Visual inspection holding shelf had one lot inholding since 5/21, exceeding 2 weeks hold timespecification.
Remark Further clarification 4 9
9 Flow meters for process gases did not showupper and lower limits.
Remark Further clarification 6 7
10 Engineers carried with old frayed clean roombags inducing particle source.
Minor defect Modified action 9 10
11 Copy paper (not dust-free paper) was found inclean room.
Remark Further clarification 3 5
12 Many particles were found in microscopeworkstation where the wafer was loaded.
Major defect Remedial action 16 15
13 Laser printers were used in clean room. Nonconformity Immediate action 20 1914 There was no training and certification record of
the 5S auditors.Remark Further clarification 5 6
15 Wafer cassette was placed at the table edge,which looked easy to drop.
Minor defect Modified action 11 12
16 Layout definition was not completed at someareas, such as fire extinguisher and chemicalwaste can.
Remark Further clarification 8 8
17 Some emergency showers were not clearlyvisible.
Major defect Remedial action 18 18
18 PR bottles in the storage were not organized. Remark Further clarification 2 219 Photo area had an extension cord strung across
walkway, which was a safety hazard.Major defect Remedial action 12 16
20 Some probe cards were temporarily stored on acart.
Major defect Remedial action 17 13
PR: photo resist; RPN: risk priority number; GRPN: generalized risk priority number.
Chang et al. 1885
at NATIONAL CHIAO TUNG UNIV LIB on April 28, 2014pib.sagepub.comDownloaded from
that the wafer and its mask (customer’s property) arenot additionally contaminated in such a complex pro-cess. It is noted that a Class 100 clean room is designedto never allow more than 100 particles (0.5mm diameteror larger) per cubic foot of air while human hair isabout 100mm. Thus, the conventional RPN is misinter-preted to a fab, and the rank is comparatively lowregardless that human hair can possibly drop on thewafer surface and result in a decisive contaminationsource to kill product yield. However, the proposedGRPN can detect the severity from its value and allo-cate the right resource to the right place at the first timefor a corrective action request. Another example is inthe item 7 ‘‘Chemicals used by the lab have sample bot-tles for hydrogen ion concentration monitor expired asshown on the labels.’’ Although chemicals are highlyutilized in a fab, not all of them endanger safety. Theusual means of expressing the hydrogen ion concentra-tion is pH, which is defined as the negative logarithmof the hydrogen ion concentration, to measure acidityor alkalinity. Thus, the expired chemical of hydrogenion concentration at most misinterprets the value ofacidity or alkalinity that is comparably less dangerousthan those toxic, corrosive, flammable, and/or explo-sive chemicals such as hydrogen fluoride (HF), hydro-chloric acid (HCL), or sulfuric acid (H2SO4). Itimplicates that the resource should be allocated to thosechemicals with significant impact on safety since thereare a large number of chemicals used by the fab wherethey should be more focused to examine. Thus, therank by the GRPN is more practical than the one bythe conventional RPN.
Conclusion
5S practice is a baseline leading to TQM. 5S audit is toreview and examine how good the fabrication is andhow to be good. A semiconductor manufacturing fabri-cation has the identity with high usage of explosive che-micals, extra purity of clean room environment, andextensive capital of process equipments with a complexlayout. It is essential to quantify and prioritize 5S activ-ities, so that the right resource at the right time the firsttime can be allocated to 5S audit findings from thou-sands of corrective actions per 5S audit result. The con-ventional computation of RPN is unable to consider allcomprehensive information and lead to bias for notconsidering weights for each S, O, and D. A novelmethod of FMEA and 2-tuple method as well as WGAoperators was proposed to apply for 5S audit in a fabri-cation. A real-world case was drawn to demonstrate itsfeasibility based on the proposed method. Practitionerscan step wisely follow this methodology to quantifyand prioritize 5S activities with resource constraints forsemiconductor manufacturing.
Declaration of conflicting interests
The authors declare that there is no conflict of interest.
Funding
This research was financially supported by the NationalScience Council of the Republic of China under con-tract nos NSC 101-2410-H-009-005-MY2, NSC 100-2410-H-145-001, NSC 101-2410-H-145-001, and NSC102-2623-E-145-001-D.
References
1. Bullington KE. 5S for suppliers. Qual Prog 2003; 36(1):
56–59.2. Korkut DS, Cakıcıer N, Erdinler ES, et al. 5S activities
and its application at a sample company. Afr J Biotech-
nol 2009; 8(8): 1720–1728.3. Chrysler, Ford and General Motors. Quality system
requirements QS-9000 (semiconductor supplement). 3rd ed.
Chrysler, Ford and General Motors, 1998.4. Ahmed S and Mohiuddin AKM. The successful imple-
mentation of TPM in conjunction with EOM and 5S: a
case presentation. J Appl Sci 2005; 5(5): 938–951.5. Ho SKM. 5-S practice: the first step towards total quality
management. Total Qual Manage 1999; 10(3): 345–356.6. International Automotive Task Force. ISO/TS
16949:2002 Quality management systems. Quality man-
ual, 2002.7. Pheng LS. Towards TQM—integrating Japanese 5-S
principles with ISO 9001:2000 requirements. TQM Mag
2001; 13(5): 334–340.8. Becker JE. Implementing 5S to promote safety & house-
keeping. Prof Saf 2001; 46(8): 29–31.9. Cua KO, McKone KE and Schroeder RG. Relationships
between implementation of TQM, JIT, and TPM and
manufacturing performance. J Oper Manag 2001; 19(6):
675–694.10. Hendricks KB and Singhal VR. The long-run stock price
performance of firms with effective TQM programs.
Manage Sci 2001; 47(3): 359–368.11. Kartha CP. A comparison of ISO 9000:2000 quality sys-
tem standards, QS9000, ISO/TS 16949 and Baldrige cri-
teria. TQM Mag 2004; 16(5): 331–340.
12. Neghab AP, Siadat A, Tavakkoli-Moghaddam R, et al.
An integrated approach for risk-assessment analysis in a
manufacturing process using FMEA and DES. In: Pro-
ceedings of IEEE international conference on quality and
reliability (ICQR 2011), Bangkok, Thailand, 14–17 Sep-
tember 2011, pp.366–370.13. Mili A, Bassetto S, Siadat A, et al. Dynamic risk manage-
ment unveil productivity improvements. J Loss Prevent
Proc 2009; 22(1): 25–34.14. Bertolini M, Bevilacqua M, Ciarapica FE, et al. Develop-
ment of risk-based inspection and maintenance proce-
dures for an oil refinery. J Loss Prevent Proc 2009; 22(2):
244–253.15. Chang KH. Evaluate the orderings of risk for failure
problems using a more general RPN methodology.
Microelectron Reliab 2009; 49(12): 1586–1596.16. Chang KH and Cheng CH. Evaluating the risk of failure
using the fuzzy OWA and DEMATEL method. J Intell
Manuf 2011; 22(2): 113–129.17. Chang KH, Chang YC and Tsai IT. Enhancing FMEA
assessment by integrating grey relational analysis and the
decision making trial and evaluation laboratory
approach. Eng Fail Anal 2013; 31: 211–224.
1886 Proc IMechE Part B: J Engineering Manufacture 227(12)
at NATIONAL CHIAO TUNG UNIV LIB on April 28, 2014pib.sagepub.comDownloaded from
18. Villacourt M. Failure mode and effects analysis (FMEA):
a guide for continuous improvement for the semiconductor
equipment industry. Technology Transfer # 92020963B-ENG, 30 September 1992. Albany, NY: SEMATECH.
19. Osada T. The 5S’s: five keys to a total quality environment.Tokyo, Japan: Asian Productivity Organization, 1991.
20. Hirano H. 5S for operators: 5 pillars of the visual work-
place (5S shido manual). New York: Productivity Press,1996.
21. Ho SKM. 5-S practice: a new tool for industrial manage-ment. Ind Manage Data Syst 1998; 98(2): 55–62.
22. Ablanedo-Rosas JH, Alidaee B, Moreno JC, et al. Qual-ity improvement supported by the 5S, an empirical casestudy of Mexican organisations. Int J Prod Res 2010;48(23): 7063–7087.
23. Bayo-Moriones A, Bello-Pintado A and Merino-Dıaz deCerio J. 5S use in manufacturing plants: contextual fac-
tors and impact on operating performance. Int J Qual
Reliab Manag 2010; 27(2): 217–230.24. Eti MC, Ogaji SOT and Probert SD. Integrating reliabil-
ity, availability, maintainability and supportability withrisk analysis for improved operation of the Afam thermalpower-station. Appl Energ 2007; 84(2): 202–221.
25. Kutlu AC and Ekmekcxioglu M. Fuzzy failure modes andeffects analysis by using fuzzy TOPSIS-based fuzzy AHP.Expert Syst Appl 2012; 39(1): 61–67.
26. Chang KH and Cheng CH. A risk assessment methodol-ogy using intuitionistic fuzzy set in FMEA. Int J Syst Sci
2010; 41(12): 1457–1471.27. US Department of Defense. Procedures for performing a
failure mode effects and criticality analysis. US MIL-P-1629, 9 November 1949. Washington, DC: US Depart-ment of Defense.
28. US Department of Defense. Procedures for performing a
failure mode effects and criticality analysis. US MIL-STD-
1629A, 24 November 1980. Washington, DC: US Depart-
ment of Defense.29. Herrera F and Martınez L. An approach for combining
linguistic and numerical information based on the 2-tuple
fuzzy linguistic representation model in decision-making.
Int J Uncertain Fuzz 2000; 8(5): 539–562.30. Herrera F and Martınez L. A 2-tuple fuzzy linguistic rep-
resentation model for computing with words. IEEE T
Fuzzy Syst 2000; 8(6): 746–752.31. Chang KH and Wen TC. A novel efficient approach for
DFMEA combining 2-tuple and the OWA operator.
Expert Syst Appl 2010; 37(3): 2362–2370.32. Florez-Lopez R and Ramon-Jeronimo JM. Managing
logistics customer service under uncertainty: an integra-
tive fuzzy Kano framework. Inform Sciences 2012; 202:
41–57.33. Aczel J and Saaty TL. Procedures for synthesizing ratio
judgements. J Math Psychol 1983; 27(1): 93–102.34. Xu ZS and Da QL. An overview of operators for aggre-
gating information. Int J Intell Syst 2003; 18(9): 953–969.35. Cheng CH and Chang JR. MCDM aggregation model
using situational ME-OWA and ME-OWGA operators.
Int J Uncertain Fuzz 2006; 14(4): 421–443.36. Xu ZS. A method based on linguistic aggregation opera-
tors for group decision making with linguistic preference
relations. Inform Sciences 2004; 166(1–4): 19–30.37. Kim BI, Oh S, Shin J, et al. Effectiveness of vehicle reas-
signment in a large-scale overhead hoist transport system.
Int J Prod Res 2007; 45(4): 789–802.
Chang et al. 1887
at NATIONAL CHIAO TUNG UNIV LIB on April 28, 2014pib.sagepub.comDownloaded from