proceedings of the institution of mechanical …files.imeche.org/events/downloads/rdjournal2013/part...
TRANSCRIPT

http://pif.sagepub.com/Transit
Engineers, Part F: Journal of Rail and Rapid Proceedings of the Institution of Mechanical
http://pif.sagepub.com/content/227/6/623The online version of this article can be found at:
DOI: 10.1177/0954409713503634
published online 18 September 2013 2013 227: 623 originallyProceedings of the Institution of Mechanical Engineers, Part F: Journal of Rail and Rapid Transit
Peter Hubbard, Chris Ward, Roger Dixon and Roger GoodallReal time detection of low adhesion in the wheel/rail contact
Published by:
http://www.sagepublications.com
On behalf of:
Institution of Mechanical Engineers
can be found at:Proceedings of the Institution of Mechanical Engineers, Part F: Journal of Rail and Rapid TransitAdditional services and information for
http://pif.sagepub.com/cgi/alertsEmail Alerts:
http://pif.sagepub.com/subscriptionsSubscriptions:
http://www.sagepub.com/journalsReprints.navReprints:
http://www.sagepub.com/journalsPermissions.navPermissions:
http://pif.sagepub.com/content/227/6/623.refs.htmlCitations:
What is This?
- Sep 18, 2013OnlineFirst Version of Record
- Nov 7, 2013Version of Record >>
at Inst. of Mechanical Engineers on January 10, 2014pif.sagepub.comDownloaded from at Inst. of Mechanical Engineers on January 10, 2014pif.sagepub.comDownloaded from

Original Article
Real time detection of low adhesion in thewheel/rail contact
Peter Hubbard, Chris Ward, Roger Dixon and Roger Goodall
Abstract
Condition monitoring of railway vehicles has been highlighted by the railway industry as a key enabling technology for
future system development. The primary uses for this could be the improvement of maintenance procedures and/or the
identification of high-risk vehicle running conditions. Advanced processing of signals means these tasks could be accom-
plished without the use of cost prohibitive sensors.
This paper presents a system for the on-board detection of low-adhesion conditions during the normal operation of a
railway vehicle. Two different processing methods are introduced. The first method is a model-based approach that uses
a Kalman–Bucy filter to estimate creep forces, with subsequent post processing for interpretation into adhesion levels.
The second non model-based method targets the assessment of relationships between vehicle dynamic responses to
observe any behavioural differences as a result of an adhesion-level change.
Both methods are evaluated in specific case studies using a British Rail (BR) Mark 3 coach, inclusive of a BR BT-10 bogie,
and a generic modern passenger vehicle based on a contemporary bogie design. These vehicles were chosen as typical
application opportunities within the UK.
The results are validated with data generated by the multi-body simulation software VAMPIRE� for realistic data inputs,
representing a key scientific achievement.
Keywords
Railways, vehicle dynamics, Kalman filters, low adhesion
Date received: 15 January 2013; accepted: 8 August 2013
Introduction
Low adhesion or the ‘leaves on the line’ problem is alarge issue often misunderstood by the industry andgeneral public alike. There is currently a lack of infor-mation about the changing picture of areas of lowadhesion with respect to short term trends (over adaily period) and macro trends (across the seasons).The generally established methods of identifying theseareas of low adhesion involve mapping activations ofwheel slide and wheel slip protection systems to tracklocations. This represents a blind-spot in awareness asadhesion cannot be assessed outside of braking ortraction zones, potentially resulting in application ofcostly mitigation methods such as railhead cleaningand timetable changes where none are needed.
The research described in this article has been per-formed as part of a project commissioned by RSSB inthe UK and supported by the TSLG (TechnologyStrategy Leadership Group) to investigate methodsof detecting low adhesion. This research is a progres-sion from a feasibility study, also commissioned byRSSB, to investigate advanced methods of detectingareas of low adhesion in real time using modestcost inertial sensors mounted to in-service vehicles.
This study demonstrated that the motions of a railwayvehicle (in both lateral and yaw directions) vary as theadhesion conditions at the wheel/rail interfacechange.1 Fundamentally, this means that if thechanges in the running dynamics as a result of lowadhesion can be observed and understood, the adhe-sion at all points across a rail network can be inferredduring normal running, i.e. not only when slip/slideevents are triggered.
A number of methods have been proposed to ana-lyse data provided by inertial sensors mounted on thewheelsets, bogie and vehicle body. The main focus ofthe research has been developing a model-basedapproach that uses a fundamental understanding ofthe physics of a rail vehicle to estimate wheel-railcreep forces that cannot be measured directly.2,3
School of Electronic, Electrical and Systems Engineering, Loughborough
University, UK
Corresponding author:
Peter Hubbard, School of Electronic, Electrical and Systems
Engineering, Loughborough University, Loughborough, LE11 3TU, UK.
Email: [email protected]
Proc IMechE Part F:
J Rail and Rapid Transit
227(6) 623–634
! IMechE 2013
Reprints and permissions:
sagepub.co.uk/journalsPermissions.nav
DOI: 10.1177/0954409713503634
pif.sagepub.com
at Inst. of Mechanical Engineers on January 10, 2014pif.sagepub.comDownloaded from

The application of this technique, including compari-son work and analysis of data produced by a highfidelity railway vehicle dynamics simulation, will bepresented in the following section.
The other stream of work highlighted in this paperis the direct analysis of measured data in order toidentify any features in the relationships betweencomponent dynamic behaviours as adhesion levelschange. The current findings of this work are pre-sented in the third section.
Model-based estimator
The concept of using a model-based estimator to iden-tify faults and failures or estimate systems parametersis widely suggested in railway specific applications.There are examples of suspension parameter model-ling,4,5 suspension fault detection,6,7 suspensioncondition monitoring8 and wheel/rail condition moni-toring.9 The opportunities are broad for this style ofinvestigation with some publications including numer-ous different examples of fault identification or con-dition monitoring with model-based methods.10–12
In a similar fashion to the model-based estimationtechniques highlighted above, the concept of usingsuch an approach to approximate adhesion levelswhithin the wheel/rail interface has been developedand tested against linear suspension models with com-plex, non-linear wheel/rail interface mechanics gener-ated in MATLAB/Simulink.1,9 The work presented inthis article extends this previous study by applying thecreep force estimation method to more representativesimulation data. This data was supplied in the form ofoutputs taken from the multi-body physics software(MBS) package VAMPIRE�, generated for this pro-ject by DeltaRail.13 VAMPIRE� is a well validated,specialist rail-vehicle dynamics modelling softwarethat simulates multi-degree of freedom/multi-bodiedinteractions of a railway vehicle.
MBS packages (such as VAMPIRE�) are currentlythe closest means of generating vehicle dynamic datashort of the costly process of full scale testing. In thisstudy, data produced from the MBS is treated as aclose representation of the data outputs from realaccelerometers and yaw rate gyros mounted on thewheelset, bogies and bodies of railway vehicles.The added advantage from a MBS package is thatthe creep forces are also available, enabling high fidel-ity validation of the estimation method.
By using VAMPIRE� simulation data generated, itis possible to treat the data outputs as sensor readingsin order to verify any model-based estimators created.The outputs from these can then be compared againstthose that are captured directly from VAMPIRE�.This use of MBS data is considered as an intermediatestep to prove the efficacy of the methods before thefinal validation occurs through full-scale testing.
This section gives a brief overview to the gener-ation of a model-based estimator and presents the
results when this estimator is applied toVAMPIRE� test data.
Methodology
The model-based estimator approach used previouslyis based around the well-known Kalman–Bucyfilter.14 In this method the filter requires a well vali-dated, linearised plan view model of the vehicle sus-pension system in order to estimate the total lateralforce and yaw moments at the wheel/rail interface.3,9
It has been shown that the yaw and lateral dynamicresponses contain the dominant characteristics of themotion when the adhesion levels are modified andthat the other system dynamic responses can be neg-lected due to their secondary importance.15,16
The first step of the process is to create and validatea second representative simulation model of thesystem in question in MATLAB/Simulink. The line-arised suspension component from this model canthen be converted into state space form and used toform a Kalman–Bucy filter.
Model development and validation
The vehicle chosen for this case study is a genericmodern passenger, Diesel Multiple Unit (DMU) vehi-cle, that is based loosely on a British class 158 vehicle.This vehicle represents a typical example of a vehiclelikely to benefit from on-board adhesion detection.
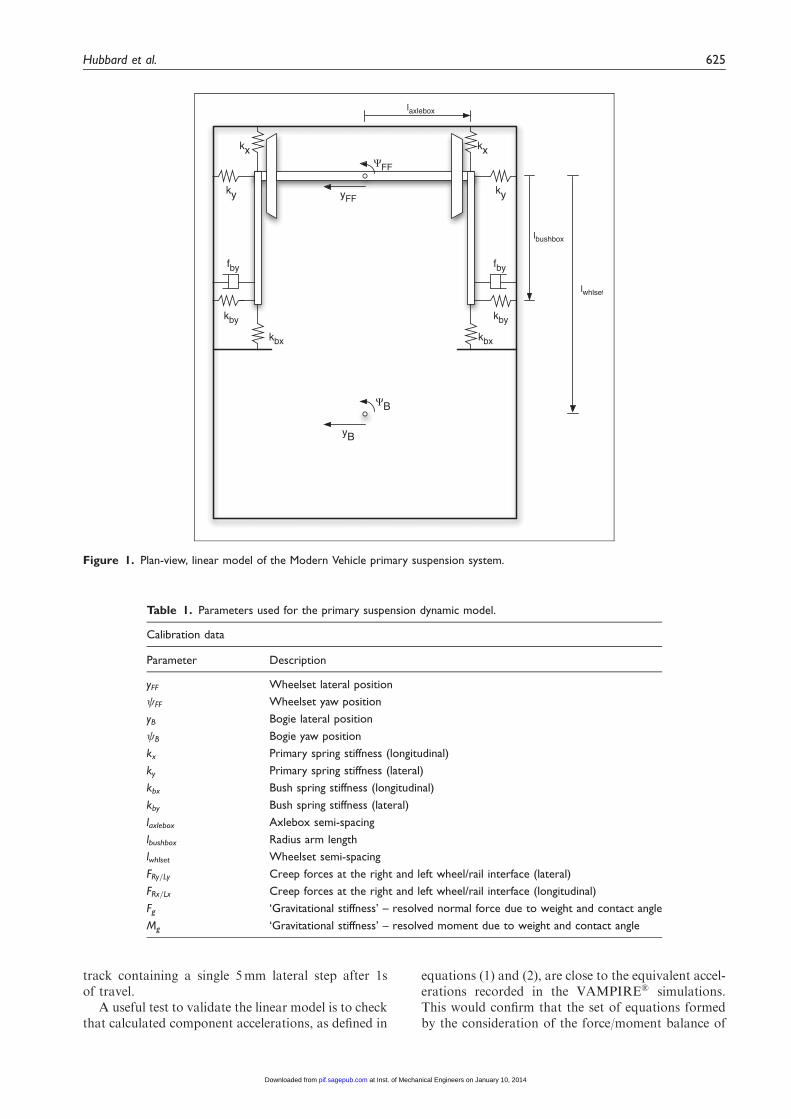
Figure 1 shows a simplified plan-view linear repre-sentation of a railway vehicle primary suspension. Aset of linear equations to describe the dynamics isderived from this geometry by considering the force/moment balance equations around the wheelset. Theparameters used are defined in Table 1.
The linear and yaw dynamics of the wheelset aretherefore defined by
m €yFF ¼ FRy þ FLy þ Fg þ 2kyðð yb þ blbushÞ � yFFÞ
þ 2kbyðð yb þ bðlwhlset � lbushÞÞ
� ð yFF þ FFlbushÞÞ ð1Þ
Iwx € FF ¼ RRyFRx � RLyFLx þMg
þ 2kbyðð yb þ bðlwhlset � lbushÞÞ
� ð yFF þ FFlbushÞÞlbush
þ 2ðkx þ kbxÞð b � FFÞl2axlebox ð2Þ
where minor terms have been neglected.The equation set generated was used to form a
dynamic linear model in a MATLAB/Simulink envir-onment. The model generated contains two selectablecontact force descriptions based on the works ofKalker and Polach.17,18 In addition, a VAMPIRE�
test case, against which this Simulink model is to bevalidated, was generated whereby a whole vehiclemodel virtually travelled along a length of perfect
624 Proc IMechE Part F: J Rail and Rapid Transit 227(6)
at Inst. of Mechanical Engineers on January 10, 2014pif.sagepub.comDownloaded from
track containing a single 5mm lateral step after 1sof travel.
A useful test to validate the linear model is to checkthat calculated component accelerations, as defined in
equations (1) and (2), are close to the equivalent accel-erations recorded in the VAMPIRE� simulations.This would confirm that the set of equations formedby the consideration of the force/moment balance of
Figure 1. Plan-view, linear model of the Modern Vehicle primary suspension system.
Table 1. Parameters used for the primary suspension dynamic model.
Calibration data
Parameter Description
yFF Wheelset lateral position
FF Wheelset yaw position
yB Bogie lateral position
B Bogie yaw position
kx Primary spring stiffness (longitudinal)
ky Primary spring stiffness (lateral)
kbx Bush spring stiffness (longitudinal)
kby Bush spring stiffness (lateral)
laxlebox Axlebox semi-spacing
lbushbox Radius arm length
lwhlset Wheelset semi-spacing
FRy=Ly Creep forces at the right and left wheel/rail interface (lateral)
FRx=Lx Creep forces at the right and left wheel/rail interface (longitudinal)
Fg ‘Gravitational stiffness’ – resolved normal force due to weight and contact angle
Mg ‘Gravitational stiffness’ – resolved moment due to weight and contact angle
Hubbard et al. 625
at Inst. of Mechanical Engineers on January 10, 2014pif.sagepub.comDownloaded from

the suspension components in a linear, plan-viewsense sufficiently match the suspension forces experi-enced in the VAMPIRE� simulation. To perform this,the contact forces, bogie and wheelset dynamicresponses recorded in a VAMPIRE� simulation areinput into the linear Simulink model which in turnderives the total wheelset lateral and yaw acceler-ations based on the resultant suspension loading.
Figure 2 shows the so called ‘open loop’ responseof the modern vehicle simulation model in dry condi-tions and compares the output to the values simulatedby VAMPIRE�. The solid blue lines show the result-ant derived wheelset accelerations in the lateral andyaw directions from the linear Simulink model. Thegreen dashed line shows the acceleration values rec-orded in VAMPIRE�. It can be seen that the matchesare close, but have a number of discrepancies that area result of differences in the Force/Moment balanceequations. These differences between the models canbe accounted for by:
. the 3D suspension geometry of VAMPIRE� com-pared to the 2D plan view assumption of theSimulink model;
. linearisation of components in the Simulink modelcompared to non-linear components of theVAMPIRE� model;
. simplification of some suspension components inthe Simulink model.
In terms of application to a Kalman–Bucy filter,the differences shown above are small enough toallow the linear model to form the basis of theestimator.
Creep force estimation technique
The linear suspension model generated for themodern passenger vehicle is converted into standardstate space form given by the state and outputequations
_x ¼ Akxþ Bku ð3Þ
y ¼ CkxþDku ð4Þ
Previous work has shown that the Kalman–Bucyfilter cannot distinguish between the creep forces andthe resolved normal forces as separate states,9
and therefore they are combined into one state, asdefined by
FFF ¼ FLy þ FRy þ Fg ð5Þ
MFF ¼ RRyFRx � RLyFLx þMg ð6Þ
The state space model is formed by choosing thestates to be the position and velocity of the wheelset
(in both lateral and yaw directions) along with thecontact forces
x ¼ ½ yFF, _yFF, FF, _ FF,FFF,MFF�T
ð7Þ
The bogie position and velocity (in both lateral andyaw directions) are included here in the input vector u,where
u ¼ ½ yBF, _yBF, BF, _ BF�T
ð8Þ
The state equation (3) can now be satisfied by usingequations (1) and (2) to populate the matrices AK
and BK.The Kalman–Bucy filter is formed from the
equations
_x ¼ Akxþ Bkuþ Kðy� yÞ ð9Þ
y ¼ Ckx ð10Þ
The derivative estimated states _x are formed fromtwo parts; the expected value, based on the suspensiondescription defined as a function of Ak, Bk, the cur-rent-state estimate, x, and the current inputs, u, and acorrection factor based on a scaled difference betweensensor measurements y and expected sensor outputs y.In this case, the values of y are the estimated states(defined by choosing Ck in equation (10) accordingly)and y represents the actual sensor values capturedfrom a vehicle. In this configuration the measure-ments required would be the leading wheelset andbogie positions and velocities, in both the lateraland yaw directions. These could be derived fromaccelerometers or yaw gyros to reduced measurementcomplexity.
The Kalman gain, K, is derived by identifying adegree of certainty with each of the state models.9
By setting the creep force state models as highlyuncertain compared to the vehicle dynamics statemodels, the filter can be used to approximate thecreep forces by extracting them from the estimatedstate vector x.
Figure 3 shows an evaluation of this method at twodifferent levels of adhesion; ideal dry conditions andlow levels of adhesion. The actual values of frictiondefined for these levels were chosen to represent dif-ferent adhesion conditions at which the vehicle oper-ates, dry (m¼ 0.56) and low (m¼ 0.072).
In each case, VAMPIRE� data was generatedusing the same section of track as in the previous sub-section. Selected states from this are then passed intothe filter representing equivalent sensor data mea-sured in real time.
It can be seen that the outputs of the model-basedestimator demonstrate good agreement to the simu-lated lateral contact forces and creep moments at bothlevels of adhesion. This confirms that although thelinear approximations demonstrated in Figure 2
626 Proc IMechE Part F: J Rail and Rapid Transit 227(6)
at Inst. of Mechanical Engineers on January 10, 2014pif.sagepub.comDownloaded from

were not exact, they were good enough to facilitatethe implementation of the creep force estimation.
Verification with VAMPIRE�
A number of simulations were produced inVAMPIRE� in order to validate the capability of
the Kalman–Bucy filter in more demanding scenarios.In these simulations, the VAMPIRE� model of themodern DMU virtually travelled a typical section oftrack under different operating conditions. For theresults presented in this section, the track used con-tained irregularities (for a 200 kph track) in both lat-eral and vertical directions, as opposed to the previoustest where there existed only a single, lateral step
Figure 3. Figure showing the estimated lateral creep force and estimated total creep moment, overlaying the recorded values.
Figure 2. Figures showing the derived values of lateral and yaw acceleration overlaying the recorded VAMPIRE� values. These are
taken from the centre of mass of the front wheelset of the front bogie – hence the ‘front front’ label.
Hubbard et al. 627
at Inst. of Mechanical Engineers on January 10, 2014pif.sagepub.comDownloaded from

input. These irregularities are statistically similar tothose of a typical high speed line found in the UK.The vehicle travelled for 60 s at full line speed (definedhere as 200 kph) and the positions, velocites and accel-erations of the vehicle components (wheelsets, bogiesand vehicle body) along with the contact forcesexperienced were recorded. As before, this allowedthe Kalman–Bucy filter to use the recorded quantitiesfrom VAMPIRE� as if they were sensor readingstaken from the vehicle. This test was repeated atthree different levels of adhesion; dry and low asbefore (m¼ 0.56 and 0.072 respectively), with the add-ition of a very low condition (m¼ 0.038) which repre-sents the state where even the use of defensive drivingmay not mitigate the operational risks experienced.The performance of the estimator in these conditionsis shown in Figure 4.
It can be seen that, as the adhesion level falls, theoverall levels of creep force fall and the estimator cor-rectly follows this magnitude change. The best matchfor force estimation is seen in the dry condition andthe largest discrepancies exist at the very low-adhesioncondition. As the creep forces become small, theresultant wheelset deflections are not large enoughto exceed the required breakout forces (i.e. the staticfriction part) of the suspension components. Thelinear estimation part of the Kalman–Bucy filter willstill predict a proportional deflection in the suspen-sion whereas the non-linear VAMPIRE� simulationthese breakout forces will not be exceeded, creating adifference between estimated and actual sensor values(y and y). As a result, the contact information getsincorporated with the modelling discrepancies withinthe Kalman filter.
Figure 4. Graphs showing the estimated creep forces (solid line) against the actual creep forces (dashed line) over three adhesion
conditions.
628 Proc IMechE Part F: J Rail and Rapid Transit 227(6)
at Inst. of Mechanical Engineers on January 10, 2014pif.sagepub.comDownloaded from

However, the estimator successfully follows theoverall fall in level of creep force, particularly withthe reduction of creep moment with adhesion level.Figure 5 shows the performance of the estimatorover the three adhesion levels when a five-secondmoving RMS is applied to both the measured valuesand the estimated values.
The variations observed in the RMS creep momentthroughout an individual run are attributed to thenaturally changing magnitude of irregularities experi-enced upon the track during that particular window.Normalising to track irregularities presents a chal-lenge as they are difficult to measure on board astandard railway vehicle and referring to stored infor-mation regarding track section presents a different setof operational difficulties.
In order to provide normalisation to the trackirregularity, tests were performed whereby the esti-mated creep force RMS values were normalised byeach of the on-board measurable states (with amoving RMS taken over the same window) andassessed to observe performance. It was found thatnormalising by wheelset yaw acceleration providedthe best results.
Because the conditions of each test run wereknown, the measured ratio of MFFðRMSÞ to € FFðRMSÞ
when averaged over the whole test run can be used asa calibration value for level of adhesion. Therefore, ifthe ratio of MFFðRMSÞ to € FFðRMSÞ can be measuredduring a vehicle run, the calibration values can beused to populate a linear interpolation table fromwhich the current level of adhesion being experiencedcan be determined. The calibration data used is sum-marised in Table 2.
This method is validated on further VAMPIRE�
simulations, whereby a change in adhesion level partway through the test run is introduced. In these tests,a step change in adhesion is experienced after 30 s oftravel. Figure 6 shows the actual adhesion level andestimated adhesion level of two test runs.
It can be seen that the estimated adhesion levelcorrectly changes from high levels of adhesion to thelower levels. The discrepancy between actual and esti-mated values can be explained by the inability to scaleaccurately to track irregularity. It is also possible tosee the time lag in the estimator response to the stepchange. This is due to the five-second moving windowover which an RMS is taken. Although the adhesionlevel is not accurately tracked, the overall change inoperating conditions is identified.
Further work
The model-based creep force estimation scheme usedhere has been shown to provide good estimations ofthe contact forces experienced in the wheel rail con-tact during MBS test scenarios.
Figure 5. Graphs comparing the measured creep moment to the estimated creep moment over three adhesion levels.
Table 2. Calibration data for adhesion level with respect to
creep moment/yaw acceleration ratio.
Calibration data
Condition m MFFðRMSÞ= € FFðRMSÞ
Dry 0.56 3088
Low 0.072 1237
Very low 0.038 900.6
Hubbard et al. 629
at Inst. of Mechanical Engineers on January 10, 2014pif.sagepub.comDownloaded from

Having obtained estimations of creep forces andmoments, basic post processing has shown that it ispossible to attain a reasonable approximation ofadhesion, even with a coarse linear interpolationmethod based on only three points and an abstractmethod of normalising for track irregularity. Futurestudies may focus on the development of post-pro-cessing techniques to more accurately analyse thecreep force data to better estimate adhesion.
A limitation of this technique is that, in its currentform, the creep force estimator loses accuracy at low-adhesion levels for suspension units with significantnon-linearity in their components. In a case studywith a British Rail (BR) Mk3 vehicle, fitted with aBT-10 bogie, it was found that the estimationmethod at low levels of adhesion was poor. The geom-etry of the suspension of this model is such that alinear plan view model does not sufficiently capturethe dynamics of the vehicle, particularly when suspen-sion components are operating with small deflections.This situation occurs either when there are small levelsof track irregularities, or when the adhesion level islow. As such, vehicles with suspension dynamicresponse characteristics, such as the BR Mk3 vehicle,would require a more detailed mathematical modelaround which to form a filter.
Direct data analysis
The method presented in this section aims to identifyany features or relationships between measurable datathat can be used to signify a change in adhesion levelswithout the need for the complexity of developing aNewtonian based model. This approach has been usedin identifying suspension system faults19,20 by obser-ving changes in the system dynamic interactions or bydifferent frequency modes observed.21 All these meth-ods rely on calibration against a baseline model toidentify good operating conditions.
The vehicle used in this case study is a BR Mk3vehicle. As mentioned in the previous section, thenon-linear characteristics inherent to this vehiclemake it unsuitable for use with the model-based esti-mator technique presented due to the manner inwhich the suspension responds under very low-adhe-sion levels for which there are correspondingly lowlevels of creep force.
After an initial search, the investigation followedtwo streams; relationships between leading and trail-ing bogie dynamic responses, and relationshipsbetween leading and trailing wheelset dynamicresponses.
Leading and trailing wheelsets
Under high adhesion conditions it is known thatduring quasi-static curving the forces and relativemovements of the leading wheelset are significantlylarger than for the trailing wheelset.15 It seems pos-sible therefore that a comparison between leading andtrailing wheelset dynamic data may provide a usefulindication for low adhesion.
After an investigation on data produced byVAMPIRE� simulations for the Mk3 vehicle, themost significant dynamic quantity of interest was theyaw velocity comparison. Figure 7 shows the datarecorded over a one second interval on a test trackthat contains lateral-only disturbances. Figure 7(a)shows this test under dry conditions and Figure 7(b)shows this under very low conditions.
It can be seen that, at low-adhesion conditions, theyaw velocity of the leading and trailing wheelsets, andbogie converge and begin to move more as a singleunit. It is hypothesised that at low-adhesion levels thecreep forces are not of a significant magnitude toovercome the breakout forces of the stiff wheelset-bogie yaw connections and the secondary yawfriction levels inherent in parts of the BT-10
Figure 6. Graph showing adhesion estimation during a step change in adhesion. The dashed line show the actual level of adhesion for
each test.
630 Proc IMechE Part F: J Rail and Rapid Transit 227(6)
at Inst. of Mechanical Engineers on January 10, 2014pif.sagepub.comDownloaded from

suspension design. The parts are therefore more likelyto lock together and move as a unit, rather than dis-play independent dynamic behaviour.
This analysis showed initially promising results asthere is a noticeable trend between the level of adhe-sion and a correlation analysis of the dynamicresponses. However, when an identical simulationtest was performed with full track irregularities (i.e.vertical, cross level and gauge-width irregularities),the results were less satisfactory.
This analysis shows that this does not yet appear tobe a useful indicator for real-time adhesion detection.It has nevertheless revealed that the yaw motions ofthe two wheelsets in response to lateral irregularitiesbecome increasingly similar as adhesion levels reduce.To pursue this investigation further, appropriate nor-malisation or scaling factors would require study so asto allow clarification of the correlation trends.
Initial testing on the modern DMU vehicle datasetsshow that relationship identified for the Mk3 vehicledoes not remain true. It is apparent that the suspen-sion features of the BT-10 are such that the breakoutforces are not exceeded during the smaller impulsesexperienced with very low-adhesion levels, whereas inthe modern vehicle example they are. It remains to beseen if other dynamic measurements between wheel-sets could be used in a similar ways to see if similartraits are present that could be exploited to detectlow-adhesion conditions.
Leading and trailing bogie dynamics
Similarly to the comparison of the leading and trailingwheelset dynamic responses, it was considered that a
study to compare leading and trailing bogie dynamicresponses may yield a useful indicator for levels ofadhesion. Once again, this study focused on the BRMk3 vehicle.
This investigation began by comparing the correl-ation of all dynamic variables of the leading and trail-ing bogies. The variables were compared when takenat the same instant in time, and when the leading datawas delayed so the comparisons were made as thebogies travelled over the same piece of track. All thepossible dynamic measurements of the vehicle compo-nents were considered at different adhesion levels tosee if there were observable differences in correlationas the friction changed.
This was performed using the Matlab function‘crosscorr’ that provides an estimate of the correlationbetween two time series over a range of sampledelays or ‘lags’.22 The value for cross correlation isobtained by
rxyðkÞ ¼cxyðkÞ
sxsy, k ¼ 0, 1, 2, . . . ð11Þ
where rxyðkÞ is the estimate of the cross correlation,cxyðkÞ is the cross covariance function, and sx and syare the sample standard devations. Figure 8 shows thecross-correlation analysis for the yaw dynamic quan-tities of the leading and trailing bogie.
It was found that the biggest change in correlationwith adhesion was between the yaw angles of the twobogies. At high levels of adhesion, the correlation wasfound to be low (r � 0:2) whereas at low levels ofadhesion the correlation was high (r � 0:8). As withthe results presented in the previous subsection, it is
(a) (b)
Figure 7. Comparisons of bogie, leading wheelset and trailing wheelset yaw rate in (a) dry conditions and (b) very low-adhesion
conditions.
Hubbard et al. 631
at Inst. of Mechanical Engineers on January 10, 2014pif.sagepub.comDownloaded from

thought that this relationship is once again a result ofthe levels of static friction within the Mk3 suspensioncomponents.
The trend between adhesion levels and agreementof bogie yaw position can therefore be exploited toproduce an adhesion estimator. The scheme devel-oped based on this relationship is shown inFigure 9. Here, the difference between leading andtrailing bogie yaw angle is filtered by taking anRMS over a moving window. This value is then
normalised for the variances in track irregularity byscaling with the RMS of the leading bogie yaw angleand then multiplied by the RMS of the leading wheel-set lateral acceleration. Both these RMS are takenover the same moving window as the yaw angle.Testing concluded a 10 s moving window providedreasonable results.
Four test runs utilising this system are summarisedin Table 3. Each simulation consists of an instantan-eous change in adhesion after 30 s in the direction
Figure 8. Figure showing the cross-correlation analysis of leading and trialing bogie yaw position (c), yaw velocity ( _ ) and yaw
acceleration ( € ) in both dry and very low-adhesion conditions.
Figure 9. Leading/Trailing bogie yaw comparison scheme, where B1, B2: bogie yaw position (leading and trailing); €yB1: leading bogie
lateral acceleration.
632 Proc IMechE Part F: J Rail and Rapid Transit 227(6)
at Inst. of Mechanical Engineers on January 10, 2014pif.sagepub.comDownloaded from
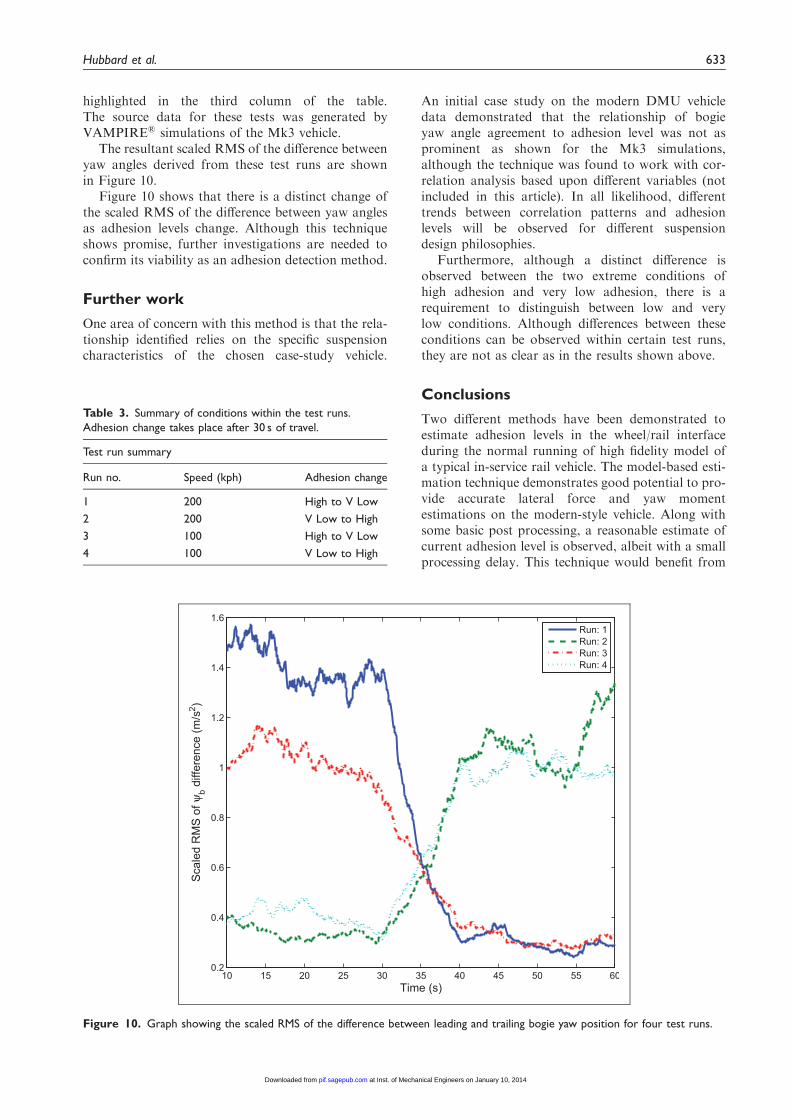
highlighted in the third column of the table.The source data for these tests was generated byVAMPIRE� simulations of the Mk3 vehicle.
The resultant scaled RMS of the difference betweenyaw angles derived from these test runs are shownin Figure 10.
Figure 10 shows that there is a distinct change ofthe scaled RMS of the difference between yaw anglesas adhesion levels change. Although this techniqueshows promise, further investigations are needed toconfirm its viability as an adhesion detection method.
Further work
One area of concern with this method is that the rela-tionship identified relies on the specific suspensioncharacteristics of the chosen case-study vehicle.
An initial case study on the modern DMU vehicledata demonstrated that the relationship of bogieyaw angle agreement to adhesion level was not asprominent as shown for the Mk3 simulations,although the technique was found to work with cor-relation analysis based upon different variables (notincluded in this article). In all likelihood, differenttrends between correlation patterns and adhesionlevels will be observed for different suspensiondesign philosophies.
Furthermore, although a distinct difference isobserved between the two extreme conditions ofhigh adhesion and very low adhesion, there is arequirement to distinguish between low and verylow conditions. Although differences between theseconditions can be observed within certain test runs,they are not as clear as in the results shown above.
Conclusions
Two different methods have been demonstrated toestimate adhesion levels in the wheel/rail interfaceduring the normal running of high fidelity model ofa typical in-service rail vehicle. The model-based esti-mation technique demonstrates good potential to pro-vide accurate lateral force and yaw momentestimations on the modern-style vehicle. Along withsome basic post processing, a reasonable estimate ofcurrent adhesion level is observed, albeit with a smallprocessing delay. This technique would benefit from
Figure 10. Graph showing the scaled RMS of the difference between leading and trailing bogie yaw position for four test runs.
Table 3. Summary of conditions within the test runs.
Adhesion change takes place after 30 s of travel.
Test run summary
Run no. Speed (kph) Adhesion change
1 200 High to V Low
2 200 V Low to High
3 100 High to V Low
4 100 V Low to High
Hubbard et al. 633
at Inst. of Mechanical Engineers on January 10, 2014pif.sagepub.comDownloaded from

further investigation into post-processing methods toidentify more accurate and faster techniques of deriv-ing adhesion.
Furthermore, the direct data analysis methodshave provided some potentially useful markers foridentifying low-adhesion areas. As these methodsapproach the data directly, an accurate linear modelof a complex, non-linear suspension model is notrequired. In the case of the Mk3 vehicle where thesuspension is troublesome to model linearly, refine-ment of these techniques could provide a solutionwhere a model-based estimator may not. Both thismethod and the model-based approach would benefitfrom testing on in-service vehicles to prove their val-idity away from simulation.
One of the main findings is that, without directknowledge of track irregularity, it is not possible toobtain an instant value of adhesion based on creepforce estimation. Operationally this means that theoutput of an adhesion estimator in this form willhave limited use on board a vehicle in terms of quicklyadvising a driver of conditions or scheduling brakingin an on-board anti-slip controller. However, theoutput would be quick enough to provide a real-time overview of the current rail network state ifenough vehicles were equipped with such a device.
Funding
This work was supported by RSSB (grant number T959).
Acknowledgements
Our acknowledgements go to the Technical Strategy
Leadership Group (TSLG) for supporting this work andto RSSB for funding and managing the project and guidingit towards an appropriate solution to suit industrial needs.
They also go to DeltaRail for providing simulation test dataand assisting in the generation of the linear model for use inthe model-based estimator.
References
1. Ward C, Goodall R and Dixon R. Creep force estima-tion at the wheel-rail interface. In: Proceedings of the22nd international symposium on dynamics of vehicles on
roads and tracks. Manchester, UK: ManchesterMetropolitan University, 2011.
2. Ward CP, Goodall RM, Dixon R and Charles G.Condition monitoring of rail vehicle bogies. In:
UKACC international conference on control. Coventry,UK: IFAC, 2010.
3. Ward CP, Goodall RM and Dixon R. Contact force esti-
mation in the railway vehicle wheel–rail interface. In:Proceedings of the 18th IFAC world congress. Milan,Italy: International Federation of Automatic Control,
2011.4. Li P, Goodall R and Kadirkamanathan V. Parameter
estimation of railway vehicle dynamic model usingRao–Blackwellised particle filter. In: Proceedings of the
European control conference, ECC’03, Cambridge,United Kingdom, 1–4 September 2003.
5. Li P, Goodall R, Weston P, Seng Ling C, Goodman Cand Roberts C. Estimation of railway vehicle suspen-sion parameters for condition monitoring. Control Eng
Pract 2007; 15(1): 43–55.6. Fan H, Wei X, Jia L and Qin Y. Fault detection of
railway vehicle suspension systems. In: 5th international
conference on computer science and education (ICCSE),2010, pp.1264–1269.
7. Hayashi Y, Tsunashima H and Marumo Y. Fault detec-
tion of railway vehicle suspension systems using mul-tiple-model approach. Journal of Mechanical Systemsfor Transportation and Logistics 2008; 1(1): 88–99.
8. Tsunashima H and Mori H. Condition monitoring of
railway vehicle suspension using adaptive multiplemodel approach. In: International conference on controlautomation and systems (ICCAS), 27–30 October 2010,
pp.584–589.9. Charles G, Goodall R and Dixon R. Model-based con-
dition monitoring at the wheel–rail interface. Vehicle
Syst Dyn 2008; 46(Supp. 1): 415–430.10. Bruni S, Goodall R, Mei TX and Tsunashima H.
Control and monitoring for railway vehicle dynamics.
Vehicle Syst Dyn 2007; 45(7–8): 743–779.11. Ward CP, Weston PF, Stewart EJC, Li H, Goodall
RM, Roberts C, Mei TX, Charles G and Dixon R.Condition monitoring opportunities using vehicle-
based sensors. Proceedings of the Institution ofMechanical Engineers, Part F: Journal of Rail andRapid Transit 2011; 225(2): 202–218.
12. Gu RWN, Pislaru C and Ball AF. Modern techniquesfor condition monitoring of railway vehicle dynamics.J Phys Conf Ser 2012; 364(1): 012016.
13. DeltaRail. VAMPIRE, http://www.vampire-dynamics.com/ (2011).
14. Kalman RE. A new approach to linear filtering andprediction problems 1. J Basic Eng-T ASME 1960;
82(Series D): 35–45.15. Wickens A. Fundamentals of Rail Vehicle Dynamics.
Oxford, UK: Taylor & Francis, 2003.
16. Garg VK and Dukkipati RV. Dynamics of RailwayVehicle Systems. Ontario, Canada: Academic Press,1984.
17. Kalker JJ. A fast algorithm for the simplified theory ofrolling contact. Vehicle Syst Dyn 1982; 11(1): 1–13.
18. Polach O. Creep forces in simulations of traction vehi-
cles running on adhesion limit. Wear 2005; 258(7–8):992–1000.
19. Mei TX and Ding XJ. A model-less technique for thefault detection of rail vehicle suspensions. Vehicle Syst
Dyn 2008; 46(Supp. 1): 277–287.20. Mei TX and Ding XJ. Condition monitoring of rail
vehicle suspensions based on changes in system
dynamic interactions. Vehicle Syst Dyn 2009; 47(9):1167–1181.
21. Oba T, Yamada K, Okada N and Tanifuji K.
Condition monitoring for Shinkansen bogies based onvibration analysis. Journal of Mechanical Systems forTransportation and Logistics 2009; 2(2): 133–144.
22. MathWorks. Crosscorr. Matlab R2013a Documentation
Centre, http://www.mathworks.co.uk/help/econ/crosscorr.html (2013).
634 Proc IMechE Part F: J Rail and Rapid Transit 227(6)
at Inst. of Mechanical Engineers on January 10, 2014pif.sagepub.comDownloaded from