productivity improvement in automotive component … papers/jst vol... · this paper presents...
TRANSCRIPT

Pertanika J. Sci. & Technol. 25 (S): 147 - 158 (2017)
SCIENCE & TECHNOLOGYJournal homepage: http://www.pertanika.upm.edu.my/
ISSN: 0128-7680 © 2017 Universiti Putra Malaysia Press.
ARTICLE INFO
Article history:Received: 25 October 2016Accepted: 17 March 2017
E-mail addresses: [email protected] (Muhammad Fikri Alif Dzulkarnain),[email protected] (Wan Emri Wan Abdul Rahaman) *Corresponding Author
Productivity Improvement in Automotive Component Company using Line Balancing
Muhammad Fikri Alif Dzulkarnain and Wan Emri Wan Abdul Rahaman* Faculty of Mechanical Engineering, Universiti Teknologi MARA (UiTM), 40450 Shah Alam, Selangor Darul Ehsan, Malaysia
ABSTRACT
One of the issues found in small and medium industry is the poor layout design affecting its productivity and line efficiency. In automotive industries, more attention should be given in improving assembly line to increase productivity. This paper presents application of line balancing at the accelerator and brake pedal assembly line at a small and medium automotive industry. Research methodology employed in this study includes time study, visualising cycle time based on Yamazumi Chart, distribution of workload on each workstation using line balancing based on the current takt time and re-layouting the assembly line. All the proposed layouts are assessed using commercially available software, DELMIA Quest to evaluate the robustness based on parameters such as fluctuation in demand, availability of the machine, and operator capacity. Finally, the outputs presented include reduction in manpower, maximum utilisation of manpower, as well as machine and minimum total production cost. This will lead to productivity improvement of the assembly line.
Keywords: Automotive industry, line balancing, production efficiency
INTRODUCTION
Today, the automotive industry is facing new challenges as a result of globalisation,
customisation and greater competition. Therefore, it is important for manufacturers to produce good quality products and meet customers’ demand. In order to achieve these, the industries have applied the Lean Manufacturing (LM) System, a philosophy of production that integrates a collection of principles, tools and techniques into the business processes to improve time, workers, resources and productivity, while refining the quality level of products and services to their customers (Holweg, 2007). Due to its
Muhammad Fikri Alif Dzulkarnain and Wan Emri Wan Abdul Rahaman
148 Pertanika J. Sci. & Technol. 25 (S): 147 - 158 (2017)
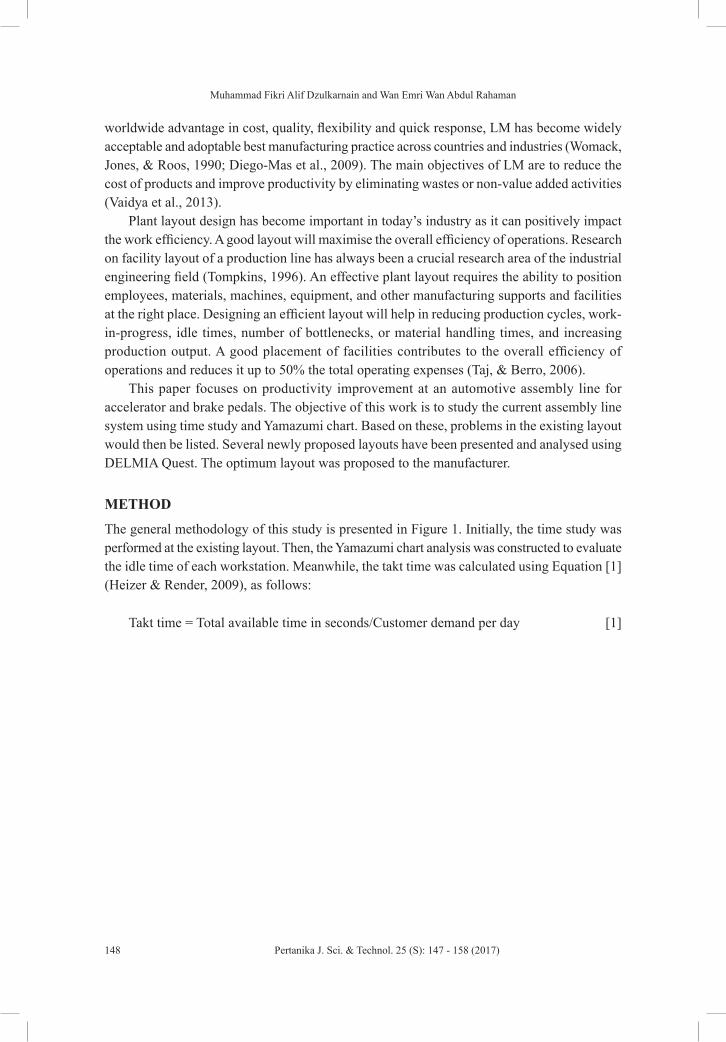
worldwide advantage in cost, quality, flexibility and quick response, LM has become widely acceptable and adoptable best manufacturing practice across countries and industries (Womack, Jones, & Roos, 1990; Diego-Mas et al., 2009). The main objectives of LM are to reduce the cost of products and improve productivity by eliminating wastes or non-value added activities (Vaidya et al., 2013).
Plant layout design has become important in today’s industry as it can positively impact the work efficiency. A good layout will maximise the overall efficiency of operations. Research on facility layout of a production line has always been a crucial research area of the industrial engineering field (Tompkins, 1996). An effective plant layout requires the ability to position employees, materials, machines, equipment, and other manufacturing supports and facilities at the right place. Designing an efficient layout will help in reducing production cycles, work-in-progress, idle times, number of bottlenecks, or material handling times, and increasing production output. A good placement of facilities contributes to the overall efficiency of operations and reduces it up to 50% the total operating expenses (Taj, & Berro, 2006).
This paper focuses on productivity improvement at an automotive assembly line for accelerator and brake pedals. The objective of this work is to study the current assembly line system using time study and Yamazumi chart. Based on these, problems in the existing layout would then be listed. Several newly proposed layouts have been presented and analysed using DELMIA Quest. The optimum layout was proposed to the manufacturer.
METHOD
The general methodology of this study is presented in Figure 1. Initially, the time study was performed at the existing layout. Then, the Yamazumi chart analysis was constructed to evaluate the idle time of each workstation. Meanwhile, the takt time was calculated using Equation [1] (Heizer & Render, 2009), as follows:
Takt time = Total available time in seconds/Customer demand per day [1]

Productivity Improvement in Automotive Component Company
149Pertanika J. Sci. & Technol. 25 (S): 147 - 158 (2017)
The value of takt time was then used for rebalance analysis. However, the number of minimum workstation was calculated before conducting the rebalance analysis. The minimum number of workstation was calculated using Equation [2], as presented by Heizer and Render (2009).
Minimum number of workstations = Total cycle time / takt time [2]
Total cycle time is the time required by each operator at each workstation to complete the task. After rebalance analysis was conducted, several proposed improved layouts were prepared and analysed using DELMIA Quest. The optimum layout in terms of productivity, efficiency and cost was then selected. Efficiency of the layout was calculated using Equation [3] based on the work of Heizer and Render (2009):
Efficiency = Total task time/ (No of workstations)( Largest assigned cycle time) [3]
Current Layout Analysis
The study on assembly line assembling accelerator and brake pedals has been conducted to determine their efficiency. The operator motion and material movement path, from the raw
Figure 1. General method
The value of takt time was then used for rebalance analysis. However, the number of
minimum workstation was calculated before conducting the rebalance analysis. The
minimum number of workstation was calculated using Equation [2], as presented by
Heizer and Render (2009).
Minimum number of workstations = Total cycle time / takt time [2]
Total cycle time is the time required by each operator at each workstation to complete
the task. After rebalance analysis was conducted, several proposed improved layouts were
prepared and analysed using DELMIA Quest. The optimum layout in terms of
Figure 1. General method

Muhammad Fikri Alif Dzulkarnain and Wan Emri Wan Abdul Rahaman
150 Pertanika J. Sci. & Technol. 25 (S): 147 - 158 (2017)
material up to the finished goods, are shown in Figure 2. The process was categorised into 4 stations consisting of assembly and welding; assembly and inspection; assembly and inspection; and final assembly, where the only machine involved in this operation was the spot welding machine.
productivity, efficiency and cost was then selected. Efficiency of the layout was calculated
using Equation [3] based on the work of Heizer and Render (2009):
Efficiency = Total task time/ (No of workstations)( Largest assigned cycle time)
[3]
Current Layout Analysis
The study on assembly line assembling accelerator and brake pedals has been conducted to
determine their efficiency. The operator motion and material movement path, from the raw
material up to the finished goods, are shown in Figure 2. The process was categorised into
4 stations consisting of assembly and welding; assembly and inspection; assembly and
inspection; and final assembly, where the only machine involved in this operation was the
spot welding machine.
Figure 2. Current assembly line layout
Based on the current layout shown in Figure 2, Operator 1 assembled five components
using a jig on the worktable and welded all the sections using the spot welding machine.
Figure 2. Current assembly line layout
Based on the current layout shown in Figure 2, Operator 1 assembled five components using a jig on the worktable and welded all the sections using the spot welding machine. Then, the base part was transferred to SIPS 1, which is also known as Standard in Process Stock, that was the hold area for the waiting parts before they went to the next process. In the simulation model, buffer acted as SIPS. Next, Operator 2 inspected and assembled the snap and fit for the mother part. Operator 3 inspected, assembled snap and fit, assembled the bushes, brake cover and parts for the accelerator and brake pedals. The finished assembled accelerator and brake pedals were put separately on SIPS 3 and SIPS 4. Operator 4 assembled the base part, tension spring, bolts and nuts, accelerator and brake pedal using jig and power tool. Finally, the finished good was put on the finished good rack.
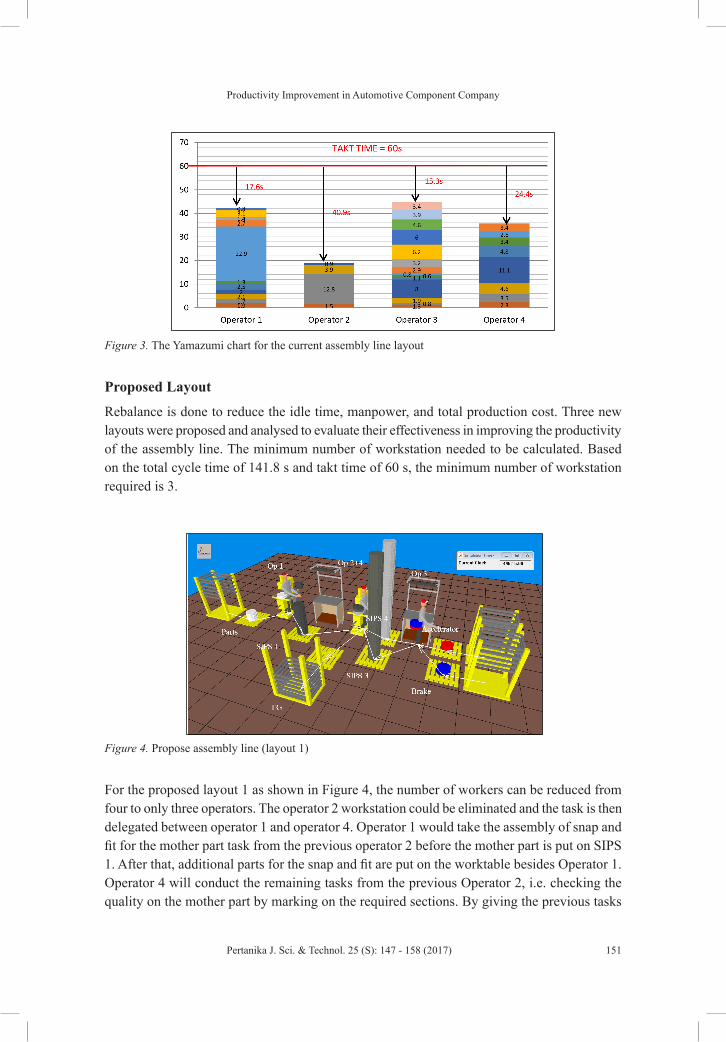
The takt time for the current layout is 60 second per piece. This is based on the total working duration of 31,500 seconds and the demand per day is 525 pieces. Meanwhile, the efficiency of the current layout is 59.08%. Based on the time study that had been conducted, all the data from the current assembly line were visualised in a stack bar chart. Based on Figure 3, the average cycle time for Operator 1 is 42.4 seconds, Operator 2 is 19.1 seconds, Operator 3 is 44.7 seconds and Operator 4 is 35.6 seconds. The main problem with the current layout is the unbalanced workload between each workstation that leads to bottleneck and high idle time.
Productivity Improvement in Automotive Component Company
151Pertanika J. Sci. & Technol. 25 (S): 147 - 158 (2017)
Then, the base part was transferred to SIPS 1, which is also known as Standard in Process
Stock, that was the hold area for the waiting parts before they went to the next process. In
the simulation model, buffer acted as SIPS. Next, Operator 2 inspected and assembled the
snap and fit for the mother part. Operator 3 inspected, assembled snap and fit, assembled
the bushes, brake cover and parts for the accelerator and brake pedals. The finished
assembled accelerator and brake pedals were put separately on SIPS 3 and SIPS 4.
Operator 4 assembled the base part, tension spring, bolts and nuts, accelerator and brake
pedal using jig and power tool. Finally, the finished good was put on the finished good
rack.
The takt time for the current layout is 60 second per piece. This is based on the total
working duration of 31,500 seconds and the demand per day is 525 pieces. Meanwhile, the
efficiency of the current layout is 59.08%. Based on the time study that had been
conducted, all the data from the current assembly line were visualised in a stack bar chart.
Based on Figure 3, the average cycle time for Operator 1 is 42.4 seconds, Operator 2 is
19.1 seconds, Operator 3 is 44.7 seconds and Operator 4 is 35.6 seconds. The main
problem with the current layout is the unbalanced workload between each workstation that
leads to bottleneck and high idle time.
Figure 3. The Yamazumi chart for the current assembly line layout
Proposed Layout
Rebalance is done to reduce the idle time, manpower, and total production cost. Three new layouts were proposed and analysed to evaluate their effectiveness in improving the productivity of the assembly line. The minimum number of workstation needed to be calculated. Based on the total cycle time of 141.8 s and takt time of 60 s, the minimum number of workstation required is 3.
Figure 3. The Yamazumi chart for the current assembly line layout
Proposed Layout
Rebalance is done to reduce the idle time, manpower, and total production cost. Three new
layouts were proposed and analysed to evaluate their effectiveness in improving the
productivity of the assembly line. The minimum number of workstation needed to be
calculated. Based on the total cycle time of 141.8 s and takt time of 60 s, the minimum
number of workstation required is 3.
Figure 4. Propose assembly line (layout 1)
For the proposed layout 1 as shown in Figure 4, the number of workers can be reduced
from four to only three operators. The operator 2 workstation could be eliminated and the
task is then delegated between operator 1 and operator 4. Operator 1 would take the
assembly of snap and fit for the mother part task from the previous operator 2 before the
mother part is put on SIPS 1. After that, additional parts for the snap and fit are put on the
worktable besides Operator 1. Operator 4 will conduct the remaining tasks from the
previous Operator 2, i.e. checking the quality on the mother part by marking on the
Figure 4. Propose assembly line (layout 1)
For the proposed layout 1 as shown in Figure 4, the number of workers can be reduced from four to only three operators. The operator 2 workstation could be eliminated and the task is then delegated between operator 1 and operator 4. Operator 1 would take the assembly of snap and fit for the mother part task from the previous operator 2 before the mother part is put on SIPS 1. After that, additional parts for the snap and fit are put on the worktable besides Operator 1. Operator 4 will conduct the remaining tasks from the previous Operator 2, i.e. checking the quality on the mother part by marking on the required sections. By giving the previous tasks

Muhammad Fikri Alif Dzulkarnain and Wan Emri Wan Abdul Rahaman
152 Pertanika J. Sci. & Technol. 25 (S): 147 - 158 (2017)
from Operator 2 to operator 1 and operator 4, some tasks from Operator 4 could be eliminated, i.e. taking mother part from SIPS 2. This will reduce 3.5 seconds from the overall task times. Instead of doing that, after quality check based on marking, the mother part could be put straight on the jig, which may take around 0.9 seconds. There was no proper rack for SIPS 2 as previously the completed mother part by operator 2 was either put on the worktable or put back on SIPS 1. The worktable of the previous Operator 2 was moved nearer to the worktable of Operator 4 in order to minimise the time wasted for walking and thus, ease the movement of the operator to do the tasks. As for Operator 3, all the tasks that were required to be done would remain. This could reduce a total of 3.5 seconds from the overall task time. Figure 5 shows the Yamazumi chart that summarises the time taken to complete the task at each workstation.
required sections. By giving the previous tasks from Operator 2 to operator 1 and operator
4, some tasks from Operator 4 could be eliminated, i.e. taking mother part from SIPS 2.
This will reduce 3.5 seconds from the overall task times. Instead of doing that, after
quality check based on marking, the mother part could be put straight on the jig, which
may take around 0.9 seconds. There was no proper rack for SIPS 2 as previously the
completed mother part by operator 2 was either put on the worktable or put back on SIPS
1. The worktable of the previous Operator 2 was moved nearer to the worktable of
Operator 4 in order to minimise the time wasted for walking and thus, ease the movement
of the operator to do the tasks. As for Operator 3, all the tasks that were required to be
done would remain. This could reduce a total of 3.5 seconds from the overall task time.
Figure 5 shows the Yamazumi chart that summarises the time taken to complete the task at
each workstation.
Figure 5. Yamazumi chart for the proposed assembly line (Layout 1)
For the proposed layout 2 shown in Figure 6, the number of workers can be reduced
from four to three operators. This layout shows one piece flow of material, where the
material flow from left to right in one direction as compared to the original layout, where
Figure 5. Yamazumi chart for the proposed assembly line (Layout 1)
For the proposed layout 2 shown in Figure 6, the number of workers can be reduced from four to three operators. This layout shows one piece flow of material, where the material flow from left to right in one direction as compared to the original layout, where the finished goods end at the centre of the layout. Based on this proposed layout, the operator who was involved in the final assembly was moved to the end position. Some of the tasks by Operator 3 previously (e.g., acquiring the accelerator pedal, checking the hole for the snap and fit, and quality checking using the marker) could be transferred to Operator 4. Additional work is given to Operator 1, where he/ she would take the assembly of snap and fit for the mother part from Operator 2 before the mother part was put on SIPS 1. Additional parts for the snap and fit are put on the working table next to Operator 1. Operator 3 would take the tasks from Operator 2 which includes checking the quality of the mother part based on marking the required sections. The worktable was moved nearer to Operator 3 in order to minimize the time waste due to walking. It was proposed that Operator 4 takes the task done by Operator 2 previously, which includes

Productivity Improvement in Automotive Component Company
153Pertanika J. Sci. & Technol. 25 (S): 147 - 158 (2017)
quality checking based on marking on the mother part, other than producing the final assembly of all parts. The finished goods rack was moved to the end of the assembly line. Figure 7 shows the Yamazumi chart that summarises the time taken to complete the task at each workstation for the proposed Layout 2.
the finished goods end at the centre of the layout. Based on this proposed layout, the
operator who was involved in the final assembly was moved to the end position. Some of
the tasks by Operator 3 previously (e.g., acquiring the accelerator pedal, checking the hole
for the snap and fit, and quality checking using the marker) could be transferred to
Operator 4. Additional work is given to Operator 1, where he/ she would take the
assembly of snap and fit for the mother part from Operator 2 before the mother part was
put on SIPS 1. Additional parts for the snap and fit are put on the working table next to
Operator 1. Operator 3 would take the tasks from Operator 2 which includes checking the
quality of the mother part based on marking the required sections. The worktable was
moved nearer to Operator 3 in order to minimize the time waste due to walking. It was
proposed that Operator 4 takes the task done by Operator 2 previously, which includes
quality checking based on marking on the mother part, other than producing the final
assembly of all parts. The finished goods rack was moved to the end of the assembly line.
Figure 7 shows the Yamazumi chart that summarises the time taken to complete the task at
each workstation for the proposed Layout 2.
Figure 6. The proposed assembly line (Layout 2)
SIPS 3
Figure 6. The proposed assembly line (Layout 2)
Figure 7. The Yamazumi chart for the proposed assembly line (Layout 2)
For the proposed Layout 3 (Figure 8), the number of workers can be reduced from
four to three operators. Based on the original layout, Operator 4 who was involved with
the final assembly is moved to the end position. All the tasks for operator 1 remain the
same. Operator 3 will take all the previous tasks from Operator 2, except for checking the
quality of the mother part by marking the required sections that are transferred to operator
4. The finished goods rack is moved to the end of the assembly line. A total of 1.1 second
could be reduced from the overall task time, which mainly comes from the previous tasks
by Operator 4. Figure 9 shows the Yamazumi chart that summarises the time taken to
complete the task at each workstation.
Figure 7. The Yamazumi chart for the proposed assembly line (Layout 2)
For the proposed Layout 3 (Figure 8), the number of workers can be reduced from four to three operators. Based on the original layout, Operator 4 who was involved with the final assembly is moved to the end position. All the tasks for operator 1 remain the same. Operator 3 will take all the previous tasks from Operator 2, except for checking the quality of the mother part by marking the required sections that are transferred to operator 4. The finished goods rack is moved to the end of the assembly line. A total of 1.1 second could be reduced from the overall task time, which mainly comes from the previous tasks by Operator 4. Figure 9 shows the Yamazumi chart that summarises the time taken to complete the task at each workstation.

Muhammad Fikri Alif Dzulkarnain and Wan Emri Wan Abdul Rahaman
154 Pertanika J. Sci. & Technol. 25 (S): 147 - 158 (2017)
RESULTS AND DISCUSSION
All the proposed layouts have been analysed using DELMIA Quest in order to check the effectiveness of each layout in terms of their productivity and line efficiency. The outcome was further analysed to determine the optimum layout in improving productivity. The simulation was run at 100% efficiency, or 31,500 seconds, which is the available time for the production line to run daily. However, it is impossible to run the production line at 100% efficiency due to the machine and limitation of the operator to run constantly and efficiently throughout the shift. Therefore, some allowances need to be applied to the machine availability and operator capacity. There are three types of allowance identified such as setup, breakdown and fatigue of the operators, as shown in Table 1.
Figure 8. Proposed assembly line (Layout 3)
Figure 9. The Yamazumi chart for the proposed assembly line (Layout 3)
RESULTS AND DISCUSSION
All the proposed layouts have been analysed using DELMIA Quest in order to check the
effectiveness of each layout in terms of their productivity and line efficiency. The outcome
was further analysed to determine the optimum layout in improving productivity. The
simulation was run at 100% efficiency, or 31,500 seconds, which is the available time for
SIPS 1
Figure 8. Proposed assembly line (Layout 3)
Figure 8. Proposed assembly line (Layout 3)
Figure 9. The Yamazumi chart for the proposed assembly line (Layout 3)
RESULTS AND DISCUSSION
All the proposed layouts have been analysed using DELMIA Quest in order to check the
effectiveness of each layout in terms of their productivity and line efficiency. The outcome
was further analysed to determine the optimum layout in improving productivity. The
simulation was run at 100% efficiency, or 31,500 seconds, which is the available time for
SIPS 1
Figure 9. The Yamazumi chart for the proposed assembly line (Layout 3)
Table 1 Total machine availability and operator capacity per shift in the assembly line
Type of allowance Percentage of allowance (%)Setup allowance 2.5Breakdown allowance 7.5Operator fatigue allowance 5

Productivity Improvement in Automotive Component Company
155Pertanika J. Sci. & Technol. 25 (S): 147 - 158 (2017)
Based on the information in Table 1, the new line efficiency is expected to be 85%. In order to check the overall efficiency and productivity of all the proposed layouts, simulation was performed for 26,775 seconds, which is the available time for the production line to run daily when the line is running at 85% efficiency. Table 2 and Table 3 show the comparison between the current layout and the proposed layouts when the line was running at 100% and 85% efficiency, respectively.
Table 2 A comparison between the current layout and three proposed layouts when labours and machines worked at 100% efficiency
Key Performance Index (KPI) Existing layout
Proposed layout1 2 3
No. of workers 4 3 3 3Productivity (pieces/ day) 702 661 644 614Labour productivity (pieces/ hour/ man) 20.1 25.2 24.5 23.4Line efficiency (%) 59.08 76.94 78.78 78.17
Table 3 A comparison between the current layout and three proposed layouts when labours and machines worked at 85% efficiency
Key Performance Index (KPI) Existing layout
Proposed layout1 2 3
No. of workers 4 3 3 3Productivity (pieces/ day) 594 561 547 522Labour productivity (pieces/ hour/ man) 17 21.4 20.8 19.9Line efficiency (%) 69.51 90.52 92.75 92.03
Based on the existing layout, the simulated results showed that it was capable to produce 702 pieces and 594 pieces per day when the line was running at 100% and 85% efficiency, respectively. The existing layout has no problem to achieve the current demand of 525 pieces per day even when the line is running at 85% efficiency. However, it requires 4 workers to assemble the component. The proposed layout requires three workers and this could result in a saving of about RM12,000 annually for eliminating one manpower.
Based on the three proposed layouts, layout 3 was eliminated because the productivity had a short of 3 pieces when the assembly line was at 85% efficiency. In reality, the production line would be expected to run at an efficiency of as low as 85% as no production line could operate at 100% efficiency when taking into account the time consumed for setup, breakdown and operator fatigue.
Meanwhile, the proposed layout 1 is preferred because it performs better in terms of production capacity, labour productivity and able to meet the daily demands of 525 pieces. Based on the data presented in Table 2 and Table 3, the results for the proposed layout 1 show that the daily production output was 661 and 561 pieces, respectively, when the line ran at

Muhammad Fikri Alif Dzulkarnain and Wan Emri Wan Abdul Rahaman
156 Pertanika J. Sci. & Technol. 25 (S): 147 - 158 (2017)
100% and 85% efficiency, where it could produce more than required. The proposed layout 1 is much better than layout 2 in terms of productivity, whereby it exceeds as much as 36 pieces based on the current demand compared 22 pieces achieved by layout 2. The one with the higher productivity is better as the efficiency might drop below 85%. The proposed layout 1 is much better in coping with the fluctuation in customers’ demand and when the efficiency drops below 85%.
In addition, the proposed layout 1 incurs lower cost as compared to layout 2. The proposed layout 1 would only require the operator to move closer to the worktable compared to the original layout. Other than that, additional cost is required to produce a proper rack for SIPS 2, in which the original layout required operator 2 to just put the complete assembled part either on the worktable or on SIPS 1 again. The proposed layout 2 is costly to be implemented because it uses hydraulic system power tools for operator 4 to tighten bolts and nuts. As the worktable is to be moved to the end, a lot of adjustment is required to attach the hydraulic system to the worktable of Operator 4. Additional cost is also required to make an additional proper rack for SIPS 2.
CONCLUSION
The objective of this study is to improve productivity in the automotive industry using line balancing technique. Performance of the existing layout is unsatisfactory due to low efficiency and high idle time. Three proposed layouts have been presented and compared in terms of their manpower requirement, line efficiency, labour productivity, production capacity and manpower utilisation. All the three proposed layouts have also been tested in terms of robustness so as to determine the optimum layout when the production line works at 100% and 85% efficiency, respectively, and when there is fluctuation in customers’ demand. The effectiveness of each layout has been simulated and evaluated using DELMIA Quest. The results show that all the proposed layout presented the same results in terms of reduction in manpower. Overall, the proposed layout 1 was found to be the optimum layout in terms of line efficiency, labour productivity, production capacity and robustness when the line works at 100% and 85% efficiency, although layouts 2 and 3 were shown to be better in terms of line efficiency. Based on the calculation, the proposed layout 1 could save up to RM12,000 per year, which is a significant cost saving in the overall revenue for the company. Therefore, the proposed layout 1 is recommended for the management of a company as it will reduce one operator in the assembly line, and increase the utilisation of operators, line efficiency, and labour productivity. Thus, this could increase the company’s overall productivity. This study has proven that in line balancing issue, efficiency may not be the only criterion or measurement that may be used to decide the best layout, especially in cases where options are almost equivalent to each other. In this study, the robustness of all the three proposed layouts against various important parameters, such as fluctuation in demand and production output when the workers and machine runs at 100% and 85% efficiency, had been considered. A robust layout will have the capacity to perform better in an actual live environment where change and uncertainty are common.
Productivity Improvement in Automotive Component Company
157Pertanika J. Sci. & Technol. 25 (S): 147 - 158 (2017)
ACKNOWLEDGEMENT
The authors would like to thank Suria Component Manufacturing (M) Sdn Bhd, for providing all necessary facilities and information for this research.
REFERENCES Diego-Mas, J. A., Santamarina-Siurana, M. C., Alcaide-Marzal J., & Cloquell-Ballester, V. A. (2009).
Solving facility layout problems with strict geometric constraints using a two-phase genetic algorithm. International Journal of Production Research, 47(6), 1679 – 1693.
Heizer, J., & Render, B. (2009). Flexible Edition Operations Management (9th Ed.). Pearson International Edition, 300-315.
Holweg, M. (2007). The genealogy of lean production. Journal of Operations Management, 25(2), 420-437.
Taj, S., & Berro, L. (2006). Application of constrained management and lean manufacturing in developing best practices for productivity improvement in an auto-assembly plant. International Journal of Productivity and Performance Management, 55(3), 332 – 340.
Tompkins, J. A. (1996). Facilities planning (2nd ed.). New York: Wiley.
Vaidya, R. D., Shende, P. N., Ansari N. A., & Sorte S. M. (2013). Analysis plant layout for effective production. International Journal of Engineering and Advanced Technology (IJEAT), 2(3), 500 - 504.
Womack, J. P., Jones, D. T., & Roos, D. (1990). The Machine That Change the World. New York: Rawson Associates Scribner.