prof dr. sedef akgÜngÖr. resource allocation in general and the use of capital sources in...
DESCRIPTION
Conceptual Framework The source of capital accumulation is investments. Investments can be seperated into two categories: physical and non physical. The first includes, customarily, buildings, machinery and equipment. The second is mainly investments in human capital, education, health, culture, science and technology. In order to be clear about the definition “constant capital investments” term will be used to mention the investments that are used for producing commodities and services. 3TRANSCRIPT

PROF DR. SEDEF AKGÜNGÖR

Resource allocation in general and the use of capital sources in particular is one of the most important and controversial subjects in economics.
As capital is considered the prime mover of all types of surplus creation process, the utilisation of capital sources becomes the primary explanatory factor of the economy.
2

Conceptual FrameworkThe source of capital accumulation is investments.
Investments can be seperated into two categories: physical and non physical.
The first includes, customarily, buildings, machinery and equipment.
The second is mainly investments in human capital, education, health, culture, science and technology.
In order to be clear about the definition “constant capital investments” term will be used to mention the investments that are used for producing commodities and services .
3

The amount and the quality of gross constant capital investments, which remain a flow concept and the sectoral distribution are the main indicators in analysing how capital sources are utilised.
The total amount of capital investments in the GDP (gross domestic product) shows the amount of total income that is not consumed but seperated for reproduction, i.e. further growth of the economy.
4

Gross capital formation (this notation is used by the Worldbank) consists of outlays on additions to the fixed assets of the economy plus net changes in the level of inventories.
Fixed assets include land improvements (fences, ditches, drains, and so on); plant, machinery, and equipment purchases; and the construction of roads, railways, and the like, including schools, offices, hospitals, private residential dwellings, and commercial and industrial buildings.
Inventories are stocks of goods held by firms to meet temporary or unexpected fluctuations in production or sales, and work in progress. Net acquisitions of valuables are also considered capital formation.
5
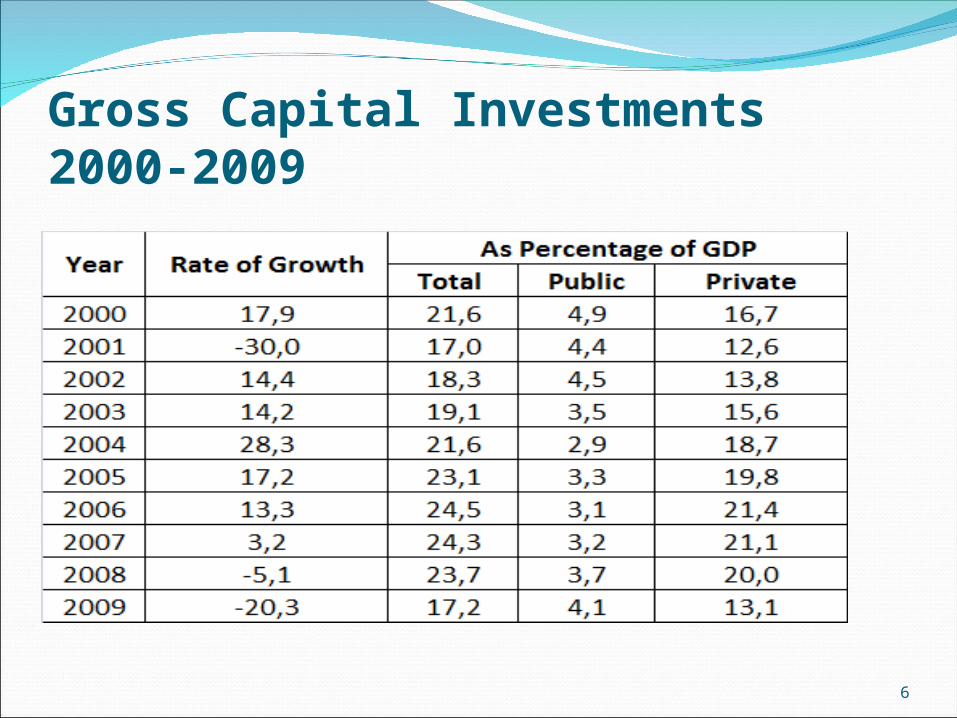
Gross Capital Investments 2000-2009
6

During the 1980s, the ratio of GCI (gross constant capital investments, term used by Yakup Kepenek) in GDP was around 21 per cent.
During the 1990s , the ratio was close to 24 per cent.
After the severe economic crisis of 2001, the ratio of GCI in GDP declined from 21,6 per cent to 17 per cent.
After 2001 , the ratio had an increasing trend till 2009.
7
Qualitative aspects of investments are defined only on the grounds of the sectoral distribution of the GCI from both private and public sources.
If trends of public and private investments are examined for Turkey, the relative share of the first is much lower and had a decreasing trend throughout the years.
8

Composition of Gross Capital Investment in GDP, 2000-2009
9

Sectoral Distribution of Gross Investments 2006-2010
10

Sectoral Distribution of Gross Investments between private and public sectors ,2004-2009
11

12
During the mid 2000s the main share of private investments were in manufacturing with 44 per cent of the total .
This overall total indicates that manufacturing is able to attract investments ,ceteris paribus, irrespective of its nature and quality, which should be considered a positive sign for the economic improvement of the country.
The second largest share of the private GCI is in transportation and communication with about 17 per cent of the total.
Third one is housing with 15 per cent. This is traditionally a private investment area and was stimulated by TOKİ (Housing Development Administration) during the 2000s.
Thus, these three sectors have more than 75 per cent of private GCI while in all other sectors the shares are less than 10 per cent.

13
The FDI (foreign direct investments)
The FDI are one of the types of financial inflows to the economy.
The other two are foreign borrowing and short term capital inflows.
The FDI are those investments ,like constant capital investments,which are made for producing goods and services in the country.
FDI is thought to be the factor that is closing the savings gap.
14

The extensive globalisation of the financial capital has created a situation where the importance of the FDI (foreign direct investments) has increased into unprecedented dimensions.
Attracting foreign capital has become one of the most important economic policy devices, especially after 1990s.
In Turkey, before 1980 the FDI was primarily directed at increasing manufacturing output, via either public or private ownerships.
However , later the FDI changed drastically from both angles, in quantitative and qualitative terms.
15

Before 1980, 85 per cent of FDI was made made in manufacturing, mostly in automotive, electrical machinery and electronics and other metallic commodities.
These FDI dominated manufacturing sectors were followed by food and beverages, and glass and chemicals.
During the import substituting industrialisation, the FDI were mainly allocated to producing consumer goods, durable and nondurable ones for the domestic market, which was protected from foreign competition.
16

After 1980 when the economy was fully liberalised, the FDI had extremely favourable conditions, unlike before.
Almost all sectors, such as banking, insurance, trade, agriculture, mining and some service sectors were opened up to the FDI.
In addition,bureaucratic procedures were simplified and monetary transfers, including profits, were eased.
In order to make a more favourable investment environment for the FDI, labour and tax lws were issued.
Free zones were established.
17

After 1980 the total FDI increased very steeply.
After August 1989, the process of opening up the economy reached its highest levels when capital markets were completely liberalised and the process of privatisation was strongly implemented and conditions for the FDI become much more favourable.
Although the amount of FDI inflow during the 1990s was more than four times than that of the 1990s, the economic and political instability, economic crises and high rates of inflation did not permit a full-scale FDI inflow during the 1990s.
18

Golden years of the FDI inflow are the 2004-2008 period.
For example, in 2005 the yearly FDI is more than the total of the 1990s.
It more than doubled in the next year and continued thereafter until the economic crisis of 2008-2009.
During the 2000s, about 70-80 per cent of the FDI came from Europe and mostly from the EU countries.
Except in 2007 when its share was 25 per cent ,the US had about 5-7 per cent of the FDI where the rest came mainly from the Middle East.
19

Foreign Direct Investments after 1980
20

NET Foreign Direct Investments after 1980
21

Sectoral Distribution of FDIThe primary qualitative aspect of the FDI is its sectoral
distribution.
There is a huge increase in the inflow of the FDI to the services sector in recent years.
Some qualifications are needed to understand this increase in the FDI in the services sector.
After 2005, the FDI in the electricity and gas sector increased rapidly,and gained a larger percentage of the total.
It is possible that as a result of international developments in the energy market and the place of Turkey in this framework, the relative share of this sector my have an increasing trend.
22

The are specific reasons behind the qualitative change in the FDI.
First, there was no industrialisation policy followed by the government after 1980s, except some incentives which were directed at export promotion.
Thus, the FDI in manufacturing,however limited it may be, was mainly an outcome of that policy.
23
Second, the most important reason for the tremendous increase in FDI during the 1990s and 2000s wasthe opening up of these sectors in generaland the privatisation drive in particular.
The restructuring of the banking sector and sales of banks to foreigners had increased the FDI in that sector.
In addition all types of financial services were the most impressive sub sector for foreign capital.
Another sub sector that goes alongside banking is communication.
24

Third, among the service sectors that attracted FDI flow was real estate, including construction and renting activities.
Fourthly, the FDI is gaining new ground in wholesale and retail trade , and the health services.
The common characteristic of these sectors is the higher rate of short term profits.
25

Sectoral Distribution of FDI,2004-2009
26

Sectoral Distribution of the FDI,2004-2009
27

Investment Incentives
Investment incentives are important policy devices.
They can be provided according to specific targets, such as the type of production which underlines the sectoral distribution of incentives.
In addition, incentives can be given for other reasons, especially for stimulating regional development.
28

The main types of investment incentives are
tax and duty exemptions; export promotions; facilitating marketing abroad and designing
fairs;research and development; environmental considerations; tax rebates; exemptions from custom duties; easing imports by other means; and the free use of some export earnings.
29

During the 2002-2008 period investment incentives, that is the ratio of investments that benefited from incentives were 17,2 per cent of total investments of all types, including foreign investments.
However, this ratio had a diminishing trend.
It was highest with about 33 per cent in 2003 and went down to around 13 per cent during the last two years.
30
When the sectoral breakdown of incentives according to the “Incentive Certificates” are considered, manufacturing gets the highest share ranging between 62 per cent in 2004 and 48 per cent in 2007 of the total share.
Services have a third of the total, while mining and agriculture have 1,5 and 3,0 per cent of the total respectively.
31

Regional breakdown of the investment incentive certificates
32

It can be concluded from the incentive figures that the incentives are not used as an effective policy tool for the converging of the less developed regions of the country towards the more developed ones.
Incentives can be classified according to type.
On average about 70 per cent of incentives are allocated to totally new investments, while roughly 20 per cent goes to expansion investments.
These are followed by “completion,renovation,restoration and modernization” investments that make up a few percentage points on average.
33

ConclusionThe allocation of capital investments is essentially market
driven.
With an extremely liberalised and globalised framework this process can be considered as anatural outcome in itself.
The question is whether this policy facilitates the expansion of the production possibilities of the economy such that the country will converge towards the production level of the advanced economies.
To find out if these crucial criteria are fulfilled, two variables are needed to be established:one is the rate of economic growth;the other is the qualitative aspects of capital accumulation.
34