pt bank danamon indonesia tbk · 3.1 2.5 1.8 3.5 2.0 2.7 1.9 1.7 2.7 0.8 trading household...
TRANSCRIPT
PT Bank Danamon Indonesia Tbk terdaftar dan diawasi oleh OJK
P T B a n k D a n a m o n I n d o n e s i a T b k
A n a l y s t B r i e f i n g 9 M 2 0 1 8
Jakarta, 24 October 2018
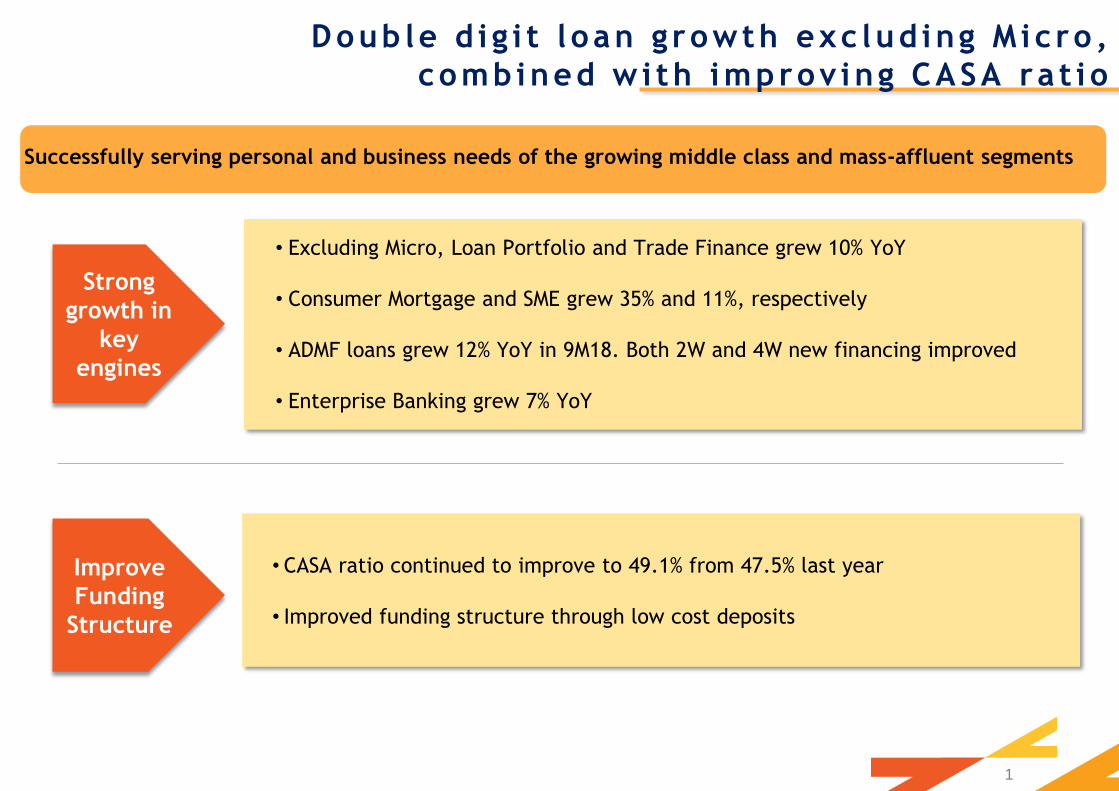
• CASA ratio continued to improve to 49.1% from 47.5% last year
• Improved funding structure through low cost deposits
• Excluding Micro, Loan Portfolio and Trade Finance grew 10% YoY
• Consumer Mortgage and SME grew 35% and 11%, respectively
• ADMF loans grew 12% YoY in 9M18. Both 2W and 4W new financing improved
• Enterprise Banking grew 7% YoY
1
Doub le d i g i t l oan g rowth exc lud ing M ic ro ,
combined w i th improv ing CASA ra t i o
Strong
growth in
key
engines
Improve
Funding
Structure
Successfully serving personal and business needs of the growing middle class and mass-affluent segments
2
9M 2018 Ba lance Sheet H i gh l i ght s
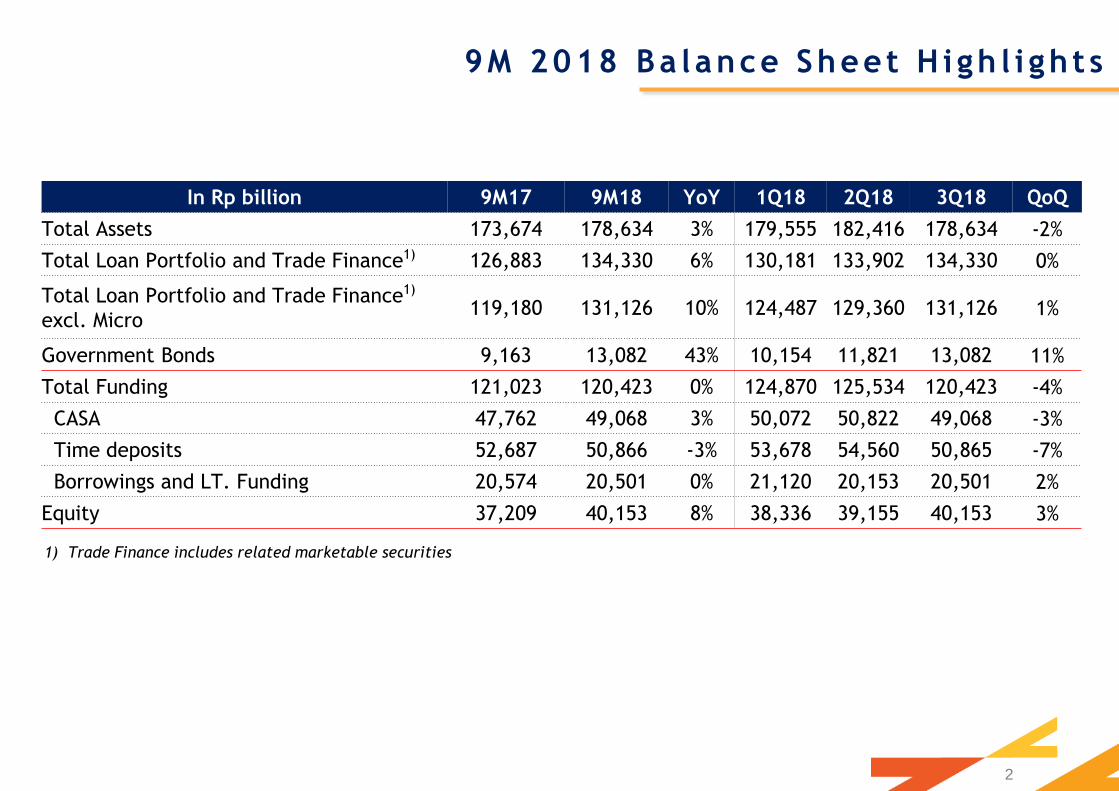
1) Trade Finance includes related marketable securities
In Rp billion 9M17 9M18 YoY 1Q18 2Q18 3Q18 QoQ
Total Assets 173,674 178,634 3% 179,555 182,416 178,634 -2%
Total Loan Portfolio and Trade Finance1) 126,883 134,330 6% 130,181 133,902 134,330 0%
Total Loan Portfolio and Trade Finance1)
excl. Micro 119,180 131,126 10% 124,487 129,360 131,126 1%
Government Bonds 9,163 13,082 43% 10,154 11,821 13,082 11%
Total Funding 121,023 120,423 0% 124,870 125,534 120,423 -4%
CASA 47,762 49,068 3% 50,072 50,822 49,068 -3%
Time deposits 52,687 50,866 -3% 53,678 54,560 50,865 -7%
Borrowings and LT. Funding 20,574 20,501 0% 21,120 20,153 20,501 2%
Equity 37,209 40,153 8% 38,336 39,155 40,153 3%

3
9M 2018 Income S ta tement
1) Consist of fee income of Rp2,624 bn 9M17 vs Rp2,425 bn 9M18
2) Pre-Provision Operating profit
3) Due to signing of Conditional Sale and Subscription Agreement related to divestment of Adira Insurance, as presented in
published financial statements, Adira Insurance’s net income is presented in a separate line of profit or loss as net income from
disposal group classified as held-for-sale. See appendix for the consolidated financial statement under PSAK 58 (IFRS 5)
In Rp billion 9M17 9M18 YoY 1Q18 2Q18 3Q18 QoQ
Net Interest Income 10,581 10,825 2% 3,599 3,613 3,613 0%
Net Interest Income excl. micro 9,819 10,461 7% 3,439 3,493 3,529 1%
Non Interest Income 1) 2,607 2,435 -7% 795 812 828 2%
Operating Income 13,188 13,260 1% 4,394 4,425 4,441 0%
Operating Expenses 6,390 6,439 1% 2,118 2,149 2,172 1%
PPOP2) 6,798 6,822 0% 2,275 2,277 2,270 0%
Cost of Credit 2,509 2,517 0% 798 888 831 -6%
Operating Profit 4,289 4,305 0% 1,477 1,389 1,439 4%
NPAT3) 3,034 3,038 0% 1,044 967 1,027 6%

In % 9M17 9M18 YoY 1Q18 2Q18 3Q18 QoQ
NIM 9.3 9.0 (0.3) 9.0 9.0 9.0 0.0
CoC 2.7 2.6 (0.1) 2.5 2.8 2.5 0.3
Risk-adjusted NIM 6.6 6.4 (0.2) 6.5 6.2 6.5 0.3
Cost to Income 48.4 48.6 0.2 48.2 48.6 48.9 (0.3)
CASA Ratio 47.5 49.1 1.6 48.3 48.2 49.1 0.9
Regulatory LFR 93.8 - - 93.5 94.1 98.5 (4.4)
RIM - 100.9 - - 96.3 100.9 (4.6)
NPL Gross 3.3 3.0 0.3 3.1 3.3 3.0 0.3
NPL Gross, including Trade
Finance1) 3.2 2.9 0.3 3.0 3.1 2.9 0.2
Loan Loss Coverage (LLC) 116.6 126.4 9.8 126.5 124.1 126.4 2.3
ROAA 2.3 2.3 (0.0) 2.3 2.1 2.3 0.2
ROAE 11.6 11.0 (0.6) 11.5 10.6 11.0 0.4
CAR – Consolidated 22.3 22.3 0.0 21.8 21.7 22.3 0.6
4
9M 2018 Key F inanc ia l Ra t io s
1) Trade finance includes related marketable securities
Consolidated Financials – Consolidated Financials –
with SEMM If without SEMM*
9M17 9M18 YoY 9M17 9M18 YoY
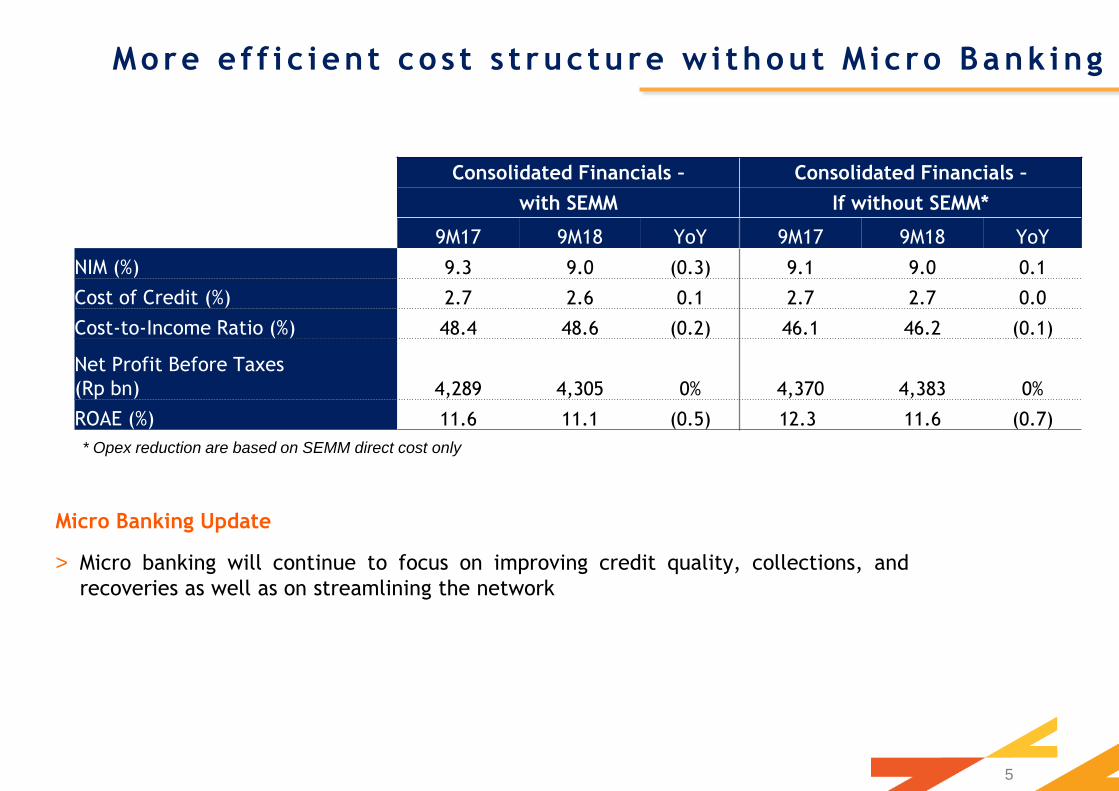
NIM (%) 9.3 9.0 (0.3) 9.1 9.0 0.1
Cost of Credit (%) 2.7 2.6 0.1 2.7 2.7 0.0
Cost-to-Income Ratio (%) 48.4 48.6 (0.2) 46.1 46.2 (0.1)
Net Profit Before Taxes
(Rp bn) 4,289 4,305 0% 4,370 4,383 0%
ROAE (%) 11.6 11.1 (0.5) 12.3 11.6 (0.7)
5
More e f f i c i ent cos t s t ruc ture w i thout M ic ro Bank ing
Micro Banking Update
> Micro banking will continue to focus on improving credit quality, collections, and
recoveries as well as on streamlining the network
* Opex reduction are based on SEMM direct cost only

Regulatory RIM* (%) – Within management target
LDR (%) by BUKU – BUKU 3 Banks posted the highest LDR
• RIM is in line with management’s target.
Moderate increase in RIM will be managed down
in subsequent periods.
• CASA to consolidated funding continued to
improved on the back of higher granular saving
account (Danamon Lebih).
Improved fund ing compos i t i on towards l ow cos t
depos i t s
CASA , TD, & CASA Ratio – CASA ratio continued to improve
93.8 93.3 93.5 94.1
3Q17 4Q17 1Q18 2Q18
LFR
91.6 92.4 91.9 93.4
Ave Daily
74.3 85.3
95.0 86.8 89.2 84.3
91.8 102.4
89.2 93.8
BUKU 4 BUKU 2 BUKU 1 BUKU 3 Industry
6
Aug-17
Aug-18
46 48 49
+3%
3Q16 3Q17 3Q18
58 53 51
-3%
CASA (Rp Tn) TD (Rp tn) CASA Ratio (%)
43.9 47.5 49.1
1.6
100.9
3Q18
RIM

23.8 23.2 22.5 22.5 23.1
Capital Adequacy Ratio (%)
% 3Q17 4Q17 1Q18 2Q18 3Q18
CAR w/ Credit
Risk 28.7 28.2 27.6 27.6 28.3
Market Risk
Charge 0.1 0.1 0.1 0.1 0.1
Operational Risk
Charge 6.3 6.1 5.9 5.8 5.9
CAR
Consolidated 22.3 22.1 21.6 21.7 22.3
Tier 1 and Tier 2 Consolidated Capital Ratio (%)
Cap i ta l cont inued to s t rengthen
Market and Operational Risk Charges (%)
• Danamon’s capital level and internal capital
generation remain strong.
• The capital level is significantly above the minimum
regulatory requirement.
22.3 22.1 21.6 21.7 22.3
4Q17 3Q17 1Q18 3Q18 2Q18
Bank Only Consolidated
21.5 21.3 20.8 21.0 21.5
0.8
22.1
3Q17
0.8
2Q18
0.7 0.8
4Q17
21.6
1Q18 3Q18
22.3 21.7 22.3
0.8
Tier 2 Capital Tier 1 Capital
7

8
Doub le d i g i t l oan g rowth , exc lud ing M ic ro
Composition of Loan Portfolio & Trade
Finance1) (Rp tn)
Growth of Loan Portfolio & Trade Finance1)
6% 5%
35%
22%
7%
3Q17
35%
2%
28% 29%
7%
129.7
2%
8%
4Q17
4%
126.9
35% 36%
22%
2%
28%
37%
1Q18
23%
3%
7%
23%
2%
29%
133.9
2Q18
2%
8%
3Q18
130.2 134.3
2%
28%
23%
1) Trade finance includes related marketable securities.
2) Enterprise Banking: Commercial and Corporate.
3) Unsecured Personal Loan, Credit Card, and Other.
Rp bn 9M17 9M18 YoY QoQ
Enterprise2) & FI 35,676 38,116 7% -1%
SME 27,480 30,536 11% 0%
Consumer 9,111 10,545 16% 5%
Mortgage 5,409 7,318 35% 6%
Others3) 3,703 3,232 -13% 4%
Adira Finance 44,382 49,653 12% 3%
ABF 2,531 2,266 -11% 2%
Total excl Micro 119,181 131,121 10% 1%
SEMM (Micro) 7,702 3,209 -58% -29%
Total 126,882 134,330 6% 0%

Rp bn 9M17 9M18 YoY 2Q18 QoQ
2W auto loans* 20,125 22,030 10% 21,344 3%
4W auto loans* 22,615 25,711 14% 24,790 4%
White goods and
others* 1,643 1,913 17% 1,937 -1%
Adira Finance 44,382 49,653 12% 48,071 3%
ADMF units New Financing vs. Industry
(% YoY growth based on cumulative YTD)
ADMF Outstanding Loan
9
ADMF’s 2W and 4W new f inanc ing amount
grew above the indus t ry
ADMF New Financing amount
(% YoY growth)
-2.0%
14.1% 14.9%
6.0% 6.0%
29.8% 26.2% 28.1%
1Q18
16.5%
-2.0%
9M17 FY17 1H18 9M18
ADMF 2W ADMF 4W
-16.0%
-16.0%
7.0%
4.8%
14.8%
0.0% -1.0%
4.0%
11.2%
8.8%
9M18 9M17 FY17 1Q18 1H18
ADMF 2W Industry 2W
0.0% -2.0%
15.5% 14.3%
22.0%
2.7% 1.7%
2.9%
3.7% 6.6%
1H18 9M17 FY17 9M18 1Q18
ADMF 4W Industry 4W
*Restated to include reclassification of certain collateralized multipurpose
loans into White goods and others.

NIM and Risk-Adjusted NIM
(%)
Non-mass market l oans cont inue g rowing
whi le CoC and N IM a re re la t i ve ly s tab le
Composition of Loan Portfolio & Trade Finance
(Rp tn)
3Q17
78%
22% 23%
126.9
77%
4Q17
21%
79%
1Q18
21%
79%
134.3
2Q18
20%
80%
3Q18
129.8 130.1 133.9
Higher Yield (SEMM +2W+ Durable goods)
Lower Yield (Non-Mass Market + 4W)
6.6 6.5 6.5 6.2 6.5
2.7 2.8 2.5 2.8 2.5
9.3
3Q17 2Q18 4Q17 1Q18 3Q18
9.0 9.3 9.0 9.0
10
CoC Risk Adj NIM

136.721
122.923 130.458
136.175 137.757
3.0
2.6 2.8 2.8 2.7
Both NPL and SM improved YoY
Source : Industry NPL based on SPI as of Aug 2018
12.1 11.0 11.3 11.8 10.8
3.3 2.8 3.1 3.3
3.0
1Q18 3Q17 4Q17 2Q18 3Q18
BDI NPL
BDI-SM
BDI’s NPL NPL amount
(Rp bn)
and
Composition
(% of Total NPL)
Industry’s NPL
Loan
Collectability
(% of Total
Loans)
Industry’s NPL Ratio
5%
3,825
6%
3Q18
23% 25%
27%
43%
3,412
28%
3Q17
28%
3,987
44%
4Q17
36%
32%
5%
35%
6%
1Q18
29%
29%
2Q18
25%
31%
6%
38%
3,875 4,169
Mass Market
Consumer
SME
Enterprise & FI
11

BDI Loans by Sector (% of total loans)
BDI NPL by Sector (%)
Industry Loans by Sector (% of total loans)
Industry NPL by Sector (%)
Source: SPI Aug 18
S teady a s se t qua l i t y i n key sec tor s . NPL in some legacy sec tor s rema ined
18.8 17.3
9.2
6.6 5.4 4.7
3.8 2.6
18.6 16.7
10.4
6.8 5.7
4.7 4.2 2.6
Trading Construction Proccesing Mortgage Transport Agri Mining RE, Rental
& Svcs
Aug-17 Aug-18
4.4
2.9 3.7
3.2 4.1
1.9
3.6
8.0
4.1
2.8 3.0 2.5 2.9
1.5
4.3 4.1
RE, Rental
& Svcs
Agri Trading Transport Mortgage Processing Construction Mining
Aug-17 Aug-18
37.2
16.7 16.6
5.9 4.8 4.3 3.7 1.5
34.8
19.4 16.0
6.7 4.9 4.4 3.0 1.2
Household Trading Proccesing Mining Transport RE, Rental
& Svcs
Agri Construction
Sep-17 Sep-18
3.8
2.2 2.1
4.6
3.1 2.5
1.8
3.5
2.0 2.7
1.9 1.7 2.7
0.8
Mining Construction Trading Household Proccesing
24.1
RE, Rental
& Svcs
Transport Agri
10.3
Sep-17 Sep-18
12
• Sectors experiencing increase in NPL ratios makes up lower percentage of total loans.
• Processing sector makes up 16.0% of total loans. While transport and construction segment only make up 4.9% and 3.0% of
total loans, respectively.

35% 35%
65%
3Q17
34% 32%
65% 72%
28%
68%
4Q17 1Q18
66%
2Q18 3Q18
818 957
798 888 831
Restructured
Loans (% of Total Loans
and Rp bn)
YTD CoC as % of
avg loan
Cost of Credit (% of Avg Loans and
Rp bn)
3,416 3,151 3,164 3,058 3,112
2.8 2.5 2.5
2.3 2.3
1Q18 3Q17 4Q17 2Q18 3Q18
% of total loan
Restructured Loan
2.62.52.82.72.7
13
Non Mass Market
Mass Market
CoC ra t i o and Res t ruc tured loans improved YoY
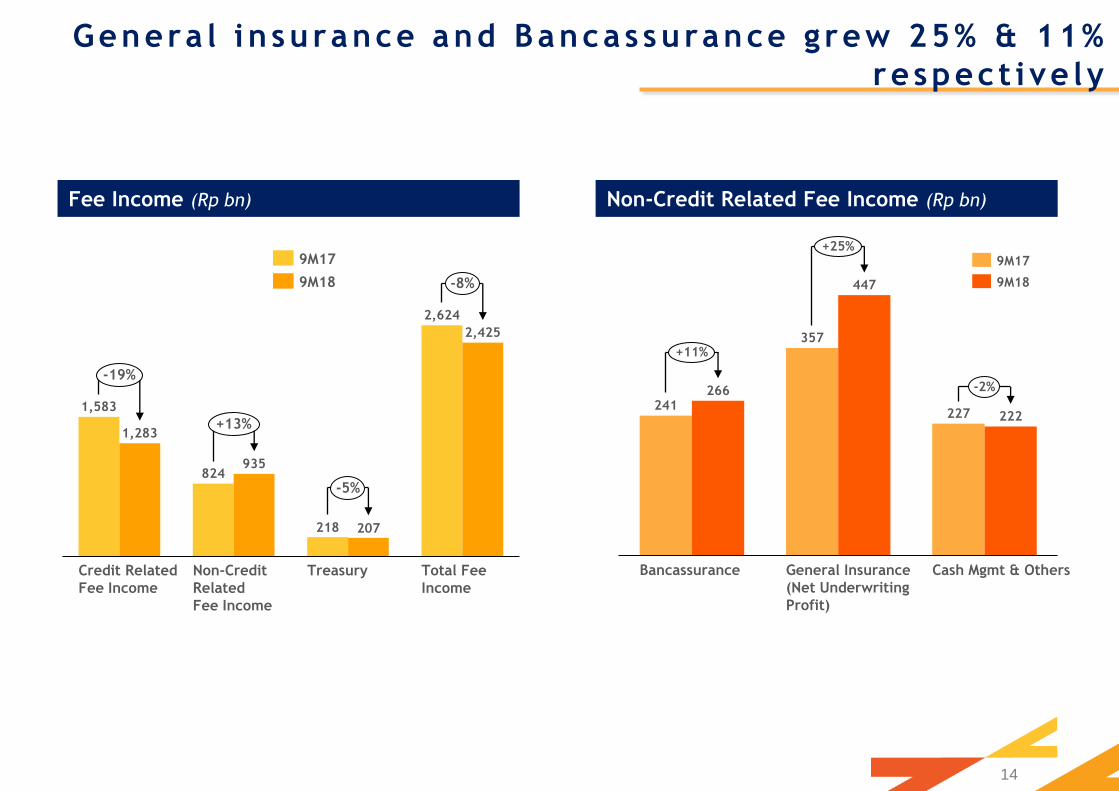
Non-Credit Related Fee Income (Rp bn)
Genera l i n surance and Bancas surance g rew 25% & 11%
respect ive ly
241
357
227
266
447
222
Bancassurance Cash Mgmt & Others General Insurance
(Net Underwriting
Profit)
+11%
+25%
-2%
Fee Income (Rp bn)
1,583
824
218
2,624
1,283
935
207
2,425
Non-Credit
Related
Fee Income
Credit Related
Fee Income
Total Fee
Income
Treasury
-19%
+13%
-5%
-8%
9M17
9M18
14
9M17
9M18

Investor Relations
PT Bank Danamon Indonesia, Tbk Menara Bank Danamon, 16th Floor
Jl. H.R. Rasuna Said Kav. C-10
Setiabudi - Kuningan, Jakarta Selatan 12940
Phone: +62 21 8064 5000
Email: [email protected]
THANK YOU

16
Append ix : Conso l i da ted income s ta tement under
PSAK 58 ( I FRS 5 )
1) Pre-Provision Operating profit
In Rp billion 9M17 9M18 YoY
Net Interest Income 10,425 10,679 2%
Non Interest Income 2,112 1,830 -13%
Operating Income 12,537 12,508 0%
Operating Expenses 6,096 6,143 1%
PPOP1) 6,442 6,366 -1%
Cost of Credit 2,509 2,517 0%
Operating Profit 4,024 3,883 -4%
Profit after tax 2,839 2,796 -2%
Net income from disposal group classified as held-for-sale 305 378 24%
Net Profit After Tax 3,034 3,038 0%
In accordance with PSAK 58 (IFRS 5), as the Bank has signed Conditional Sale and Subscription Agreement (“CSSA”)
with Zurich Insurance Company Ltd. related to the divestment of 70% shares in Adira Insurance; Adira Insurance’s
net income is presented in a separate line of profit or loss as net income from disposal group classified as held-for-
sale