pyrolysis and combustion study of flexible polyurethane foam
TRANSCRIPT

Accepted Manuscript
Title: Pyrolysis and combustion study of flexible polyurethanefoam
Author: M.A. Garrido R. Font
PII: S0165-2370(14)00367-2DOI: http://dx.doi.org/doi:10.1016/j.jaap.2014.12.017Reference: JAAP 3369
To appear in: J. Anal. Appl. Pyrolysis
Please cite this article as: M.A.Garrido, R.Font, Pyrolysis and combustion studyof flexible polyurethane foam, Journal of Analytical and Applied Pyrolysishttp://dx.doi.org/10.1016/j.jaap.2014.12.017
This is a PDF file of an unedited manuscript that has been accepted for publication.As a service to our customers we are providing this early version of the manuscript.The manuscript will undergo copyediting, typesetting, and review of the resulting proofbefore it is published in its final form. Please note that during the production processerrors may be discovered which could affect the content, and all legal disclaimers thatapply to the journal pertain.

Pyrolysis and combustion study of flexible
polyurethane foam
M.A. GARRIDO*, R. FONT
University Institute of Engineering of Chemical Processes, University of Alicante, P.O.
Box 99, E-03080 Alicante
*Email: [email protected]
Abstract
The thermal degradation of flexible polyurethane foam has been studied under different
conditions by thermogravimetric analysis (TG), thermogravimetric analysis-infrared
spectrometry (TG-IR) and thermogravimetric analysis-mass spectrometry (TG-MS). For
the kinetic study, dynamic and dynamic+isothermal runs were performed at different
heating rates (5, 10 and 20 ºC min-1) in three different atmospheres (N2, N2:O2 4:1 and
N2:O2 9:1). Two reaction models were obtained, one for the pyrolysis and another for the
combustion degradation (N2:O2 4:1 and N2:O2 9:1), simultaneously correlating the
experimental data from the dynamic and dynamic+isothermal runs at different heating
rates. The pyrolytic model considered consisted of two consecutive reactions with
activation energies of 142 and 217.5 kJ mol-1 and reaction orders of 0.805 and 1.146.
Nevertheless, to simulate the experimental data from the combustion runs, three
consecutive reactions were employed with activation energies of 237.9, 103.5 and 120.1
kJ mol-1, and reaction orders of 2.003, 0.778 and 1.025. From the characterization of the
ACCEPTED MANUSCRIP
T

sample employing TG-IR and TG-MS, the results obtained showed that the FPUF, under
an inert atmosphere, started the decomposition breaking the urethane bond to produce
long chains of ethers which were degraded immediately in the next step.
However, under an oxidative atmosphere, at the first step not only the urethane bonds
were broken but also some ether polyols started their degradation which finished at the
second step producing a char that was degraded at the last stage.
Keywords: Polyurethane; Kinetics; Pyrolysis; Combustion; Thermogravimetric.
Nomenclature table
αi Conversion degree in the reaction i DTGmax Maximum value in the Derivative Thermogravimetric curve Ei Activation energy for the reaction i FPUF Flexible Polyurethane Foam ki Kinetic constant for the reaction i K i* Compatible kinetic constant for the reaction i ki0 Pre-exponential factor of the Arrhenius equation for the reaction i k'i0 Pre-exponential factor of the Arrhenius equation corrected with the effect of the oxygen for the reaction i MDI Methyl Diphenyl Diisocyanate ni Reaction order for the reaction i Ntotal Total number of experimental data employed in the optimisation P Number of optimised parameters PO2 Partial pressure of oxygen in the atmosphere PU Polyurethane R Gas constant (J mol-1 k-1) TDI Toluene Diisocyanate TG Thermogravimetric analysis TG-IR Thermogravimetric analysis-infrared spectrometry TG-MS Thermogravimetric analysis-mass spectrometry Tref Temperature around the maximum decomposition rate υi inf Mass fraction of volatiles that can be obtained at infinity time from the reaction i Vexp Average of the experimental mass fraction of volatiles V i Mass fraction of volatiles at any time in the reaction i 1. Introduction
Polyurethanes (PUs) are one of the most useful commercial polymers which are widely
used in both industry and everyday life applications. Furniture, particularly mattresses
ACCEPTED MANUSCRIP
T

and interior industry, dominates the polyurethane market accounting for 28.01% of the
total demand in 2010. The most common destination for end-of-life mattresses appears to
be landfilled. However, mattresses account for a large proportion of the total waste sent
to landfill because of their small density (10% by volume according to one study for the
South East of England). This represents a large quantity of material which is not
recovered.
The repeating unit in the polyurethanes is the urethane bond ( )NH COO− − − obtained
from the reaction between an isocyanate ( )N C O− = = and an alcohol ( )OH− . The
most used raw material components of polyurethane foams are polyethers and polyesther
polyols, methyl diphenyl diisocyanate (MDI) and toluene diisocyanate (TDI) [1]. In
addition, a variety of additives, blowing agents and water are added. Two different
blowing agents are employed to the solidifying plastic, carbon dioxide and methylene
chloride. While the carbon dioxide is produced in the reaction between the water and the
isocyanate group, the methylene chloride (CH2Cl2) is added as a supplementary blowing
agent [2].
Pyrolysis and combustion mechanisms and the characterization of polyurethane
polymers have been studied by other authors previously. Herrera et al. [3] used
thermogravimetric analysis-mass spectrometry (TG-MS) and thermogravimetric analysis
coupled with fourier transformed infrared spectroscopy (TG-FTIR) to study the evolved
gas analysis in the thermal degradation of the rigid polyurethane foam in a N2
atmosphere, and they also characterized the products from the combustion and pyrolysis
of samples (about 40 mg) in an oven by gas chromatography-mass spectrometry (GC-
ACCEPTED MANUSCRIP
T

MS) and high performance liquid chromatography analysis with fluorescence detection
(HPLC-FD).
Another group of additives, which has been studied by different authors, are the fire
retardants which are added to the polymer to stop or retard the burning process. Wang et
al. [4] synthesized polyurethanes with different amounts of flame retardant
poly(bispropoxyphosphazene) to study the thermal degradation behavior of these
polyurethanes with TG and TG-FTIR. Gao et al. [5] applied laser pyrolysis and time-of-
flight mass spectrometry to the study of rapid thermal degradation of rigid polyurethane
foams with different ranges of isocyanate and fire retardants. They deduced that the
polypropylene glycol was the major flammable compound evolved during laser pyrolysis
and the concentration of this compound in the volatiles reduced when the amount of
isocyanate increased.
Chao and Wang [6] compared the effect of phosphorus and brominated fire retardants
in thermal decomposition processes setting the different degradation steps in air and
nitrogen, and also proposing thermal degradation mechanisms for the polyurethane.
Rogers and Ohlemiller [7] studied the thermal decomposition of a flexible polyurethane
foam based on TDI and a polyether polyol of propylene oxide with the TG technique. In
nitrogen atmosphere the decomposition proceeded in two overall steps. At the end of the
first step the cellular structure collapsed to a viscid liquid which decomposed further in
agreement with a random nucleation rate law. The activation parameters provided similar
patterns to the experimental TG curves at heating rates of 2 and 20 ºC min-1.
Day et al. [8] carried out an interesting study on the effect of copper, iron and dirt in
the thermal degradation of PU. The results suggested that the presence of metal
ACCEPTED MANUSCRIP
T

contamination in this polymer could influence the thermal degradation. Specifically, it
was found that certain metal contaminants could have a catalytic effect on the
degradation processes.
Bilbao et al. [9] determined the kinetic equations of polyurethane foam weight loss and
analysed the influence of the atmosphere, using nitrogen and air with a TG apparatus.
They also related the results of the kinetic constants obtained from isothermal and
dynamic experiment.
Font et al. [10] studied the thermal decomposition of a polyurethane based adhesive in
an inert atmosphere, using different apparatus, a thermobalance and a laboratory furnace
to study the kinetics of decomposition and the evolution of gaseous products,
respectively. The experimental results were described satisfactorily by a two-parallel
reaction model and the kinetic parameters, that is, the pre-exponential factors, activation
energies, reaction orders and maximum production of volatiles at an infinite time were
also obtained. Gas chromatography-mass spectrometry (GC-MS) was used to identify
volatile and semivolatile organic compounds generated by the thermal degradation
reactions.
The main aim of this paper has been to propose two models to describe the pyrolysis
and combustion degradation of flexible polyurethane foam (FPUF) wastes. In order to
obtain a single set of kinetic parameters for pyrolysis and combustion, a wide range of
runs were performed in each condition. In addition, the evolution of some compounds
during the decomposition has been observed employing TG-MS and TG-IR.
2. Experimental
ACCEPTED MANUSCRIP
T

2.1. Raw material
The FPUF studied was obtained from the mattresses disposed of in a landfill in
Alicante, Spain. The moisture of the polyurethane foam used was 1.2% and the density
was 19.62 kg m-3, the value was within the range proposed by the Polyurethane Foam
Association for mattress topper pads and upholstery [11].
Elemental analysis, determined in a Perkin-Elmer 2400 apparatus, and the Net Calorific
Value determined using an AC-350 LECO Calorimetric Bomb, are shown in Table 1.
Table 2 also shows the weight percentage obtained from the semi-quantitative analysis of
the containing elements, performed by X-ray fluorescence with an automatic sequential
spectrometer (model TW 1480, Philips Magix Pro, Philips Co., Ltd.).
For the analysis of chlorine in the FPUF, the EPA Method 5050 followed by EPA
Method 9056 was used. The foam is oxidized by combustion in the bomb previously
indicated, and the evolved chloride is adsorbed in a sodium carbonate/sodium bicarbonate
solution. A small volume of collection solution is injected into an ion chromatography
with a conductivity detector (Dionex DX-500, Thermo Fisher Scientific). The average
concentration obtained from this analysis in triplicate was 253 mg of chloride per kg of
dry mass (0.0253%). This chloride could come from the methylene chloride (CH2Cl2)
which is used as blowing agent [2].
In order to characterize the real composition of the FPUF, the functional chemical
groups were identified by attenuated total reflection-Fourier transform infrared (ATR-
FTIR) spectroscopy (BRUKER IFS 66/S). The ATR-FTIR was equipped with a single
reflection Golden Gate accessory with a diamond crystal. The spectra were recorded
within the range of 600–4500 cm-1 with a resolution of 1 cm-1.
ACCEPTED MANUSCRIP
T

The spectrum obtained is shown in Error! Reference source not found. The FTIR
spectra shows that the isocyanate (-NCO) absorption band centered at 2230 cm-1 is
clearly missing while the presence of the amide absorption band (N-H) at 3294 cm-1,
carbonyl urethane group (C=O) centered around 1719 cm-1 and the carbamate group (CN-
H) at 1641 cm-1 indicates the urethane linkage in the polyurethane [12]. This fact
confirms that almost all of the diisocyanate groups reacted during the polymerization and
formed urethane linkages and amide groups. On the other hand, the (C-O-C) asymmetric
stretching peak at 1223 cm-1 and the (C-O-C) symmetric stretching peak at 1092 cm-1
represent the aliphatic ether, which confirm that a polyether polyol was used as raw
material instead of polyesther polyol. The peak at 1534 cm-1 symbolises the (C-N)
stretching and the (N-H) in plane bending of the Amide II, while the peaks at 1411 cm-1
and 1597 cm-1 are characteristic of the aromatic ring from diisocyanate. Finally, the peaks
centered at 2971 cm-1 and 2868 cm-1 are assigned to symmetric and asymmetric
stretching mode (C-H) in CH2 and the peak 1373 cm-1 is characteristic of the out of plane
bending mode (C-H) in CH2 [13].
Figure 1.
2.2. Apparatus
2.2.1. Thermogravimetric analysis (TG)
The thermogravimetric analysis (TG) was performed employing two different
apparatus. For the pyrolysis runs a TGA/SDTA-6000 Perkin Elmer Thermobalance was
employed. This apparatus has a vertical furnace and a single beam vertical balance. The
flow rate of nitrogen gas was 100 cm3 min-1. Sample weights were around 7.5 mg.
ACCEPTED MANUSCRIP
T

The combustion runs were carried out in a Setaram TG-DTA 92-16.18 Thermobalance.
Two atmospheres were employed for the study of combustion degradation consisting of a
mixture of nitrogen and oxygen with two different ratios: N2:O2 4:1 and N2:O2 9:1, both
with a flow rate of 100 cm3 min-1.
Dynamic experiments were carried out at different heating rates of 5, 10 and 20 ºC min-
1, from 30 ºC to a final temperature of 900 ºC.
Dynamic+isothermal experiments were also carried out. These experiments started
with a constant heating rate until the set temperature was obtained, and then, the final
temperature was maintained constant throughout the pyrolysis or combustion process for
a long period of time. The final temperatures were selected to cover all the decomposition
range observed in the dynamic experiments.
2.2.2. Thermogravimetric analysis-mass spectrometry (TG-MS)
For the Thermogravimetric-mass spectrometry analysis (TG-MS) a
TGA/SDTA851e/LF/1600 coupled to a Thermostar GSD301T Pfeiffer Vacuum MS
apparatus was employed. Operating conditions common in all runs were: weight sample
around 5 mg, heating rate 30 ºC min-1, ionization 70 eV and SIR (selected ion recording)
detection of several ions during two different runs. In the first run the required ions were
(m/z): 4, 13–18, 25–32, 35–46 and in the second run they were (m/z): 4, 32, 43–46, 50–
52, 55–58, 60, 65, 68, 73, 78, 91, 96, 105, 106. He and He:O2 (4:1) gases were employed
to perform both pyrolytic and oxidative decomposition.
2.2.3. Thermogravimetric analysis-infrared spectrometry (TG-IR)
The thermogravimetric analysis-infrared spectrometry (TG-IR) of the FPUF was
performed using a Perkin-Elmer STA6000 and a Nicolet 6700 FT-IR using nitrogen and
ACCEPTED MANUSCRIP
T

air as carrier gases. About 8 mg of sample was put in a crucible and was heated from 25
to 600ºC with a heating rate of 30 ºC min-1. The absorbance was measured from 4000 to
600 cm-1.
3. Results and discussion
3.1. Initial mass effect
Figure 2 shows the TG results for FPUF with a heating rate of 10 ºC min-1 but with
different initial mass, between 5 to 10 mg in inert atmosphere (N2). In this figure, the
weight fraction represents the ratio between the instantaneous sample mass (including
residue formed and non-reacted initial solid) and the initial sample mass. In view of
Figure 2, it is deduced that the initial value mass has a very small effect in the
decomposition process. It can also be confirmed that FPUF appeared to degrade in two
stage processes [8], one around 275 ºC and the other around 380 ºC, but
Figure 2 also shows another weight loss around 700 ºC. The foam obtained from the
landfill was not clean and CaCO3 can be a part of this dirt, as it can be confirmed
observing Table 2, where the Ca accounts for 9% of dry weight of the sample. The
CaCO3 decomposes around 700 ºC to obtain CaO and CO2 [14], consequently, the
thermal degradation studies for FPUF have been carried out up to 600 ºC, to consider
only the organic fraction. The weight loss due to CO2 obtained from CaCO3 degradation
is around 5% of the total weight loss.
Figure 2 ACCEPTED MANUSCRIP
T

3.2. Analysis of data obtained from the TG-IR.
The TG and DTG curves, obtained in the TG-IR experiments carried out at 30 ºC min-1
in nitrogen and air atmosphere, are shown in Figure 3. It can be observed that the FPUF
decomposes in two steps for an inert atmosphere, with DTGmax at 300 and 397 ºC and in
three steps for air atmosphere with DTGmax at 300, 339 and 550ºC.
Figure 3.
Figure 4 shows the IR spectra obtained at the maximum temperature of evolution rates,
300 and 397 ºC, in nitrogen atmosphere. At the first step, Figure 4(A), of the thermal
degradation (300 ºC) the following peaks of the volatiles evolved can be observed: the
symmetric and asymmetric characteristic stretching vibration of N─H at 3357 cm-1, the
stretching vibration of ─CH2─ groups at 2931 cm-1 and the symetric and asymetric band
of C─O─C in aryl alkyl ethers account for the peaks at 1056 cm-1 and 1217 cm-1.
Furthermore, the formation of CO2 is confirmed by the peak at 2360 cm-1, although
another peak should have been detected around 2310 cm-1, although its vibration region
overlapped with ─NCO vibration region (around 2275 cm-1) [15]. Other peaks are
located between 3400-3900 cm-1 and 1303-1625 cm-1 which suggest the presence of
water vapours in the thermal decomposition gases [16]. These peaks indicate that the
thermal degradation of FPUF in an inert atmosphere starts with the break of urethane
bonds at low temperature. Rupture of hard segments is in accordance with the formation
of great amounts of isocyanates (─NCO) and water vapor [17].
On the other hand, at the second step Figure 4(B), of thermal degradation (397 ºC) the
peaks at 2973 cm-1, 2931 cm-1 and 2877 cm-1 are associated to the stretching vibration of
─CH3, ─CH2 and ─CH, respectively, and these peaks increase greatly with the
temperature [18]. The other products exhibit the characteristic bands of CO2 at 2366 cm-1
ACCEPTED MANUSCRIP
T

and 2327 cm-1 and the presence of carbonyl group in esters (─C═O) at 1745 cm-1. Thus,
the peaks at 910 cm-1, 1375 cm-1 and 1452 cm-1 also indicate the formation of tert-butyl
groups (─C─(CH3)3), in addition to the presence of different types of ethers shown by the
peaks at 1662 cm-1 for the vinyl ethers, and the peaks at 1022 cm-1 and 1278 cm-1 for the
symetric and asymetric absortion band of C─O─C in aryl alkyl ethers [17]. Finally, the
strongest absorption peak is detected at 1108 cm-1, which is due to the stretching
vibration of C─O─C bond from ethers with high polarity. Therefore, in the second stage
of the thermal degradation, the ether polyols obtained in the first stage, are decomposed
to products with methyl, methylene, methine, C─O─C and carbonyl groups, and CO2.
Figure 4.
Figure 5 shows the IR spectra obtained at two maximum temperature of evolution rates,
300 and 339 ºC, in air. At the first step, Figure 5(A), of thermal degradation (DTGmax1 at
300 ºC) the peaks detected at 669 cm-1, 2321 cm-1 and 2362 cm-1 are characteristics of the
formation of CO2, while the presence of absorption bands at 1376-1558 cm-1 and 3400-
3900 cm-1 is attributed to water vapor [16]. The gaseous products evolved for FPUF at
300ºC also exhibit characteristic bands of stretching vibration C-O-C groups from ethers
at 1000-1313 cm-1, carbonyl group in esters (─C═O) at 1745 cm-1 [17] and stretching
vibration C-H at 2800-3000 cm-1 [19]. There are new bands, compared with those
obtained in the pyrolysis experiment, such as 2111 cm-1 and 2167 cm-1 attributed to CO
due to the excess of O2 in the atmosphere [19].
Figure 5.
At the second step, Figure 5(B), of the thermal degradation of FPUF in an oxidative
atmosphere, the presence of CO2 was also detected as the main gas with the peaks at 669
ACCEPTED MANUSCRIP
T

cm-1, 2331 cm-1 and 2364 cm-1 [16]. Furthermore, the characteristic absorption bands of
3400-3900 cm-1 for water vapor [16], 1083 cm-1 and 1220 cm-1 for stretching vibration C-
O-C groups from ethers [17] and 2881-2973 cm-1 stretching vibration C-H [19] have also
been detected in this degradation stage. New peaks have been obtained at 339 ºC as the
blend vibration N-H at 1531 cm-1 and 1592 cm-1 [20], vinyl ethers at 1692 cm-1 and
symmetric and asymmetric stretching vibration N-H at 3355 cm-1 [17].
The TG-IR spectra obtained at the third step (550ºC) show that CO2 and CO are the
only peaks detected which are the products from the combustion char.
Therefore, in the first stage of thermal degradation in N2 atmosphere the most abundant
gaseous products are those with isocyanate groups. At the second step of pyrolysis, part
of the products from the first stage are degraded to obtain, mainly, ─C═O and
hydrocarbon (─CH3, ─CH2 and ─CH) compounds. Nevertheless, with air the compounds
evolved from the first step are mainly with ─C═O groups and CO2, and from the second
step H2O, CO2 and some minority ─N─H compounds are obtained.
3.3. Analysis of data obtained from the TG-MS
Figure 6 shows the variation of the intensity of some ions corresponding to water (ion
18), to hydrogen cyanide (ion 27) and to carbon dioxide (ion 44) in helium and
helium:oxygen 4:1 for FPUF carried out at 30 ºC min-1.
The decomposition of FPUF under an inert atmosphere took place in two main steps
(Figure 6(A)) 280 and 380 ºC while the degradation in an oxidative atmosphere occurred
in three stages (Figure 6(B)) 280, 340 and 540 ºC. There is a clear evolution of hydrogen
cyanide (ion 27) at the second step of the thermal degradation under inert atmosphere
(coming from the decomposition of the diisocyanate) as reported in other studies [21]
ACCEPTED MANUSCRIP
T

which cannot be obtained in the oxidative decomposition. Water has been detected in
both, inert and oxidative atmosphere, the intensity of this peak is greater in He:O2 4:1
than in He. The residual water and dioxide carbon in the helium run is a consequence of
the interaction of the product evolved and retained inside the transfer line with small
quantities of oxygen in the helium stream.
Figure 6.
As reported in other studies, it is possible to assume that during the degradation of
FPUF in air (or synthetic air in this case), the third step corresponds to the combustion of
the small fraction of carbon formed in the previous step [22] with only CO2 (ion 44) as
the main evolving product.
Concerning the graphs obtained studying the evolution of all the ions indicated
previously (section 2.2.2.) during the pyrolysis of FPUF, in addition to Figure 6, it can be
profiled that there is an evolution of formaldehyde (ions 28, 29 and 30), acetaldehyde
(ions 29 and 43), ethane (ions 26, 27, 28 and 30), ethylene (ions 26 and 27), acetylene
(ions 25 and 26), other hydrocarbons (ions 25, 26, 27, 39, 40, 41 and 42) and other
oxygenated compounds (ions 43, 45 and 46). The emissions of aromatic compounds such
as benzene, toluene and xylene (ions 78, 91 and 106) have also been detected in the
thermal degradation of FPUF in an inert atmosphere. Similar results have been obtained
in the thermal degradation in He:O2 (4:1) atmosphere
The evolution of ions 35 and 36 characteristic of HCl has been studied, which can be
related with the formation of chlorinated compounds in pyrolysis and combustion
processes. In the case of the thermal degradation in helium atmosphere, the emission of
HCl is rather small. Nevertheless, in He:O2 atmosphere the evolution of HCl cannot be
observed, so this indicates that its formation is very small.
ACCEPTED MANUSCRIP
T

3.4. Analysis of data obtained from the TG
Figure 7 shows the experimental TG and Derivative TG (DTG) curves for FPUF at
heat rates of 5, 10 and 20 ºC min-1. with 7.5 mg initial mass in nitrogen atmosphere.
Figure 7.
In addition, TG-DTG runs were carried out in nitrogen atmosphere with
dynamic+isothermal conditions. Figure 8 shows the curves obtained indicating the
heating rate during the first period until reaching the temperature which is maintained
constant during the isothermal period. Note that for these types of experiments the value
of the weight fraction has been represented versus the time and not versus the
temperature, because these runs take place in isothermal conditions.
Figure 8.
In view of the previous Figures, it can be deduced that the thermal degradation of the
FPUF in an inert atmosphere could be analysed regarding two fractions, with the first
decomposition step at about 280 ºC and the second at about 370 ºC.
Figure 9 and Figure 10 show the experimental results obtained in the atmosphere
N2:O2 4:1 for dynamic and dynamic+isothermal conditions.
Figure 9.
Figure 10.
Figure 11 and Figure 12 show the experimental results obtained in the atmosphere
N2:O2 9:1 for dynamic and dynamic+isothermal conditions.
Figure 11.
Figure 12.
In this case, with an oxidative atmosphere, the FPUF presents three maximums of the
decomposition rates approximately 280, 340 and 500 ºC. These maximums can be seen
ACCEPTED MANUSCRIP
T

most clearly in the curves from the N2:O2 9:1 atmosphere (Figure 11) than those obtained
under a more oxidative atmosphere such as N2:O2 4:1 (Figure 9). Normally, each
maximum is associated with decomposition of a fraction or decomposition step. Three
steps were also obtained by other authors [23,24] who established that the first step
corresponds to the decomposition of the urethane bond to obtain isocyanate monomers
and polyols segments which are degraded during the second stage. The last step, about
500ºC, is the decomposition of the residue obtained in the previous stage to obtain the
same final residue as that obtained in the pyrolysis decomposition. It means that at 600ºC,
all the organic fraction in the FPUF has been degraded independently of the atmosphere
employed.
Comparing the curves from inert and oxidative experiments carried out at 10ºC/min
(Figure 13), it can be observed that there is a concordance between pyrolysis and
combustion at the first part, a difference in the second part and a new step appears at high
temperatures in the combustion experiments (around 550ºC) related with the char
combustion.
Furthermore, the second step, where the polyols segments are decomposed, is
accelerated by the presence of the oxygen in the atmosphere. Consequently, the
temperature of this stage is lower when the concentration of oxygen in the atmosphere
increases.
Figure 13.
ACCEPTED MANUSCRIP
T

3.5. Kinetic model
3.6.1. Pyrolysis
By analyzing the TG results in nitrogen atmosphere, Figure 7 and Figure 8, it can be
observed that, at least, two pyrolysis reactions are taking place. Two consecutive
pyrolytic reactions (Scheme 1.) are considered, in which the solid products obtained in
the first reaction are degraded in the second reaction:
( )1
1inf 1 1inf 11foam v products v volatiles→ − +
( ) ( )2
1inf 1 2inf 2inf 21 1v products v residue v volatiles− → − +
Scheme 1.
where 1infv is the mass fraction of volatiles that can be obtained at infinity time from the
reaction 1 and 2infv is the mass fraction of volatiles of reaction 2.
The conversion degree in each reaction is defined as the ratio between the mass
fraction of volatiles at any time (iV ) and the mass fraction of volatiles at infinity time
( infiv ), so:
inf
1,2ii
i
Vi
vα = = (1)
The kinetic expressions performed in this model, follow the kinetic law for solid
decomposition proposed by Font et al [25]. For the reaction 1 it can be written as:
( ) ( ) 11 1inf 11 1
/1
nd V v dk
dt dt
α α= = − (2)
and for reaction 2, as it is a consecutive reaction, the kinetic expression is:
ACCEPTED MANUSCRIP
T

( ) ( ) 22 2inf 22 1 2
/ nd V v dk
dt dt
α α α= = − (3)
It is assumed that the kinetic constant follows the usual Arrhenius dependence on
temperature:
0 exp 1,2ii i
Ek k i
RT
− = = (4)
The volatiles obtained in each time, V, can be related to the conversion degrees, 1α and
2α , by equation 5.
( ) ( )1 2 1inf 1 2inf 2V V V v vα α= + = + (5)
Conversely, from the TG analysis, the volatiles in each time can be calculated with the
equation (6):
exp exp1V w= − (6)
With the intention of obtaining a single set of parameters for the pyrolysis, the
dynamics runs and dynamic+isothermal runs were correlated together.
The calculated values were obtained by integration of the differential equations
presented previously by the Euler method. To minimize the differences between the
experimental and calculated volatiles, we used the optimisation method of Solver
function in Excel.
Two objective functions were considered, where all data obtained at different heating
rates are included.
First objective function: ACCEPTED M
ANUSCRIPT

, ,
2
11 1 exp
. .m j m j
M J
m j cal
dV dVO F
dt dt= =
= − ∑∑ (7)
Second objective function:
( ) ( ), ,
2
2 exp1 1
. .m j m j
M J
calm j
O F V V= =
= − ∑∑ (8)
where M is the number of heating rates runs studied and J is the number of points in each
run. This objective function was chosen to correct the effect of the different time
derivatives of V at different heating rates. With this function the contribution of all the
experiments in the objective function is similar.
In order to improve the convergence, and according to the previous study [26], the
optimisation was performed in terms of a “compatible kinetic constant” *iK instead of
optimise 0ik .
( ) ( )*00.64 exp 0.64i in ni
i i iref
EK k k
RT
−= =
(9)
where refT is a temperature around the maximum decomposition rate and 0ik is
calculated from the optimised parameters *iK , in and iE .
To validate this model the variation coefficient (VC) was calculated with the following
equation:
( )exp
/ TotalOF N PVC
V
−= (10)
ACCEPTED MANUSCRIP
T

where NTotal is the number of experimental data employed in the optimisation, P are the
parameters fitted, and expV is the average of the experimental volatiles.
The three dynamic and three dynamic+isothermal runs carried out in nitrogen
atmosphere have been correlated together. The correlation parameters are shown in Table
3:
The calculated results obtained using the kinetic parameters shown in the Table 3
(black line in Figure 7 and Figure 8) concur extremely closely with the experimental
ones.
In view of the Table 3, it can be observed that in the second reaction the mass of
volatiles is higher than in the first reaction. Note that dynamic+isothermal runs were
carried out to obtain a general model and decrease the great interrelation between the
kinetic parameters.
A number of articles have estimated the kinetic properties of flexible polyurethane
foam decomposition in nitrogen atmosphere using different kinetic models that in most
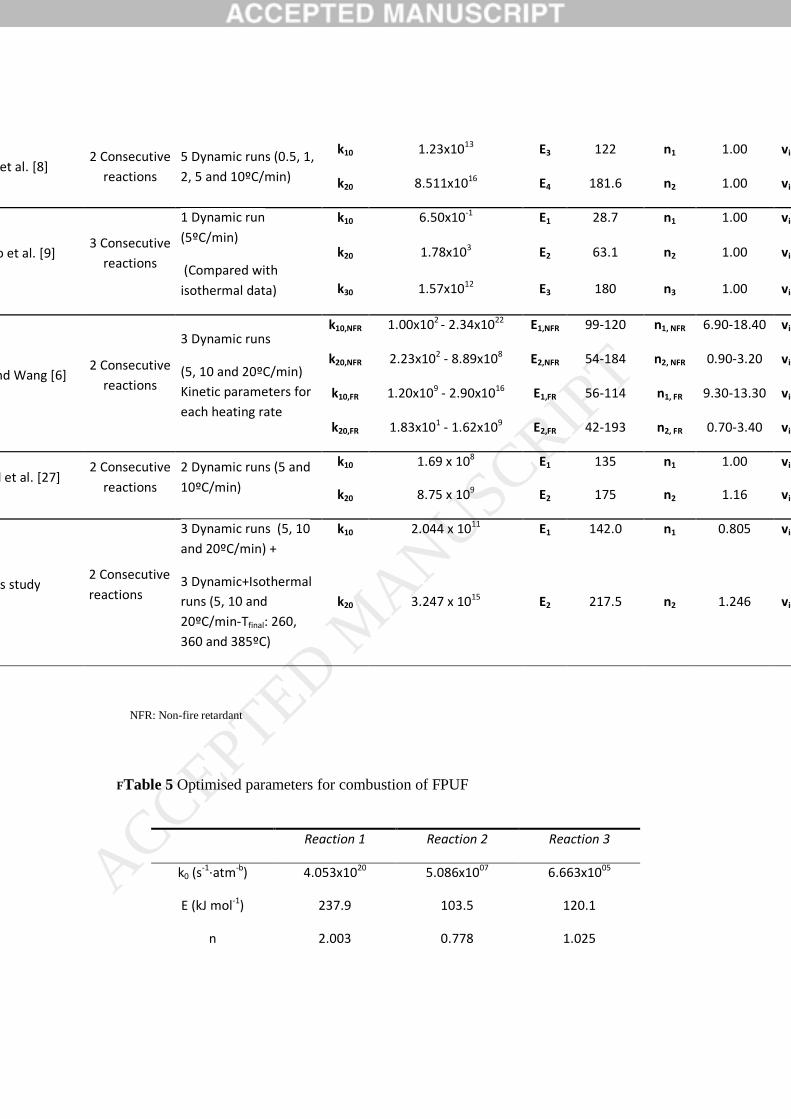
cases consist of two consecutive reactions, at least. In Table 4 the results obtained from
the literature are shown. It can be seen that the values of the kinetic parameters obtained
in this study do not concur with those published in previous papers, which can be a
consequence of the types of experiments employed for the kinetic study: dynamic and
dynamic+isothermal. The trend of activation energy and pre-exponential factor observed
in the kinetic parameters obtained in this study concurs with those proposed by Day et al.
[8] and Prasad et al. [27], where these parameters are greater in the second reaction than
in the first one. ACCEPTED M
ANUSCRIPT

In most of the previous papers, the reaction order considered was 1 for the both the
reactions, which is not really different from that the values optimised in this study.
However, Prasad et al. [27] considered the reaction orders as other kinetic parameters and
the results obtained were close to those which we propose.
3.6.2. Combustion
The model proposed for the thermo-oxidative degradation of FPUF is presented in
Scheme 2 where three consecutive reactions have been considered. The first reaction for
this model is a pyrolytic reaction, as in the pyrolysis model, but a new set of parameters
have been optimised for these conditions. Conversely, the second and third reactions
include the effect of oxygen, which is responsible for the fact that the second degradation
stage came on to lower temperatures than in the pyrolysis runs.
( )1
1inf 1 1inf 11foam v products v volatiles→ − +
( ) ( )2
1inf 1 2 2inf 2inf 21 1v products O v char v volatiles− + → − +
( ) ( )3
2inf 2 3inf 3inf 31 1 v char O v ash v volatiles− + → − +
Scheme 2
The kinetic equations for the two oxidative reactions were defined as:
( ) ( ) 22 2inf 22 1 2
/ nd V v dk
dt dt
α α α= = −′ (11)
( ) ( ) 33 3inf 33 2 3
/ nd V v dk
dt dt
α α α= = −′ (12)
ACCEPTED MANUSCRIP
T

Note that in the previous equations the kinetic constants are defined as 2k ′ and 3k ′ , in
order to include the effect of the oxygen in the model. For this reason, the pre-
exponential factor was defined as the combination of two terms; the first, the typical
Arrhenius pre-exponential factor and, the second, the partial pressure of oxygen in the
atmosphere raised to the power of the reaction order for the oxygen for these equations
(see equation 13):
( )2,0 ,0 2,3
ib
i i Ok k P i= =′ (13)
where 2OP is 0.20 and 0.10 atm for the atmospheres N2:O2 4:1 and N2:O2 9:1,
respectively.
The total volatiles calculated in this model were:
( ) ( )1 2 3 1inf 1 2inf 2 3inf 3V V V V v v vα α α= + + = + + (14)
With the same expression for the objective functions that were employed in the
pyrolysis, and using a compatible kinetic constant ( * iK ) to improve the convergence, the
three dynamic runs and the three dynamic+isothermal runs carried out in N2:O2 4:1 and
N2:O2 9:1 atmospheres, were correlated together, and after the optimisation process, the
correlation parameters are shown in Table 5:
The variation coefficient obtained is small, a value of 3.16%, taking into account that
twelve different runs were simultaneously correlated with the same set of parameters.
The calculated and experimental weight loss curves have been plotted together in
previous figures (Figure 9 to Figure 12), where it can be seen that the experimental
results were satisfactorily correlated.
In spite of the complex thermal degradation behavior of polyurethane foam, previous
reports stated that the mechanism consisted of only a few global reactions. Ohlemiller et
al. [29] proposed a two-step mechanism inside a physical-chemical model for the
ACCEPTED MANUSCRIP
T

smoldering combustion through the porous bulk of a flexible polyurethane, consisting of
the oxidative degradation of fuel to produce char and the subsequent oxidation of char
(activation energies 140 and 126 kJ mol-1, respectively). Dosanjh et al. [30] simplified the
description of the mechanism using a one-step reaction for the complete smoldering
combustion of uniform polyurethane cylinder with the activation energy of 155 kJ mol-1.
Table 6 shows some kinetic parameters proposed by authors with the characteristics of
each study and considering only the kinetic decomposition.
NFR: Non-fire retardant; FR: Fire retardant; υυυυββββ,1: mass yield of specie β-foam per mass the reactant in reaction 1; υυυυc,2: mass yield of specie char per mass the reactant in reaction 2; υυυυr,5: mass yield of specie residue per mass the reactant in reaction 5Bilbao et al. [9] employed the experimental data from one dynamic run of 5ºC/min in air to study the kinetic of thermal degradation and they considered that this degradation occurred between 230 and 300ºC. For this interval, they employed the Arrhenius equation to optimise the kinetic parameters. Chao and Wang [6] suggested a three step mechanism to describe the thermal degradation for FPUFs with three pyrolytic reactions in TG analysis. Branca et al. [24] studied the oxidative degradation of a rigid polyurethane foam under four different heating rates to obtain the kinetic parameters of three consecutive pyrolytic reactions where the reaction order for each reaction was one. After that, Rein et al. [31] proposed three reactions, two competitive reactions of oxidation and pyrolysis and the consecutive char oxidation, to simulate the experimental data from one dynamic run of 10ºC/min. The scheme considered by Rein et al. [31] is similar to the scheme selected in this study; nevertheless, the optimised parameters obtained in each case are different. The reaction order (ni) and the activation energy have the same trend in both studies and the optimised values are similar, but the pre-exponential factor, the reactor order for the oxygen and the mass fraction of volatiles present important differences which can be a consequence of the scheme selected and the experimental data employed to do the correlation; the rang of experimental conditions considered in this study is more extensive than in the previous study.
The most complex mechanism was developed by Rein et al. [23] which considered that
the thermal degradation of FPUF followed a five-step mechanism consisting of four
competitive reactions of oxidation and pyrolysis for the raw material (foam) and the
product from the pyrolysis of the foam (β−foam), and the final char oxidation.
- Pyrolysis of solid species foam to species β−foam
- Pyrolysis of solid species β−foam to char - Oxidation of the solid species foam to char
ACCEPTED MANUSCRIP
T

- Oxidation of the solid species β−foam to char - Oxidation of the char to ash
They employed the thermogravimetric data from a single dynamic experiment with a
heating rate of 20ºC/min and a genetic algorithm to obtain the kinetic parameters shown
in Table 6. As can be observed in Table 6, they assumed that reactions 3 and 4 (the
oxidation reactions of foam and β-foam) have the same kinetic parameters in order to
obtain a mechanism as simple as possible. In this case, the comparison between the
optimised parameters in each study is difficult due to the different schemes selected.
The kinetic model proposed in this study was obtained taking into account two
different atmospheres and inside each atmosphere, the experimental data from six
experiments both dynamic and dynamic+isothermal conditions. Therefore, this model can
be applied to a great variety of experimental data and a wide interval of operating
conditions.
4. Conclusions
Regarding the pyrolysis runs, a kinetic model with two consecutive reactions has been
deduced. The experimental data of the 3 dynamic runs and 3 dynamic+isothermal runs
can be simulated with the potential model for the two consecutive reactions, with
apparent activation energies of 142 and 217.5 kJ/mol and reaction order of 0.805 and
1.146, respectively. It has been tested that the first decomposition step corresponds to the
break of the urethane bond to obtain mainly isocyanates. In the second step however, the
decomposition of ether polyols takes place, forming a residue similar to the ash formed in
combustion
In the combustion runs, carried out with two atmospheres of N2:O2 4:1 and 9:1, the
kinetic model deduced is based on three consecutive reactions, satisfactorily simulating
ACCEPTED MANUSCRIP
T

the experimental results of 12 runs (3 dynamic runs and 3 dynamic+isothermal runs for
each atmosphere). The activation energies and reaction orders are 237.9, 103.5 and 120.1
kJ/mol and 2.003, 0.778 and 1.025, respectively. The orders with respect to the oxygen
are 1.114 and 0.571 for the second and third reaction, respectively. It has been tested, that
the first reaction corresponds to the degradation of urethane bonds and part of the polyol
segments, which means that the degradation is accelerated by the presence of oxygen in
the atmosphere. The second reaction is a decomposition of ether polyols that leads to the
char formation, and the third reaction corresponds to the combustion of the previous char
formed.
Acknowledgment
The authors thank the Spanish Ministry of Education Culture and Sport and the
research projects CTQ2013-41006 from the Spanish Ministry of Economy and
Competitiveness and PROMETEOII/2014/007 from the Valencian Community
Government for the support provided.
References
[1] D.K. Chattopadhyay and D.C. Webster, Progress in Polymer Science, 34, (2009) 1068. [2] J.E. Packer, J. Robertson and H. Wansbrough, Chemical Processes in New Zealand, New
Zealand Institute of Chemistry, 1998, p. [3] M. Herrera, M. Wilhelm, G. Matuschek and A. Kettrup, Journal of Analytical and Applied
Pyrolysis, 58–59, (2001) 173. [4] P.-S. Wang, W.-Y. Chiu, L.-W. Chen, B.-L. Denq, T.-M. Don and Y.-S. Chiu, Polymer
Degradation and Stability, 66, (1999) 307. [5] F. Gao, D. Price, G.J. Milnes, B. Eling, C.I. Lindsay and P.T. McGrail, Journal of
Analytical and Applied Pyrolysis, 40–41, (1997) 217. [6] C.Y.H. Chao and J.H. Wang, Journal of Fire Sciences, 19, (2001) 137. [7] F.E. Rogers and T.J. Ohlemiller, Journal of Macromolecular Science: Part A - Chemistry,
15, (1981) 169. [8] M. Day, J.D. Cooney and M. MacKinnon, Polymer Degradation and Stability, 48, (1995)
341. [9] R. Bilbao, J.F. Mastral, J. Ceamanos and M.E. Aldea, Journal of Analytical and Applied
Pyrolysis, 37, (1996) 69. [10] R. Font, A. Fullana, J.A. Caballero, J. Candela and A. Garcia, Journal of Analytical and
Applied Pyrolysis, 58, (2001) 63.
ACCEPTED MANUSCRIP
T

[11] PFA, in InTouch Technical Bulletins Loudon, New Hampshire, USA, 1991. [12] Chee Sien Wong and K.H. Badri, Materials Sciences and Applications, 3, (2012) 78. [13] Y.-C. Tu, Polyurethane foam from novel soy-based polyols, University of Missouri,
Faculty of the Graduate School, 2008, [14] Y.S. M. Mustakimah, M. Saikat, Journal of Engineering Science and Technology, 7,
(2012) 1. [15] H.H.G. Jellinek and K. Takada, Journal of Polymer Science: Polymer Chemistry Edition,
15, (1977) 2269. [16] D. Rosu, N. Tudorachi and L. Rosu, Journal of Analytical and Applied Pyrolysis, 89,
(2010) 152. [17] L.L. Jiao, H.H. Xiao, Q.S. Wang and J.H. Sun, Polymer Degradation and Stability, 98,
(2013) 2687. [18] X.L. Chen, L.L. Huo, C.M. Jiao and S.X. Li, Journal of Analytical and Applied Pyrolysis,
100, (2013) 186. [19] J.M. Cervantes-Uc, J.I.M. Espinosa, J.V. Cauich-Rodríguez, A. Ávila-Ortega, H. Vázquez-
Torres, A. Marcos-Fernández and J. San Román, Polymer Degradation and Stability, 94, (2009) 1666.
[20] X. Qian, L. Song, Y. Hu, R.K.K. Yuen, L. Chen, Y. Guo, N. Hong and S. Jiang, Industrial & Engineering Chemistry Research, 50, (2011) 1881.
[21] D.A.G. Purser, P. , Fire and Materials 8, (1984) 10. [22] M. Herrera, G. Matuschek and A. Kettrup, Polymer Degradation and Stability, 78, (2002)
323. [23] G. Rein, C. Lautenberger, A.C. Fernandez-Pello, J.L. Torero and D.L. Urban, Combustion
and Flame, 146, (2006) 95. [24] C. Branca, C. Di Blasi, A. Casu, V. Morone and C. Costa, Thermochimica Acta, 399,
(2003) 127. [25] R. Font, I. Martín-Gullón, M. Esperanza and A. Fullana, Journal of Analytical and Applied
Pyrolysis, 58-59, (2001) 703. [26] I. Martı́n-Gullón, M.F. Gómez-Rico, A. Fullana and R. Font, Journal of Analytical and
Applied Pyrolysis, 68–69, (2003) 645. [27] K. Prasad, R. Kramer, N. Marsh, M. Nyden, T. Ohlemiller and M. Zammarano, Numerical
simulation of fire spread on polyurethane foam slabs, at: Proceedings of the 11th international conference on fire and materials. Interscience Communications, London, 697.
[28] D.S.W. Pau, C.M. Fleischmann, M.J. Spearpoint and K.Y. Li, Journal of Fire Sciences, 31, (2013) 356.
[29] T.J. Ohlemiller, J. Bellan and F. Rogers, Combustion and Flame, 36, (1979). [30] S.S. Dosanjh, P.J. Pagni and A.C. Fernandez-Pello, Combustion and Flame, 68, (1987)
131. [31] G. Rein, A. Bar-Ilan, A.C. Fernandez-Pello, J.L. Ellzey, J.L. Torero and D.L. Urban,
Proceedings of the Combustion Institute, 30, (2005) 2327.
LIST OF CAPTIONS
FIGURES
ACCEPTED MANUSCRIP
T

Figure 1. The ATR-FTIR spectrum of Flexible Polyurethane Foam (FPUF).
Figure 2. Influence of the initial mass in the weight loss vs temperature for a run carried
out at 10 ºC min-1 in N2 atmosphere.
Figure 3. TG and DTG curves of FPUF in N2 (A) and Air (B) atmosphere at 30 ºC min-1.
Figure 4. IR spectra of FPUF obtained at maximum decomposition rates, 300ºC (A) and
397ºC (B), in N2 atmosphere at 30 ºC min-1.
Figure 5. IR spectra of FPUF obtained at maximum decomposition rates, 300ºC (A) and
339ºC (B), in air atmosphere at 30 ºC min-1.
Figure 6. Variation of intensity of some ions and weight fraction vs temperature for the
runs carried out at 30 ºC min-1 in He (A) and He:O2 (4:1) (B) (ion 18, ion 27 and ion 44).
Figure 7. TG and DTG curves for dynamic runs carried out at different heating rates in
N2 atmosphere.
Figure 8. TG and DTG curves for three dynamic+isothermal runs in N2 atmosphere.
Figure 9. TG and DTG curves for dynamic runs carried out at different heating rates in
N2:O2 (4:1) atmosphere.
Figure 10. TG and DTG curves for three dynamic+isothermal runs carried out in N2:O2
(4:1) atmosphere.
Figure 11. TG and DTG curves for dynamic runs carried out at different heating rates in
N2:O2 (9:1) atmosphere.
Figure 12. TG and DTG curves for three dynamic+isothermal runs carried out in N2:O2
(9:1) atmosphere.
Figure 13. Experimental data from the thermal degradation at 10ºC min-1 at three
different atmospheres (N2, N2:O2 (4:1) and N2:O2 (9:1)).
ACCEPTED MANUSCRIP
T

Table 1 Elemental analysis and net calorific value of FPUF.
Composition on dry weight basis
C (%) 57.79
H (%) 7.36
N (%) 5.95
S (%) <0.01
Ash (%) 5.47
O (%) per difference 23.43
Net calorific value 5786 kcal kg dry mass-1
Table 2. X-Ray analysis of the material employed.
Elements Dry weight percentage (%)
Ca 9.19
O 3.87
Si 0.105
Sn 0.105
Cl 0.0385
Na 0.0273
Fe 0.0247
S 0.0127
ACCEPTED MANUSCRIP
T

Mg 0.0097
Al 0.00797
P 0.00157
Table 3 Optimised parameters for pyrolysis of FPUF.
Reaction 1 Reaction 2
k0 (s-1
) 2.044 x 10¹¹
3.247 x 10¹⁵
E (kJ mol-1) 142.0 217.5
n 0.805 1.246
vinf 0.307 0.582
VC(%) 1.79
Table 4 Optimised parameters for pyrolysis of FPUF [28]
Reference Scheme Experiments Pre-exponential factor (s-1
) Activation Energy
(kJ mol-1
) Reaction order
Volat
infiniy time
k10 5.67x10¹⁷
E1 218 n1 1.00 vinf,1Rogers and Ohlemiller
[29]
2 Consecutive
reactions
4 Dynamic runs (2, 5,
10 and 20ºC/min) k20 1.13x10
11 E2 163 n2 1.00 vinf,2
ACCEPTED MANUSCRIP
T
k10 1.23x10¹³
E3 122 n1 1.00 vinf,1
Day et al. [8] 2 Consecutive
reactions
5 Dynamic runs (0.5, 1,
2, 5 and 10ºC/min) k20 8.511x10
16 E4 181.6 n2 1.00 vinf,2
k10 6.50x10⁻¹ E1 28.7 n1 1.00 vinf,1
k20 1.78x10³ E2 63.1 n2 1.00 vinf,2bao et al. [9] 3 Consecutive
reactions
1 Dynamic run
(5ºC/min)
(Compared with
isothermal data) k30 1.57x10¹²
E3 180 n3 1.00 vinf,3
k10,NFR 1.00x10²
- 2.34x10²²
E1,NFR 99-120 n1, NFR 6.90-18.40 vinf,1
k20,NFR 2.23x10² - 8.89x10
8 E2,NFR 54-184 n2, NFR 0.90-3.20 vinf,2
k10,FR 1.20x10⁹ - 2.90x10
16 E1,FR 56-114 n1, FR 9.30-13.30 vinf,1
Chao and Wang [6] 2 Consecutive
reactions
3 Dynamic runs
(5, 10 and 20ºC/min)
Kinetic parameters for
each heating rate k20,FR 1.83x101 - 1.62x10⁹ E2,FR 42-193 n2, FR 0.70-3.40 vinf,2
k10 1.69 x 10⁸ E1 135 n1 1.00 vinf,1
Prasad et al. [27] 2 Consecutive
reactions
2 Dynamic runs (5 and
10ºC/min) k20 8.75 x 10
9 E2 175 n2 1.16 vinf,2
k10 2.044 x 10¹¹
E1 142.0 n1 0.805 vinf,1
This study 2 Consecutive
reactions
3 Dynamic runs (5, 10
and 20ºC/min) +
3 Dynamic+Isothermal
runs (5, 10 and
20ºC/min-Tfinal: 260,
360 and 385ºC)
k20 3.247 x 10¹⁵ E2 217.5 n2 1.246 vinf,2
NFR: Non-fire retardant
FTable 5 Optimised parameters for combustion of FPUF
Reaction 1 Reaction 2 Reaction 3
k0 (s-1
·atm-b
) 4.053x10²⁰
5.086x1007
6.663x1005
E (kJ mol-1
) 237.9 103.5 120.1
n 2.003 0.778 1.025
ACCEPTED MANUSCRIP
T

vinf 0.284 0.505 0.112
b - 1.114 0.571
VC(%) 3.16
ACCEPTED MANUSCRIP
T

Scheme Experiments Pre-exponential factor (s-1
) Activation Energy
(kJ mol-1
) Reaction order
Reaction order
oxygen infinity time
1 Reaction
1 Dynamic run AIR
(5ºC/min) (Compared
with isothermal data)
k10 4.60x10⁶ E1 97.4 n1 1 b1 -
k10,NFR 5.97x10⁷ - 7.86x10¹⁷ E1,NFR 96 - 295 n1, NFR 10 - 25 b1, NFR -
k20,NFR 3.69 - 1.35x10² E2,NFR 27 - 62 n2, NFR 0.5 - 1.5 b2, NFR -
k30,NFR 4.96x10²- 6.02x10
4 E3,NFR 67 - 98 n3, NFR 1.2 - 1.6 b3, NFR -
k10,FR 2.02x101 - 1.42x10
21 E1,FR 162 - 205 n1, FR 11 - 19 b1, FR -
k20,FR 8.17x10² - 3.31x10
3 E2,FR 72 - 102 n2, FR 1.3 - 2.2 b2, FR -
3 Consecutive
reactions
3 Dynamic runs AIR
(5, 10 and 20ºC/min)
Kinetic parameters for
each heating rate
k30,FR 1.65x10² - 2.23x10
2 E3,FR 63 - 79 n3, FR 1.2 - 1.3 b3, FR -
k10 2.55 x 10¹²
E1 133.6 n1 1 b1 -
k20 3.26 x 10⁴ E2 81 n2 1 b2 - 3 Consecutive
reactions
4 Dynamic runs AIR (5,
10, 15 and 20ºC/min)
k30 8.70 x 10⁸ E3 180 n3 1 b3 -
k10 5.00 x 10⁵ E1 200 n1 3 b1 -
k20 2.00 x 10¹²
E2 155 n2 1 b2 1
3 Consecutive
reactions (1
Pyrolysis + 2
Combustions)
1 Dynamic run AIR
(10ºC/min)
k30 4.00 x 10
13 E3 185 n3 1 b3 1
k10 2.00 x 10¹¹
E1 148 n1 0.21 b1 -
k20 1.58 x 10⁸ E2 124 n2 1.14 b2 -
k30 2.51 x 10¹⁵
E3 194 n3 0.52 b3 1
k40 2.51 x 10¹⁵
E4 195 n4 0.52 b4 1
5 Reactions (2
Pyrolisis + 3
Combustions)
1 Dynamic run AIR
(20ºC/min)
k50 1.58 x 10¹⁵
E5 201 n5 1.23 b5 1
k10 4.053 x 10²⁰
E1 237.9 n1 2.003 b1 -
k20 5.086 x 1007
E2 103.5 n2 0.778 b2 1.11
4 3 Consecutive
reactions
6 Dynamic runs (5, 10 and
20ºC/min) + 6
Dynamic+Isothermal runs
(5, 10 and 20ºC/min-
Tfinal:260, 300 and 450ºC)
4:1 and 9:1 N2:O2 k30 6.663 x 1005 E3 120.1 n3 1.025 b3
0.57
1
ACCEPTED MANUSCRIP
T

Table 6: Optimised parameters for combustion of FPUF.
R: Fire retardant
ACCEPTED MANUSCRIP
T