qc story.ppt
TRANSCRIPT

8/10/2019 QC Story.ppt
http://slidepdf.com/reader/full/qc-storyppt 1/146
QC Story-Executives Page 1
QC Story
8/10/2019 QC Story.ppt
http://slidepdf.com/reader/full/qc-storyppt 2/146
QC Story-Executives Page 2
Effectiveness of QC Story and Problem solving
Where are we?
8/10/2019 QC Story.ppt
http://slidepdf.com/reader/full/qc-storyppt 3/146
QC Story-Executives Page 3
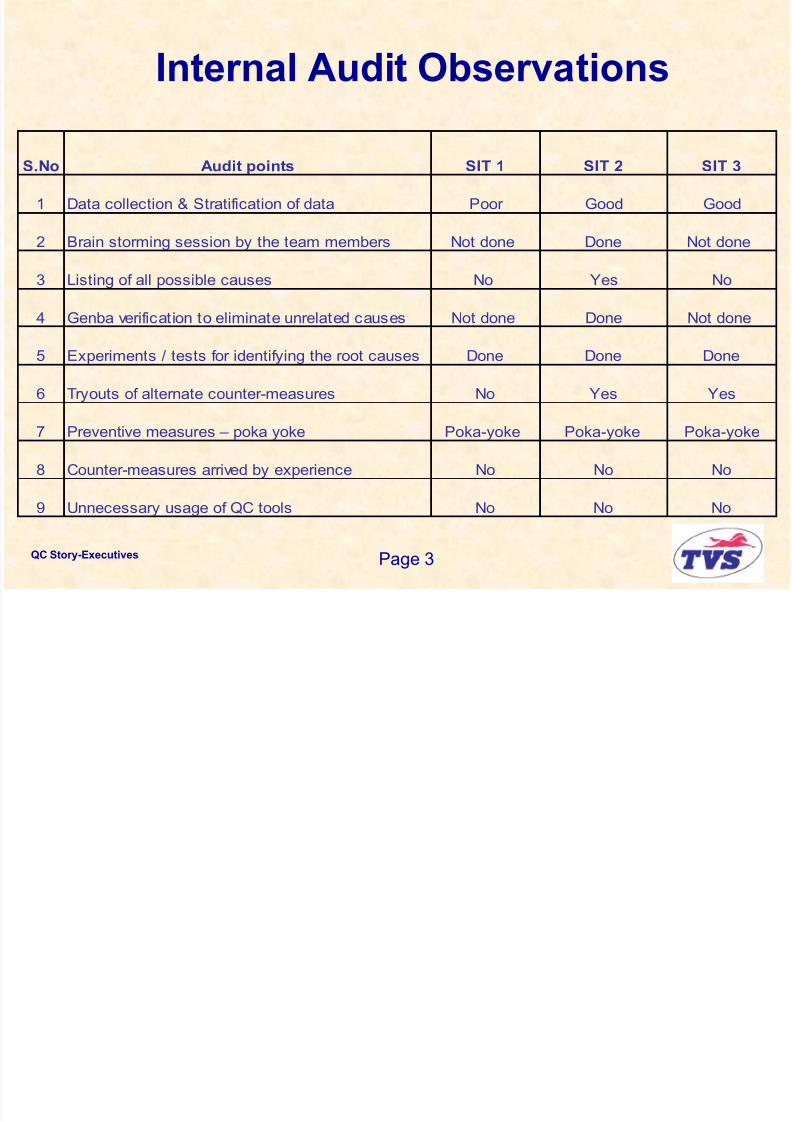
Internal Audit Observations
S.No Audit points SIT 1 SIT 2 SIT 3
1 Data collection & Stratification of data Poor Good Good
2 Brain storming session by the team members Not done Done Not done
3 Listing of all possible causes No Yes No
4 Genba verification to eliminate unrelated causes Not done Done Not done
5 Experiments / tests for identifying the root causes Done Done Done
6 Tryouts of alternate counter-measures No Yes Yes
7 Preventive measures – poka yoke Poka-yoke Poka-yoke Poka-yoke
8 Counter-measures arrived by experience No No No
9 Unnecessary usage of QC tools No No No

8/10/2019 QC Story.ppt
http://slidepdf.com/reader/full/qc-storyppt 4/146
QC Story-Executives Page 4
Audit Observations Summary
1. Improper stratification of data by the teams
2. Brain storming session not conducted by most of the teams
(5 out of 8)
3. In most of the teams, all possible causes are not listed
4. Only few members doing the analysis, not all the members
actively involved (4 out of 8)
5. Solutions were arrived on trial & error method ( 2 out of 5)
6. Genba people not involved in arriving at the solution

8/10/2019 QC Story.ppt
http://slidepdf.com/reader/full/qc-storyppt 5/146
QC Story-Executives Page 5
Feed Back From Consultants…
‘Our problem solving method lacks the right approach.’
(ie., same app roach is fo l lowed for solv ing
prob lems and fo r making improvements.)
- Deming examiners
„ Analysis is not complete.’
‘No proper validation for solution is carried out.’
‘Why - Why analysis is used for all QC stories.’
‘Side effects are not checked.’ - Prof. Washio

8/10/2019 QC Story.ppt
http://slidepdf.com/reader/full/qc-storyppt 6/146
QC Story-Executives Page 6
What is a QC Story?

8/10/2019 QC Story.ppt
http://slidepdf.com/reader/full/qc-storyppt 7/146
QC Story-Executives Page 7
A QC story
is a methodology of
systematically and permanently
solving a problem

8/10/2019 QC Story.ppt
http://slidepdf.com/reader/full/qc-storyppt 8/146
QC Story-Executives Page 8
What is the structure of a
story?

8/10/2019 QC Story.ppt
http://slidepdf.com/reader/full/qc-storyppt 9/146
QC Story-Executives Page 9
It has a starting point
It has a theme
It has a „knot‟ to be untied
It has suspenses,lots ofactivities,climax and finally the
learning

8/10/2019 QC Story.ppt
http://slidepdf.com/reader/full/qc-storyppt 10/146
QC Story-Executives Page 10
The structure of a QC
story

8/10/2019 QC Story.ppt
http://slidepdf.com/reader/full/qc-storyppt 11/146
QC Story-Executives Page 11
It also has a starting pointIt has a „problem‟ to be solved
It has a theme
It has suspenses,lots ofactivities,the solution and
finally the learning

8/10/2019 QC Story.ppt
http://slidepdf.com/reader/full/qc-storyppt 12/146
QC Story-Executives Page 12
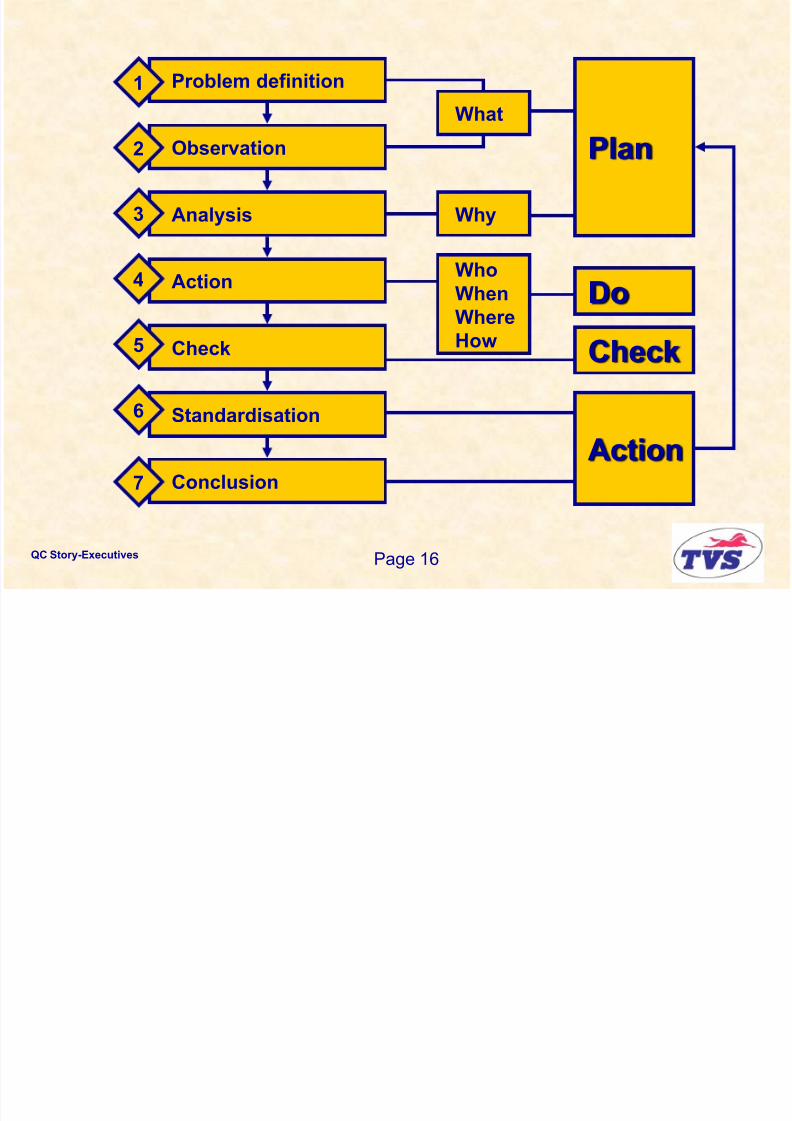
The structure of QC Story is,
•A problem•The observation
•The analysis
•The action
•The checking of results
•The standardisation and•The conclusion
8/10/2019 QC Story.ppt
http://slidepdf.com/reader/full/qc-storyppt 13/146
QC Story-Executives Page 13
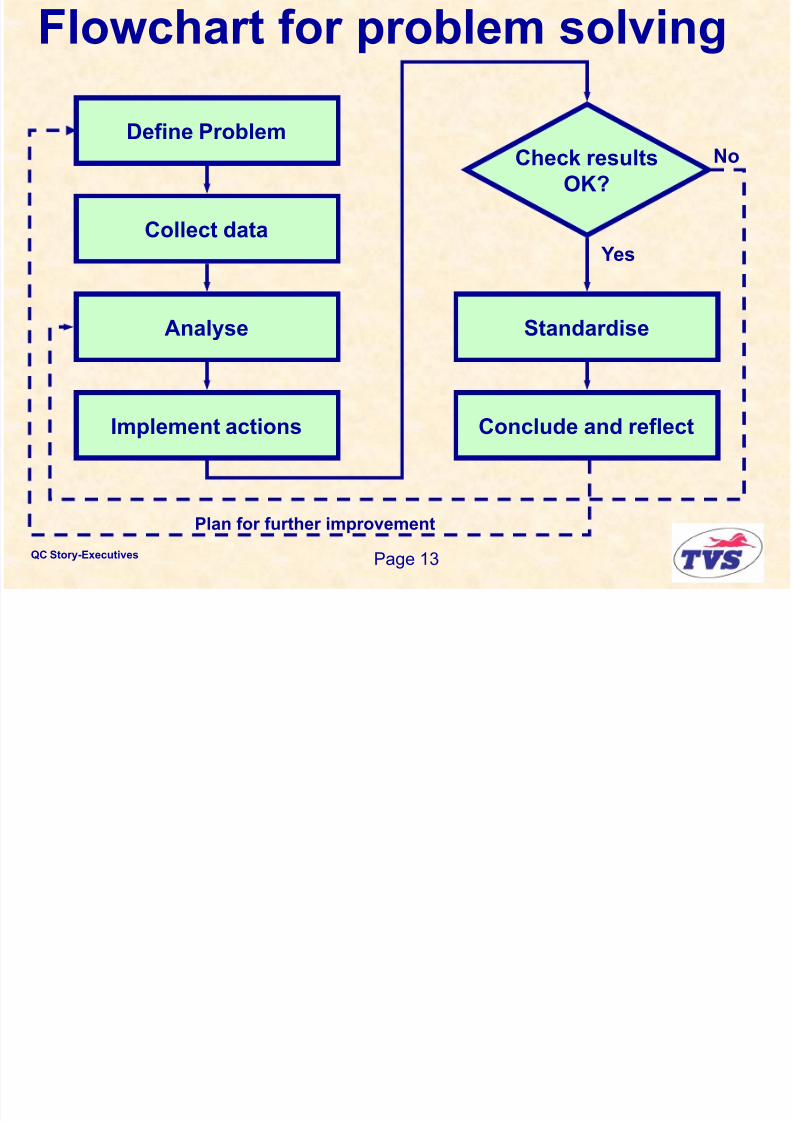
Check results
OK?
Define Problem
Collect data
Analyse
Implement actions
Standardise
Conclude and reflect
No
Yes
Plan for further improvement
Flowchart for problem solving
8/10/2019 QC Story.ppt
http://slidepdf.com/reader/full/qc-storyppt 14/146
QC Story-Executives Page 14
How are these stepsconnected to the
PDCA cycle?

8/10/2019 QC Story.ppt
http://slidepdf.com/reader/full/qc-storyppt 15/146
QC Story-Executives Page 15
Conclusion
Analysis
ActionCheck
Standardisation
A P D C
8/10/2019 QC Story.ppt
http://slidepdf.com/reader/full/qc-storyppt 16/146
QC Story-Executives Page 16
Observation
Analysis
Action
Check
Standardisation
Conclusion
Problem definition1
2
3
4
5
6
7
What
Why
WhoWhen
Where
How
Plan
Do
Check
Action

8/10/2019 QC Story.ppt
http://slidepdf.com/reader/full/qc-storyppt 17/146
QC Story-Executives Page 17
Why QC Story?

8/10/2019 QC Story.ppt
http://slidepdf.com/reader/full/qc-storyppt 18/146
QC Story-Executives Page 18
8/10/2019 QC Story.ppt
http://slidepdf.com/reader/full/qc-storyppt 19/146
QC Story-Executives Page 19
Check your understanding…
Shall we workout an exercise..
8/10/2019 QC Story.ppt
http://slidepdf.com/reader/full/qc-storyppt 20/146
QC Story-Executives Page 20
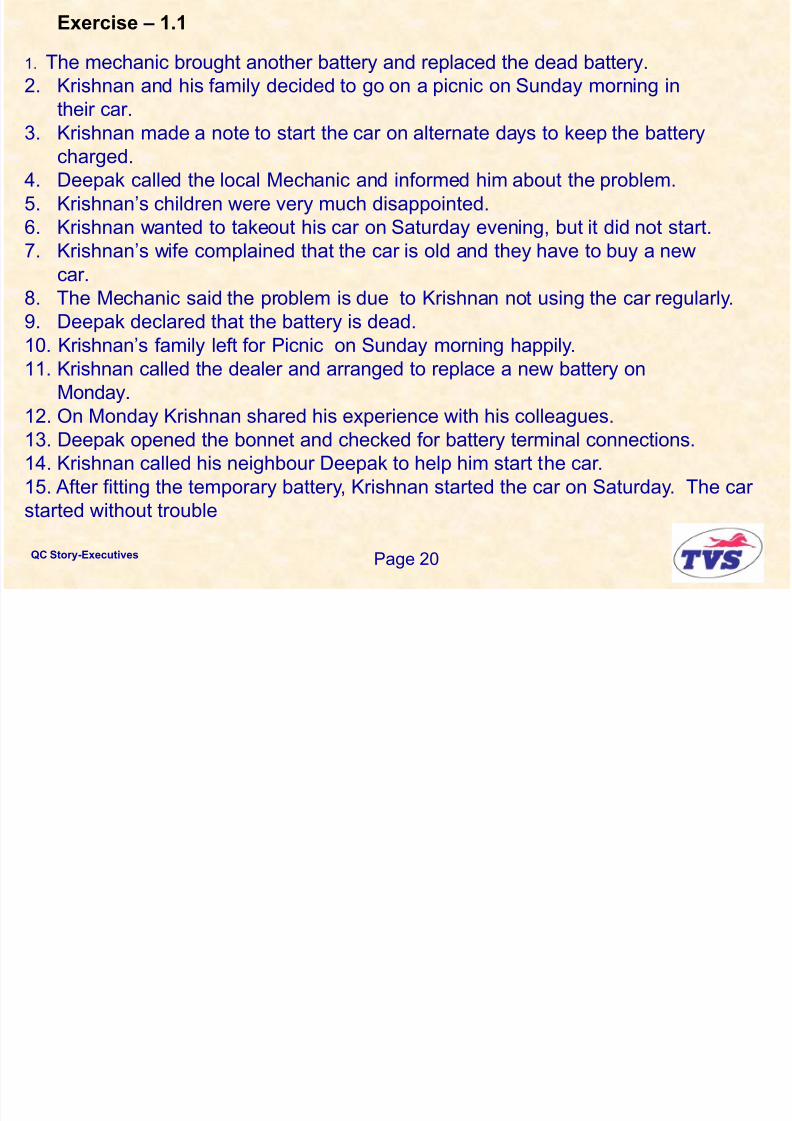
1. The mechanic brought another battery and replaced the dead battery.
2. Krishnan and his family decided to go on a picnic on Sunday morning in
their car.
3. Krishnan made a note to start the car on alternate days to keep the batterycharged.
4. Deepak called the local Mechanic and informed him about the problem.
5. Krishnan‟s children were very much disappointed.
6. Krishnan wanted to takeout his car on Saturday evening, but it did not start.
7. Krishnan‟s wife complained that the car is old and they have to buy a new
car.8. The Mechanic said the problem is due to Krishnan not using the car regularly.
9. Deepak declared that the battery is dead.
10. Krishnan‟s family left for Picnic on Sunday morning happily.
11. Krishnan called the dealer and arranged to replace a new battery on
Monday.
12. On Monday Krishnan shared his experience with his colleagues.13. Deepak opened the bonnet and checked for battery terminal connections.
14. Krishnan called his neighbour Deepak to help him start the car.
15. After fitting the temporary battery, Krishnan started the car on Saturday. The car
started without trouble
Exercise – 1.1
8/10/2019 QC Story.ppt
http://slidepdf.com/reader/full/qc-storyppt 21/146
QC Story-Executives Page 21Page 21
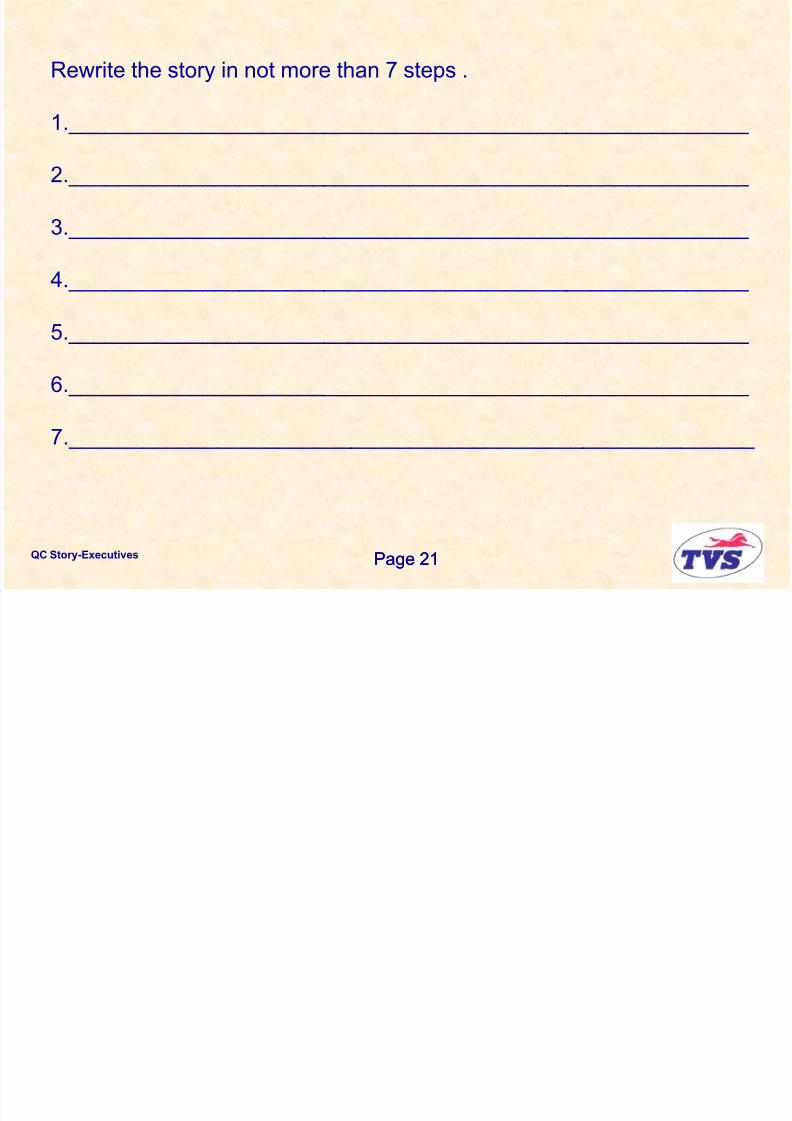
Rewrite the story in not more than 7 steps .
1.________________________________________________________
2.________________________________________________________
3.________________________________________________________
4.________________________________________________________
5.________________________________________________________
6.________________________________________________________
7.________________________________________________________

8/10/2019 QC Story.ppt
http://slidepdf.com/reader/full/qc-storyppt 22/146
QC Story-Executives Page 22
QC Story
- Problem .
- Observation
- Analysis
-Action
- Check
-Standardisation
- Horizontaldeployment
1. Krishnan‟s car did not start on Saturday
2 . Deepak found that battery is dead
3. Krishnan was not using his car regularly
4a. Mechanic replaced a battery temporarily.
4b. Krishnan arranged for a new battery to be fitted on
Monday,.
5. After fitting the temporary battery, Krishnan startedthe car on Saturday. The car started without
trouble. Krishnan‟s family went to the picnic happily
on Sunday morning.
6. Krishnan decided to start the car every alternate
day7. Krishnan shared his experience with
his colleagues

8/10/2019 QC Story.ppt
http://slidepdf.com/reader/full/qc-storyppt 23/146
QC Story-Executives Page 24
Objectives of This Training
Programme
At the end of this training programme youwill be able to:
• Solve problems permanently,
• Systematically make improvements,
• Horizontally deploy solutions wherever
applicable
in the shortest possible time by effectively using
QC Story methodology.
8/10/2019 QC Story.ppt
http://slidepdf.com/reader/full/qc-storyppt 24/146
QC Story-Executives Page 25
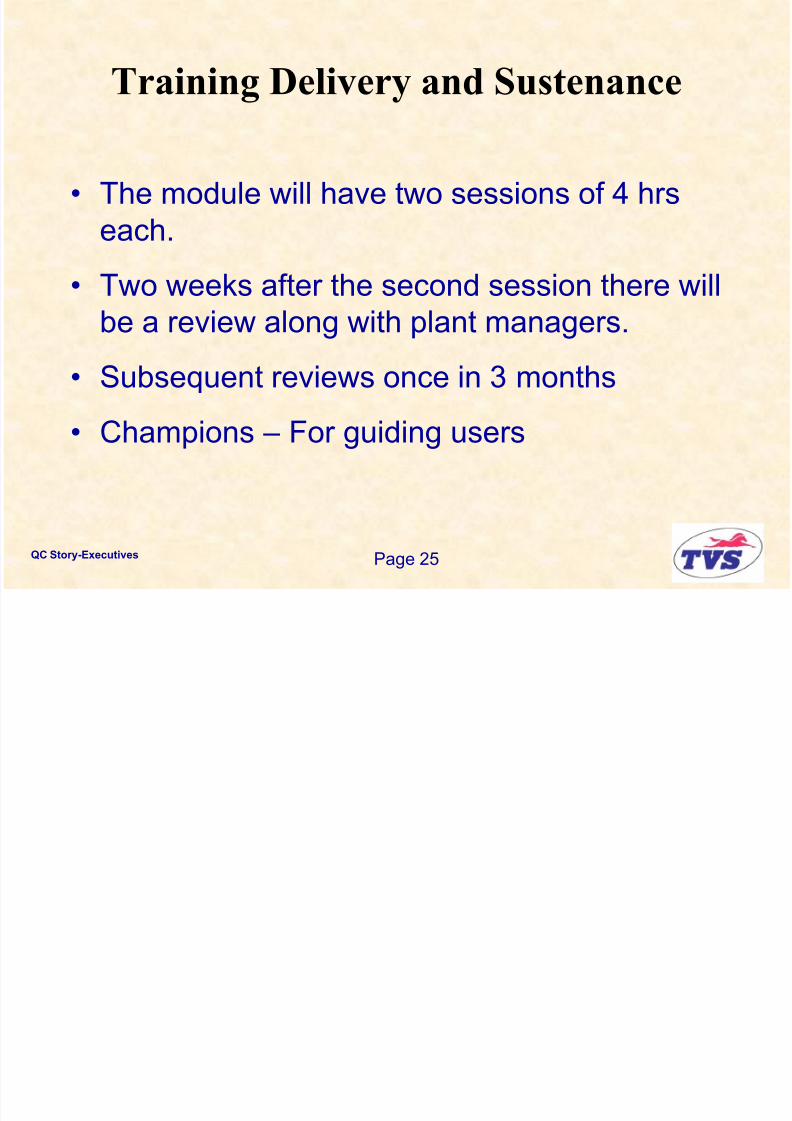
Training Delivery and Sustenance
• The module will have two sessions of 4 hrs
each.
• Two weeks after the second session there willbe a review along with plant managers.
• Subsequent reviews once in 3 months
• Champions – For guiding users
8/10/2019 QC Story.ppt
http://slidepdf.com/reader/full/qc-storyppt 25/146
QC Story-Executives Page 26
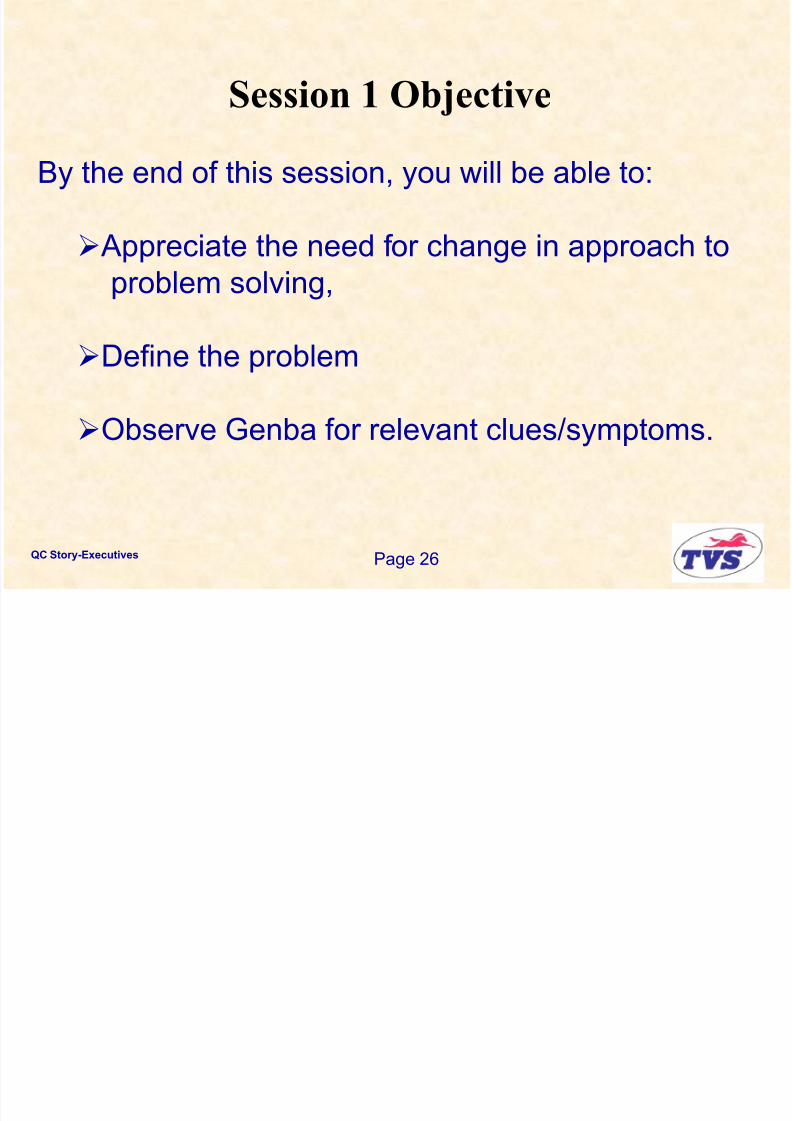
Session 1 Objective
By the end of this session, you will be able to:
Appreciate the need for change in approach to
problem solving,
Define the problem
Observe Genba for relevant clues/symptoms.

8/10/2019 QC Story.ppt
http://slidepdf.com/reader/full/qc-storyppt 26/146
QC Story-Executives Page 27
PROBLEM
DEFINITION
Step 1

8/10/2019 QC Story.ppt
http://slidepdf.com/reader/full/qc-storyppt 27/146
QC Story-Executives Page 28Page 28
What is a Problem ?
8/10/2019 QC Story.ppt
http://slidepdf.com/reader/full/qc-storyppt 28/146
QC Story-Executives Page 29
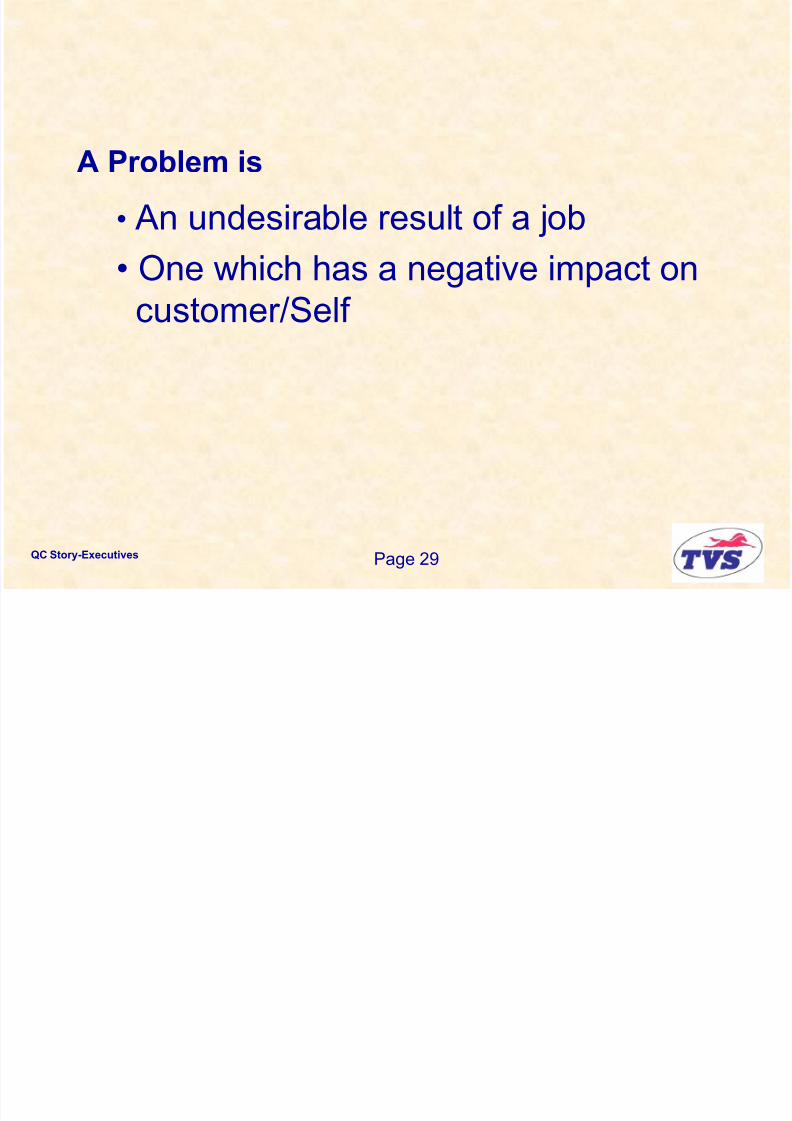
A Problem is
• An undesirable result of a job
• One which has a negative impact oncustomer/Self
8/10/2019 QC Story.ppt
http://slidepdf.com/reader/full/qc-storyppt 29/146
QC Story-Executives Page 30
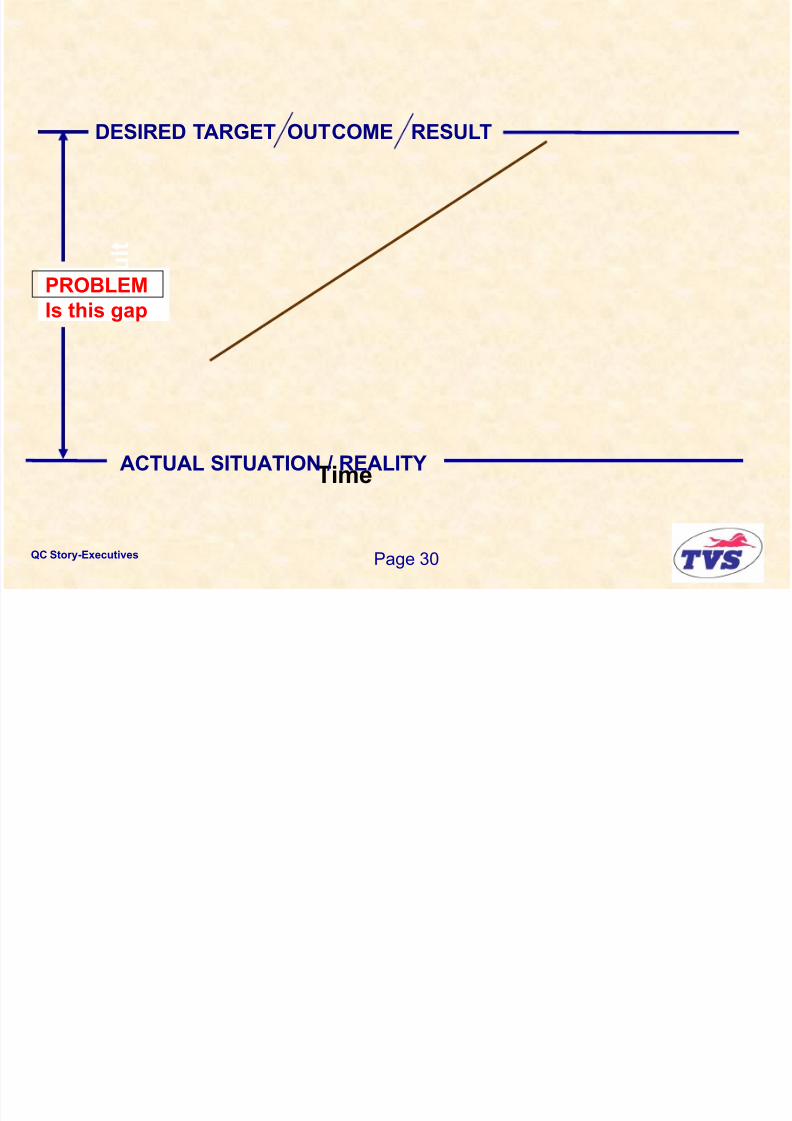
Time
PROBLEMIs this gap
ACTUAL SITUATION / REALITY
DESIRED TARGET OUTCOME RESULT

8/10/2019 QC Story.ppt
http://slidepdf.com/reader/full/qc-storyppt 30/146
QC Story-Executives Page 31
GAP DUE TO
PROBLEMS
PLAN
ACTUAL
Time
VCS

8/10/2019 QC Story.ppt
http://slidepdf.com/reader/full/qc-storyppt 31/146
QC Story-Executives Page 32
The definition of a problem involves three
Stages
Selection of Problem
Problem statement
Theme and target
8/10/2019 QC Story.ppt
http://slidepdf.com/reader/full/qc-storyppt 32/146
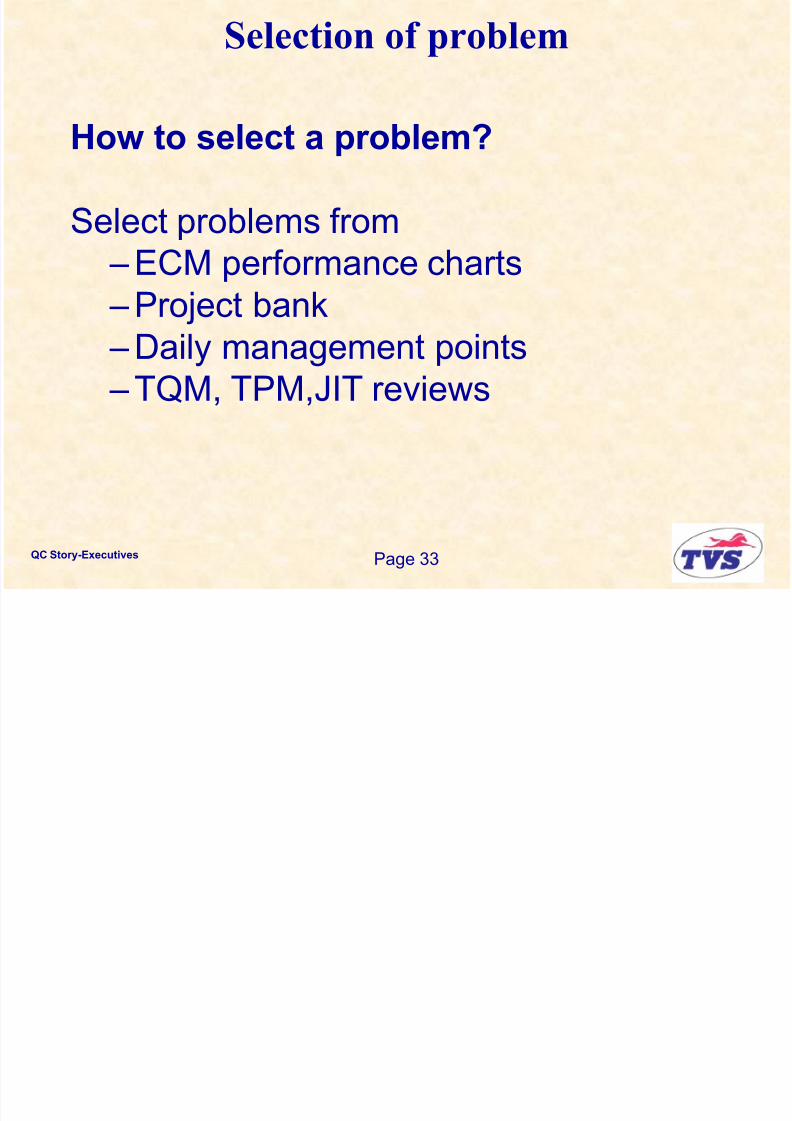
QC Story-Executives Page 33
Selection of problem
How to select a problem?
Select problems from
– ECM performance charts – Project bank
– Daily management points
– TQM, TPM,JIT reviews
S l i f bl

8/10/2019 QC Story.ppt
http://slidepdf.com/reader/full/qc-storyppt 33/146
QC Story-Executives Page 34
Selection of problem
MP / CP or Policy
(Unit Manager / Section head)
TO DO LIST(Module controller / Executives)
1. xxxxxxxxxxxx
2. xxxxxxxxxx
3. xxxx
VCS CHARTS
PLA
N
ACTUAL
8/10/2019 QC Story.ppt
http://slidepdf.com/reader/full/qc-storyppt 34/146
QC Story-Executives Page 35
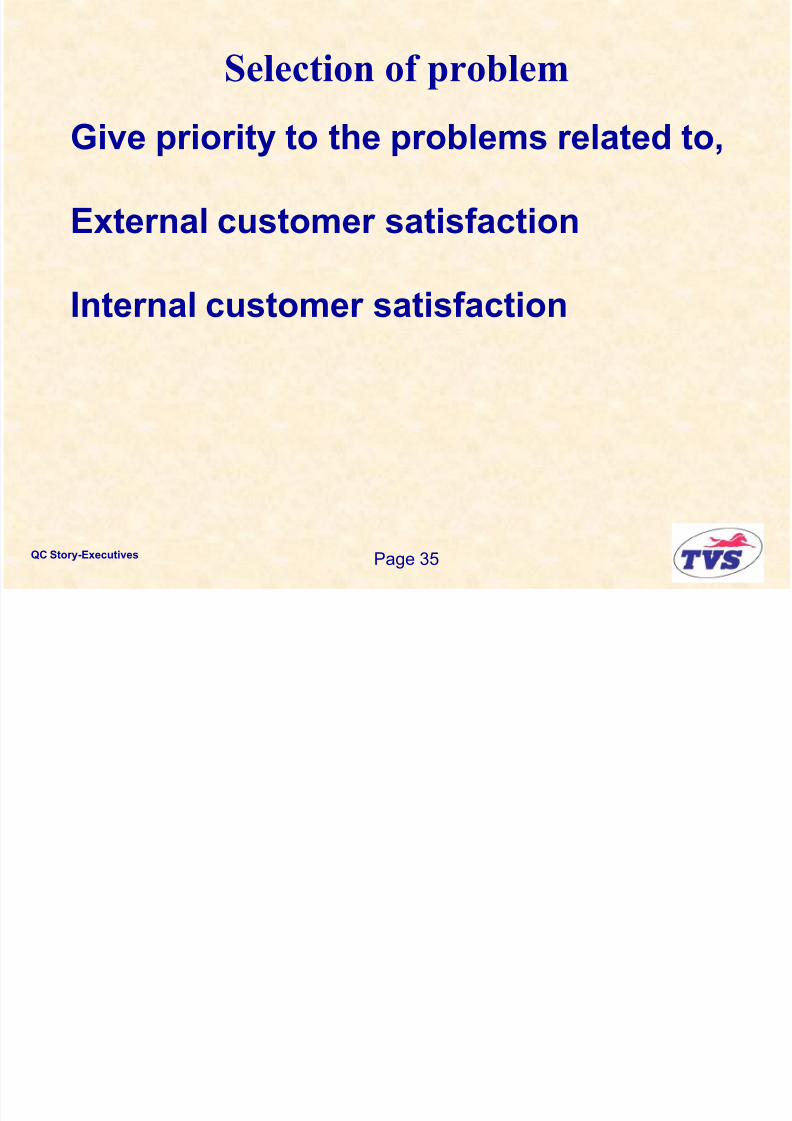
Selection of problem
Give priority to the problems related to,
External customer satisfaction
Internal customer satisfaction

8/10/2019 QC Story.ppt
http://slidepdf.com/reader/full/qc-storyppt 35/146
QC Story-Executives Page 36
Selection of problem
Prioritise the problems to be attended andsolved first.
Explain the importance of solving theproblem on priority.
S l ti f bl

8/10/2019 QC Story.ppt
http://slidepdf.com/reader/full/qc-storyppt 36/146
QC Story-Executives Page 37
Selection of problem
Prioritization of Problems
0
1020
30
40
5060
70
80
90
F r e q u e n c y
Problem 1 Problem 2 Problem 3 Others
Accord First
priority for this problem

8/10/2019 QC Story.ppt
http://slidepdf.com/reader/full/qc-storyppt 37/146
QC Story-Executives Page 38
Selection of problem
Bad tools
Poor
adjustment
Defective
product
Excessive
cost
Customer
dissatisfaction
Select a problem close
to the customer

8/10/2019 QC Story.ppt
http://slidepdf.com/reader/full/qc-storyppt 38/146
QC Story-Executives Page 42
Problem StatementThe problem statement should be ;
clearspecific andmeasurable ( use performance charts)
It should state
What - is the problem- should be stated in terms of results, not causes.
Where - the problem occurred
When - the problem occurred
Who - is involved
In short, a good problem statement should explain the
4Ws – what, where, when and who.
S

8/10/2019 QC Story.ppt
http://slidepdf.com/reader/full/qc-storyppt 39/146
QC Story-Executives Page 43
Problem Statement
The problem statement should be,
clear
specific and
measurable ( use performance charts)
The problem statement should demonstrate,
Weakness orientation

8/10/2019 QC Story.ppt
http://slidepdf.com/reader/full/qc-storyppt 40/146
QC Story-Executives Page 44
Problem statement
8/10/2019 QC Story.ppt
http://slidepdf.com/reader/full/qc-storyppt 41/146
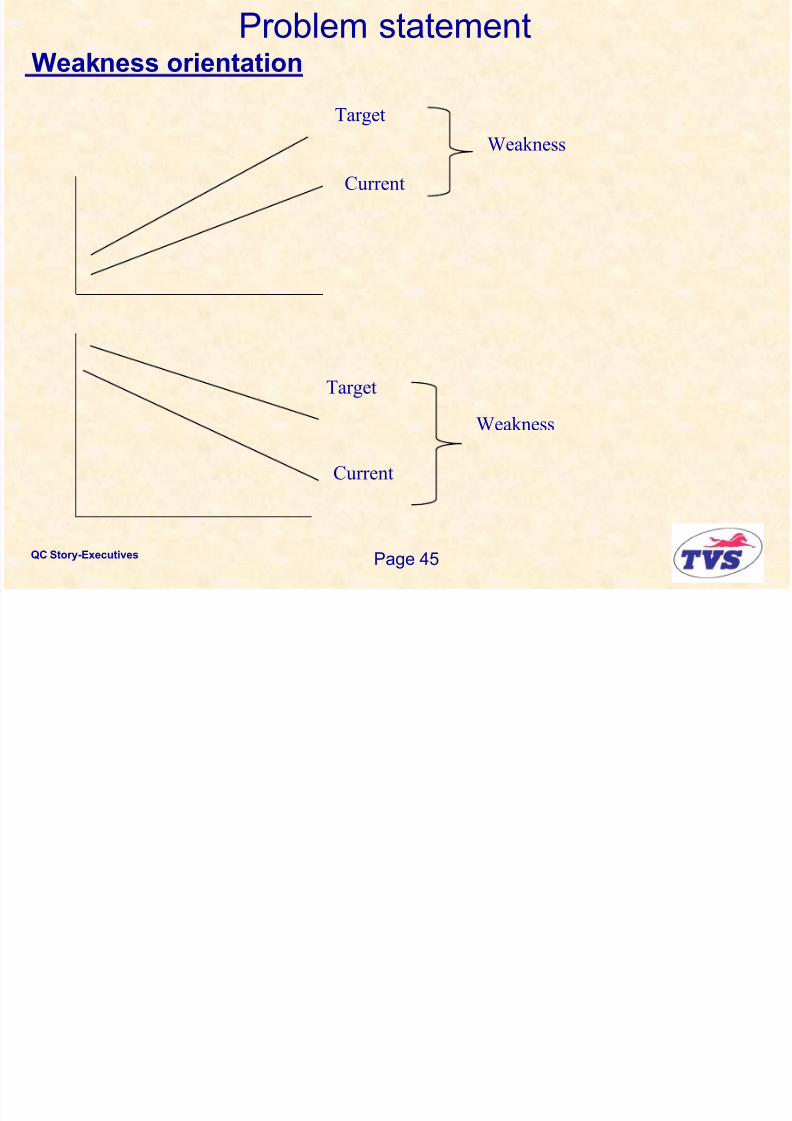
QC Story-Executives Page 45
Problem statementWeakness orientation
Target
Current
Weakness
Target
Current
Weakness
Problem statement
8/10/2019 QC Story.ppt
http://slidepdf.com/reader/full/qc-storyppt 42/146
QC Story-Executives Page 46
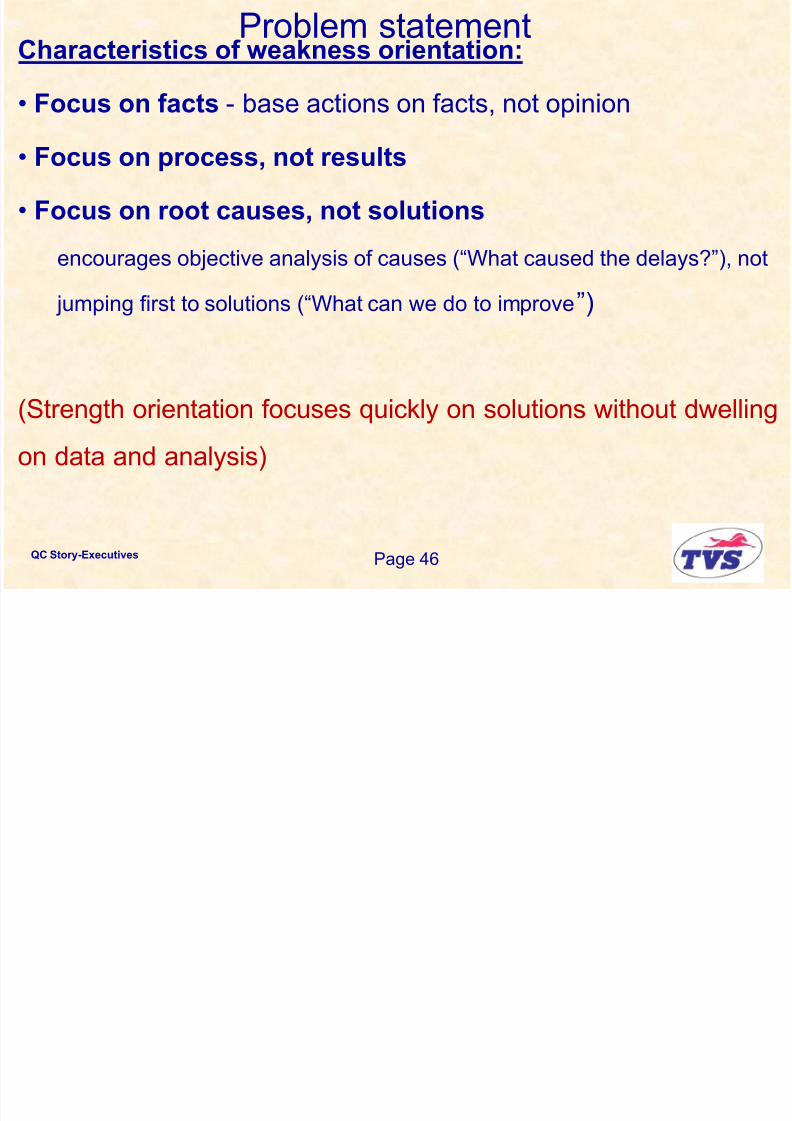
Characteristics of weakness orientation:
• Focus on facts - base actions on facts, not opinion
• Focus on process, not results
• Focus on root causes, not solutions
encourages objective analysis of causes (“What caused the delays?”), not
jumping first to solutions (“What can we do to improve”)
(Strength orientation focuses quickly on solutions without dwellingon data and analysis)
Problem statement
8/10/2019 QC Story.ppt
http://slidepdf.com/reader/full/qc-storyppt 43/146
QC Story-Executives Page 47
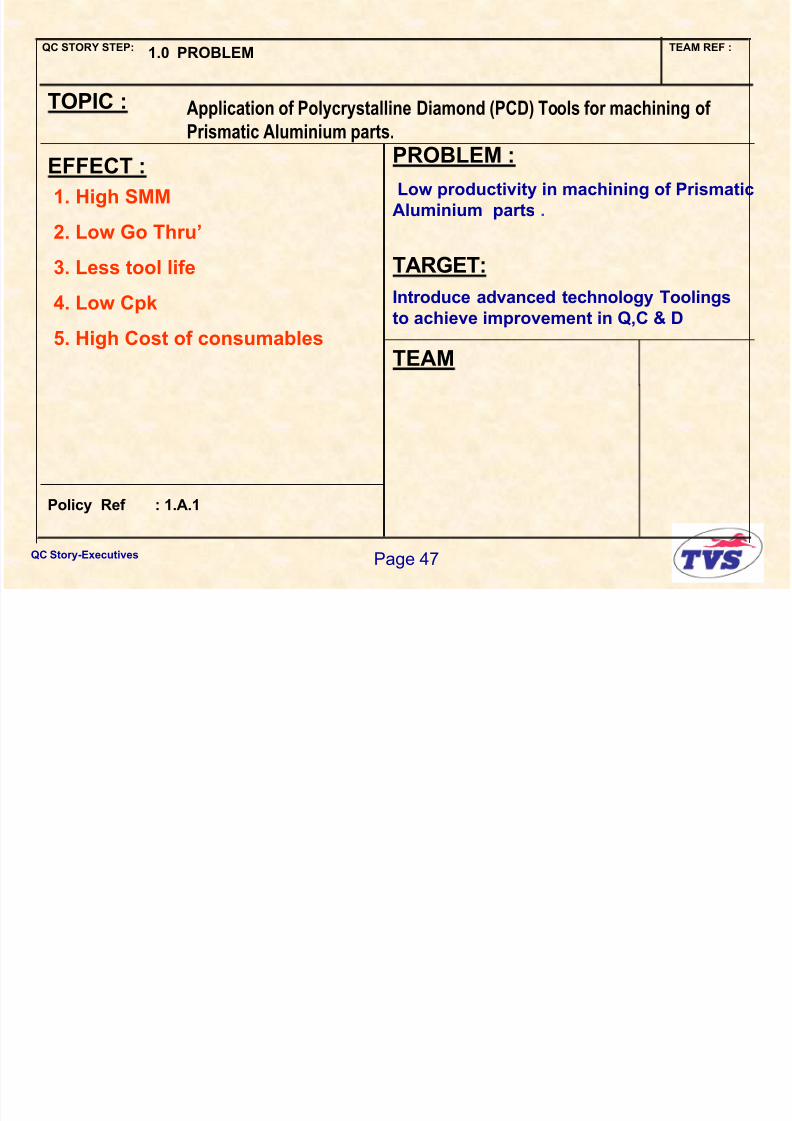
1.0 PROBLEM TEAM REF : QC STORY STEP:
TOPIC :
EFFECT : PROBLEM :
Low productivity in machining of Prismatic
Aluminium parts .
TEAM
Policy Ref : 1.A.1
Application of Polycrystalline Diamond (PCD) Tools for machining of
Prismatic Aluminium parts.
TARGET:
Introduce advanced technology Toolings
to achieve improvement in Q,C & D
1. High SMM
2. Low Go Thru‟
3. Less tool life
4. Low Cpk
5. High Cost of consumables
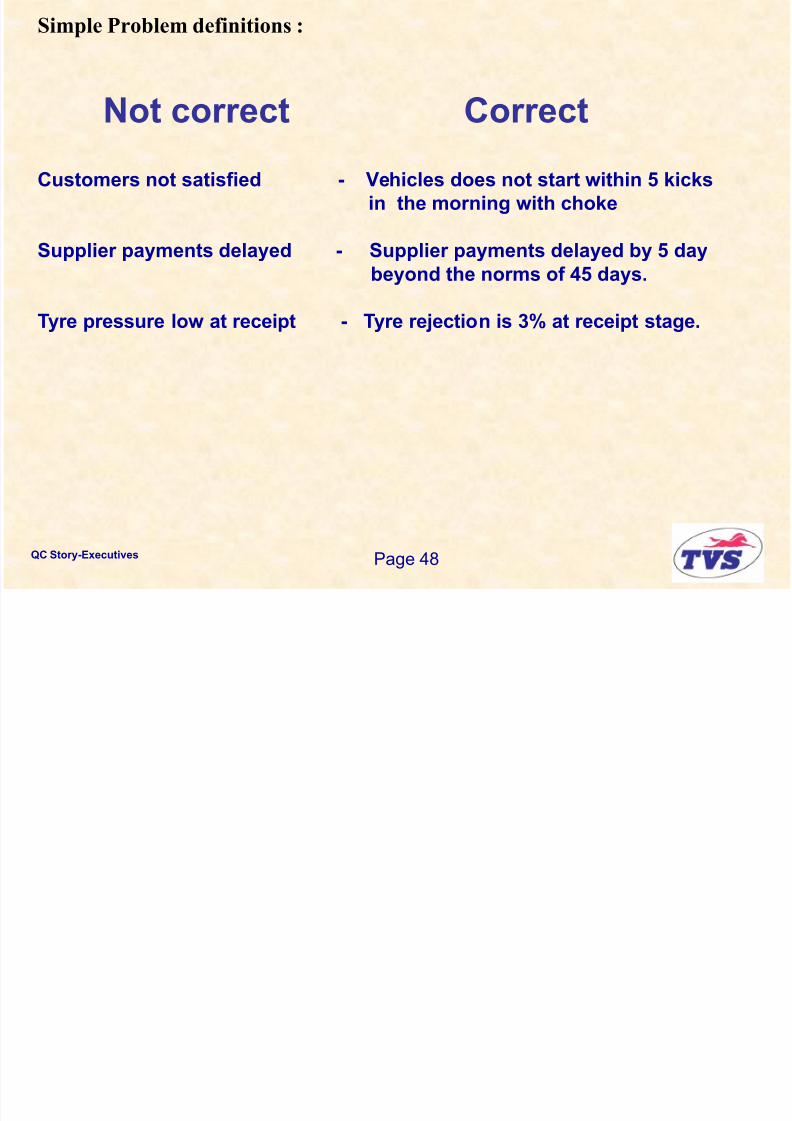
Simple Problem definitions :
8/10/2019 QC Story.ppt
http://slidepdf.com/reader/full/qc-storyppt 44/146
QC Story-Executives Page 48
Simple Problem definitions :
Customers not satisfied - Vehicles does not start within 5 kicks
in the morning with choke
Supplier payments delayed - Supplier payments delayed by 5 day
beyond the norms of 45 days.
Tyre pressure low at receipt - Tyre rejection is 3% at receipt stage.
Not correct Correct

8/10/2019 QC Story.ppt
http://slidepdf.com/reader/full/qc-storyppt 45/146
QC Story-Executives Page 49
Problem Definition - Summary
• A Problem is an undesirable result of a job andhas a negative impact on self / customer.
• Problem definition involves selecting the problemand writing the problem statement.
• The problem statement should answer what,where, when and who.
• The problem statement demonstrate weaknessorientation
“A well defined problem is half solved”
Theme and target

8/10/2019 QC Story.ppt
http://slidepdf.com/reader/full/qc-storyppt 46/146
QC Story-Executives Page 50
Theme and targetTheme and target
Good statement of theme will be
• A problem, not a solution
• Results,not a solution
• Market in orientation
• Neither broad nor narrowly defined

8/10/2019 QC Story.ppt
http://slidepdf.com/reader/full/qc-storyppt 47/146
QC Story-Executives Page 51
Wrong statement :
Improve on time delivery rate from 75 % to 85 %
Right statement :
Decrease delayed delivery rate from 25 % to 15 %
Weakness orientation

8/10/2019 QC Story.ppt
http://slidepdf.com/reader/full/qc-storyppt 48/146
QC Story-Executives Page 52
Wrong statement
Understand customer delivery, quality and pricing
requirements
Right statement
We do not meet requirements of the customer in delivery,
quality and pricing
Weakness orientation
8/10/2019 QC Story.ppt
http://slidepdf.com/reader/full/qc-storyppt 49/146
QC Story-Executives Page 53
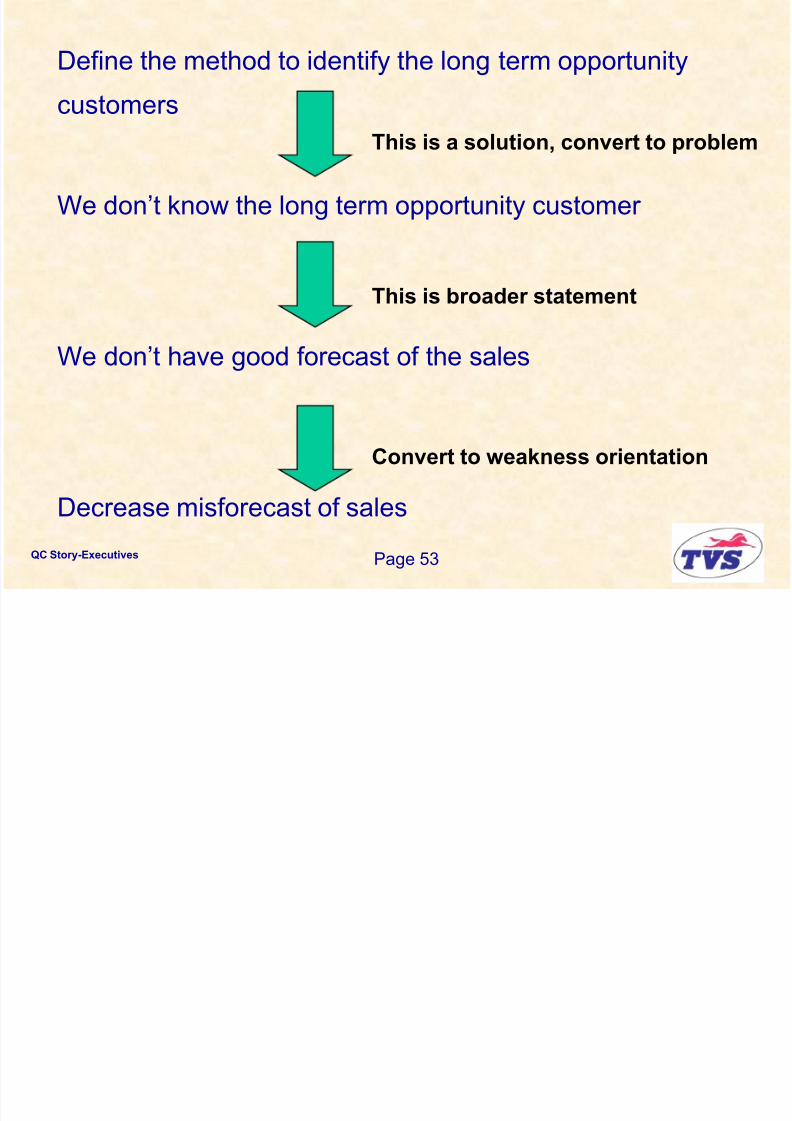
Define the method to identify the long term opportunity
customers
We don‟t know the long term opportunity customer
We don‟t have good forecast of the sales
Decrease misforecast of sales
This is a solution, convert to problem
This is broader statement
Convert to weakness orientation
8/10/2019 QC Story.ppt
http://slidepdf.com/reader/full/qc-storyppt 50/146
QC Story-Executives Page 54
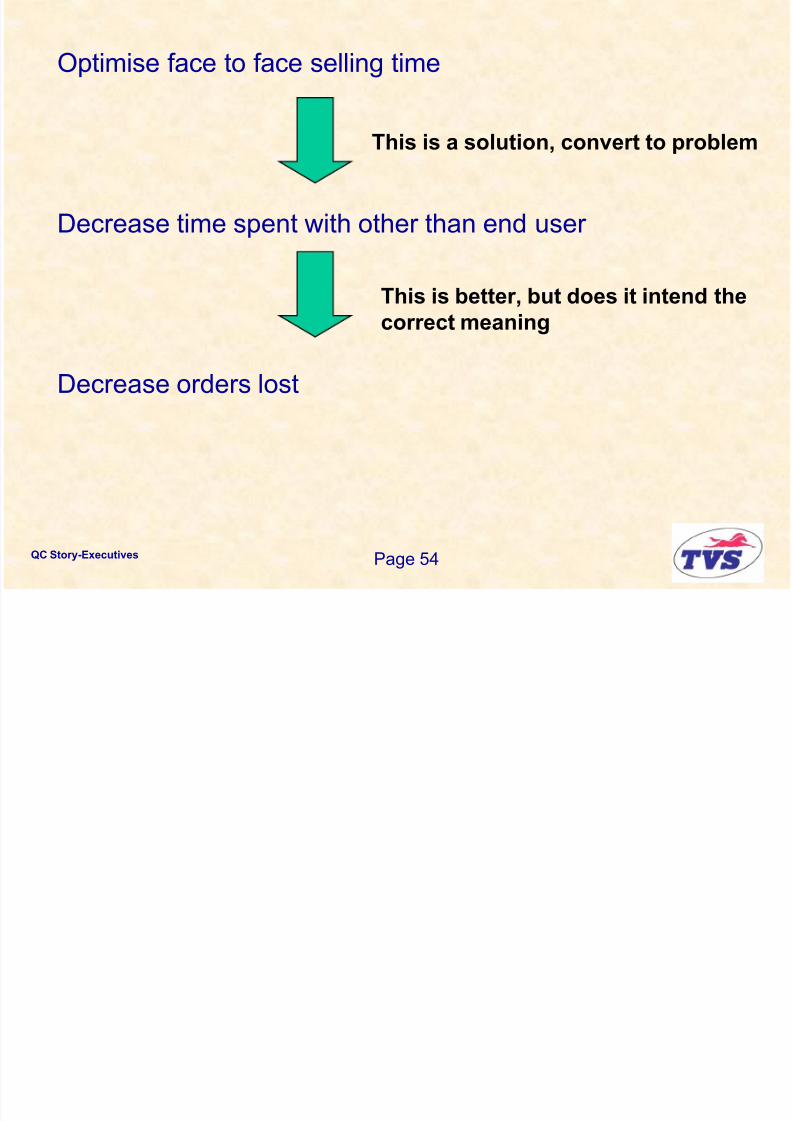
Optimise face to face selling time
Decrease time spent with other than end user
Decrease orders lost
This is a solution, convert to problem
This is better, but does it intend the
correct meaning
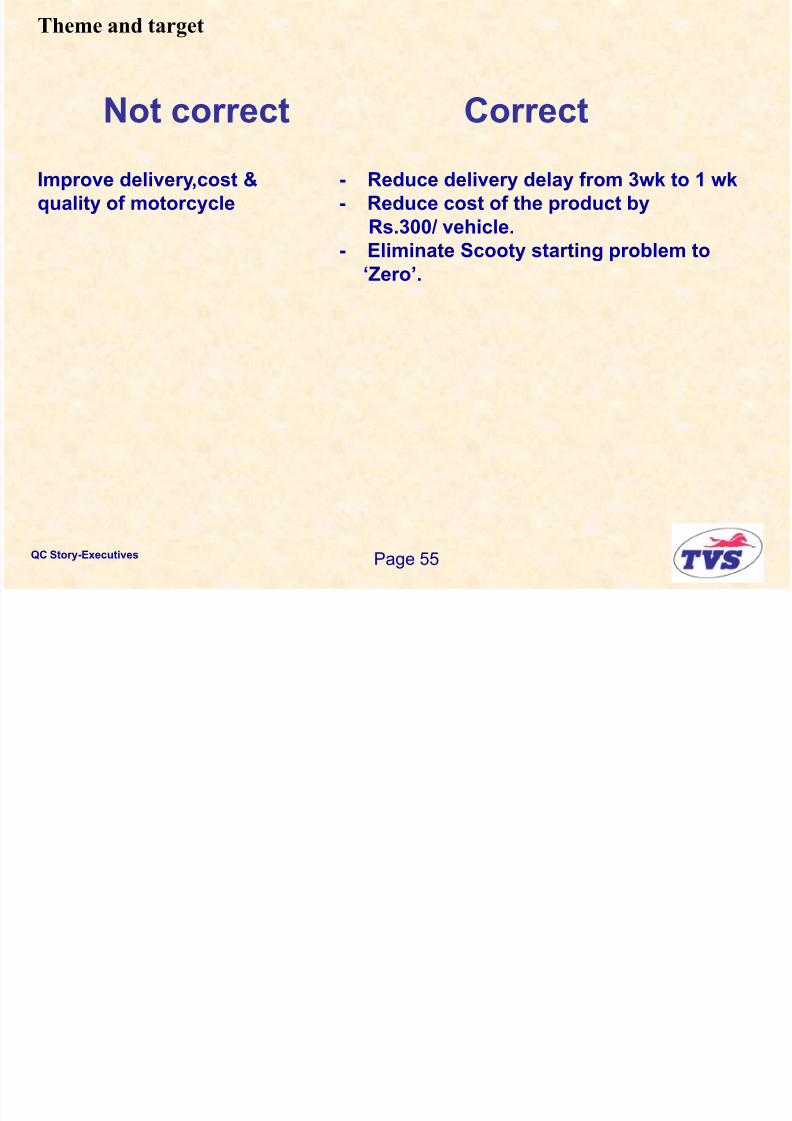
Theme and target
8/10/2019 QC Story.ppt
http://slidepdf.com/reader/full/qc-storyppt 51/146
QC Story-Executives Page 55
g
Improve delivery,cost & - Reduce delivery delay from 3wk to 1 wk
quality of motorcycle - Reduce cost of the product by
Rs.300/ vehicle.
- Eliminate Scooty starting problem to
„Zero‟.
Not correct Correct

8/10/2019 QC Story.ppt
http://slidepdf.com/reader/full/qc-storyppt 52/146
QC Story-Executives
Page 56
Team formation
Form team with members from Customer and supplier
functions.
For example,
ProductionPurchase Warehouse
Team

8/10/2019 QC Story.ppt
http://slidepdf.com/reader/full/qc-storyppt 53/146
QC Story-Executives
Page 57
Team formationFunctions – Relations diagram
ProductionPurchase Warehouse
SCHEDULE FOR IMPROVEMENT
Usual Gantt

8/10/2019 QC Story.ppt
http://slidepdf.com/reader/full/qc-storyppt 54/146
QC Story-Executives
Page 58
Problem selection
Observation
Analysis
Action
Check
Standardisation
Conclusion
Presentation
WeekResp. Activity
Holding gains
24 25 26 39
Usual Gantt
chart

8/10/2019 QC Story.ppt
http://slidepdf.com/reader/full/qc-storyppt 55/146

8/10/2019 QC Story.ppt
http://slidepdf.com/reader/full/qc-storyppt 56/146
QC Story-Executives
Page 60
Problem definition
Summary:
• Select a problem from the performance chart
• Prioritise the problems to be solved first
• Explain the importance of the solving that
problem
• Have weakness orientation

8/10/2019 QC Story.ppt
http://slidepdf.com/reader/full/qc-storyppt 57/146
QC Story-Executives
Page 61
Problem definition
Summary:
• Reflect weakness orientation in the problem
statement and the theme• Clearly define the problem
• Don‟t jump into conclusion at this stage itself
• Have a detailed action plan (use Gantt chart)
Tools and techniques used in

8/10/2019 QC Story.ppt
http://slidepdf.com/reader/full/qc-storyppt 58/146
QC Story-Executives
Page 62
Tools and techniques used in
Problem definition stage# Steps Tools & techniques Effectiveness
of tool
1 Understanding
problem
Cause&effect diagram,
Graphs, Control charts,
Performance charts
Stratification
2 Selection of problem Pareto charts
Performance charts
3 Activity plan Gantt charts
Effective Highly effective

8/10/2019 QC Story.ppt
http://slidepdf.com/reader/full/qc-storyppt 59/146
QC Story-Executives
Page 63Page 63
OBSERVATION
Step 2
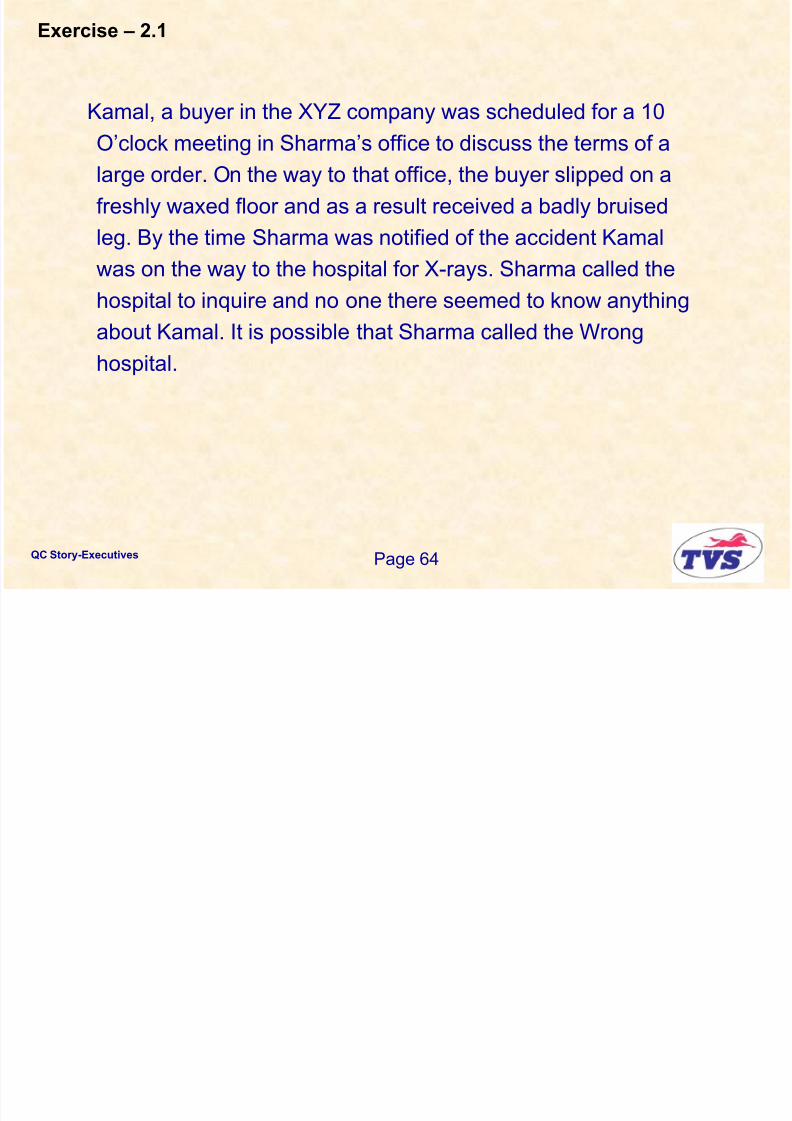
Exercise – 2.1
8/10/2019 QC Story.ppt
http://slidepdf.com/reader/full/qc-storyppt 60/146
QC Story-Executives
Page 64
Kamal, a buyer in the XYZ company was scheduled for a 10
O‟clock meeting in Sharma‟s office to discuss the terms of alarge order. On the way to that office, the buyer slipped on a
freshly waxed floor and as a result received a badly bruised
leg. By the time Sharma was notified of the accident Kamal
was on the way to the hospital for X-rays. Sharma called the
hospital to inquire and no one there seemed to know anything
about Kamal. It is possible that Sharma called the Wrong
hospital.
Exercise – 2.1

8/10/2019 QC Story.ppt
http://slidepdf.com/reader/full/qc-storyppt 61/146
QC Story-Executives
Page 65
YES NO
1. Kamal is a buyer …. ….
2. Kamal was scheduled to have a meeting with
Mr Sharma at 10 O‟ clock …. ….
3. Kamal slipped and fell at Sharma‟s office …. ….
4. Kamal was taken to the hospital for X-ray …. ….
5. No one in the hospital knew anything about Kamal …. ….
Ob ti

8/10/2019 QC Story.ppt
http://slidepdf.com/reader/full/qc-storyppt 62/146
QC Story-Executives
Page 66
Observation
Objective:
Understanding of the current circumstances
based on facts.
Ob ti
8/10/2019 QC Story.ppt
http://slidepdf.com/reader/full/qc-storyppt 63/146
QC Story-Executives
Page 67
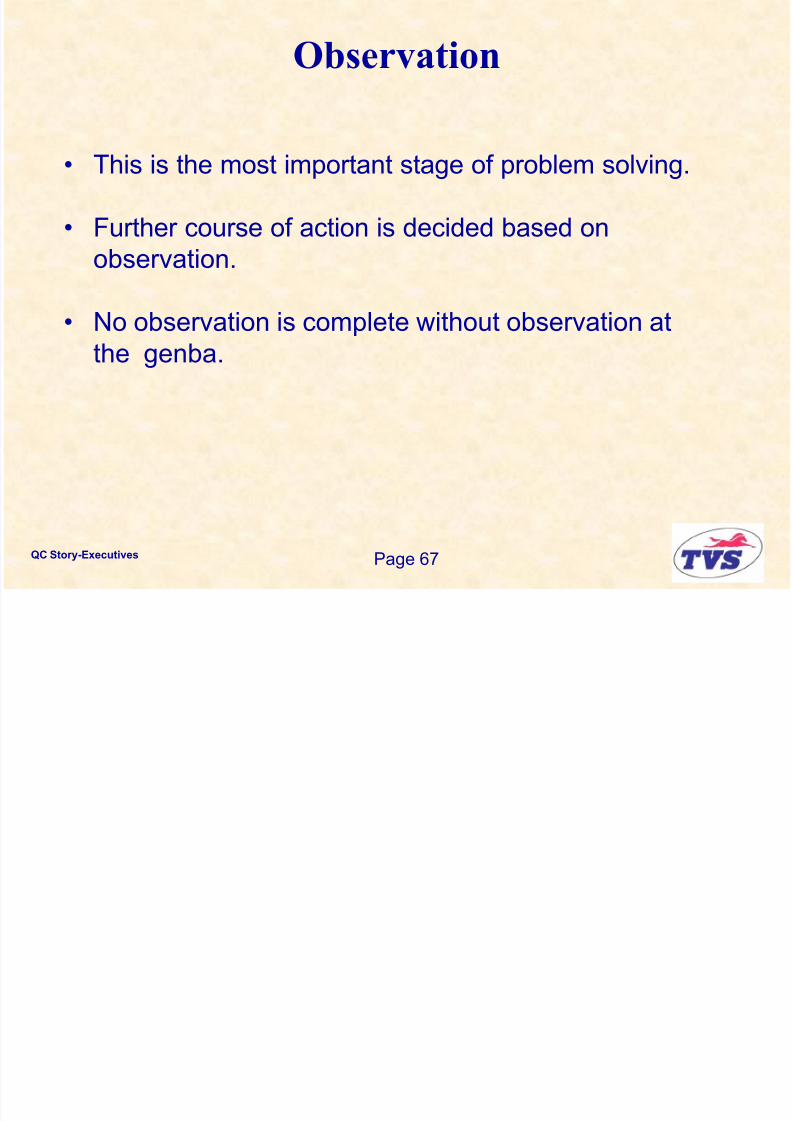
Observation
• This is the most important stage of problem solving.
• Further course of action is decided based on
observation.
• No observation is complete without observation at
the genba.
Observation
8/10/2019 QC Story.ppt
http://slidepdf.com/reader/full/qc-storyppt 64/146
QC Story-Executives
Page 68
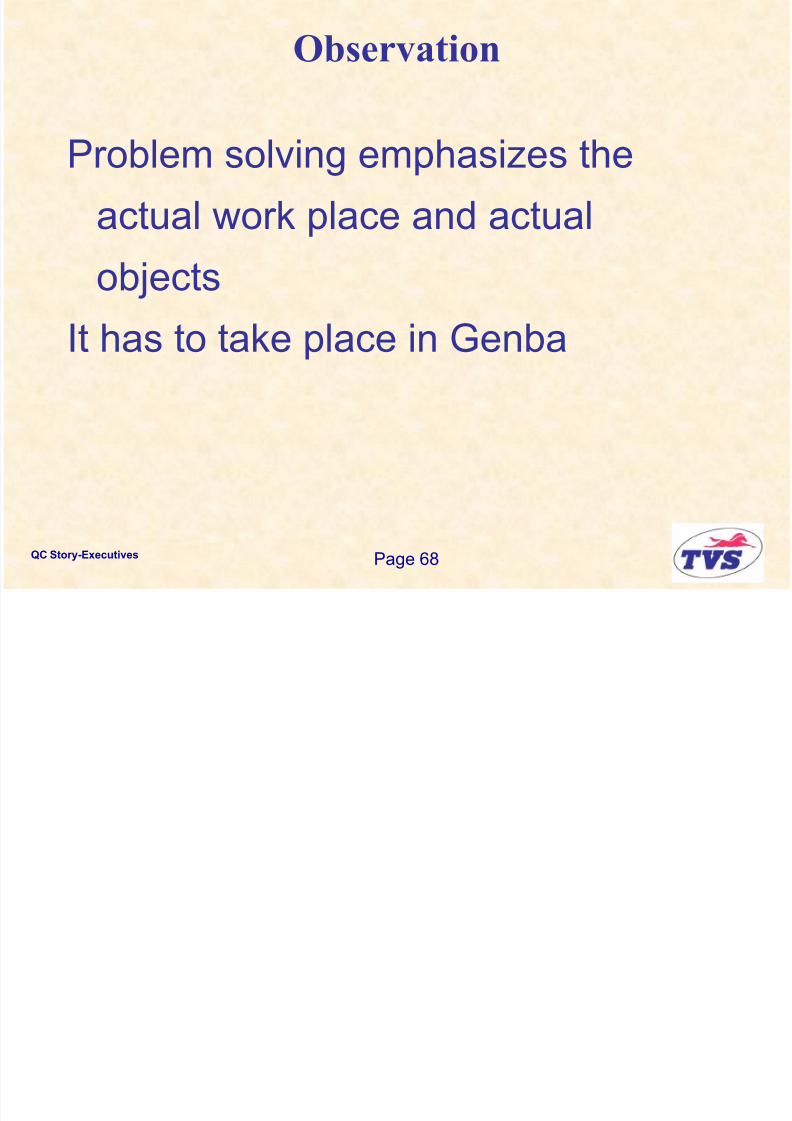
Observation
Problem solving emphasizes the
actual work place and actual
objectsIt has to take place in Genba
Observation
8/10/2019 QC Story.ppt
http://slidepdf.com/reader/full/qc-storyppt 65/146
QC Story-Executives
Page 69
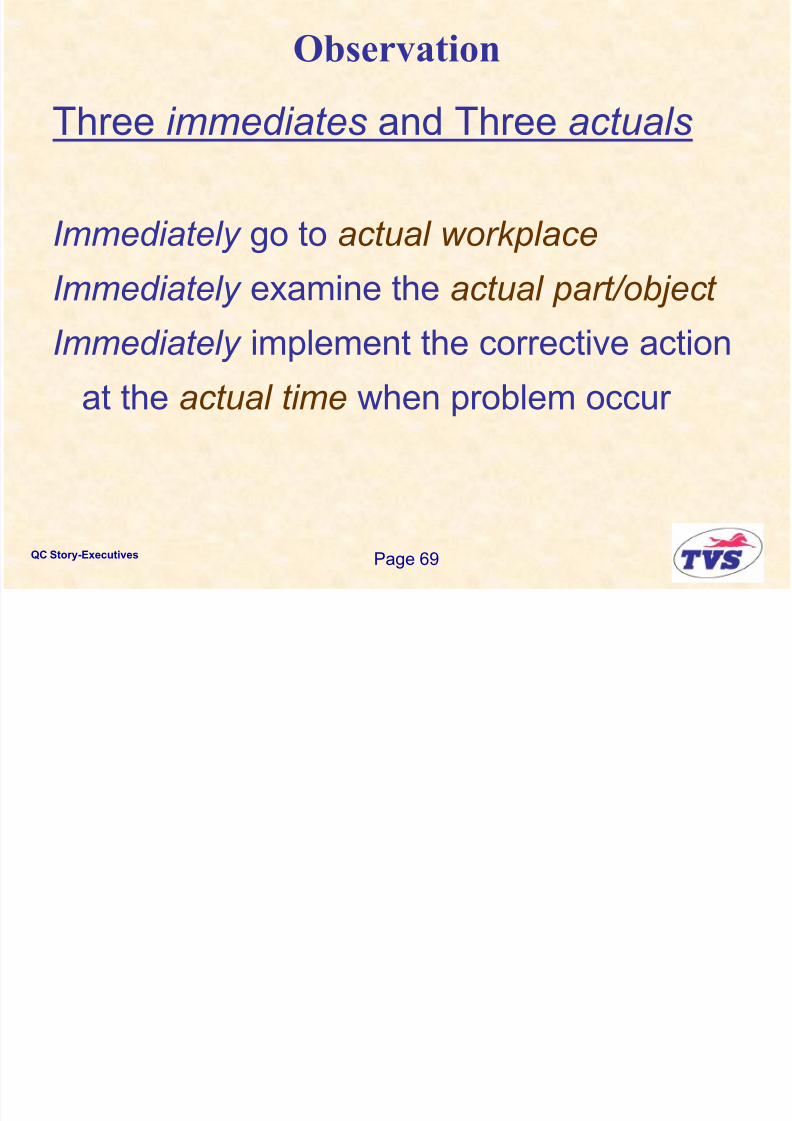
Observation
Three immediates and Three actuals
Immediately go to actual workplace
Immediately examine the actual part/object
Immediately implement the corrective action
at the actual time when problem occur
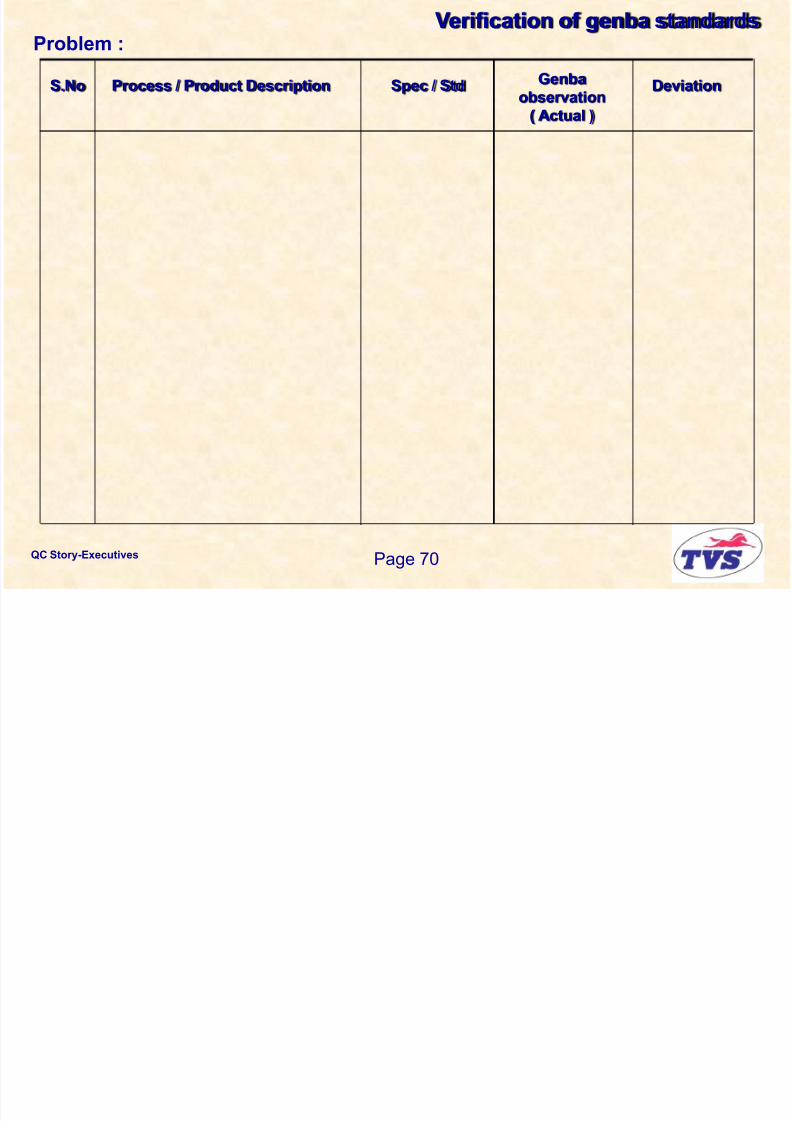
Verification of genba standardsProblem :
8/10/2019 QC Story.ppt
http://slidepdf.com/reader/full/qc-storyppt 66/146
QC Story-Executives
Page 70
S.No Process / Product Description Spec / Std Genba
observation
( Actual )
Deviation
Problem :
Verification of genba standards
P bl P bilit i XLO fi b i hi f

8/10/2019 QC Story.ppt
http://slidepdf.com/reader/full/qc-storyppt 67/146
QC Story-Executives
Page 71
Problem : Poor process capability in XLO fine boring machine of
XL Cyl.block cell
SAMPLE
S.No Process / Product Description Spec / STD Genba
observation
( Actual )
Deviation
01 FEED 0.1 mm / min 0.1 mm / min NIL
02 SPEED 1100 RPM 1100 RPM NIL
03 INSERT TCGX 110204 TCGX 110208 INSTEAD OF
R 04 ,R 08
IS BEING USED
Verification of genba standards
8/10/2019 QC Story.ppt
http://slidepdf.com/reader/full/qc-storyppt 68/146
QC Story-Executives
Page 72
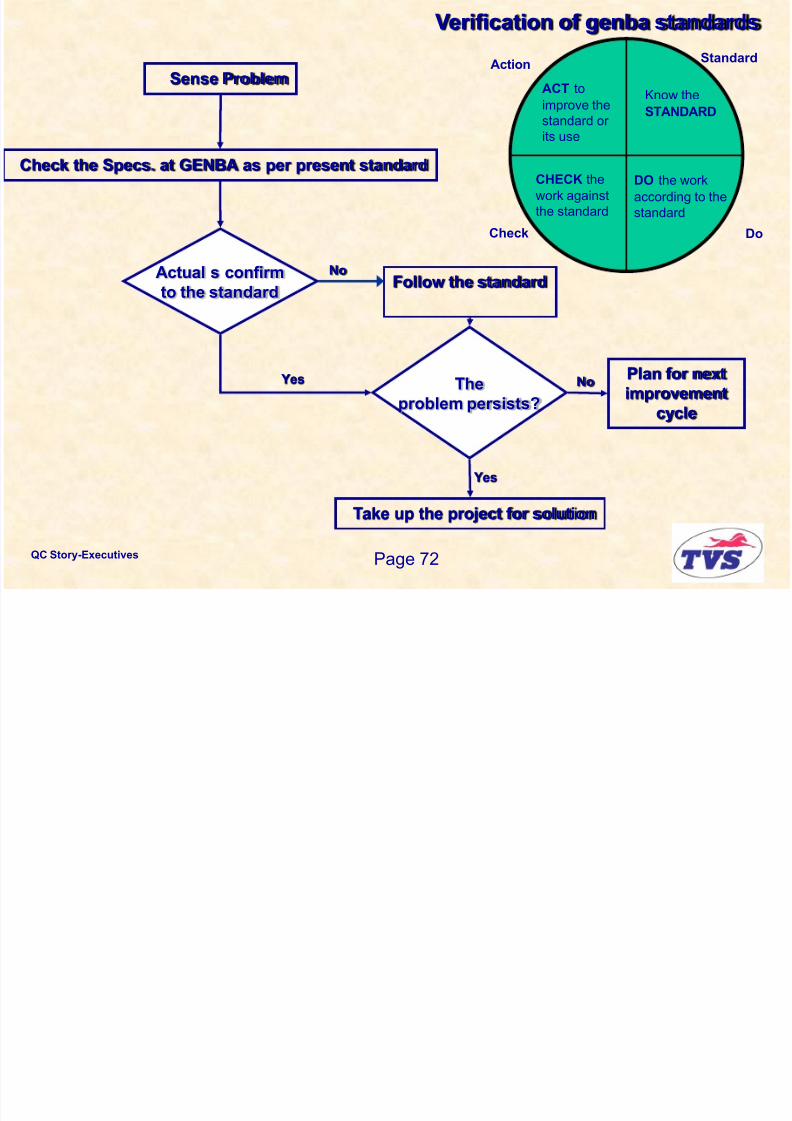
Sense Problem
Check the Specs. at GENBA as per present standard
Actual s confirm
to the standard
The
problem persists?
Take up the project for solution
Follow the standard
No
Yes
Yes
Plan for next
improvement
cycle
No
Do
Action
Check
Standard
Know the STANDARD
CHECK the
work against
the standard
ACT toimprove the
standard or
its use
DO the work
according to the
standard
Observation

8/10/2019 QC Story.ppt
http://slidepdf.com/reader/full/qc-storyppt 69/146
QC Story-Executives
Page 73
Observation
• Look for – nature of occurrence
– any clues on failed parts
• Stratify the data to the extent possible
• All the data (Quantitative),observations (Qualitative)
should be tabulated
- clearly and
- in an easy-to-understand manner.
• Do not be biased. Go with an open mind.
R d th f ll i At h t i k it

8/10/2019 QC Story.ppt
http://slidepdf.com/reader/full/qc-storyppt 70/146
QC Story-Executives
Page 74
Read the following. At each asterisk write your
ranking of Fatima using the scale:
1: Very poor 2: Poor 3: Average 4:
Good 5: Very Good.
Srinivasan, Kurien and Fatima are tailors in a garment
Company. Their average stitching speeds (garments per
day) for the last three months have been:-Srinivasan = 60; Kurien = 50; Fatima = 30.
*What do you think of Fatima‟s performance?
Srinivasan and Kurien had other jobs before joining this
Company three years ago. This is Fatima‟s first job.
She joined three months ago.
*What do you think of Fatima‟s performance?
While Srinivasan and Kurien‟s have new

8/10/2019 QC Story.ppt
http://slidepdf.com/reader/full/qc-storyppt 71/146
QC Story-Executives
Page 75
While Srinivasan and Kurien s have new
imported sewing machines. Fatima has an old
local machine which gets stuck frequently.
*What do you think of Fatima‟s performance?
Most of Srinivasan and Kurien‟s work is steady, simple
garment stitching, yet they have considerable number
of re-works. Fatima on the other hand is usually given
difficult jobs and her work is practically errorless.*What do you think of Fatima‟s performance?
Fatima does her stitching easily without much strainwhereas Srinivasan and Kurien struggle to stitch the
garments.
*What do you think of Fatima‟s performance?

8/10/2019 QC Story.ppt
http://slidepdf.com/reader/full/qc-storyppt 72/146
QC Story-Executives
Page 76
What was your first image of Fatima? What was your
last? Why your opinion was changed?
Learning:
If you decide based on incomplete
data, your decision may be wrong.

8/10/2019 QC Story.ppt
http://slidepdf.com/reader/full/qc-storyppt 73/146
QC Story-Executives
Page 77
•Use checksheets for collecting data
•Design your own check sheet to collect data
•Do not believe in the past data;always suspect it
•If you design the experiments for collecting data,
collect and record as much data as possible –
experiments are costlier.
Example: Record the roundness errors and cylindricity
errors and the direction of the high points (orientation) etc.,
while collecting data on diameter

8/10/2019 QC Story.ppt
http://slidepdf.com/reader/full/qc-storyppt 74/146
QC Story-Executives
Page 78
8/10/2019 QC Story.ppt
http://slidepdf.com/reader/full/qc-storyppt 75/146
QC Story-Executives
Page 79
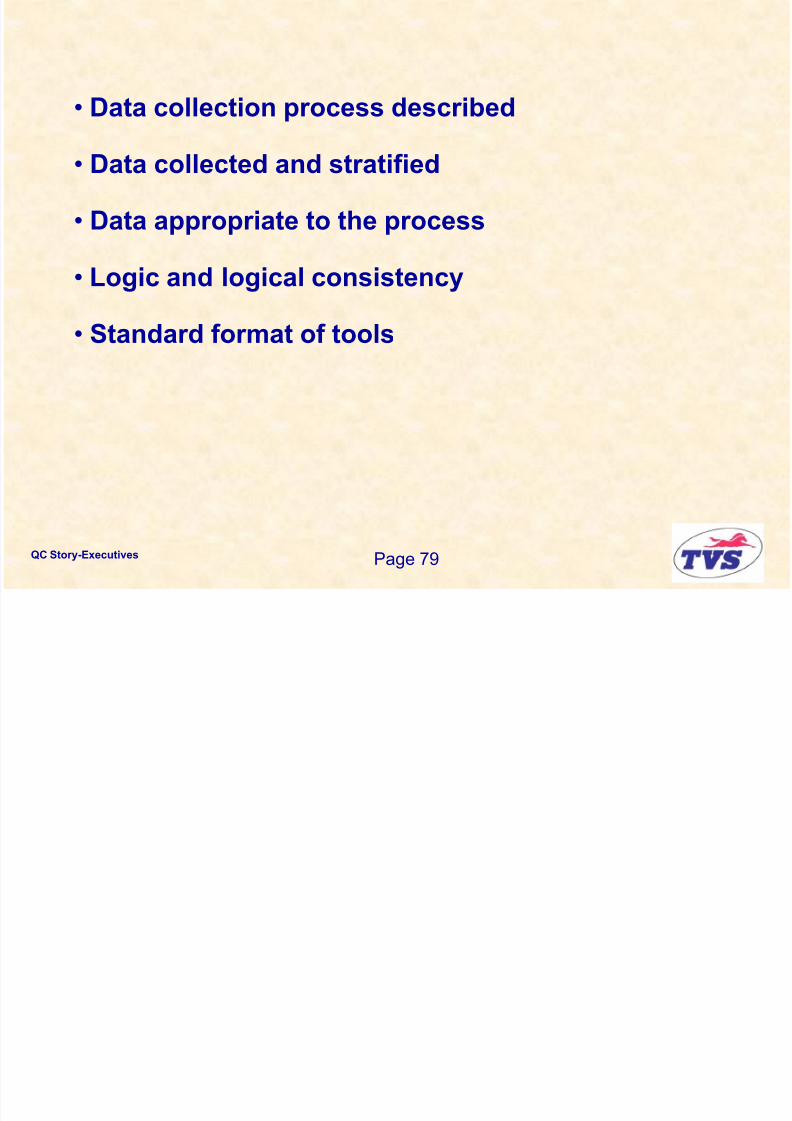
• Data collection process described
• Data collected and stratified
• Data appropriate to the process
• Logic and logical consistency
• Standard format of tools
How and Where Do We Start?

8/10/2019 QC Story.ppt
http://slidepdf.com/reader/full/qc-storyppt 76/146
QC Story-Executives
Page 80Page 80
How and Where Do We Start?
Map the process
Record where and when it is happening
Principle
Take process P3 and process P2 for further study,
Why P2 ?
Process P2 may have an effect on process P3
Problemobserved
here
P1 P2 P3 P4 P5
Problem
occurs
here
Stratification of data
8/10/2019 QC Story.ppt
http://slidepdf.com/reader/full/qc-storyppt 77/146
QC Story-Executives
Page 81
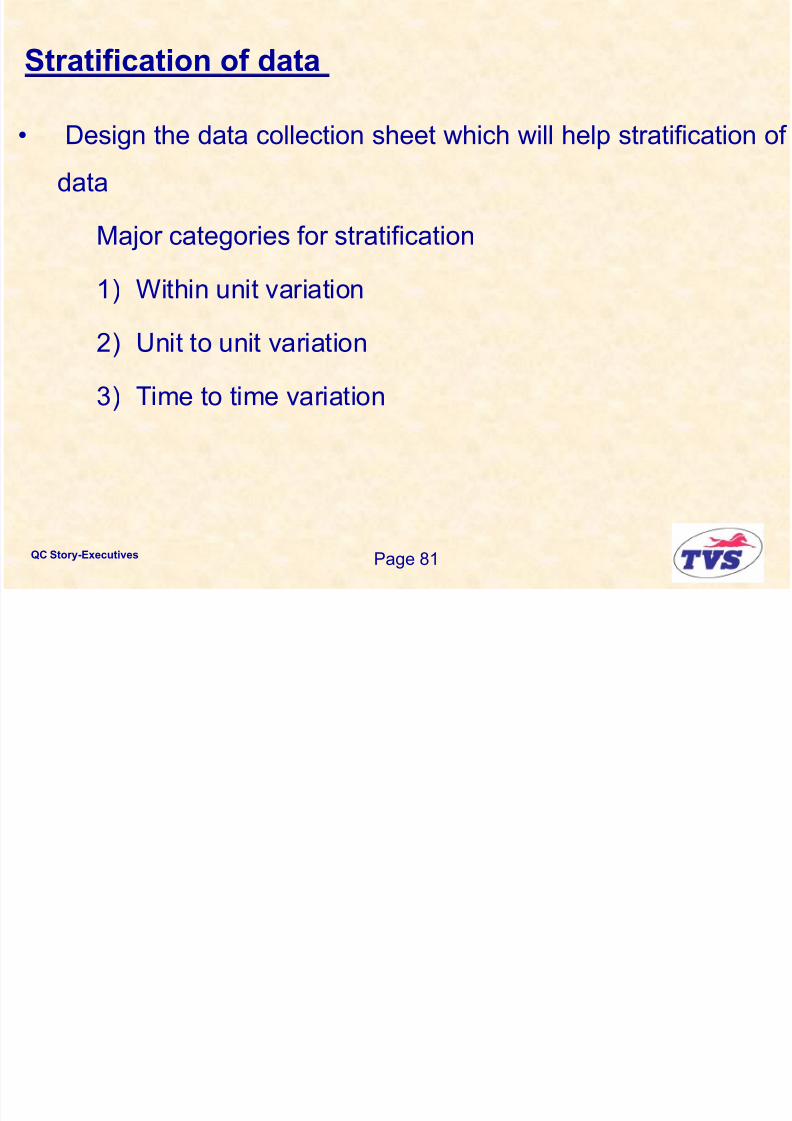
Stratification of data
• Design the data collection sheet which will help stratification of
data
Major categories for stratification
1) Within unit variation
2) Unit to unit variation
3) Time to time variation

8/10/2019 QC Story.ppt
http://slidepdf.com/reader/full/qc-storyppt 78/146
QC Story-Executives
Page 82
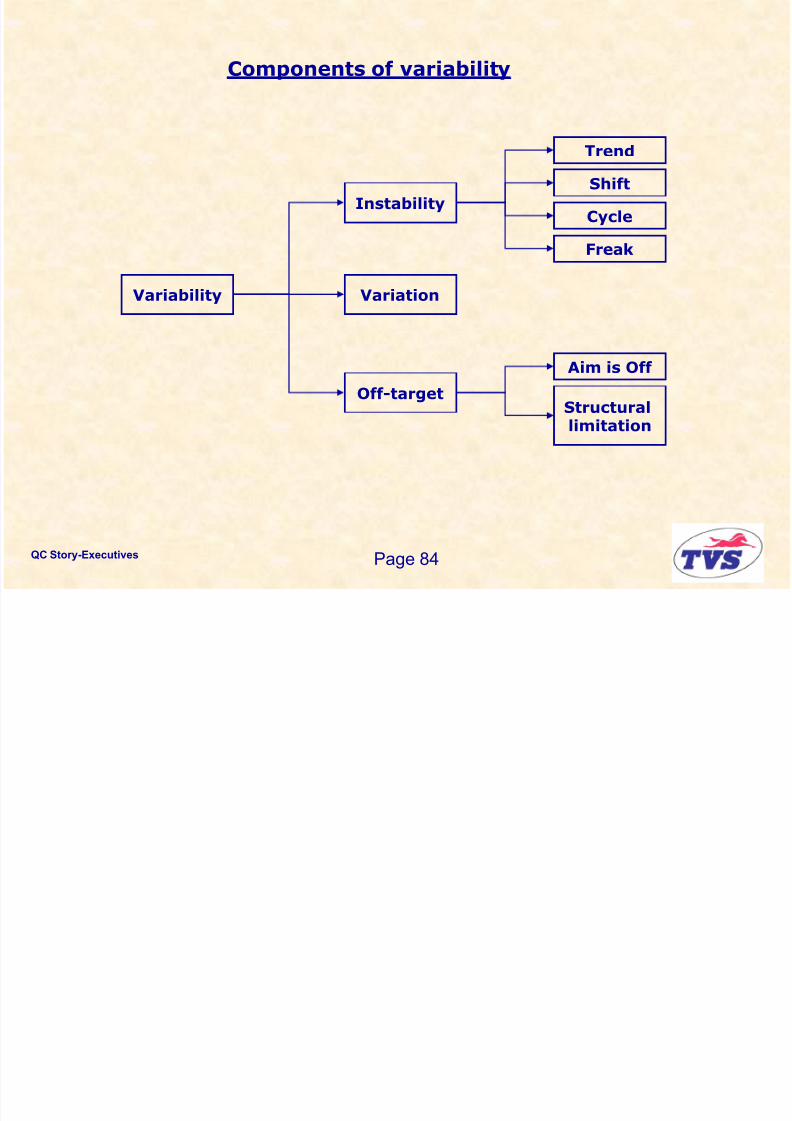
Instability
Variation Off-Target
Process
Variability
Problem
Definition
Output Symptom
Variation Vs Variability

8/10/2019 QC Story.ppt
http://slidepdf.com/reader/full/qc-storyppt 79/146
QC Story-Executives
Page 83
Variability Variation
Variation Vs Variability
Variation is the subset of variability. Variation is present due to
common causes whereas variability is present due toassignable causes as well as common causes.
8/10/2019 QC Story.ppt
http://slidepdf.com/reader/full/qc-storyppt 80/146
QC Story-Executives
Page 84
Variability Variation
Instability
Off-target
Shift
Trend
Cycle
Freak
Aim is Off
Structural
limitation
Components of variability

8/10/2019 QC Story.ppt
http://slidepdf.com/reader/full/qc-storyppt 81/146
QC Story-Executives
Page 85
Stratification:Examples

8/10/2019 QC Story.ppt
http://slidepdf.com/reader/full/qc-storyppt 82/146
QC Story-Executives
Page 86Page 86
0
4
8
12
1 3 5 7 9 1 1 1 3 1 5 1 7 1 9
Machine A
Machine B
Machine A
Machine B
0
4
8
12
1 3 5 7 9 1 1 1 3 1 5 1 7 1 9
0
4
8
12
1 3 5 7 9 1 1 1 3 1 5 1 7 1 9
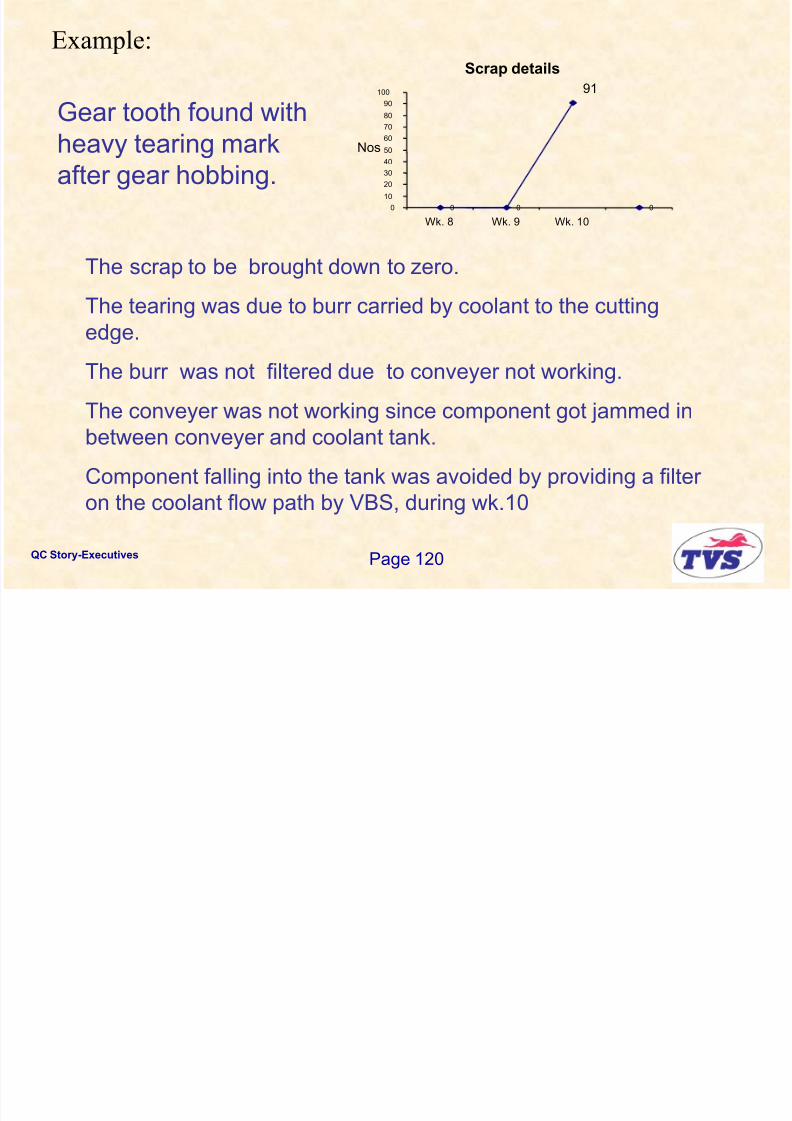
Scrap detailsExample:

8/10/2019 QC Story.ppt
http://slidepdf.com/reader/full/qc-storyppt 83/146
QC Story-Executives
Page 87
Machining details.Hob material : ASP 30- Tin coated
Job RPM : 18
Hob RPM : 276
Feed : 2 mm/minCutting fluid : ILO Cut 1945
Job hardness : 80 – 82 HRB ( Spec.80-90 HRB)
Gear KS driven- Ax100.
Gear tooth found with
heavy tearing mark aftergear hobbing.
0 0
91
0 0
10
20
30
40
50
60
70
80
90
100
Wk. 8 Wk. 9 Wk. 10
Nos
Problem : Tearing mark on component

8/10/2019 QC Story.ppt
http://slidepdf.com/reader/full/qc-storyppt 84/146
QC Story-Executives
Page 88
Burr collecting
conveyer
Cutting oil
tank
Problem : Tearing mark on component
Hobbing
machine
Clue: After conveyer repair, no rejection
What Did You Learn?

8/10/2019 QC Story.ppt
http://slidepdf.com/reader/full/qc-storyppt 85/146
QC Story-Executives
Page 89
What Did You Learn?
How to define a problem?How to make a „Problem statement‟?
- what is the problem,
- where it occurred,
- who will solve it,
- when it will be solved.
How to make genba Observation
- have an open mind,- look for clues,
- nature of occurrence of problem.

8/10/2019 QC Story.ppt
http://slidepdf.com/reader/full/qc-storyppt 86/146
QC Story-Executives
Page 90
Session 2
What Did You Learn in Session 1?

8/10/2019 QC Story.ppt
http://slidepdf.com/reader/full/qc-storyppt 87/146
QC Story-Executives
Page 91
What Did You Learn in Session 1?
How to define a problem?
How to make a „Problem statement‟?
- what is the problem,
- where it occurred,
- who will solve it,- when it will be solved.
How to make genba Observation?
- have an open mind,
- look for clues,
- nature of occurrence of problem.
Session 2 Objectives

8/10/2019 QC Story.ppt
http://slidepdf.com/reader/full/qc-storyppt 88/146
QC Story-Executives
Page 92Page 92
Session 2 Objectives
By the end of this module, you will be able to:
Analyse and identify the root cause.
Plan and implement actions
Check for results and review
Identify applicable areas and horizontally
deploy the learning.
Step 3

8/10/2019 QC Story.ppt
http://slidepdf.com/reader/full/qc-storyppt 89/146
QC Story-Executives
Page 93Page 93
ANALYSIS
Step 3
8/10/2019 QC Story.ppt
http://slidepdf.com/reader/full/qc-storyppt 90/146
QC Story-Executives
Page 94
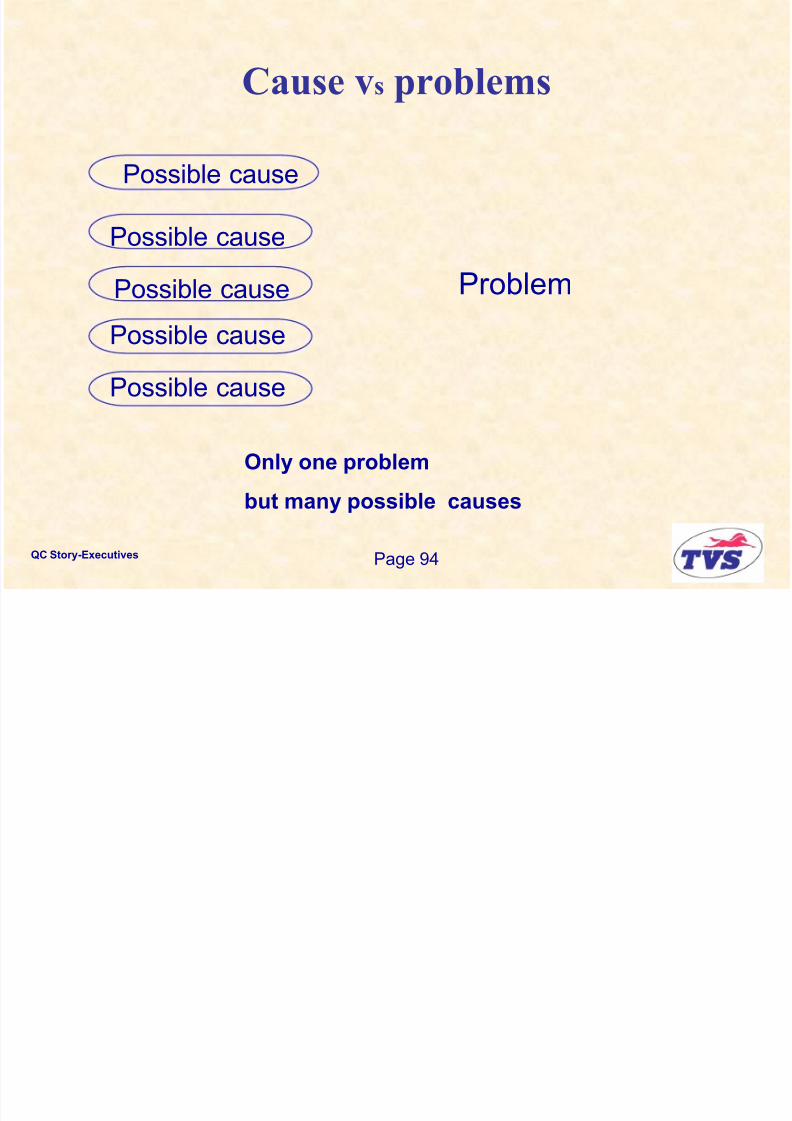
Cause vs problems
Possible cause
Problem
Only one problem
but many possible causes
Possible cause
Possible cause
Possible cause
Possible cause
Cause Vs Problems
8/10/2019 QC Story.ppt
http://slidepdf.com/reader/full/qc-storyppt 91/146
QC Story-Executives
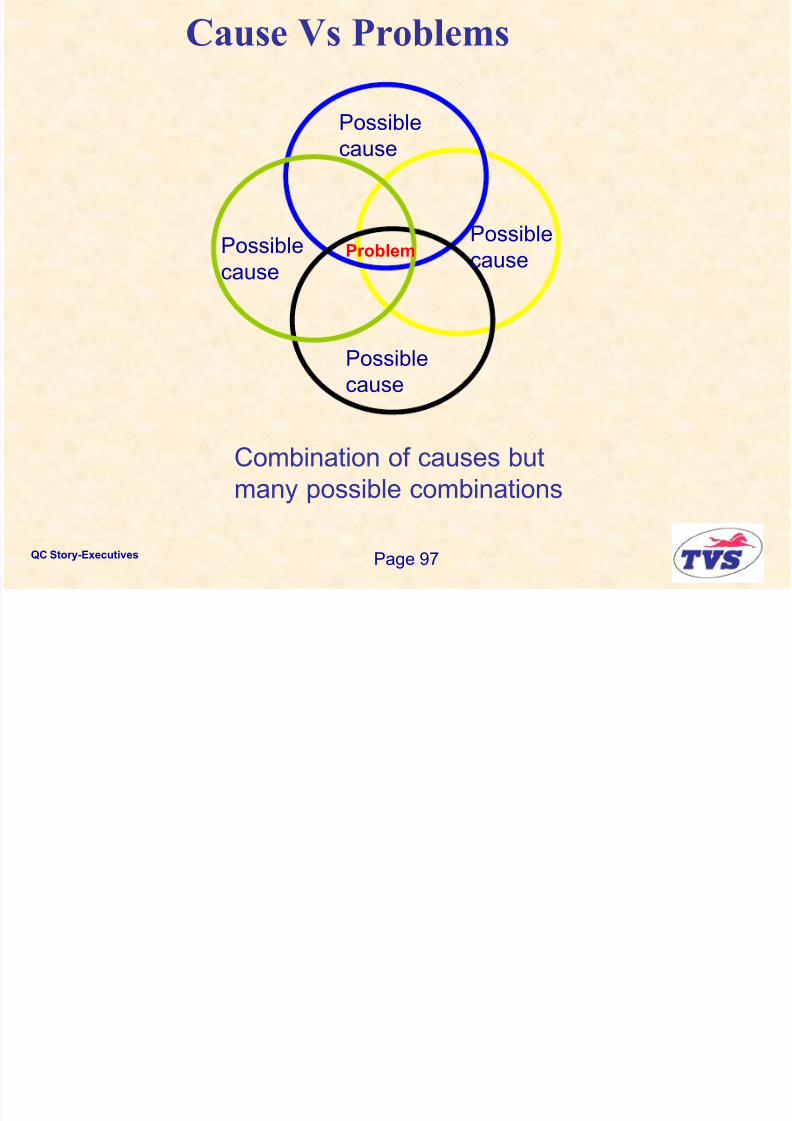
Page 97
Possible
cause
Possible
cause
Possible
cause
Combination of causes but
many possible combinations
Problem
Possible
cause
„Combination of causes‟ is similar to „bat the rat‟

8/10/2019 QC Story.ppt
http://slidepdf.com/reader/full/qc-storyppt 92/146
QC Story-Executives
Page 98
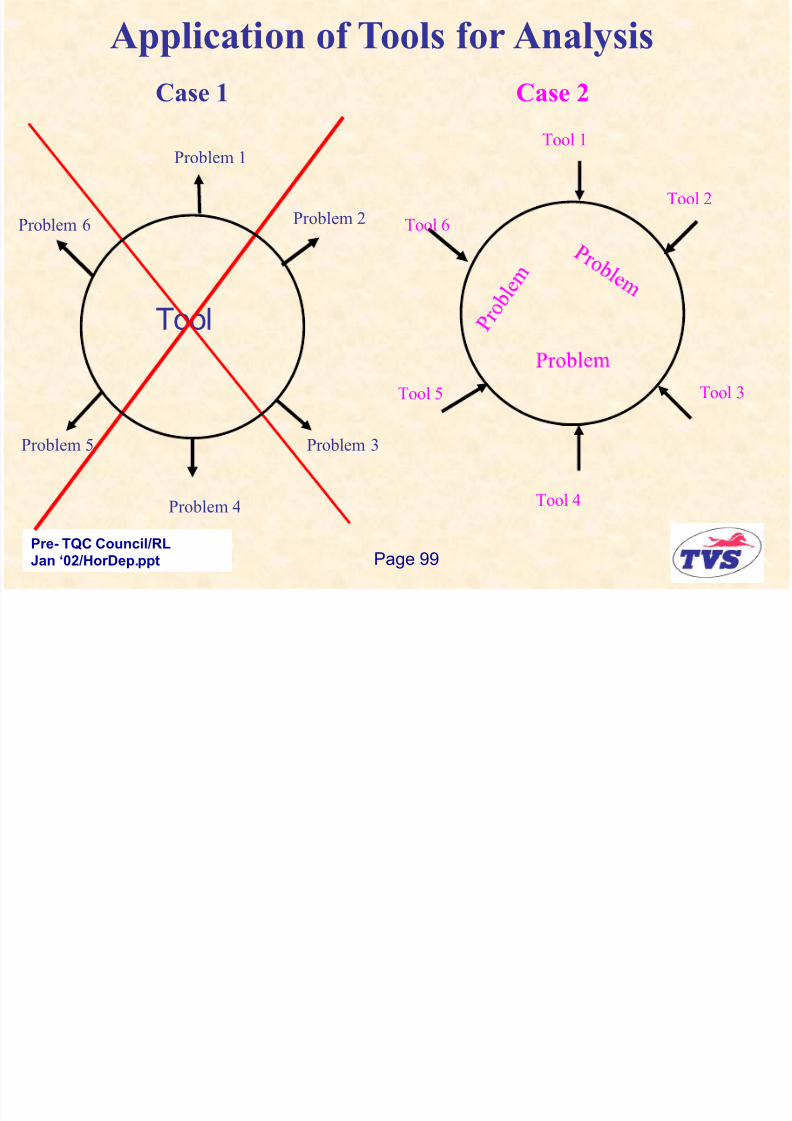
Application of Tools for Analysis
8/10/2019 QC Story.ppt
http://slidepdf.com/reader/full/qc-storyppt 93/146
QC Story-Executives
Page 99
Pre- TQC Council/RL
Jan „02/HorDep.ppt
Tool
Tool 6
Tool 5
Tool 4
Tool 3
Tool 2
Tool 1
Case 1 Case 2
Problem 1
Problem 5
Problem 6
Problem 4
Problem 3
Problem 2
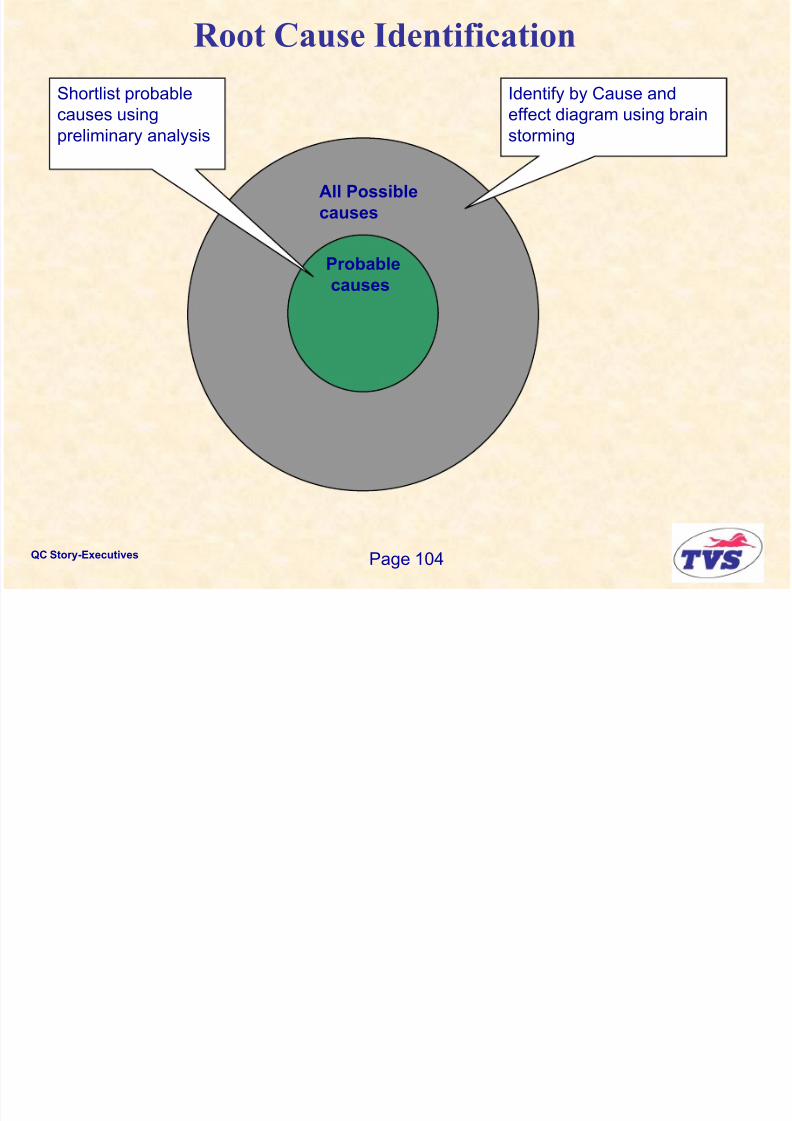
Root Cause Identification

8/10/2019 QC Story.ppt
http://slidepdf.com/reader/full/qc-storyppt 94/146
QC Story-Executives
Page 103
All Possible
causes
Identify by Cause and
effect diagram using brain
storming
Root Cause Identification
8/10/2019 QC Story.ppt
http://slidepdf.com/reader/full/qc-storyppt 95/146
QC Story-Executives
Page 104
All Possible
causes
Probable
causes
Identify by Cause and
effect diagram using brain
storming
Shortlist probable
causes using
preliminary analysis
Root Cause Identification
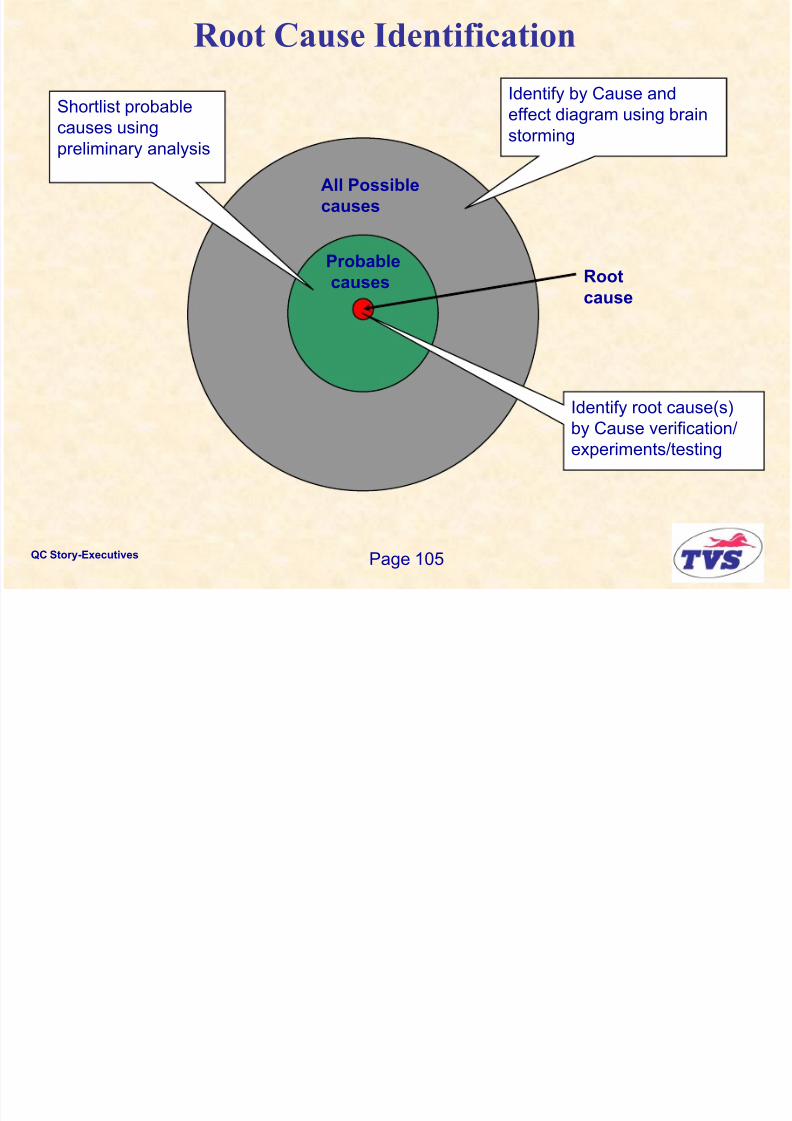
8/10/2019 QC Story.ppt
http://slidepdf.com/reader/full/qc-storyppt 96/146
QC Story-Executives
Page 105
All Possible
causes
Probable
causes Root
cause
Identify by Cause and
effect diagram using brain
storming
Shortlist probable
causes using
preliminary analysis
Identify root cause(s)
by Cause verification/experiments/testing
Cause and Effect Diagram : Sporadic Cause

8/10/2019 QC Story.ppt
http://slidepdf.com/reader/full/qc-storyppt 97/146
QC Story-Executives Page 106
Probable and
possible
causes
Level 1 Level 2 Level 3
Probable
causes
Why, why analysis
Validate the effect of
countermeasureCause verification
Cause
Temp
Countermeasure
RootCause
Preventive countermeasures
Cause and Effect Diagram : Chronic Causes

8/10/2019 QC Story.ppt
http://slidepdf.com/reader/full/qc-storyppt 98/146
QC Story-Executives Page 107
Level 1 Level 2 Level 3
Probable and
possible
causes
Probable
causesCauses
Validate the effect of causes
& its interaction by experiment
Root
Causes
Plan countermeasures
Example:

8/10/2019 QC Story.ppt
http://slidepdf.com/reader/full/qc-storyppt 99/146
QC Story-Executives Page 109
Machining details.Hob material : ASP 30- Tin coated
Job RPM : 18
Hob RPM : 276
Feed : 2 mm/minCutting fluid : ILO Cut 1945
Job hardness : 80 – 82 HRB ( Spec.80-90 HRB)
Gear tooth found with
heavy tearing markafter gear hobbing.
Scrap details
0 0
91
0 0
10
20
30
40
50
60
70
80
90
100
Wk. 8 Wk. 9 Wk. 10
Nos
Problem : Tearing mark on component
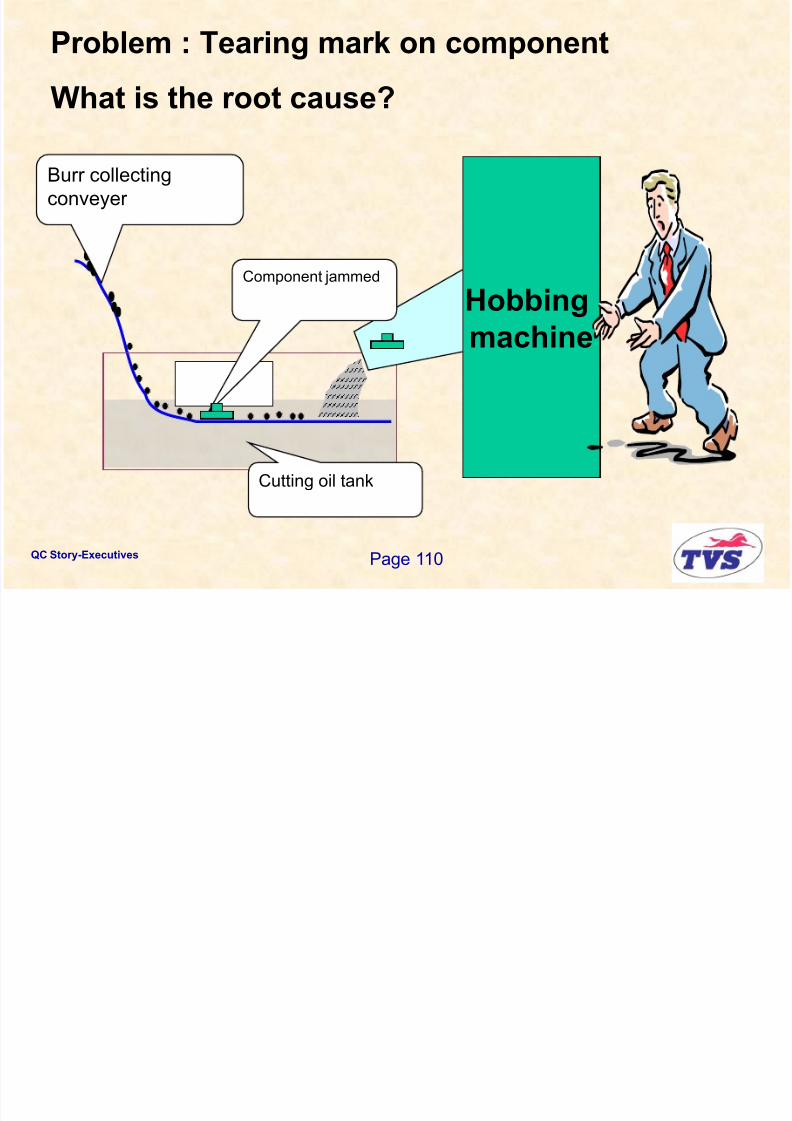
8/10/2019 QC Story.ppt
http://slidepdf.com/reader/full/qc-storyppt 100/146
QC Story-Executives Page 110
Burr collecting
conveyer
Cutting oil tank
Component jammed
What is the root cause?
Hobbingmachine
Problem : Tearing Mark on Component
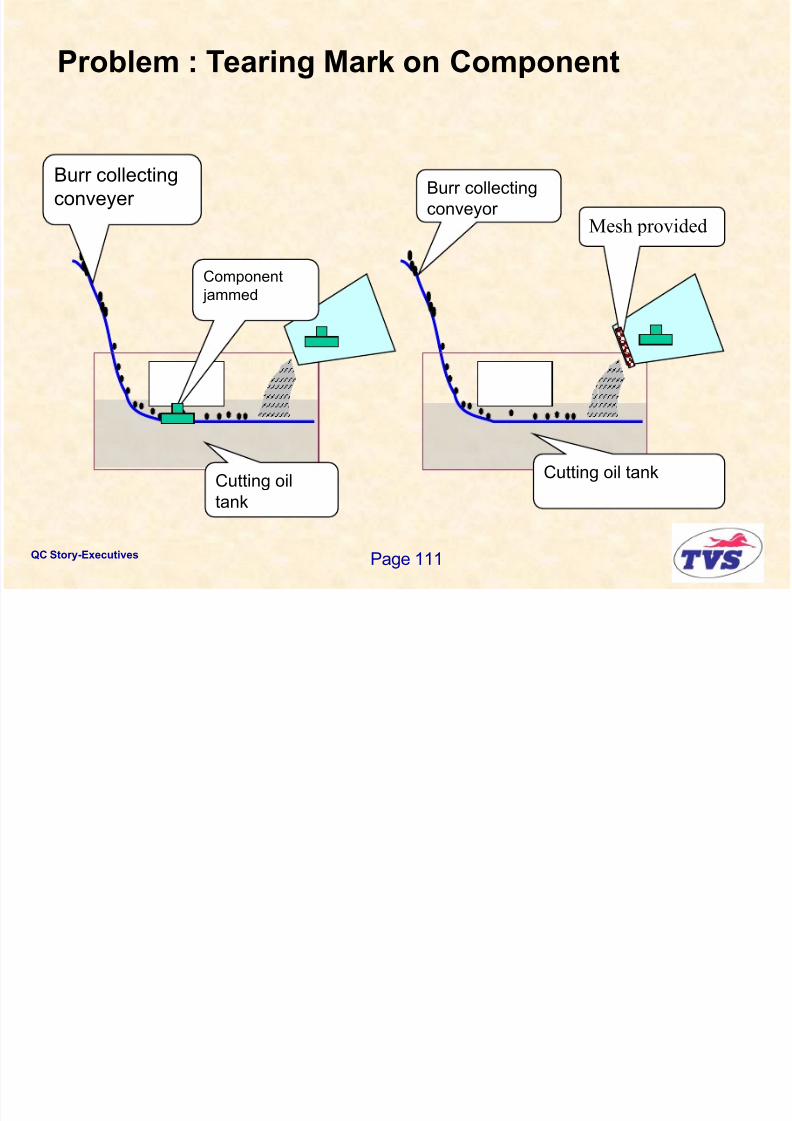
8/10/2019 QC Story.ppt
http://slidepdf.com/reader/full/qc-storyppt 101/146
QC Story-Executives Page 111
Burr collecting
conveyor
Cutting oil tank
Mesh provided
g p
Burr collecting
conveyer
Cutting oil
tank
Component
jammed
Identify root cause
Flow chart for counter measure validation

8/10/2019 QC Story.ppt
http://slidepdf.com/reader/full/qc-storyppt 102/146
QC Story-Executives Page 112
Identify root cause
Plan countermeasure
with alternatives
Check sideEffect for Q&S
Validateresult
Estimatecost
EstimateTime
OK OK OK OK
NOT OK NOT OK
NOT OK
NOT OK
Select appropriatecountermeasure
Action
Effectiveness of Countermeasure
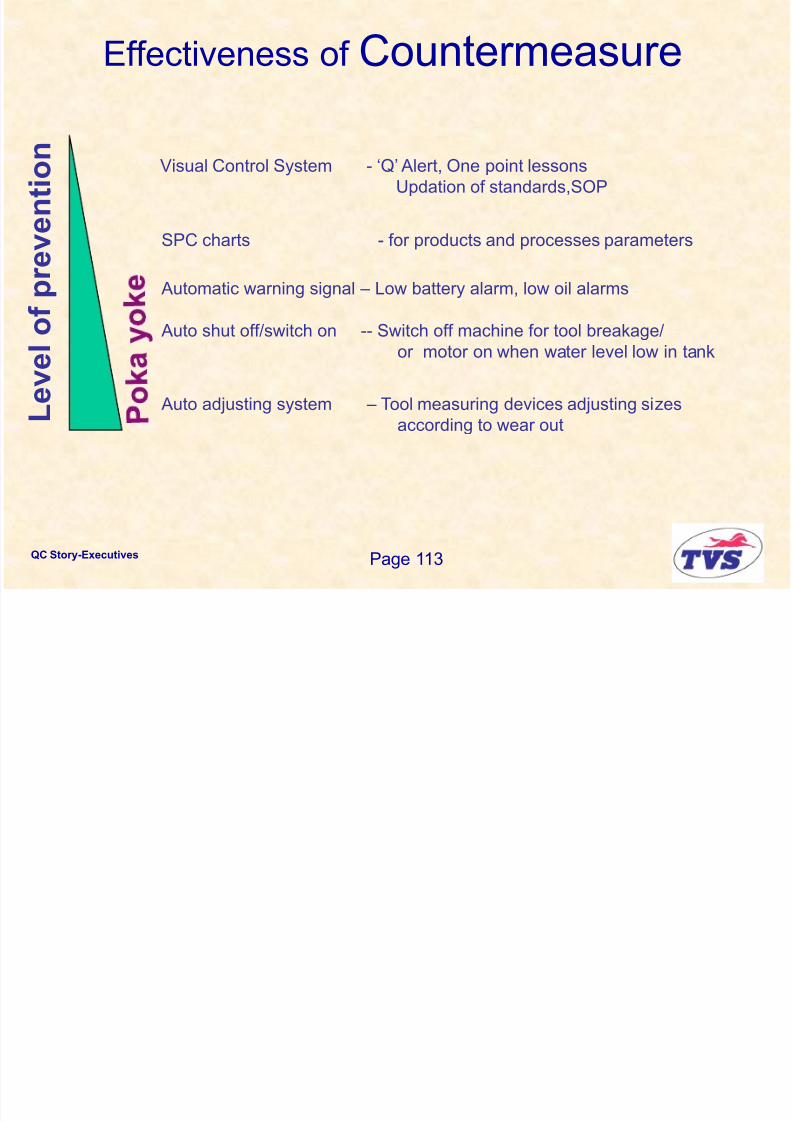
8/10/2019 QC Story.ppt
http://slidepdf.com/reader/full/qc-storyppt 103/146
QC Story-Executives Page 113
Visual Control System - „Q‟ Alert, One point lessons
Updation of standards,SOP
SPC charts - for products and processes parameters
Automatic warning signal – Low battery alarm, low oil alarms
Auto shut off/switch on -- Switch off machine for tool breakage/
or motor on when water level low in tank
Auto adjusting system – Tool measuring devices adjusting sizes
according to wear out
L e v e l o f p
r e v e n t i o n
Analysis - Summary

8/10/2019 QC Story.ppt
http://slidepdf.com/reader/full/qc-storyppt 104/146
QC Story-Executives Page 114
• Identify whether the problem is chronic or sporadic.
• Select appropriate tool depending on problems
• For chronic problems, cause verification to bevalidated statistically.
• Never assume things.
• Select appropriate countermeasures from alternate
countermeasures.• Countermeasures should be for root causes and not
for phenomena / problem
• Check for side effects.
„The quality level in any case should not deterioratefrom the existing level‟
Step 4

8/10/2019 QC Story.ppt
http://slidepdf.com/reader/full/qc-storyppt 105/146
QC Story-Executives Page 115Page 115
ACTION
Implementation Plan

8/10/2019 QC Story.ppt
http://slidepdf.com/reader/full/qc-storyppt 106/146
QC Story-Executives Page 116
Implementation Plan
• Discuss with concerned persons for
implementation of countermeasures.
- use 3w1h formats for action and
Gantt chart for monitoring the progress
Meeting Venue: Date of
Subject review
Members Next
Write the problem here
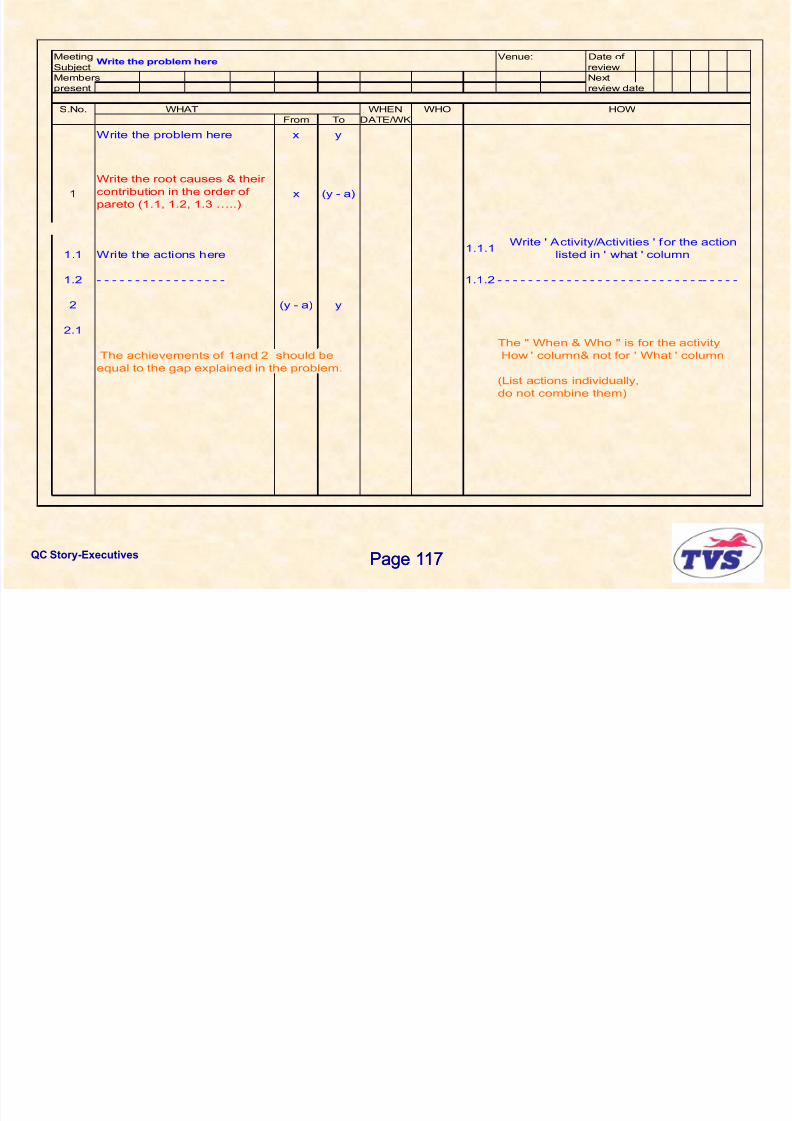
8/10/2019 QC Story.ppt
http://slidepdf.com/reader/full/qc-storyppt 107/146
QC Story-Executives Page 117Page 117
Members Next
present review date
S.No. WHEN WHO
From To DATE/WK
Write the problem here x y
1 x (y - a)
1.1 Write the actions here1.1.1
1.2 - - - - - - - - - - - - - - - - - 1.1.2 - - - - - - - - - - - - - - - - - - - - - - - - - - -- - - - -
2 (y - a) y
2.1
The " When & Who " is for the activity
The achievements of 1and 2 should be How ' column& not for ' What ' column
equal to the gap explained in the problem.
(List actions individually,
do not combine them)
Write ' Activity/Activities ' for the action
listed in ' what ' column
Write the root causes & their
contribution in the order of
pareto (1.1, 1.2, 1.3 …..)
WHAT HOW
Meeting : Venue: Plant I Date ofS i l l
Executive Committee Meeting
EXAMPLE

8/10/2019 QC Story.ppt
http://slidepdf.com/reader/full/qc-storyppt 108/146
QC Story-Executives Page 118Page 118
Meeting : Venue: Plant I Date of
Subject : review
Members Next
present review date
S.No. WHEN WHO
From To (DATE/WK)
Improve spares service level - 81% 96%
1 Clutch cover assembly short supply
Supplier capacity less 81% 91%
1.1 Develop Fiem Auto as alternate Wk.no 49 AD 1.1.Arrange samples in powder coated
source to ………………………. condition from M/s Fiem Auto Ltd
Wk.no 50 MAV 1.1.Approve samples
Wk.no 51 AD 1.1.Arrange pilot batch
Wk.no 52 AD 1.1.Arrange Bulk supplies
2 V pulley - short supply due to 91% 96%
breakdown
PT( Buyer name) Temp .
2.1 Reduce breakdown of Wk.no 49 Rausriya 2.1. Add capacitor to compensate
welding machine at Rajsriya ltd the voltage drop
Wk.no 50 Rausriya 2.1.Replace the timer relaysPerm.
Wk.no 52 Rausriya 2.1.Switchover to microprocessor .
controlled spot welding machine
Spares service level
WHAT HOW
EXAMPLE
EXAMPLE
Arrange samples in powder coated cndition from
FIEM A to ltd
Activity Plan
March'02Action 1.1
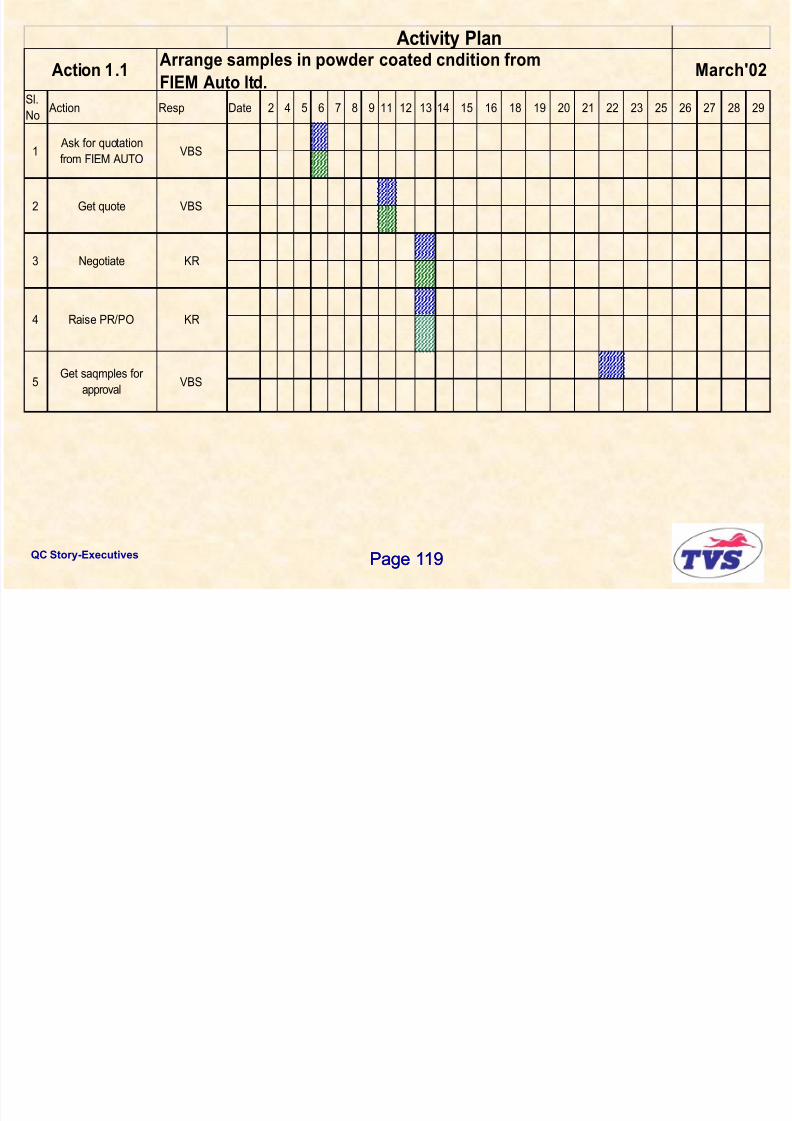
8/10/2019 QC Story.ppt
http://slidepdf.com/reader/full/qc-storyppt 109/146
QC Story-Executives Page 119Page 119
Sl.
No Action Resp Date 2 4 5 6 7 8 9 11 12 13 14 15 16 18 19 20 21 22 23 25 26 27 28 29
Get saqmples for
approvalVBS5
KR
4 Raise PR/PO
3
KR
Negotiate
2
1
Ask for quotation
from FIEM AUTO VBS
VBSGet quote
FIEM Auto ltd.
Example:Scrap details
8/10/2019 QC Story.ppt
http://slidepdf.com/reader/full/qc-storyppt 110/146
QC Story-Executives Page 120
Gear tooth found with
heavy tearing markafter gear hobbing.0 0
91
0 0
10
20
30
40
50
60
70
80
90
100
Wk. 8 Wk. 9 Wk. 10
Nos
The scrap to be brought down to zero.
The tearing was due to burr carried by coolant to the cutting
edge.
The burr was not filtered due to conveyer not working.
The conveyer was not working since component got jammed in
between conveyer and coolant tank.
Component falling into the tank was avoided by providing a filter
on the coolant flow path by VBS, during wk.10
Meeting : Venue: Plant I Date of
Subject : review 2 3 0 3 0 2
Members Next
Eliminate Gear KS driven s
Executive Committee Meeting
EXAMPLE
8/10/2019 QC Story.ppt
http://slidepdf.com/reader/full/qc-storyppt 111/146
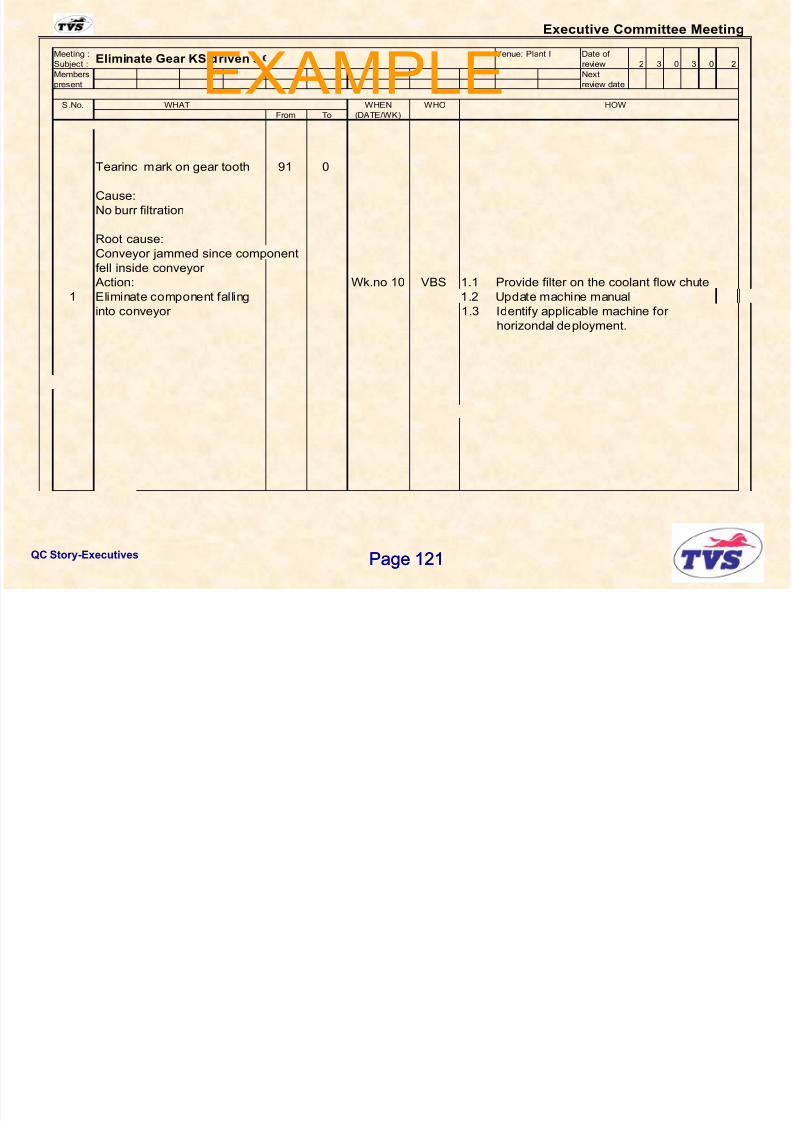
QC Story-Executives Page 121Page 121
present review date
S.No. WHEN WHO
From To (DATE/WK)
Tearinc mark on gear tooth 91 0
Cause:
No burr filtration
Root cause:
Conveyor jammed since component
fell inside conveyor
Action: Wk.no 10 VBS 1.1 Provide filter on the coolant flow chute
1 Eliminate component falling 1.2 Update machine manualinto conveyor 1.3 Identify applicable machine for
horizondal deployment.
WHAT HOW
EXAMPLE
Action Summary
8/10/2019 QC Story.ppt
http://slidepdf.com/reader/full/qc-storyppt 112/146
QC Story-Executives Page 122
Action - Summary
• Clearly spell out the actions.
• Fix responsibility to an individual and not a dept.
• Fix target dates
• Have regular reviews till implementation is
completed.
Step 5
8/10/2019 QC Story.ppt
http://slidepdf.com/reader/full/qc-storyppt 113/146
QC Story-Executives Page 123Page 123
CHECK
How to Check

8/10/2019 QC Story.ppt
http://slidepdf.com/reader/full/qc-storyppt 114/146
QC Story-Executives Page 124
How to Check
• Compare the results before and after implementation
of countermeasure.
• Use the same charts, measures used in
define/ observation phase.
• Monitor the results at least for 3 months.
• Monitor that the actions are in place.
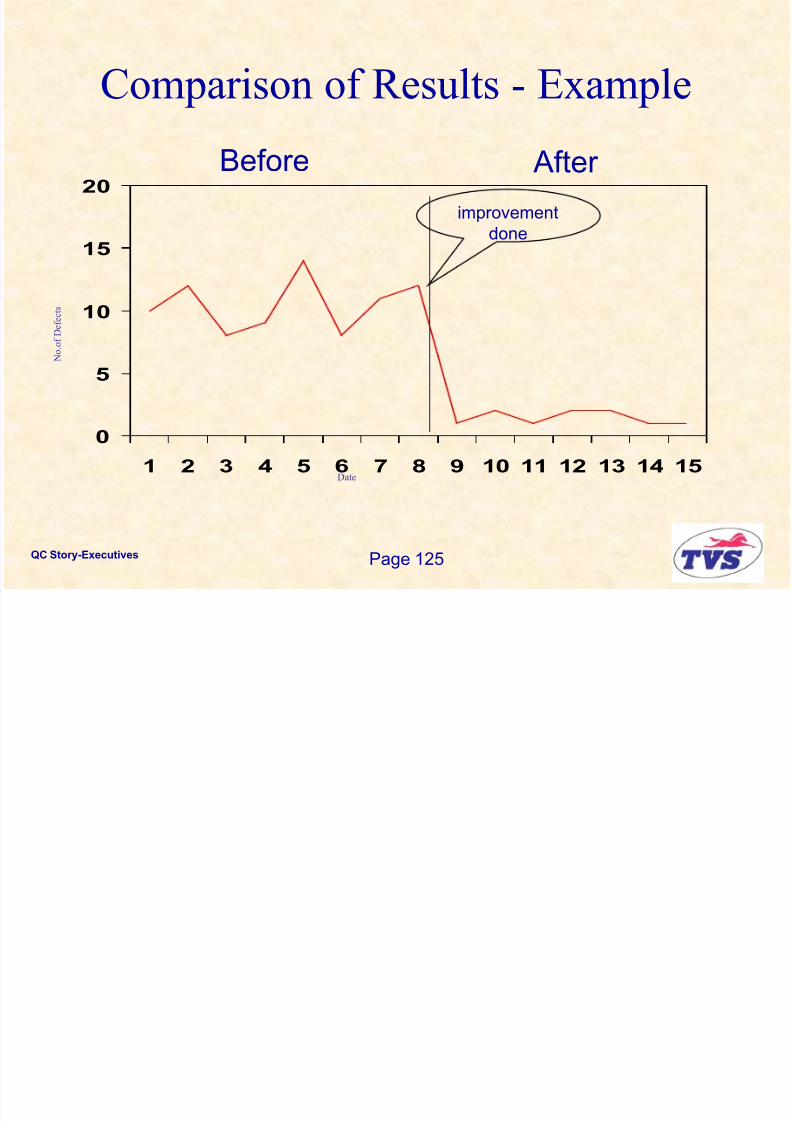
Comparison of Results Example
8/10/2019 QC Story.ppt
http://slidepdf.com/reader/full/qc-storyppt 115/146
QC Story-Executives Page 125
Comparison of Results - Example
0
5
10
15
20
1 2 3 4 5 6 7 8 9 10 11 12 13 14 15
N o . o
f D e f e c t s
Date
improvement
done
Before After
Comparison of Results - Example

8/10/2019 QC Story.ppt
http://slidepdf.com/reader/full/qc-storyppt 116/146
QC Story-Executives Page 126
Comparison of Results - Example
Scrap details
0 0
91
0 0
10
20
30
40
50
60
70
80
90
100
Wk. 8 Wk. 9 Wk. 10
Nos
000
0
Wk. 11 Wk. 13 Wk. 12
Before After
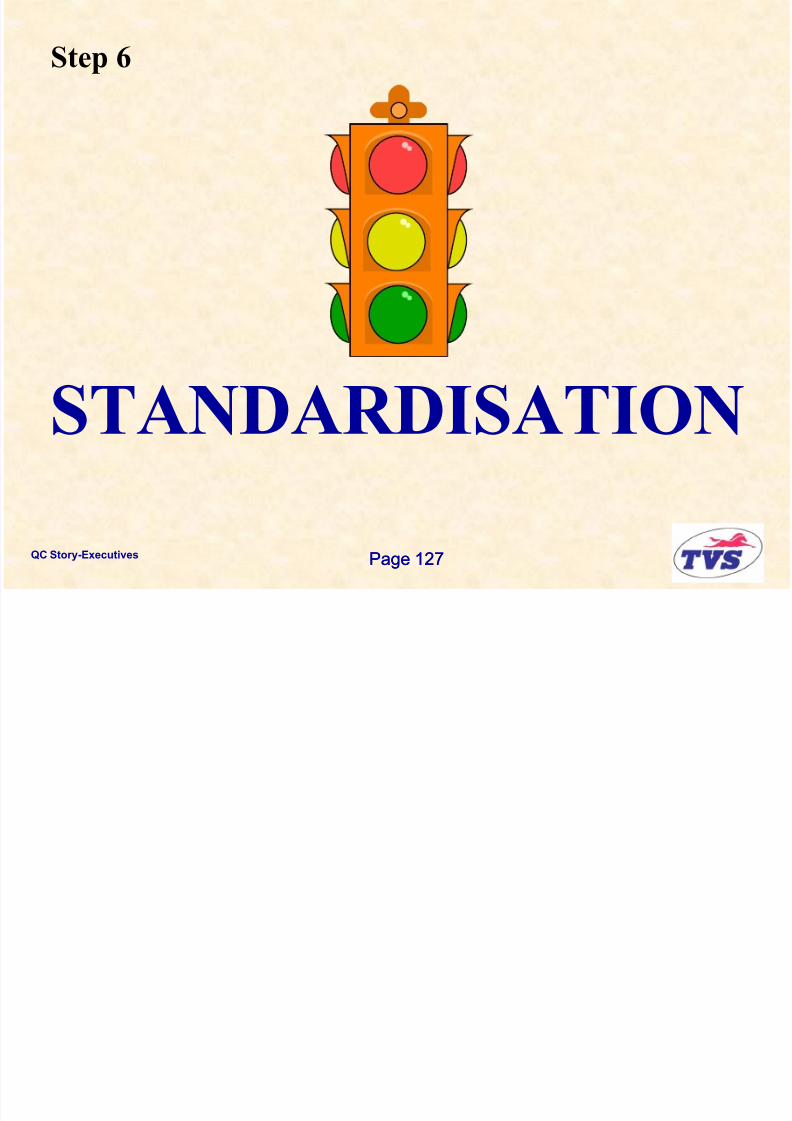
Step 6
8/10/2019 QC Story.ppt
http://slidepdf.com/reader/full/qc-storyppt 117/146
QC Story-Executives Page 127Page 127
STANDARDISATION
What is a Standard?

8/10/2019 QC Story.ppt
http://slidepdf.com/reader/full/qc-storyppt 118/146
QC Story-Executives Page 128Page 128
What is a Standard?
A standard is made up of only those elements
which, when not followed, results in a predictable
defect or waste.
Examples of Standardisation

8/10/2019 QC Story.ppt
http://slidepdf.com/reader/full/qc-storyppt 119/146
QC Story-Executives Page 129
Examples of Standardisation
Road signals, List down a few more
Bulb fittings, ………………………..
Fasteners, ……………………….
Floppies, ………………………..
Credit cards, ………………………..
Toilet symbols etc. …………………………
Benefits
8/10/2019 QC Story.ppt
http://slidepdf.com/reader/full/qc-storyppt 120/146
QC Story-Executives Page 130Page 130
• It helps in doing a specific activity :
- the same way
- by different people
- at all timeswithout leading to any mistake.
• Man dependant to man independent
• Creates a rich knowledge base for future
reference.
Raise change request
G t i t ti f
StandardisationProcess

8/10/2019 QC Story.ppt
http://slidepdf.com/reader/full/qc-storyppt 121/146
QC Story-Executives Page 131
Get registration no. from.
(R&D or PED)
Check results
Get change note no from
(R&D or PED)
Conduct trails thru‟
Experimental job order.
Not OKRelease modified
Drawing
Update all in-house
standards likeLAOS,QCPC,etc..
Implement change
details
OK Reject Change
request
Means of Standardisation

8/10/2019 QC Story.ppt
http://slidepdf.com/reader/full/qc-storyppt 122/146
QC Story-Executives Page 132
Documents Types Responsible Dept.
Component drawing - R&D
Drawings Fixture drawing - Tool Design Dept.
Tool drawing - Engg. Dept. & PED
Standards Inspection stds. - QAD/VQ
Engineering stds. - R&D, PED
Operation stds. - Engg./PED
QCPC - Engg./PED
M f St d di ti

8/10/2019 QC Story.ppt
http://slidepdf.com/reader/full/qc-storyppt 123/146
QC Story-Executives Page 133Page 133
Means of Standardisation :
Documents Responsible Dept.
Process sheet - PED
Manuals - Respective Depts.
Creation and revision of SOPs - TQC
Revision of SAP / intranet directories - SAP
Product information bulletin - Service Dept.

8/10/2019 QC Story.ppt
http://slidepdf.com/reader/full/qc-storyppt 124/146
QC Story-Executives Page 134Page 134
m
M gnu\ d ;! ;l hz ;l h;L
khl y ; ghh;l ;be. ghh;l ;bga h; M gnu\ d ;be. M gnu\ d ;bga h; \ hg; bk\ pd ; bk\ pd ;be.
t pf ;l h; N 208 034 0 f pa h;III o ut d ; 010 g[nuhr ;r p' ; f pa h;\ hg; APEX g[nuhr ;rp' ;bk\ pd ;
be g;uh! ! ;nguhkPl ;l h; ! ;b gr p~ gpnf \ d b r f ;f p' ;t HpK i wbr f ; f z ;l ;nuhy ;
y B ;kpm{l ;nl h f hk;bghbd z ;l ;! ;./XN h;
brf ;br a ;a nt z ;o a g;uhr ! ;ghuhkPl ;l h;

8/10/2019 QC Story.ppt
http://slidepdf.com/reader/full/qc-storyppt 125/146
QC Story-Executives Page 135
be. g;uh! ! ;nguhkPl ;l h; ! ;b gr p~ gpnf \ d b r f ;f p ;t HpK i w~ hf bt d ! bk l
1 f l ;o ' ;! ;gPL 5 mts/min ehg; br l ;o ' ; 1 / WEEK
2 r p! ;l k;gpu\ h; 30 kgf/cm2gpu\ h;, z ;o nf l ;l h;1 / WEEK
3 i A o uhy pf ;M a py ; f phPd ;by t y ; t p\ &t y ; 1 / DAY
4 f l ;o ' ;M apy ; f phPd ;by t y ; t p\ &t y ; 1 / DAY
be. ^ y ;bga h;nr " ;# ;
~ hf bt d !
f z ;l ;nuhy ;
bk l
1 g[nuhr ;r p' ;gpf ;r h; 220 0031
2 ! ;g;i y d ;g[nuhr ; A p! ;l hpf hh;L
be.ghh;l ; f ;t hy po
n uhk Pl l h br ~! ;bgr p~gpnf \ d
nf # ;/
d ! l Ubk z l
b r f ;
~ hf bt d !
f z ;l ;nuhy ;
bk l
1 ! ;g;i y d ;t pl ; j ; 4.035 / 4.064
! ;g;i y d ;t pl ; j ;nf # ;
6080406 1 / br l ;o ' ;EJO
2 nk#h;l ah 20.045 / 20.070
! ;g;i y d ;g;s f ;nf # ;
6100009 1/50Nos.
3 ~ng! ;mt [l ; 0.05 max 1/50Nos.
4 OD ud ;m t [l ; 0.05 max 1/50Nos.
5 Tearing k hh;f ; , U f ;f f ;T l hJ t p\ &t y ; 1/50Nos.
i f b a hg;gk ; nj j p
gphpngh;L K. VijayaBaskar 08/11/01
b r f ;L C.Sa hish 08/11/01
mg;%t ;L
M gnu\ D f ;F K d ;g[ , \ ;a i f ba hg;gk ; nj j p
br f ;br a ;a nt z ;o a i t
1. \ ;l ;M uk; ; ;, br l ;o ' ;br a; t l d ;, ^ ;nr " ;# ;b r a; t l d ;k w;Wk ;b ka d l d d ;! ;f ;F d ; hh;l ;n uhkPl ;l i u br f ; br a ;ant z ;L k;2. mL ; L ; M nu\ d ;f i s x nu e h;br a; h ; K hk;M nu\ d d ;" ;u br f ;" kl ;L k ;b r a; h ;n hJ k ;.
nl l h \ Pl ; g;upf z ;l ;nuhy ;r hh;l ; / nl y p\ Pl ;
Xhpa z ;l ;
v y ;.v.X.v! ;.vz ;:
N2080340/010
b u! ;l ;f ;s hk;g;
M gnu\ d ; bt up~ gpnf \ d ;
nl g;gh;khz ;o hpy ;
607 4493
PULL AND REAR END TO DIN1415
upt p\ d ;
! ;bgrp~gpnf \ d ;
brf ;bra ;a nt z ;o a f hk;bghbd z ;l ;ghuhkPl ;l h;
^ y ;k hw;wnt z ;o a , i l bt s p
b y hnf l ;
~ng! py ;
gd ;r ;r p' ;khh;f ;
, y ;yhky ;
c s ;s j h
! ;gpi y d py ;
! ;bl g;
, y ;yhky ;
c s ;s j h
bu! ;o ' ;~ng! py
gh;, y ;y hky ;
c s ;s j h
f hk ;bghz d ;l ;o y
g[nuhr ;vd ;l h;
M f pwj h
a b
0.04 mm
c
CHECK
VIRESPON-
SIBILITYPARAMETER
SPECIFICATION
/CONTROLINSPECTION
METHOD
PART PARAMETERS
CONTROL ITEMS ( CAUSES ) CONTROLLING METHODS
S T R U C T I O
N
CONTROL ITEM C
FACTOR
(4M)
CHECK
METHOD
CHECK
FREQ
TOOL OF
CONTROL L A O S
N o .
O L
/ F I X T U R E
N o .
PROCESS PARAMETERS
PERSONPARAMETER SPECIFICATION.
QUALITY CONTROL PROCESS CHARTMODEL:
AX100
PART No.:
306 005 0
PART DESCRIPTION:
GEAR PRIMARY DRIVEN
SHOP:
GEAR SHOP
LINE NAME:
GEAR SHOP - SOFT
P E R A T I O N
N o .
OPERATION
DESCN. /
MACHINE No /
MACHINE DESCN.
LAKSHMI AUTO COMPONENTS
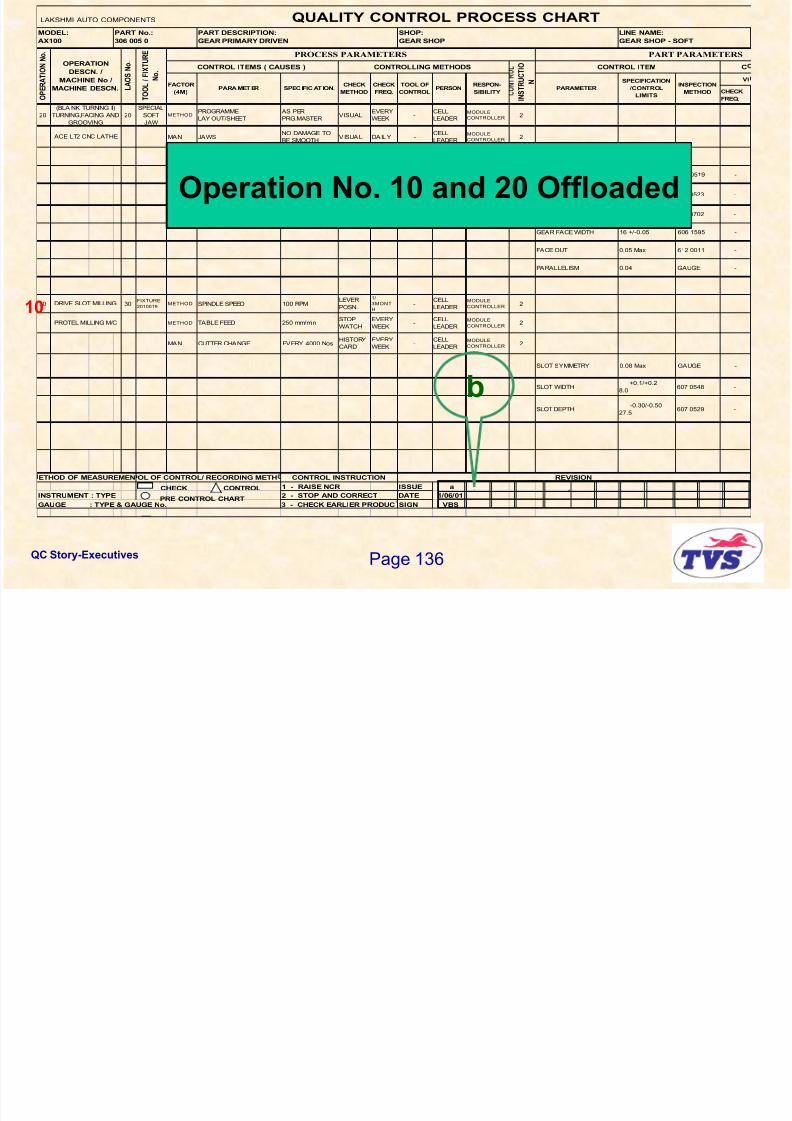
8/10/2019 QC Story.ppt
http://slidepdf.com/reader/full/qc-storyppt 126/146
QC Story-Executives Page 136
CHECK
FREQ.
20 20
SPECIAL
SOFT
JAW
METHODPROGRAMME
LAY OUT/SHEET
AS PER
PRG.MASTERVISUAL
EVERY
WEEK-
CELL
LEADER
MODULE
CONTROLLER2
MAN JAWSNO DAMAGE TO
BE SMOOTHVISUAL DAILY -
CELL
LEADER
MODULE
CONTROLLER2
MACHINECHUCK CLAMPING
PRESSURE 16-18 Kg/Cm2
INDICATO
R
EVERY
WEEK -
CELL
LEADER
MODULE
CONTROLLER 2
TOTAL HEIGHT 33.2/33.4 607 0519 -
THICKNESS -0.1
10.0607 0523 -
GROOVE POSITION -0.20
29.8607 0702 -
GEAR FACE WIDTH 16 +/-0.05 606 1595 -
FACE OUT 0.05 Max 612 0011 -
PARALLELISM 0.04 GAUGE -
30 30FIXTURE
2010019METHOD SPINDLE SPEED 100 RPM
LEVER
POSN.
1/3MONT
H-
CELL
LEADER
MODULE
CONTROLLER2
METHOD TABLE FEED 250 mm/minSTOP
WATCH
EVERY
WEEK-
CELL
LEADER
MODULE
CONTROLLER2
MAN CUTTER CHANGE EVERY 4000 NosHISTORY
CARD
EVERY
WEEK-
CELL
LEADER
MODULE
CONTROLLER2
SLOT SYMMETRY 0.08 Max GAUGE -
SLOT WIDTH +0.1/+0.2
8.0607 0548 -
SLOT DEPTH -0.30/-0.50
27.5607 0529 -
1 - RAISE NCR ISSUE a
INSTRUMENT : TYPE 2 - STOP AND CORRECT DATE 1/06/01
GAUGE : TYPE & GAUGE No. 3 - CHECK EARLIER PRODUC SIGN VBS
PROTEL MILLING M/C
REVISIONCONTROL INSTRUCTIONOL OF CONTROL/ RECORDING METHETHOD OF MEASUREMEN
SIBILITYLIMITS
METHOD
I N S(4M) METHOD FREQ. CONTROL
T O
O P
DRIVE SLOT MILLING
(BLA NK TURNING II)
TURNING,FACING AND
GROOVING
ACE LT2 CNC LATHE
CHECK CONTROL
PRE CONTROL CHART
Operation No. 10 and 20 Offloaded
b
10
Step 7

8/10/2019 QC Story.ppt
http://slidepdf.com/reader/full/qc-storyppt 127/146
QC Story-Executives Page 137Page 137
HORIZONTALDEPLOYMENT
How Do We Do It?
Identify areas where the learning / benefits can be made use of

8/10/2019 QC Story.ppt
http://slidepdf.com/reader/full/qc-storyppt 128/146
QC Story-Executives Page 138Page 138
Identify areas where the learning / benefits can be made use of.
Look for
- Similar parts
- Similar process
- Other machines
- Other cells
- Other departments
- Other plants
- Other models
Implement wherever applicable.

8/10/2019 QC Story.ppt
http://slidepdf.com/reader/full/qc-storyppt 129/146
QC Story-Executives Page 139Page 139
Communicate through:- Exchange of Kaizen sheets
-TQC Council
- QCC/SIT/CFT presentations
- Learning forum
- VCS in unit office
- Discussion database
8/10/2019 QC Story.ppt
http://slidepdf.com/reader/full/qc-storyppt 130/146
QC Story-Executives Page 140
QC Story Methodology - Summary
8/10/2019 QC Story.ppt
http://slidepdf.com/reader/full/qc-storyppt 131/146
QC Story-Executives Page 141
QC Story
is a systematic method to solve
problems.
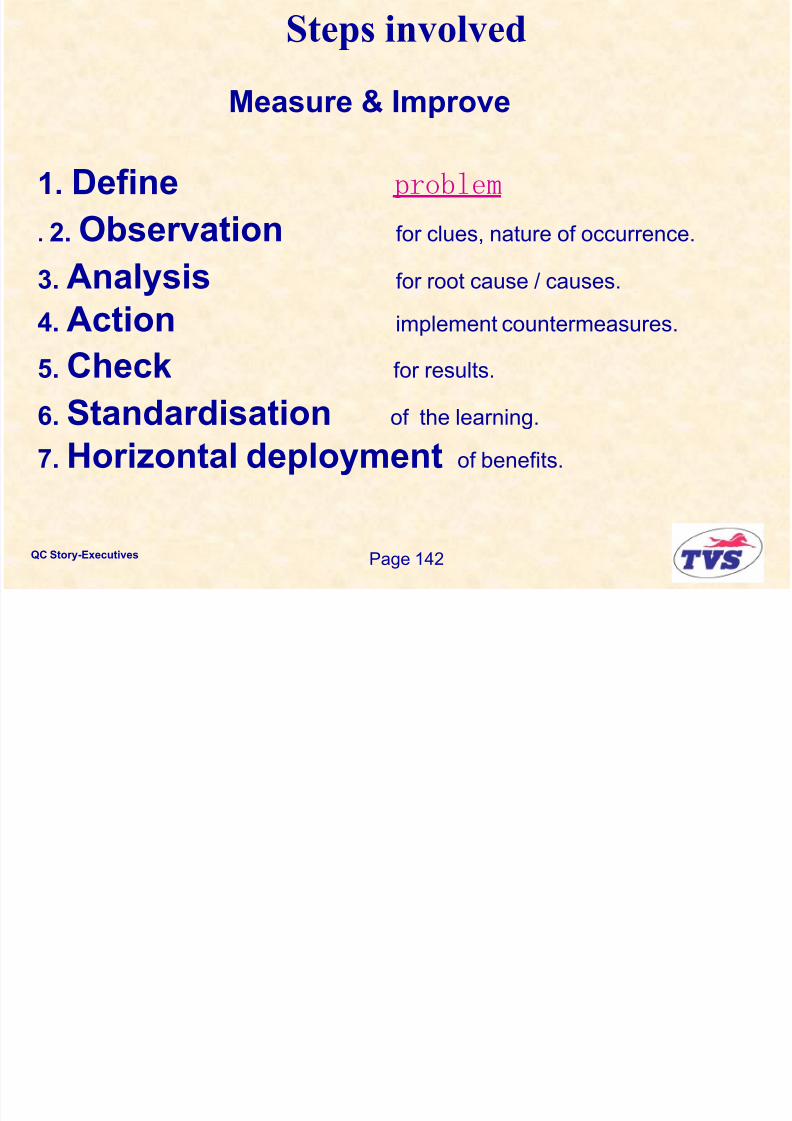
Steps involved
Meas re & Impro e
8/10/2019 QC Story.ppt
http://slidepdf.com/reader/full/qc-storyppt 132/146
QC Story-Executives Page 142
Measure & Improve
1. Define problem
. 2. Observation for clues, nature of occurrence.
3. Analysis for root cause / causes.
4. Action implement countermeasures.
5. Check for results.
6. Standardisation of the learning.
7. Horizontal deployment of benefits.
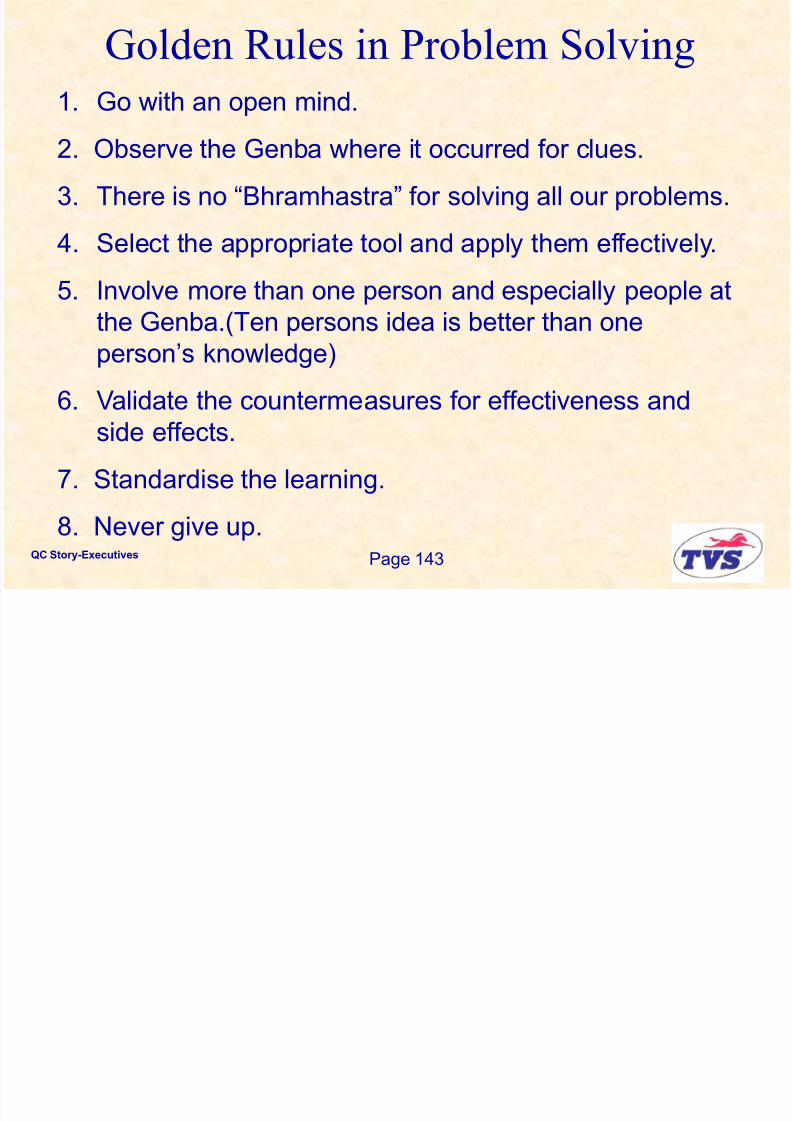
Golden Rules in Problem Solving
1 Go with an open mind
8/10/2019 QC Story.ppt
http://slidepdf.com/reader/full/qc-storyppt 133/146
QC Story-Executives Page 143
1. Go with an open mind.
2. Observe the Genba where it occurred for clues.3. There is no “Bhramhastra” for solving all our problems.
4. Select the appropriate tool and apply them effectively.
5. Involve more than one person and especially people atthe Genba.(Ten persons idea is better than one
person‟s knowledge)
6. Validate the countermeasures for effectiveness and
side effects.
7. Standardise the learning.
8. Never give up.
Guidelines for Use of QC Story

8/10/2019 QC Story.ppt
http://slidepdf.com/reader/full/qc-storyppt 134/146
QC Story-Executives Page 144
„For small problems without much of data analysis,use kaizen sheets.‟
„For other problems, use QC Story
with data analysis.‟
- Prof. Washio
Application of Tools
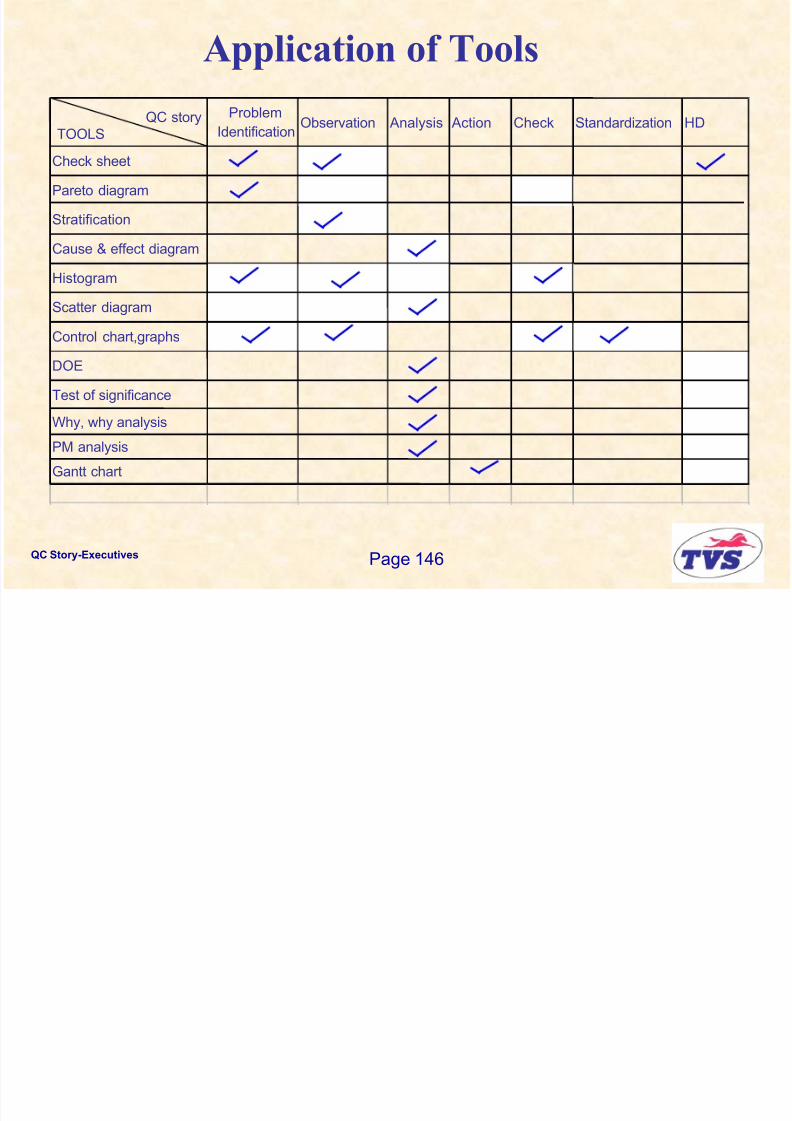
8/10/2019 QC Story.ppt
http://slidepdf.com/reader/full/qc-storyppt 135/146
QC Story-Executives Page 146
Problem
Identification Observation Analysis Action Check Standardization HD
Check sheet
Pareto diagram
Stratification
Cause & effect diagram
Histogram
Scatter diagram
Control chart,graphs
DOE
Test of significance
Why, why analysis
PM analysis
Gantt chart
QC story
TOOLS

8/10/2019 QC Story.ppt
http://slidepdf.com/reader/full/qc-storyppt 136/146
QC Story-Executives Page 147
Best
guess
Investigative
Scientific Less risk
Confirmative
High risk
Medium
risk
Experience
only
Experience
&
Scientific
*
*
*
Approach
Reference Books
8/10/2019 QC Story.ppt
http://slidepdf.com/reader/full/qc-storyppt 137/146
QC Story-Executives Page 148
Reference Books
1.Statistical methods – Hitoshi Kume
2.Four practical revolutions in
Management
- Shoji Shiba and
David Walden
How Will We Sustain It ?
8/10/2019 QC Story.ppt
http://slidepdf.com/reader/full/qc-storyppt 138/146
QC Story-Executives Page 149
• At least two „Champions‟ for each plant.
• Best QC Story award- Quarterly
Nature of Occurrence Vs Action

8/10/2019 QC Story.ppt
http://slidepdf.com/reader/full/qc-storyppt 139/146
QC Story-Executives Page 150
• Instability - Measure & Control
• Off target - Control,Modify or Recreate
• Variation - Modify or Recreate
Nature of Occurrence

8/10/2019 QC Story.ppt
http://slidepdf.com/reader/full/qc-storyppt 140/146
QC Story-Executives Page 151Page 151
Sporadic
Problem
Chronic
Off target
Variation
Instability
Nature of Occurrence20
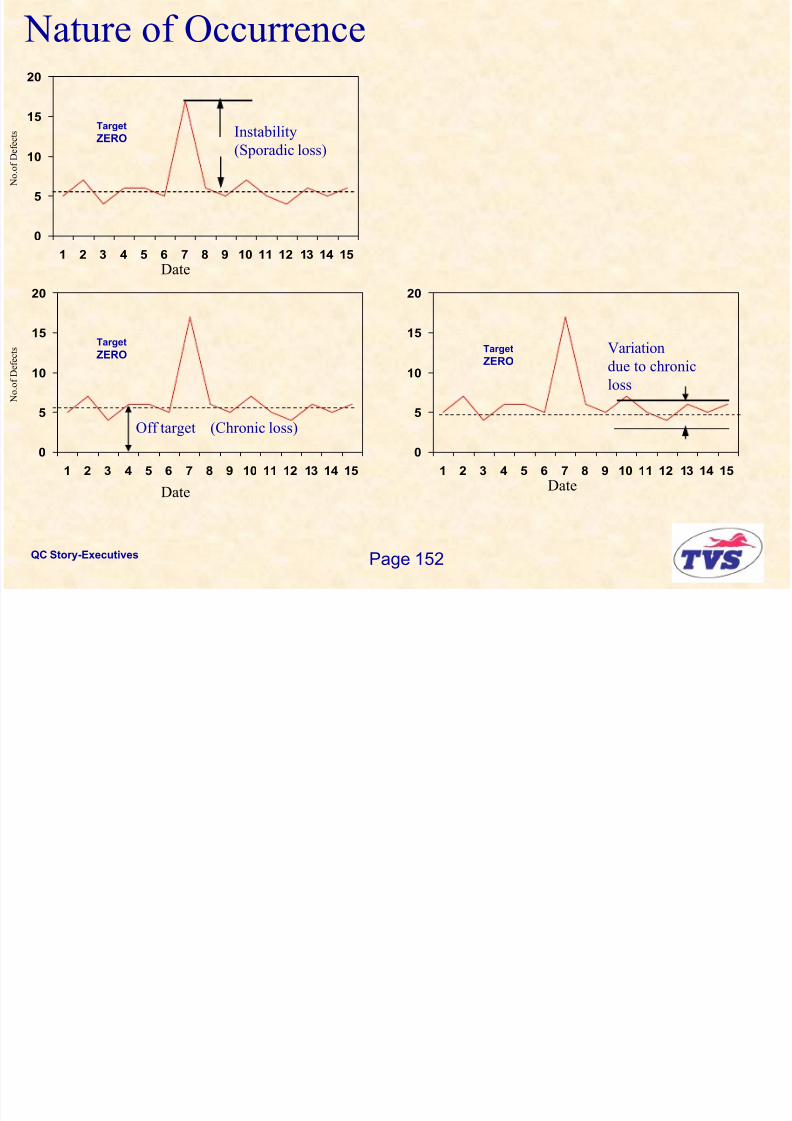
8/10/2019 QC Story.ppt
http://slidepdf.com/reader/full/qc-storyppt 141/146
QC Story-Executives Page 152
0
5
10
15
1 2 3 4 5 6 7 8 9 10 11 12 13 14 15
N o . o
f D e f e c t s Instability
(Sporadic loss)
Date
Target
ZERO
0
5
10
15
20
1 2 3 4 5 6 7 8 9 10 11 12 13 14 15
Variation
due to chronic
loss
Date
Target
ZERO
0
5
10
15
20
1 2 3 4 5 6 7 8 9 10 11 12 13 14 15
N o . o
f D e f e c t s
Date
Off target (Chronic loss)
Target
ZERO

8/10/2019 QC Story.ppt
http://slidepdf.com/reader/full/qc-storyppt 142/146
QC Story-Executives Page 153
Thank you
Improvement
DO improvement
CHECK improvement
results

8/10/2019 QC Story.ppt
http://slidepdf.com/reader/full/qc-storyppt 143/146
QC Story-Executives Page 159
Focus on
vital view
Improvement
activitiesPLAN
improvement
D C
P A
A S
DC
ACT to improve the
standard or its use
CHECK the work
against the standard
Routine work
results
ACT tostandardize to
results or plan for
next
improvement
cycle
Standardisation
Initiateimprovement
Know the STANDARD
DO the work
according to
the standard
7.Reflect on
process and next
problem
6.Standardi
ze solution

8/10/2019 QC Story.ppt
http://slidepdf.com/reader/full/qc-storyppt 144/146
QC Story-Executives Page 160
Sense
problem
1.Select
theme
4.Plan and..
Explore
situation Formulate
problem
2.Collect and
analyze data3.Analyze
causes
Implement
solution
5.Evaluate
effects
Data 1 Data 2 Data 3
Control
Reactive
Proactive
Level of
thought
Level of
experience
2.Problem Exploration
8/10/2019 QC Story.ppt
http://slidepdf.com/reader/full/qc-storyppt 145/146
QC Story-Executives Page 161
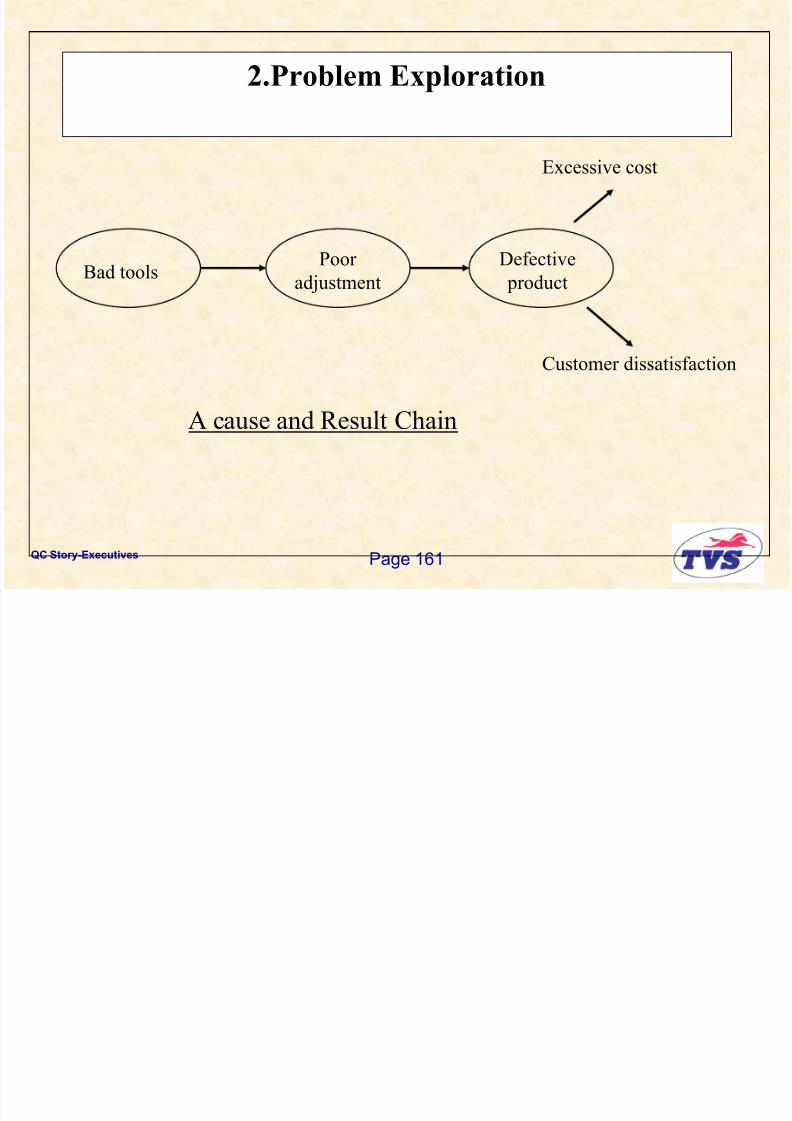
Bad toolsPoor
adjustment
Defective
product
Excessive cost
Customer dissatisfaction
A cause and Result Chain
Stratification : Examples
Petrol tank rejection at leak testing.

8/10/2019 QC Story.ppt
http://slidepdf.com/reader/full/qc-storyppt 146/146
Petrol tank rejection at leak testing.
1. Shift wise2. Operator wise
3. Operation wise
4. Location wise
Cylinder head rejection for blow holes at shop
1. Location of blow holes
2. Identify supplier
3. Blow holes or porosity4 Die no