qis 5 technical specification risk-free interest rates
TRANSCRIPT

Page 1 of 69
QIS 5 Technical SpecificationRisk-free interest rates

Page 2 of 69
Table of contents
Page
1. Executive summary 3
2. Basic risk-free interest rate 6
3. Method for adjusting inter-bank swaps for credit risk 9
4. Assessing the entry point into the yield curve extrapolation 11
5. Liquidity premium 16
Appendix 1: Currency by currency basic risk-free rate curve andproposed cut-off points for entry into extrapolation for QIS 5
18
Appendix 2: Derivation of the EUR, GBP and USD liquidity premiumterm structure
45
Appendix 3: Full calculation of the liquidity premium proxy measurefor EUR, GBP and USD
58
Appendix 4: Liquidity premium for CHF and JPY currencies 60
Appendix 5: Liquidity premium for SEK, DKK and NOK currencies 65
Appendix 6: Liquidity premium for other currencies 68

Page 3 of 69
1. Executive summary
We would like to thank you for the opportunity to specify certain aspects of the risk-freeinterest rate term structure for QIS 5 as set out in your letter of 11 February 2010. A summaryof our proposal is contained at the end of this section. The remainder of the technical paper isset out in four sections to cover the aspects of the risk-free interest rate term structure whichyou sought from the European Insurance CFO Forum and CRO Forum. For the 18currencies highlighted by you, the four sections cover:
Selection of the basic risk-free interest rate term structure.
Method for adjusting inter-bank swaps for credit risk.
Assessing the last liquid point to enter the yield curve extrapolation.
Derivation of the liquidity premium.
In addition, there are supporting appendices which contain further technical details and aspreadsheet containing the basic risk-free interest rate curves adjusted for credit risk(“CFOF_CROF_QIS 5 RFR Curves.xls”).
Given the timescales for QIS 5 and the breadth of currencies in scope, we have had tomake a number of simplifying assumptions which are highlighted in this paper. Thesematters will need to be reconsidered for full Solvency II implementation. We remainfirmly committed to work further on the identified matters in this paper.
In preparing this technical paper, we have been in regular correspondence with the CEIOPSworking party that is preparing the risk-free interest rate extrapolation tool for QIS 5. The aimof the correspondence is to ensure that the distinct parts of the risk-free interest rate termstructure can be combined in an effective manner. We understand that for QIS 5 purposes,the CEIOPS working party is proposing to consider two extrapolation methods – a linearmethod and a Smith-Wilson functional form. We recommend that other extrapolationmethods are evaluated for full Solvency II implementation including, for example, the Nelson-Siegel method developed and extensively tested by Barrie & Hibbert and the methodarticulated in a recent CEA publication1. In particular, the period of grading and methodfor setting the ultimate long term forward rate will need to be examined in detail for fullSolvency II implementation.
We additional draw the following matters to your attention:
We have considered a range of methods, primarily qualitative, to assess the last liquidmarket data point for entry into the yield curve extrapolation. These methods haveallowed conclusions to be reached for QIS 5 purposes. For full Solvency IIimplementation, further analysis is required to develop quantitative measures ofassessing swap curve liquidity. Consequently, the entry points in this analysis mayneed to be revised for full Solvency II implementation.
The term that the liquidity premium can be earned, especially in EUR, GBP and USD,requires further investigation for full Solvency II implementation. Specifically, to considerthe full range of investments available to earn the liquidity premium in financial marketsnot just the subset of potentially more liquid assets used in the reference portfolio ofassets to derive the liquidity premium estimate.
We have agreed with the CEIOPS working party on extrapolation a list of secondarycurrencies for which we will provide market data to set the QIS 5 risk-free interest rateterm structure on a best endeavours basis following 31 March 2010.
1http://www.cea.eu/uploads/DocumentsLibrary/documents/1265043387_cea-paper-on-macroeconomic-
extrapolation-examples.pdf

Page 4 of 69
We propose that the risk-free interest rate term structure is based on the swap curveadjusted for credit risk and a liquidity premium (dependent on features of the liability).The implications of the adjustment to the swap curve will need to be considered in thecalibration of stochastic asset models for the valuation of options and guarantees,specifically the pricing of equity options and swaptions.
As outlined in our letter of 24 February 2010, we propose a reduction of 10bps to theinter-bank swap curve to reflect the impact of credit risk. However, given the magnitudeof the reduction, we question whether it is required.
Though not directly within the scope of this paper, we reiterate (as also noted inour letter of 24 February) that the illiquidity premium applies to all liabilities and notjust immediate annuities in payment at the point of Solvency II implementation.
We are happy to discuss any of the matters set out in this paper with you. In the meantimewe will continue to support the European Commission in its development of the Level 2implementing measures and QIS 5.
We would like to take this opportunity to thank our members and Barrie & Hibbert whocontributed to the preparation of this paper.

Page 5 of 69
Summary of QIS5 proposals
(1) (2) (3) (4) (4) (5)Currency Abbreviation Inter-bank swap curve
(Bloomberg ticker)Adjustment forcredit risk (bps)
Entry point toextrapolation
Liquidity premium31/12/2008
Liquidity premium31/12/2009
Liquidity premiumcut-off point
European Euro EUR EUSATT 10 30 179 53 15UK Pound Sterling GBP BPSWTT 10 50 221 82 30US Dollar USD USSWTT 10 30 231 71 30Japanese Yen JPY JYSWTT 10 20 42 15 10Swiss Franc CHF SFSWTT 10 15 32 9 10Swedish Krona SEK SKSWTT 10 10 84 54 10Danish Krone DKK EUSATT, GDBR10,
GDGB10yr10 30 62 40 15
Norwegian Krone NOK NKSWTT 10 10 70 20 10Czech Koruna CZK CKSWTT 10 15 63 19 15Polish Zloty PLN PZSWTT 10 15 63 19 15Hungarian Forint HUF HFSWTT 10 15 63 19 10Romanian Lei RON RNSWTT 10 10 0 0 Not applicableBulgarian Lev BGN BLSATT 10 10 0 0 Not applicableTurkish Lira TRY TYSWTTV3 10 10 0 0 Not applicableIceland Krona ISK IKSWTT 10 5 0 0 Not applicableEstonian Kroon EKK
EUSATT 10 30 63 19 15Latvian Lats LVLLithuanian Litas LTL
Notes:(1) Inter-bank swap curves are proposed as the basic risk-free interest rate term structure for each currency. For several currencies which are pegged to the EUR (notably, DKK, EKK, LVL) theEUR inter-bank swap curve is proposed with adjustments, where required, as detailed in Section 2.(2) The 10bps deduction to remove credit risk in the inter-bank swap curve is applied as a parallel shift to the simply compounded forward rates.(3) The same entry point into the yield curve extrapolation is proposed for 31 December 2008 and 2009.(4) & (5) The liquidity premium is applied additively to the basic forward swap curve up to the cut-off point where the addition applied to the forward rate is reduced linearly to zero over the next 5years.

Page 6 of 69
2. Basic risk-free interest rate
Principles for the selection of the basic risk-free interest rate
In selecting the basic risk-free interest rate for QIS 5 purposes we have used, as our guidingframework, the principles provided in our letter to you dated 24 February. In summary:
1. For each currency where swaps exist and are sufficiently liquid and reliable, thebasic risk-free interest rate applicable to the valuation of a liability should be basedon the swap curve appropriately adjusted to remove credit risk.
2. When using swaps where the deposit period on the floating rate leg is notovernight an adjustment for long-term through-the-cycle credit risk appropriate tothe deposit period should be made.
3. Where swaps do not exist or are not sufficiently liquid and reliable from a certainpoint, the basic risk-free interest rate applicable to the valuation of a liability shouldhave reference to the government curve in that currency.
4. For government curves where the government is of credit quality lower than AAAan adjustment for long-term through-the-cycle credit risk should be made.
2
5. In all cases, the basic risk-free interest rates should follow a smooth progression.
Proposed basic risk-free interest rate for QIS 5
We have examined the 18 currencies as requested in your letter dated 11 February. For QIS
5 purposes, we propose to use the local currency inter-bank swap curves as the basic risk-
free interest rate for 14 of the required currencies. The exceptions are the Danish Krone,
Estonian Kroon, Latvian Lats and Lithuanian Litas which are considered separately below.
Local currency inter-bank swap curves
The inter-bank swap curves are based on rates collected from Bloomberg. We have
used what we believe to be the most commonly used convention in terms of
compounding and term of the underlying deposit. Where available we use Bloomberg
tickers with the convention XXSWTT (where XX represents the economy and TT represents
the term of the swap). For example, BPSW10 is the British Pound 10 year swap rate. This
ticker returns a rate with semi-annual settlement and compounding versus 6 month Sterling
LIBOR as is the market convention.
It is possible to obtain alternative definitions of rates using different tickers. For example,
BPSA gives an annually settled rate and alternative floating rates can be specified by the
addition of an extension to the ticker, so BPSW10V3 gives the sterling swap rate versus 3
month LIBOR. However, these alternate specifications are generally not the most common
method for expressing forward rates in a given market of the most liquid instruments.
2It is noted, though Principle 4 does not apply for the EUR, if it were the case then the government yield curve based on AAA rated government bonds
would be used.
Page 7 of 69
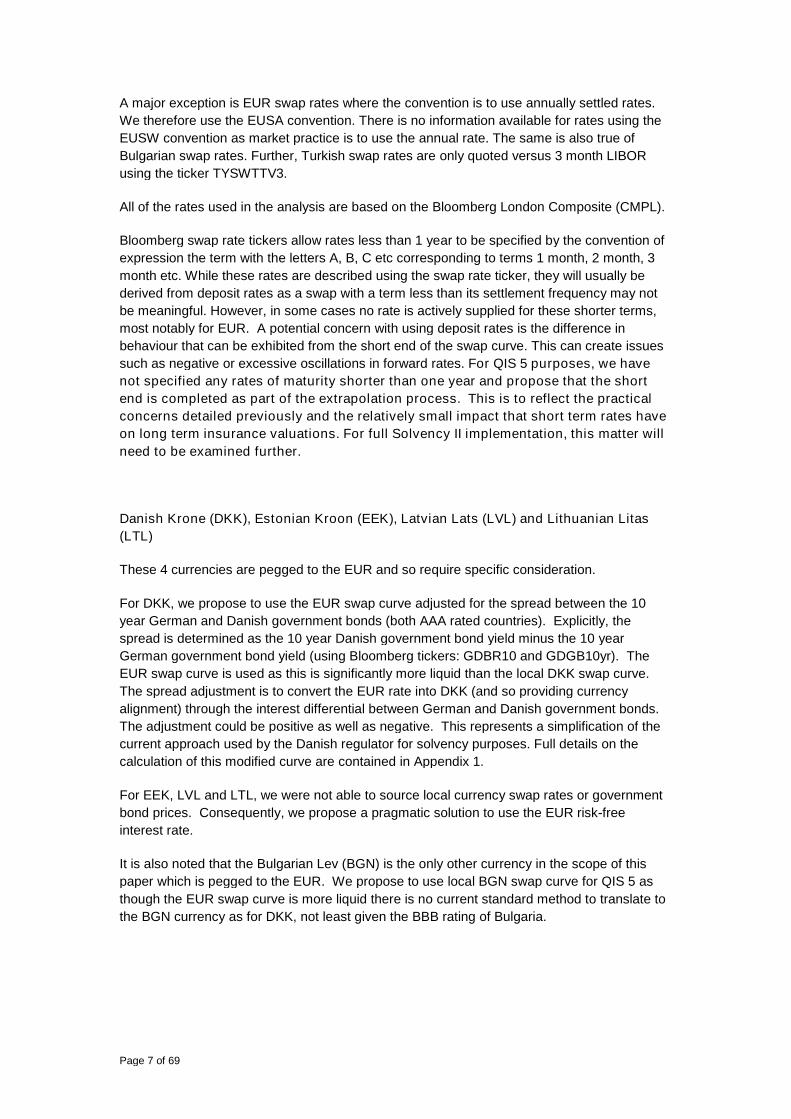
A major exception is EUR swap rates where the convention is to use annually settled rates.
We therefore use the EUSA convention. There is no information available for rates using the
EUSW convention as market practice is to use the annual rate. The same is also true of
Bulgarian swap rates. Further, Turkish swap rates are only quoted versus 3 month LIBOR
using the ticker TYSWTTV3.
All of the rates used in the analysis are based on the Bloomberg London Composite (CMPL).
Bloomberg swap rate tickers allow rates less than 1 year to be specified by the convention of
expression the term with the letters A, B, C etc corresponding to terms 1 month, 2 month, 3
month etc. While these rates are described using the swap rate ticker, they will usually be
derived from deposit rates as a swap with a term less than its settlement frequency may not
be meaningful. However, in some cases no rate is actively supplied for these shorter terms,
most notably for EUR. A potential concern with using deposit rates is the difference in
behaviour that can be exhibited from the short end of the swap curve. This can create issues
such as negative or excessive oscillations in forward rates. For QIS 5 purposes, we have
not specified any rates of maturity shorter than one year and propose that the short
end is completed as part of the extrapolation process. This is to reflect the practical
concerns detailed previously and the relatively small impact that short term rates have
on long term insurance valuations. For full Solvency II implementation, this matter will
need to be examined further.
Danish Krone (DKK), Estonian Kroon (EEK), Latvian Lats (LVL) and Lithuanian Litas
(LTL)
These 4 currencies are pegged to the EUR and so require specific consideration.
For DKK, we propose to use the EUR swap curve adjusted for the spread between the 10
year German and Danish government bonds (both AAA rated countries). Explicitly, the
spread is determined as the 10 year Danish government bond yield minus the 10 year
German government bond yield (using Bloomberg tickers: GDBR10 and GDGB10yr). The
EUR swap curve is used as this is significantly more liquid than the local DKK swap curve.
The spread adjustment is to convert the EUR rate into DKK (and so providing currency
alignment) through the interest differential between German and Danish government bonds.
The adjustment could be positive as well as negative. This represents a simplification of the
current approach used by the Danish regulator for solvency purposes. Full details on the
calculation of this modified curve are contained in Appendix 1.
For EEK, LVL and LTL, we were not able to source local currency swap rates or government
bond prices. Consequently, we propose a pragmatic solution to use the EUR risk-free
interest rate.
It is also noted that the Bulgarian Lev (BGN) is the only other currency in the scope of this
paper which is pegged to the EUR. We propose to use local BGN swap curve for QIS 5 as
though the EUR swap curve is more liquid there is no current standard method to translate to
the BGN currency as for DKK, not least given the BBB rating of Bulgaria.

Page 8 of 69
Proposals for QIS 5
For QIS 5, we propose the following inter-bank swap curves for each currency as sourcedfrom Bloomberg. The only exception is DKK where the EUR inter-bank swap curve isadjusted as detailed previously.
Currency Bloomberg ticker
EUR EUSATTGBP BPSWTTUSD USSWTTJPY JYSWTTCHF SFSWTTSEK SKSWTTDKK EUSATT, GDBR10, GDGB10yrNOK NKSWTTCZK CKSWTTPLN PZSWTTHUF HFSWTTRON RNSWTTBGN BLSATTTRY TYSWTTV3ISK IKSWTT
The only other country not considered in the European Economic Area is Liechtenstein.However, as the Swiss Franc is the local currency this risk-free interest rate including theassociated liquidity premium would be applied.
Associated to this paper is a spreadsheet (“CFOF_CROF_QIS 5 RFR Curves.xls”)which contains fitted curves (adjusted for credit risk) for each currency based on theBloomberg data using the Barrie & Hibbert standard yield curve fitting methodology.The method uses a regression spline with smoothing constraints. This methodproduces rates that are very close to but not exactly equal to market rates. The averageabsolute error is generally less than 1 basis point3. It is also noted that the fitspresented use all available data and do not apply the proposed cut-off points for entryinto extrapolation for QIS 5 considered in Section 4.
3See: http://www.barrhibb.com/knowledge_base/article/a_framework_for_estimating_and_extrapolating_the_term_structure_of_interest/

Page 9 of 69
3. Method for adjusting inter-bank swaps for credit risk
Background
Features such as collateralisation arrangements and the fact that the notional amount isnever at risk means the credit risk in a swap contract is negligible. However, for swapcontracts based on 3 or 6 month inter-bank rates there can be credit risk associated withearning the reference floating rate, as there is some risk associated with depositing thenotional amount with an institution for the 3 to 6 month period. An overnight index swap iswhere the period of depositing the notional amount with an institution is overnight so limitingthe credit risk in the floating rate. However, at this time the inter-bank swap curve representsthe most liquid and therefore reliable source of data. We therefore focus on the deposit risk ininter-bank swaps.
Data analysis
The difference between unsecured inter-bank lending and secured repurchase agreement(repos) rates is commonly used by academic researchers4 as a measure of the impact of
credit risk in swap rates. Although credit risk is the main contributor to the observeddifference, other elements such as differing levels of liquidity in both markets would alsoimpact.
We sourced daily data for 3 month repos, inter-bank rates and overnight index swap ratesgoing back 10 years for EUR, GBP, USD and JPY, where available. The data for EUR, GBPand USD was sourced from DataStream and the JPY is from Bloomberg. Detail of the dataused is shown below:
Repo Rate Inter-bank Rate
EURO REPO BENCHMARK 3MTH (EUR:FBE) – MIDDLE RATE EURO INTERBANK 3 MTH (LDN:BBA) – OFFERED RATE
UK REPO BENCHMARK 3 MTH (LDN:BBA) – MIDDLE RATE US INTERBANK 3 MTH (LDN:BBA) – OFFERED RATE
US BID SIDE REPO 12:00 TERM 3 MTH – MIDDLE RATE US INTERBANK 3 MTH (LDN:BBA) – OFFERED RATE
JPY 3m Repo (JYRPC Curncy) JPY 3m TIBOR (TI0003M Index)
We have analysed the data in a number of ways looking at the mean and median of thedifference between inter-bank and repo rates. The results are shown below:
Basis Points EUR GBP USD JPY
Inc Crisis Pre Crisis Inc Crisis Pre Crisis Inc Crisis Pre Crisis Inc Crisis Pre Crisis
Mean 21 7 31 18 31 15 14 8
Median 7 6 16 15 16 15 9 8
We also show an analysis for 6 month rates although the required data is available for fewercurrencies:
Medianspread (bps)
EUR GBP
6 month 3 monthCrisis
6 month 3 month
Inc Crisis 8 7 17 16
Pre Crisis 8 6 16 15
The analysis highlights that the impact of using 6 month rather than 3 month deposit period isaround 1 basis point.
4See for example: (i) Li (2004) Decomposing the Default and Liquidity Components of Interest Rate Swap Spreads; (ii) Feldhutter & Lando (2004)
Decomposing Swap Spreads; and (iii) Liu, Longstaff & Mandell (2000) The Market Price of Credit Risk.

Page 10 of 69
Further, the quotation conventions for inter-bank rates (offer) and repo rates (mid) mayexaggerate the spread slightly – making it a conservative estimate. Although in normal marketconditions we would expect half of the bid-offer spread to be relatively small. We illustrate thisin the table below using GBP data based on 3 month deposit period. We have not been ableto source this data for other currencies.
Medianspread (bps)
GBP
Offer - mid Mid - mid
Inc Crisis 16 11
Pre Crisis 15 10
Conclusion
Given the relatively short history, the mean value is heavily influenced by the recent financialmarket crisis. Moreover, especially during the crisis other elements than credit risk might havedriven the increase, so the difference can be interpreted as an upper boundary for the creditrisk adjustment. In general, where we make long-term estimates these are based on verylong-term behaviour of the economic variable. This is much more stable over time and lessinfluenced by recent events. The median value is a better representation of a long runhistorical average or through-the-cycle-view at this time.
Considering the difference between inter-bank and repo rates for EUR, GBP, USD and JPYover the last ten years suggests a long-term through-the-cycle estimate for the credit riskpriced into inter-bank rates is around 10 bps. However, given the magnitude of the reductionfor credit risk, we question whether it is required.
For the other currencies, it is not been possible to perform an analysis comparing securedand unsecured inter-bank lending due to data constraints. We believe that a practical, simpleand pragmatic method for dealing with this matter is necessary, especially when you considerthe range of currencies needing to be covered. Further, this is consistent with the fact that itis the major international banks that trade in all these instruments.
We propose that the inter-bank swap rates for QIS 5 purposes are reduced by 10 bpsfor all currencies to reflect the impact of credit risk. The 10bps deduction for credit riskis applied as a parallel shift to the simply compounded forward rates. Further analysisis required for full Solvency II implementation.
Associated to this paper is a spreadsheet (“CFOF_CROF_QIS 5 RFR Curves.xls”)which as noted in Section 2 contains the fitted curves, which are adjusted by 10bps forcredit risk.

Page 11 of 69
4. Assessing the entry point into the yield curve extrapolation
Methodology
While it may be possible to see quotes and access data for very long swap contacts, often the
markets in these rates will not be deep or liquid. It is a requirement to assess the last
observed liquid market data point which will serve as an entry point into the extrapolated part
of the curve. Establishing which point on the curve is the last liquid point is not an easy task
as data on volume of trades is not directly available by duration and the liquidity of long term
swap rates may vary under different market conditions.
We have considered a range of methods to assess the last liquid market data point.
These methods have allowed conclusions to be reached for QIS 5 purposes. However,
given the importance of the selection and the key interaction with the extrapolation
method and assumptions, further analysis is required for full Solvency II
implementation.
1. Current market practice
In order to gain some insight into the liquidity of long term swap rates, we have performed two
surveys. Firstly, a CRO Forum member’s views5 survey on the last liquidity point used
internally by those firms at end December 2009 and secondly, a survey of investment banks
conducted by Barrie & Hibbert.
The Barrie & Hibbert survey was based on the responses of three investment banks who
were asked to provide their views of market conditions at time of survey (early 2010) and also
general feedback on conditions as at end 2008. Responses ranged from explicit statements
of a last liquid point through to general comments on swap market dynamics. The survey
provides an insight, but the results should be treated with caution given the small sample size.
One message to come out of the feedback is that there is a relatively strong link between the
last liquid swap and the longest available government bond for a sizeable transaction. This is
because banks will often hedge a swap transaction by buying a matching government bond.
Under benign market conditions, banks may be prepared to trade at longer terms as they can
“warehouse” the swap until they find an offsetting transaction or they may hedge in another
currency and accept some basis risk. However, both of these approaches are capital
intensive and given the pressures on banks capital positions at the end of 2008 they would
have been less likely to enter into such transactions.
2. Quantitative measures
Traditional quantitative techniques of assessing swap liquidity, such as bid-offer spreads and
transaction volumes can provide insight and reliable independent measures. However, these
are currently not available from standard sources of financial data. For example, transactions
volume data is not sufficiently granular to provide meaningful results. A bottom up data
collection exercise to assess these measures may add further insight.
5There are currently 20 member firms of the CRO Forum

Page 12 of 69
Data providers, in particular Bloomberg, allow you to drill down to see quotes from individual
contributors. Two possible measures can be considered from this dataset, firstly, a
contributor count and secondly, the quote dispersion. Perhaps counter-intuitively the
dispersion generally decreases as you move to longer terms, which calls this measure into
question.
The contributor count measure shows the number of institutions that contribute quotes for
each rate and appears more reliable. A lower number of contributors for each point may
represent a reduction in liquidity. As liquidity is a relative measure we looked at the
percentage of total contributors rather than looking at the absolute number of contributors.
The analysis presented is based on a snap-shot of contributions as at end December 2009.
We have also looked at the contributor analysis as at end 2008 and end 2007. In general we
have seen an increase in the number of contributions over time. One point of note is that the
number of quotes on long term instruments did not seem to be seriously affected by the
financial crisis at the end of 2008. However, it is worth noting that these are only quotes of
mid-prices and may not represent a price that a bank would actually trade. An example of the
contributor analysis over time for the EUR swap market is shown below. The results are
similar for other currencies.
Number of contributions to EUR swap rate (end 2007-end 2009)
3. Impact of stress market conditions
In stress market conditions the number of liquid market data points may be reduced. For
example, reduced supply from banks due to change in risk appetite or increased demand by
market participants due to hedging activities. In particular, we have considered the following
conditions as potential evidence of reduced liquidity at the longer swap tenors:
Excess volatility in forward curve: Volatility in longer tenor forward rates is significantly
in excess of the level in “normal” market conditions. Further, the longer tenor volatility is
disproportionately higher than the volatility of shorter tenor forward rates (where in normal
market circumstances a lower volatility would be expected).
Forward rate curve becomes more downward sloping: It can already be observed that
forward curves are slightly downward sloping for longer tenors due to convexity, but in
stress markets the downward slope can become more extreme as participants charge a
negative term premium for the longest tenors.
0
5
10
15
20
25
30
35
40
45
1 2 3 4 5 6 7 8 9 10 11 12 15 20 25 30 35 40 45 50
Swap Rate Term
EUR 09 EUR 08 EUR 07

Page 13 of 69
Forward rates drop significantly below the ultimate long-term forward level: One
would expect that longer tenor forward rates do not significantly deviate from their long-
term level (unless limited market data is available) and a significant drop versus the
ultimate long-term level could be a sign of reduced liquidity of such market data points.
Swap rates drop significantly below longest maturity government bonds of high
credit rating: When swap rates drop significantly below AAA government bonds in a
currency, this may indicate stressed market conditions, as long term government bonds
are used to hedge long term swaps.

Page 14 of 69
Proposed swap curve entry point into the yield curve extrapolation forQIS5
Appendix 1 displays the results of the surveys and quantitative methods detailed in the
previous section. For simplicity, we propose a single set of entry points for both 2008
and 2009. The entry points are based on the level of liquidity observed at end 2008.
There is general market consensus that there was less liquidity in the swap market at
end 2008 than 2009. As we propose the 2008 entry points for 2009 in QIS 5, it will be
important to recognise the information that may exist in market prices beyond the
entry points in the extrapolation technique. This is consistent with the principles
developed by the CEIOPS working party on the risk-free interest rate term structure 6
(notably: “Techniques should be developed regarding the consideration to be given to
observed market data points situated in the extrapolated party of the interest curve”). We
caution that this would be particularly true for EUR, JPY, CHF and CZK.
Proposed entry points into yield curve extrapolation for QIS 5
Currency Entry point for extrapolation
EUR 30GBP 50USD 30JPY 20CHF 15SEK 10DKK 30NOK 10CZK 15PLN 15HUF 15BGN 10RON 10TRY 10ISK 5
The entry points were selected based on the range of estimates provided from the surveys
and quantitative methods. A brief explanation for each currency is contained in Appendix 1,
including where potential liquidity may exist beyond these points.
We would expect that the entry points can change over time depending on market
conditions and how different markets develop. For full Solvency II implementation,
further analysis is required to develop the quantitative measures of assessing swap
curve liquidity (for example, the interaction with the availability of bond prices) and the
interaction of the entry points with the extrapolation method and assumptions.
6“Task Force in the Illiquidity Premium – Report – 1 March 2010”

Page 15 of 69
Importance of entry point into the yield curve extrapolation in stressed marketconditions
The extrapolation of market data has an important role in avoiding too much pro-cyclicality in
the Solvency II framework. A solvency regime based on market values, already has built in
mechanisms that in times of stressed market conditions there is an extra tendency to de-risk
and therefore put extra pressure on financial markets, which could worsen again the solvency
on a market value basis. The nature of, in particular, life insurance companies is such that in
general their liabilities have longer durations than the available assets in the markets. This
results in supply-demand pressure on interest rates for longer tenors. In a crisis situation
where both insurance companies and pension funds try to de-risk such pressure can result in
unbalanced markets. A clear example of this is the period end-2008 to mid-2009 in the EUR
interest rate market, where interest rate forward rates dropped significantly. Similar issues
also arose in the equity implied volatility market with forward volatilities increasing
significantly. The role of extrapolation in such situations is to reduce the reliance on data
points where the market is significantly unbalanced and promote stability in liability valuation
to avoid that additional pro-cyclical effects worsen the solvency position of insurance
companies.
How can this be achieved?
Firstly, the fact that the long-term unconditional forward rate is set in a stable manner and is
not impacted by economic cycles is a good basis condition. However, extrapolation starts
from the last observed liquid market data point. So any instability in such point is extended to
longer tenors. The mechanism that provides stability is that in a crisis situation the transition
point of where market data is used and where extrapolation starts is moved to an earlier point.
This is also in line with the extrapolation principles agreed in the CEIOPS working party on
the risk-free interest rate term structure as long-tenor swap points in such market conditions
would be assessed as being illiquid. So while in liquid times the EUR swap market would be
considered somewhat liquid up to a long term, in a crisis such as end-2008 this would reduce
to 30 years. The stable long-term forward rate will then ensure enough stability in the
remaining tenors.
How can such an unbalance be observed?
We refer to the methodology outlined previously. Furthermore, the significant drop in long-
term swap rates below traded AAA government bonds in times of crisis could also be seen as
an indication of demand-supply mismatch.

Page 16 of 69
5. Liquidity premium
Principles over the derivation of the liquidity premium
In setting the liquidity premium for the range of currencies in scope of the calibration, weapply the relevant principles from the CEIOPS working party report (“Task Force on theIlliquidity Premium – Report” – 1 March 2010). In summary:
The risk-free reference rate applicable to the valuation of a liability should be thesum of a basic risk-free reference rate and a liquidity premium depending on thenature of the liability.
The liquidity premium should be independent of the investment strategy adoptedby the company.
The liquidity premium applicable to a liability should not exceed the extra returnwhich can be earned by the insurer by holding illiquid assets free of credit risk,available in the financial markets and matching the cash flows of the liability.
The liquidity premium should be calculated and published by a central EUinstitution with the same frequency and according to the same procedures as thebasic risk-free interest rate.
The liquidity premium should be assessed and quantified by reliable methodsbased on objective market data from the relevant financial markets and consistentwith solvency valuation methods.
No liquidity premium should be applied to liabilities in the absence of acorresponding liquidity premium evidenced in the valuation of assets.
Proposed liquidity premium term structure for QIS 5
The proposed liquidity premium term structure for QIS 5 purposes in each currency relative tothe basic risk-free interest rates in Appendix 1 is details below.
Liquidity premium term structure in per annum bps relative to swaps less 10bps:
Currency Liquidity Premium (bps) Liquidity premium
cut-off (Term)31/12/08 31/12/09
EUR 179 53 15
GBP 221 82 30
USD 231 71 30
CHF 42 15 10
JPY 32 9 10
SEK 84 54 10
DKK 62 40 15
NOK 70 20 10
CZK 63 19 15
PLN 63 19 15
HUF 63 19 10
RON 0 0 Not applicable
BGN 0 0 Not applicable
TRY 0 0 Not applicable

Page 17 of 69
ISK 0 0 Not applicable
EEK, LTL, LVL 63 19 15
The liquidity premium is applied additively to the basic forward swap curve up to thecut-off point where the addition applied to the forward rate is reduced linearly to zeroover the next 5 years.
For all currencies, the cut-off point for the liquidity premium is less than or equal to theentry point into the basic risk-free yield curve extrapolation.
The following appendices are included to support the assessment:
Appendix 2 – Derivation of the EUR, GBP and USD liquidity premium term structure Appendix 3 – Full calculation of the liquidity premium proxy measure for EUR, GBP and
USD Appendix 4 – Liquidity premium for YEN and CHF currencies Appendix 5 – Liquidity premium for SEK, DKK and NOK currencies Appendix 6 – Liquidity premium for other currencies
In determining the liquidity premium for QIS 5 purposes a number of simplifications have beenmade due to data limitations and time constraints in preparing the calibration. For fullSolvency II implementation, the following aspects require further investigation as aminimum:
Method to determine the credit spread measure used in the proxy formula for allcurrencies, where applied.
Direct measures of liquidity premium outside of EUR, GBP and USD.
Indices used as the reference portfolio of assets outside of EUR, GBP and USD.
The term that liquidity premium can be earned considering the full range ofinvestments available to earn the liquidity premium in financial markets for eachcurrency not just the subset of potentially more liquid assets used in the referenceportfolio of assets to derive the liquidity premium estimate.
We will continue to refine our analysis in these areas.

Page 18 of 69
Appendix 1:
Currency by currency basic risk-free rate curve and proposedcut-off points for entry into extrapolation for QIS 5
Notes on presented data
The fitted curves shown in the following currency by currency assessment use the Barrie
& Hibbert standard yield curve fitting methodology. The method uses a regression spline
with smoothing constraints. This method produces swap rates that are very close to but
not exactly equal to market rates quoted by Bloomberg. The average absolute error is
generally less than 1 basis point7.
The fits presented use all available data and do not apply the proposed cut-off points for
entry into extrapolation for QIS 5. We show spot and forward rates for swaps and
government bonds as at end December 2008 and 2009. In addition, the “Swap + Adj”
curves show the swap rates adjusted for through-the-cycle credit risk. In this case we
have used the QIS 5 proposal of a minus10bps parallel shift to the simply compounded
forward swap rates.
All contributor counts are sourced from Bloomberg.
7See: http://www.barrhibb.com/documents/downloads/A_Framework_for_Estimating_and_Extrapolating_the_Term_Structure.pdf

Page 19 of 69
European Euro – EUR
Swap Tickers: EUSATT = Annual Settlement vs. 6 month EURIBOR
Swap Curve Liquidity:
Maximum bondterm available
Maximum swapterm available
Maximum swapterm (CRO Forum)
Maximum swapterm (Bank survey)
45.3 50 50 50
Contributor Count (Snap-shot as at end December 2009):
0%
25%
50%
75%
100%
1 2 3 4 5 6 7 8 9 10 11 12 15 20 25 30 35 40 45 50
Pro
po
rtio
no
fC
on
trib
uto
rs
Swap Rate Term
EUR (100% = 38 Contributors)
Fitted Curves:
Page 20 of 69
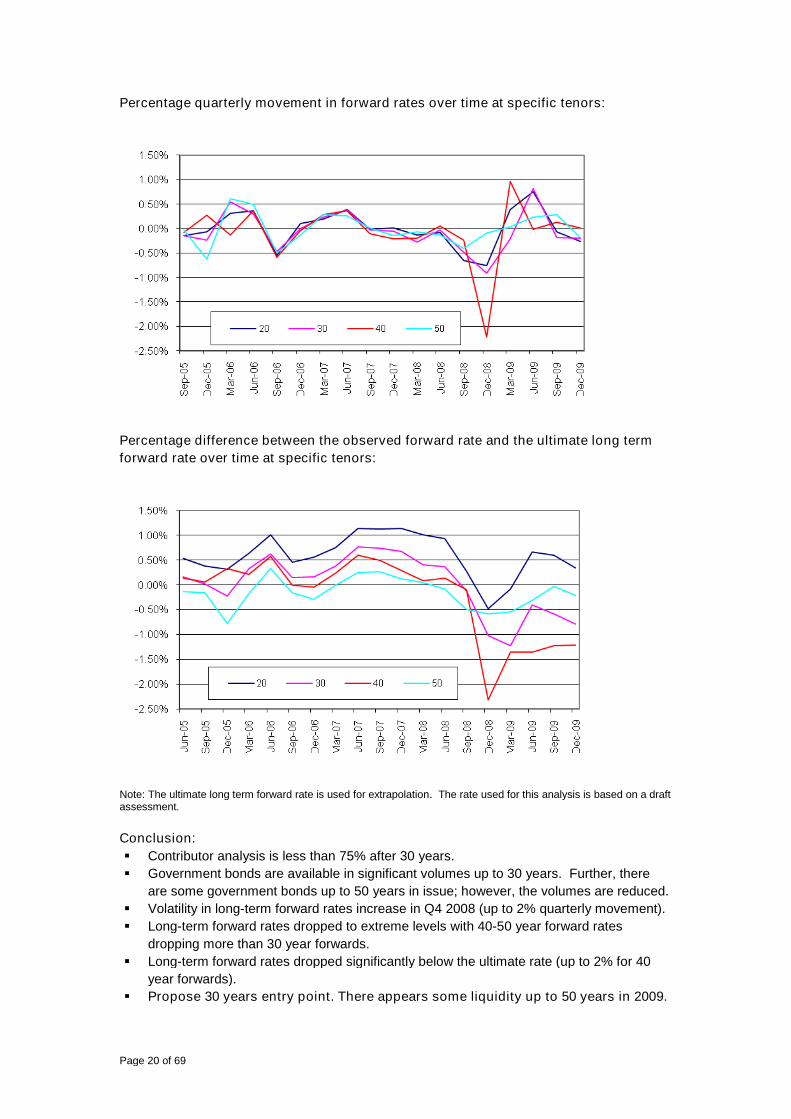
Percentage quarterly movement in forward rates over time at specific tenors:
Percentage difference between the observed forward rate and the ultimate long term
forward rate over time at specific tenors:
Note: The ultimate long term forward rate is used for extrapolation. The rate used for this analysis is based on a draftassessment.
Conclusion:
Contributor analysis is less than 75% after 30 years.
Government bonds are available in significant volumes up to 30 years. Further, there
are some government bonds up to 50 years in issue; however, the volumes are reduced.
Volatility in long-term forward rates increase in Q4 2008 (up to 2% quarterly movement).
Long-term forward rates dropped to extreme levels with 40-50 year forward rates
dropping more than 30 year forwards.
Long-term forward rates dropped significantly below the ultimate rate (up to 2% for 40
year forwards).
Propose 30 years entry point. There appears some liquidity up to 50 years in 2009.

Page 21 of 69
UK Pound Sterling - GBP
Swap Tickers: BPSWTT = Semi-Annual settlement & compounding vs. 6 month Sterling
LIBOR
Swap Curve Liquidity:
Maximum bondterm available
Maximum swapterm available
Maximum swapterm (CRO Forum)
Maximum swapterm (Bank survey)
49.8 50 50 50
Contributor Count (Snap-shot as at end December 2009):
0%
25%
50%
75%
100%
1 2 3 4 5 6 7 8 9 10 11 12 15 20 25 30 35 40 45 50
Pro
po
rtio
no
fC
on
trib
uto
rs
Swap Rate Term
GBP (100% = 31 Contributors)
Fitted Curves:

Page 22 of 69
Percentage quarterly movement in forward rates over time at specific tenors:
Percentage difference between the observed forward rate and the ultimate long term
forward rate over time at specific tenors:
Note: The ultimate long term forward rate is used for extrapolation. The rate used for this analysis is based on a
draft assessment.
Conclusion:
Contributor analysis is above 75% up to 50 years.
Volatility in long-term forward rates increased in Q4 2008 (up to 1% quarterly movement).
However, no significant reduction in longer tenor forward rates and these remain relatively
close to the ultimate forward rate.
Propose 50 years entry point.

Page 23 of 69
US Dollar – USD
Swap Tickers: USSWTT = Semi-Annual fixed rate vs. 3 month USD LIBOR
Swap Curve Liquidity:
Maximum bondterm available
Maximum swapterm available
Maximum swapterm (CRO Forum)
Maximum swapterm (Bank survey)
29.9 50 50 30
Contributor Count (Snap-shot as at end December 2009):
0%
25%
50%
75%
100%
1 2 3 4 5 6 7 8 9 10 11 12 15 20 25 30 35 40 50
Pro
po
rtio
no
fC
on
trib
uto
rs
Swap Rate Term
USD (100% = 43 Contributors)
Fitted Curves:

Page 24 of 69
Percentage quarterly movement in forward rates over time at specific tenors:
Percentage difference between the observed forward rate and the ultimate long term
forward rate over time at specific tenors:
Note: The ultimate long term forward rate is used for extrapolation. The rate used for this analysis is based on a
draft assessment.
Conclusion:
Contributor analysis is less than 75% after 30 years.
Volatility in long-term forward rates increased in Q4 2008 (up to 2% quarterly
movement).
Long-term forward rates dropped to extreme levels with 40-50 year forward rates
dropping more than 30 year forwards.
Long-term forward rates dropped significantly below the ultimate rate (up to 1.5% for 50
year forwards).
Propose 30 years entry point. There appears some liquidity up to 50 years in 2009.

Page 25 of 69
Japanese Yen - JPY
Swap Tickers: JYSWTT = Semi-annual fixed rate vs. 6 month Yen LIBOR
Swap Curve Liquidity:
Maximum bondterm available
Maximum swapterm available
Maximum swapterm (CRO Forum)
Maximum swapterm (Bank survey)
26.7 50 50 40
Contributor Count (Snap-shot as at end December 2009):
Fitted Curves:
Page 26 of 69
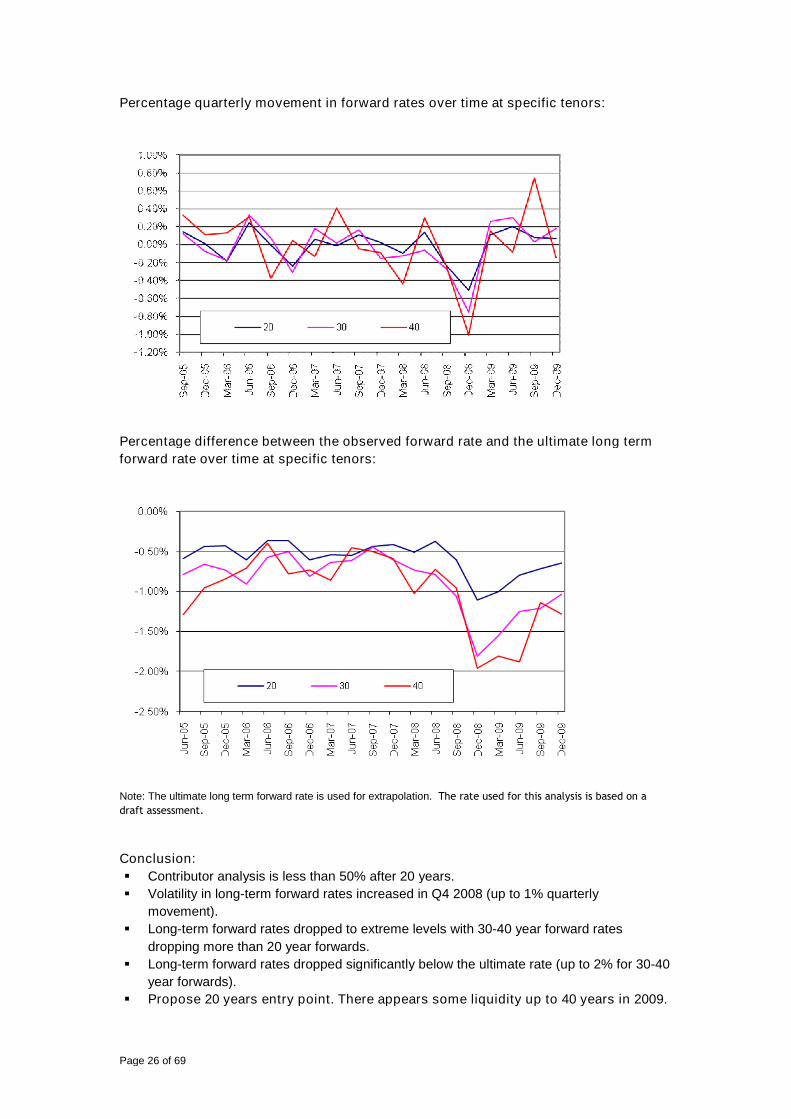
Percentage quarterly movement in forward rates over time at specific tenors:
Percentage difference between the observed forward rate and the ultimate long term
forward rate over time at specific tenors:
Note: The ultimate long term forward rate is used for extrapolation. The rate used for this analysis is based on a
draft assessment.
Conclusion:
Contributor analysis is less than 50% after 20 years.
Volatility in long-term forward rates increased in Q4 2008 (up to 1% quarterly
movement).
Long-term forward rates dropped to extreme levels with 30-40 year forward rates
dropping more than 20 year forwards.
Long-term forward rates dropped significantly below the ultimate rate (up to 2% for 30-40
year forwards).
Propose 20 years entry point. There appears some liquidity up to 40 years in 2009.

Page 27 of 69
Swiss Franc – CHFSwap Tickers: SFSWTT = Annual Settlement & Compounding vs. 6 month Swiss LIBOR
Swap Curve Liquidity:
Maximum bondterm available
Maximum swapterm available
Maximum swapterm (CRO Forum)
Maximum swapterm (Bank survey)
39 50 30 20
Contributor Count (Snap-shot as at end December 2009):
0%
25%
50%
75%
100%
1 2 3 4 5 6 7 8 9 10 11 12 15 20 25 30 35 40 45 50
Pro
po
rtio
no
fC
on
trib
uto
rs
Swap Rate Term
CHF (100% = 33 Contributors)
Fitted Curves:

Page 28 of 69
Percentage quarterly movement in forward rates over time at specific tenors:
Percentage difference between the observed forward rate and the ultimate long term
forward rate over time at specific tenors:
Note: The ultimate long term forward rate is used for extrapolation. The rate used for this analysis is based on a
draft assessment.
Conclusion:
Contributor analysis is less than 75% after 30 years.
Volatility in long-term forward rates increased in Q4 2008 (up to 2% quarterly
movement).
Long-term forward rates dropped to extreme levels with 20-30 year forward rates
dropping more than 15 year forwards.
Long-term forward rates dropped significantly below the ultimate rate (in excess of 1.5%
for 20-30 year forwards).
Propose 15 years entry point. There appears some liquidity up to 30 years in 2009.
Page 29 of 69
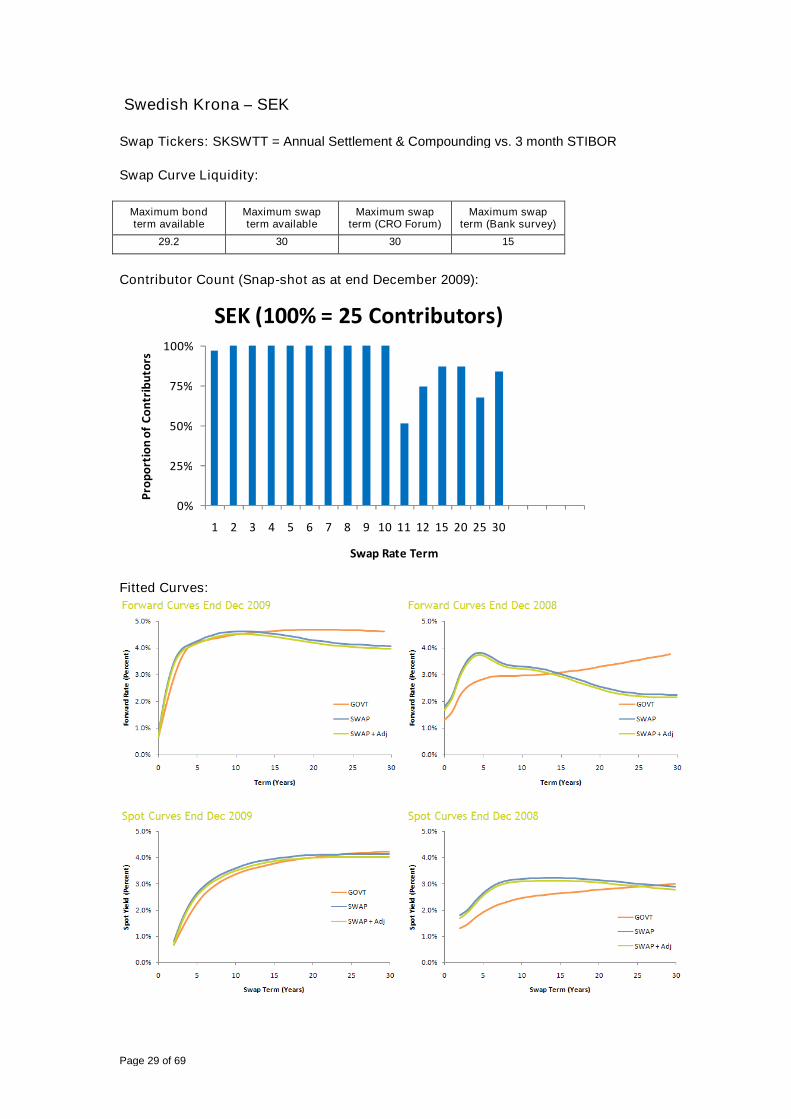
Swedish Krona – SEK
Swap Tickers: SKSWTT = Annual Settlement & Compounding vs. 3 month STIBOR
Swap Curve Liquidity:
Maximum bondterm available
Maximum swapterm available
Maximum swapterm (CRO Forum)
Maximum swapterm (Bank survey)
29.2 30 30 15
Contributor Count (Snap-shot as at end December 2009):
0%
25%
50%
75%
100%
1 2 3 4 5 6 7 8 9 10 11 12 15 20 25 30
Pro
po
rtio
no
fC
on
trib
uto
rs
Swap Rate Term
SEK (100% = 25 Contributors)
Fitted Curves:

Page 30 of 69
Percentage quarterly movement in forward rates over time at specific tenors:
Percentage difference between the observed forward rate and the ultimate long term
forward rate over time at specific tenors:
Note: The ultimate long term forward rate is used for extrapolation. The rate used for this analysis is based on a
draft assessment.
Conclusion:
Contributor analysis does not provide a clear conclusion.
Volatility in long-term forward rates increased in Q4 2008 (up to 1.5% quarterly
movement).
Long-term forward rates dropped to extreme levels with 20-30 year forward rates
dropping in excess of the 15 year reduction.
Long-term forward rates dropped significantly below the ultimate rate (in excess of 1%
for 25-30 year forwards).
Propose 10 years entry point reflecting factors examined and understanding of
market participants. There appears some liquidity up to 30 years in 2009.

Page 31 of 69
Danish Krone – DKK
Swap tickers: EUSATT = Annual Settlement vs. 6 month EURIBOR
DKSWTT = Annual Settlement and Compounding vs. 6 month CIBOR
Government bond tickers:
GDBR10 = Generic German Government bond index – bid side yields
GDGB10YR = Generic Danish Government bond index – bid side yields
Note: The Bloomberg Danish yield index did not update for a period of around 6 months from
July 2008 while the German index did in standard manner. This could introduce a distortion
to the adjustment. To avoid this we have used the equivalent Data Stream index for the end
December 2008 calculation.
Fitted Curves:
The following charts show the proposed risk-free interest rate curve based on the adjustedEUR swap curve. It is noted that the adjustment is made to the EUR market swap rates priorto the fitting of the regression spline. In addition, the DKK swap curve (adjusted for creditrisk) and the DKK government curves are presented for reference.
Conclusion:
Propose the adjusted EUR swap curve with a 30 years entry point which is
consistent with the EUR curve.

Page 32 of 69
Norwegian Krone - NOK
Swap Tickers: NKSWTT = Annual fixed rate vs. 6 month NIBOR
Swap Curve Liquidity:
Maximum bondterm available
Maximum swapterm available
Maximum swapterm (CRO Forum)
Maximum swapterm (Bank survey)
9.4 30 30 15
Contributor Count (Snap-shot as at end December 2009):
0%
25%
50%
75%
100%
1 2 3 4 5 6 7 8 9 10 12 15 20 25 30
Pro
po
rtio
no
fC
on
trib
uto
rs
Swap Rate Term
NOK (100% = 28 Contributors)
Fitted Curves:

Page 33 of 69
Percentage quarterly movement in forward rates over time at specific tenors:
Percentage difference between the observed forward rate and the ultimate long term
forward rate over time at specific tenors:
Note: The ultimate long term forward rate is used for extrapolation. The rate used for this analysis is based on a
draft assessment.
Conclusion:
Contributor analysis is less than 75% after 10 years.
Significant drop in 15 year forward rate at end 2008 compared to 10 year forward.
Propose 10 years entry point. There appears some liquidity up to 15 years in 2009.
Page 34 of 69
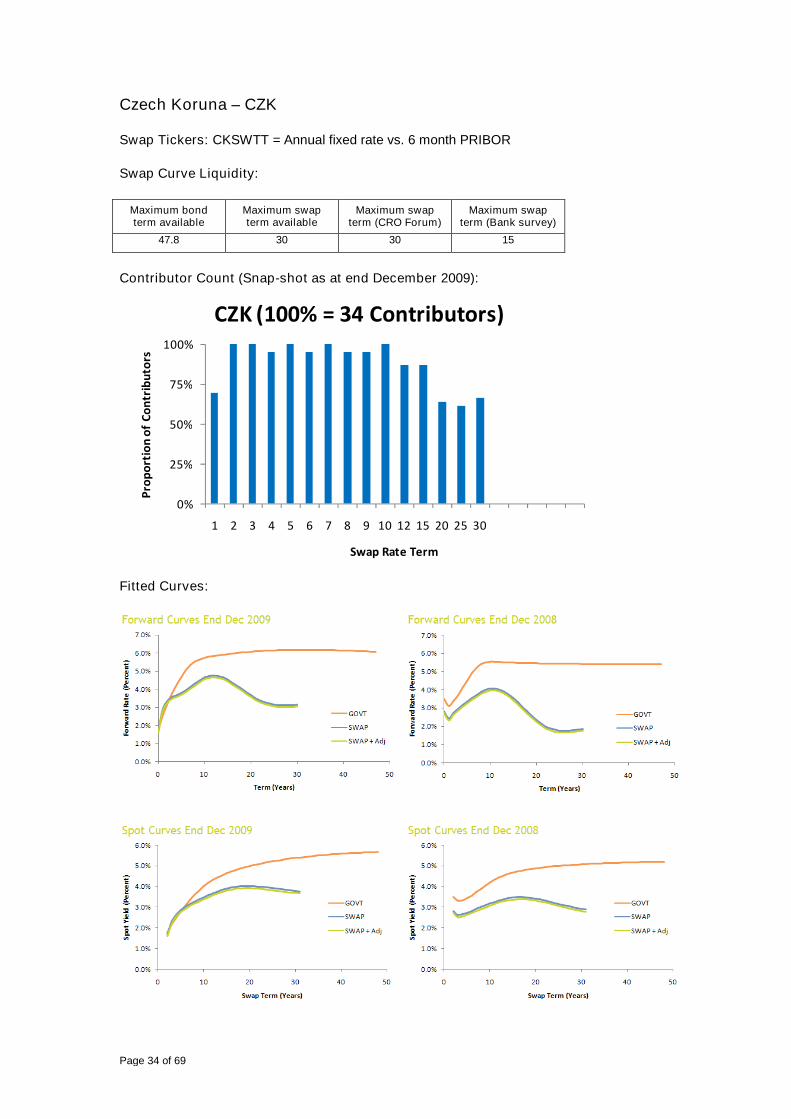
Czech Koruna – CZK
Swap Tickers: CKSWTT = Annual fixed rate vs. 6 month PRIBOR
Swap Curve Liquidity:
Maximum bondterm available
Maximum swapterm available
Maximum swapterm (CRO Forum)
Maximum swapterm (Bank survey)
47.8 30 30 15
Contributor Count (Snap-shot as at end December 2009):
0%
25%
50%
75%
100%
1 2 3 4 5 6 7 8 9 10 12 15 20 25 30
Pro
po
rtio
no
fC
on
trib
uto
rs
Swap Rate Term
CZK (100% = 34 Contributors)
Fitted Curves:

Page 35 of 69
Percentage quarterly movement in forward rates over time at specific tenors:
Percentage difference between the observed forward rate and the ultimate long term
forward rate over time at specific tenors:
Note: The ultimate long term forward rate is used for extrapolation. The rate used for this analysis is based on a
draft assessment.
Conclusion:
Contributor analysis is less than 75% after 15 years, consistent with investment bank
survey.
Volatility in long-term forward rates increased in Q4 2008 (up to 2% quarterly
movement).
Long-term forward rates dropped to extreme levels with 20-30 year forward rates
dropping significant more than the 15 year forward.
Long-term forward rates dropped significantly below the ultimate rate (in excess of 1%
for 20-30 year forwards).
Propose 15 years entry point. There appears some liquidity up to 30 years in 2009.

Page 36 of 69
Polish Zloty – PLN
Swap Tickers: PZSWTT = Annual Settlement & Compounding vs. 6 month WIBOR
Swap Curve Liquidity:
Maximum bondterm available
Maximum swapterm available
Maximum swapterm (CRO Forum)
Maximum swapterm (Bank survey)
27.3 20 20 15
Contributor Count (Snap-shot as at end December 2009):
0%
25%
50%
75%
100%
1 2 3 4 5 6 7 8 9 10 12 15 20 25 30
Pro
po
rtio
no
fC
on
trib
uto
rs
Swap Rate Term
PLN (100% = 34 Contributors)
Fitted Curves:

Page 37 of 69
Percentage quarterly movement in forward rates over time at specific tenors:
Percentage difference between the observed forward rate and the ultimate long term
forward rate over time at specific tenors:
Note: The ultimate long term forward rate is used for extrapolation. The rate used for this analysis is based on a
draft assessment.
Conclusion:
Contributor analysis is less than 75% after 20 years
Volatility in long-term forward rates increased in Q4 2008 (up to 2% quarterly
movement).
Long-term forward rates dropped to extreme levels with 20 year forward rates dropping
significant more than the 15 year forward.
Propose 15 years entry point. There appears some liquidity up to 20 years in 2009.

Page 38 of 69
Hungarian Forint – HUF
Swap Tickers: HFSWTT = Annual Settlement & Compounding vs. 6 month BUBOR
Swap Curve Liquidity:
Maximum bondterm available
Maximum swapterm available
Maximum swapterm (CRO Forum)
Maximum swapterm (Bank survey)
13.9 20 20 15
Contributor Count (Snap-shot as at end December 2009):
0%
25%
50%
75%
100%
1 2 3 4 5 6 7 8 9 10 12 15 20 25 30
Pro
po
rtio
no
fC
on
trib
uto
rs
Swap Rate Term
HUF (100% = 32 Contributors)
Fitted Curves:

Page 39 of 69
Percentage quarterly movement in forward rates over time at specific tenors:
Percentage difference between the observed forward rate and the ultimate long term
forward rate over time at specific tenors:
Note: The ultimate long term forward rate is used for extrapolation. The rate used for this analysis is based on a
draft assessment.
Conclusion:
Contributor analysis is less than 75% after 15 years, consistent with investment bank
survey
Volatility in long-term forward rates increased in Q4 2008 (up to 1.5% quarterly
movement).
Long-term forward rates dropped to extreme levels with 20 year forward rates dropping
significant more than the 15 year forward.
Propose 15 years entry point. There appears some liquidity up to 20 years in 2009.

Page 40 of 69
Romanian Lei – RON
Swap Tickers: RNSWTT = Semi-annual Settlement vs. 6 month BUBOR
Swap Curve Liquidity:
Maximum bondterm available
Maximum swapterm available
Maximum swapterm (CRO Forum)
Maximum swapterm (Bank survey)
10.5 20 20 0
Contributor Count (Snap-shot as at end December 2009):
0%
25%
50%
75%
100%
1 2 3 4 5 6 7 8 9 10 12 15 20
Pro
po
rtio
no
fC
on
trib
uto
rs
Swap Rate Term
RON (100% = 26 Contributors)
Fitted Curves:

Page 41 of 69
Percentage quarterly movement in forward rates over time at specific tenors:
Percentage difference between the observed forward rate and the ultimate long term
forward rate over time at specific tenors:
Note: The ultimate long term forward rate is used for extrapolation. The rate used for this analysis is based on a
draft assessment.
Conclusion:
Movements of 5 and 10 year forwards were in line in Q4 2008 and were not extreme.
Propose 10 years entry point which is consistent across 2008 and 2009.

Page 42 of 69
Bulgarian Lev – BGNSwap Tickers: BLSATT
Swap Curve Liquidity:
Maximum bondterm available
Maximum swapterm available
Maximum swapterm (CRO Forum)
Maximum swapterm (Bank survey)
9.1 10 10 0
Contributor Count (Snap-shot as at end December 2009):
0%
25%
50%
75%
100%
1 2 3 4 5 6 7 8 9 10
Pro
po
rtio
no
fC
on
trib
uto
rs
Swap Rate Term
BGN (100% = 4 Contributors)
Fitted Curves:
There is insufficient data in BGN to prepare the forward rate analysis as for other currencies.
Conclusion: Propose 10 years entry point which is consistent across 2008 and 2009.

Page 43 of 69
Turkish Lira – TRY
Swap Tickers: TYSWTTV3
Swap Curve Liquidity:
Maximum bondterm available
Maximum swapterm available
Maximum swapterm (CRO Forum)
Maximum swapterm (Bank survey)
4.4 10 10 0
Contributor Count (Snap-shot as at end December 2009):
0%
25%
50%
75%
100%
1 2 3 4 5 6 7 8 9 10 20
Pro
po
rtio
no
fC
on
trib
uto
rs
Swap Rate Term
TRY (100% = 25 Contributors)
Fitted Curves:
There is insufficient data in TRY to prepare the forward rate analysis as for other currencies.
Conclusion: Propose 10 years entry point which is consistent across 2008 and 2009.

Page 44 of 69
Iceland Krona – ISK
Swap Tickers: IKSWTT = Annual Settlement vs. 3 month REIBOR
Swap Curve Liquidity:
Maximum bondterm available
Maximum swapterm available
Maximum swapterm (CRO Forum)
Maximum swapterm (Bank survey)
15.3 5 5 0
Contributor Count (Snap-shot as at end December 2009):
0%
25%
50%
75%
100%
1 2 3 4 5 7
Pro
po
rtio
no
fC
on
trib
uto
rs
Swap Rate Term
ISK
NOTE: there were no activecontributions for any rates at end Dec2008 or end Dec 2009
Analysis shown is for last quotedprices which may be stale as they donot correspond to a particular date.
Fitted Curves:
There is insufficient data in ISK to prepare the forward rate analysis as for other currencies.
Further, no government curves could be readily evidenced in 2008 or 2009.
Conclusion: Propose 5 years entry point which is consistent across 2008 and 2009.

Page 45 of 69
Estonian Kroon – EEK, Latvian Lats – LVL and Lithuanian Litas – LTL
For these three currencies, no active swap rates or government bond prices could be reliably
sourced. As these currencies are pegged to the EUR, the proposal is to use the EUR risk-free
curve without adjustment.
Page 46 of 69
Appendix 2:
Derivation of the EUR, GBP and USD liquidity premium termstructure
Methods of calculating the liquidity premium for assets
There are three primary methods currently used by practitioners to estimate the liquiditypremium in these financial markets:
• CDS Negative-basis Method. The method compares the spread on a corporate bondwith the spread of a Credit Default Swap for the same issuing entity, same maturity, sameseniority and same currency.
• Covered Bond Method – The method involves choosing a pair of assets which, besidesliquidity, are assumed to offer equivalent cash flows and equivalent credit risk. Theprimary example is an index of covered bonds versus swaps.
• Structural Model Method – The method involves the use of option pricing techniques tocalculate a theoretical credit spread which compensates only for credit (default andspread) risk. The difference between the theoretical spread and the actual market spreadis typically taken to be liquidity premium.
A full analysis of the three methods including the quantum of the liquidity premia fromcorporate bonds over 2005 to 2009, the key assumptions and practical implementationconsiderations is contained in: “Summary of Liquidity Premium Estimation Methods” –October 2009 - John Hibbert et al8.
Selection of the reference portfolio of assets
There is a wide spectrum of liquidity premia available from different asset markets whichmatch the wide range of trading liquidity of different asset types. As a result, any estimate ofliquidity premium needs to reference a specific asset or asset pool. The specific asset orasset pool will need to be no more illiquid than the liabilities. Liquidity premium principle 2from the CEIOPS working party report9 provides guidance that the pool of assets should beindependent of those held by the company. Further, principles 3 and 6 note the use offinancial market data.
It is proposed that the reference portfolio of assets is a corporate bond index which isrepresentative of the investment grade market in each currency. This represents a practicaland pragmatic solution given the range of potential reference portfolios.
There are a variety of providers of corporate bond indices including investment banks andindependent companies. The formal criteria for the selection of the selection of the corporatebond index for each currency would be:
Representative of the available investment grade tradable corporate bonds in eachcurrency.
Available on a real-time basis from public data sources with formal published criteria forwhen and how constituents of the index are changed.
Prepared by an independent, reliable and objective third party.
8Available from: http://www.barrhibb.com/documents/downloads/Barrie_Hibbert_Summary_of_LP_Methods.pdf
9“Task Force in the Illiquidity Premium – Report – 1 March 2010”
Page 47 of 69
Operated in a transparent manner and expected to be prepared for the foreseeablefuture.
Unchanged unless the index is no longer representative of the market in that currency.
It proposed to use Markit Iboxx indices as these are widely regarded by practitioners as theindustry standard for EUR, GBP and USD currencies. Markit is an independent, reliable andobjective third party. Further, the Iboxx indices are available on a real-time basis with formalpublished criteria for when and how constituents of the indices change.
The reference portfolio is defined by the following corporate bond indices sourced fromMarkit10:
EUR: iBoxx € Corporates ISIN for TRI: DE0006301161 GBP: iBoxx £ Corporates ISIN for TRI: DE0005993174 USD: iBoxx $ Corporates ISIN for TRI: GB00B0598748
Derivation of the liquidity premium estimate
Whilst the three illustrated estimation methods provide a generally consistent messageregarding both the absolute level and changes in level of liquidity premia, it is still possible tocriticise the robustness of individual methods and specific estimates. However, by making useof estimates derived from a number of different methods together we can create a morerobust overall estimate.
To do this a “proxy” method based on a simple transformation of the observed credit spread isproposed:
LP currency = MAX (0, x% * (Spread – y bps))
The proxy does have a fundamental interpretation. The corporate bond spread is consideredto be comprised of three components: an allowance for the cost of default; a risk premium tocompensate bond holders for bearing credit risk and a liquidity premium to compensate forthe costs and associated uncertainty of trading illiquid bonds. Expected default costs overlong horizons can be expected to be reasonably stable and we can interpret the deduction (y)as such an allowance for long-term expected losses. By setting the proportion (x) we split theremainder of the spread between the liquidity premium and the credit risk premium.
In the following charts presented we use values of x = 50% and y = 40bps to compare theproxy method to the three directly observable methods currently used by practitioners. Allthe results presented use Iboxx annual benchmark credit spreads adjusted for swapspread to give a spread over swaps.
10 http: // indices.markit.com

Page 48 of 69
EUR – Derivation of liquidity premium
0
50
100
150
200
250
300
350
400
450
500
550
600
End Dec 2005 End Dec 2006 End Dec 2007 End Dec 2008 End Dec 2009
bp
s
Proxy
Covered Bonds
CDS Negative Basis
Structural Model
In summary, it can be seen that all methods (including the proxy) present a consistent patternfor movements in EUR liquidity premia over the period analysed. It is worth noting that:
The covered bond index measures a set of bonds which are generally more liquid (and ofhigher creditworthiness than the investment grade corporate bond portfolio we areinterested in). As a consequence, we believe it will provide a more conservative (i.e.biased low) estimate for corporate bond liquidity premia.
The proxy (using x=50% and y = 40bps) is generally conservative compared to thestructural and CDS negative-basis methods.
In the following figure the time series are plotted as scatter plots comparing the proxy method(x-axis) to each of the other methods (y-axis), with R-squared calculated to measurecorrelation. The first row shows the results of choosing optimal parameters to minimise anobjective function based on the sum of average square errors of the three methods. Thesecond row shows the original parameters (x=50% and y = 40bps) highlighting that, while notoptimal, this parameterisation provides very similar fits.

Page 49 of 69
y = 0.4509x - 1.8501R² = 0.8666
-50
0
50
100
150
200
250
300
350
400
-50 0 50 100 150 200 250 300 350 400
y = 0.9669x + 11.32R² = 0.9685
-50
0
50
100
150
200
250
300
350
400
-50 0 50 100 150 200 250 300 350 400
y = 1.0412x + 28.513R² = 0.9997
-50
0
50
100
150
200
250
300
350
400
-50 0 50 100 150 200 250 300 350 400
y = 0.5534x - 4.4277R² = 0.8494
-50
0
50
100
150
200
250
300
350
400
-50 0 50 100 150 200 250 300 350 400
y = 1.1928x + 5.5372R² = 0.959
-50
0
50
100
150
200
250
300
350
400
-50 0 50 100 150 200 250 300 350 400
y = 1.3117x + 22.011R² = 0.9966
-50
0
50
100
150
200
250
300
350
400
-50 0 50 100 150 200 250 300 350 400
Covered Bond Method CDS Negative-Basis Method Structural Model Method
Best FitParameters
OriginalParameters

Page 50 of 69
GBP – Derivation of liquidity premium
0
50
100
150
200
250
300
350
400
450
500
550
600
End Dec 2005 End Dec 2006 End Dec 2007 End Dec 2008 End Dec 2009
bp
s
Proxy
Covered Bonds
CDS Negative Basis
Structural Model
As for the EUR, it can be seen that there is considerable similarity between results from thesemethods. It is worth noting that:
Covered bonds are not as common in GBP, consequently there is a very limited choice ofestablished index measures. The index used here is provided by Merrill Lynch and onlycontains 15 bonds, some of which have a rating less than AAA. Consequently theobserved spread will not be a pure estimate for LP since it will contain a credit riskcomponent.
In Q1 2009 the CDS measure drops significantly. Due to lack of availability of CDSindices in markets outside EUR and USD we have used indices published byThomson/Reuters. It is not clear how well used this index is or the rules used to maintainit. We expect that, over this period, the price of protection for certain names grewmaterially and had a big impact on the measure. We saw similar, but more severe, resultswhen considering USD and EUR. We speculate that the iTraxx and CDX indices, whichare comprised of CDS at the liquid end of the market, are better managed and removethese anomalies.
The end of Dec 2008 structural model estimate is clearly lower than all the rest. Driven bystressed ultra-high option-implied equity market volatility and other assumptions themodel produces a very large estimate for the credit risk premium resulting in lowerliquidity premium.
In the following figure the time series are plotted as scatter plots comparing the proxy method(x-axis) to each of the other methods (y-axis), with R-squared calculated to measurecorrelation. The first row shows the results of choosing optimal parameters to minimise anobjective function based on the sum of average square errors of the three methods. Thesecond row shows the original parameters (x=50% and y = 40bps) highlighting that, while notoptimal, this parameterisation provides very similar fits.

Page 51 of 69
y = 1.6902x - 23.438
R² = 0.8824
-50
0
50
100
150
200
250
300
350
400
-50 0 50 100 150 200 250 300 350 400
y = 1.0746x + 0.3162R² = 0.8744
-50
0
50
100
150
200
250
300
350
400
-50 0 50 100 150 200 250 300 350 400
y = 0.7861x + 9.5663R² = 0.5514
-50
0
50
100
150
200
250
300
350
400
-50 0 50 100 150 200 250 300 350 400
y = 1.2967x - 17.758R² = 0.8824
-50
0
50
100
150
200
250
300
350
400
-50 0 50 100 150 200 250 300 350 400
y = 0.8244x + 3.9277R² = 0.8744
-50
0
50
100
150
200
250
300
350
400
-50 0 50 100 150 200 250 300 350 400
y = 0.6031x + 12.209R² = 0.5514
-50
0
50
100
150
200
250
300
350
400
-50 0 50 100 150 200 250 300 350 400
Covered Bond Method CDS Negative-Basis Method Structural Model Method
Best FitParameters
OrginalParameters

Page 52 of 69
USD – Derivation of liquidity premium
0
50
100
150
200
250
300
350
400
450
500
550
600
End Dec 2005 End Dec 2006 End Dec 2007 End Dec 2008 End Dec 2009
bp
sOriginal
Covered Bonds
CDS Negative Basis
Structural Model
For the USD the results are a little more varied, with the proxy following the CDS methodfairly closely.
Again, covered bonds are not as common in USD, consequently a broad index is moredifficult to identify. The index used here is provided by Merrill Lynch and only contains 11bonds, 5 of which have a rating less than AAA. Consequently the spread here will not bea pure estimate of LP as it will contain credit risk, so the spread may not always be on theconservative side. Over 2009 we believe this provides an absolute estimate which isbiased high relative to the “true” liquidity premium.
From the end of Dec 2008 the structural model provides relatively low estimatescompared to other methods and the proxy. This will be driven primarily by the elevatedlevel of long-term equity option implied volatility as well as other assumptions.
In the following figure the time series are plotted as scatter plots comparing the proxy method(x-axis) to each of the other methods (y-axis), with R-squared calculated to measurecorrelation. The first row shows the results of choosing optimal parameters to minimise anobjective function based on the sum of average square errors of the three methods. Thesecond row shows the original parameters (x=50% and y = 40bps) highlighting that, while notoptimal, this parameterisation provides very similar fits.

Page 53 of 69
y = 1.409x - 21.875R² = 0.6697
-50
0
50
100
150
200
250
300
350
400
-50 0 50 100 150 200 250 300 350 400
y = 0.8017x + 2.0065R² = 0.9356
-50
0
50
100
150
200
250
300
350
400
-50 0 50 100 150 200 250 300 350 400
y = 0.3795x + 3.7482R² = 0.7174
-50
0
50
100
150
200
250
300
350
400
-50 0 50 100 150 200 250 300 350 400
y = 1.9675x - 23.787R² = 0.6697
-50
0
50
100
150
200
250
300
350
400
-50 0 50 100 150 200 250 300 350 400
y = 1.1195x + 0.9186R² = 0.9356
-50
0
50
100
150
200
250
300
350
400
-50 0 50 100 150 200 250 300 350 400
y = 0.53x + 3.2325R² = 0.7174
-50
0
50
100
150
200
250
300
350
400
-50 0 50 100 150 200 250 300 350 400
Covered Bond Method CDS Negative-Basis Method Structural Model Method
Best FitParameters
OriginalParameters

Page 54 of 69
Conclusion
The results of the proxy measure of the liquidity premium in per annum bps (using x=50% andy = 40bps) relative to swaps are detailed below.
Liquidity premium in per annum bps relative to swaps:
Date EUR GBP USD
End December 2005 1 4 8
End December 2006 1 5 13
End December 2007 30 44 44
End December 2008 169 211 221
End March 2009 197 227 222
End June 2009 103 126 119
End September 2009 61 80 83
End December 2009 43 72 61
Appendix 3 explicitly illustrates the derivation of the proxy measure from base market data atend December 2008 and 2009.
In theory, the calibration of the proxy measure for the liquidity premium across EUR, GBP andUSD may not be the same, for example, there could be structural differences in each market.However, applying the same calibration across currencies is a pragmatic and simple solutionwhich currently provides a relatively good fit as illustrated by the statistical tests. It is notedthat the central EU institution in charge of calculating and publishing the liquidity premiumwould need to regular monitor the three basic measurement methods and the proxy formulain line with other aspects of the Solvency II framework.
As detailed early in the calibration paper, the basic risk-free interest rate is the inter-bankswap curve reduced by 10bps applied as a parallel shift to the simply compounded forwardrates. The reduction in the basic risk-free interest rate increases the direct measures of theliquidity premium and consequently the proxy by 10bps. It is noted that due to timeconstraints it has not been possible to formally prepare the QIS 5 analysis based on therevised basic risk-free interest rate.
Liquidity premium in per annum bps relative to swaps less 10bps:
Date EUR GBP USD
End December 2005 11 14 18
End December 2006 11 15 23
End December 2007 40 54 54
End December 2008 179 221 231
End March 2009 207 237 232
End June 2009 113 136 129
End September 2009 71 90 93
End December 2009 53 82 71
We proposed that for QIS 5 the liquidity premium estimate for EUR, GBP and USD isdetermined using the proxy measure calibrated with x=50% and y = 40bps, where thespread measures is relative to swaps. To allow for the basic risk-free interest ratebeing with reference to swaps less 10bps rather than swaps, the liquidity premiumresults are increased by 10bps. In formulaic terms, the result is a change in the “y”parameter to 30bps when the spread measure is relative to swaps less 10bps and the“x” parameter remains at 50%. If the “x” parameter was to change from 50% then theadjustment to the “y” parameter would need to be changed.

Page 55 of 69
Derivation of the liquidity premium term structure
In accordance with liquidity premium principle 3, the addition of a liquidity premium should belimited to maturities where an additional liquidity return may be earned in the financialmarkets. However, academic literature and theory is inconclusive over the liquidity premiumterm structure. In particular, there is no consensus from examining covered bond methods,structural methods or detailed bond level studies by academics11.
A relatively simple term structure, in forward rate space, designed to meet the requirements ofliquidity premium principle 3 is proposed:
Forward LPT, currency = F (T, currency) * LPcurrency
The function F(T, currency) is determined as:
F (T, currency) = 1; where 0 <= T < Ncurrency -5
= (Ncurrency -T)/5; where Ncurrency -5 <= T <= Ncurrency
= 0; where T > Ncurrency, Ncurrency designating the longest maturity where assets relating to
this currency may be purchased to earn a liquidity premium.
LPcurrency is as defined in the previous section for EUR, GBP and USD.
Further, for products whose term is one year or less no liquidity premium is applied.There is clear economic rationale to show that for short terms the liquidity premiumvanishes since at maturity an illiquid bond is redeemed in the same manner as a liquidbond.
The proposal requires the selection of Ncurrency at which point the liquidity premium estimateapplied in forward rate space is reduced linearly to zero over 5 years. There are alternativepatterns that could be used to reduce the estimate, such as setting the forward liquiditypremium to zero immediately, a shorter or longer linearly reduction or a proportionatereduction over a set period. A relatively simple linear approach was selected on pragmaticgrounds. The term structure would be re-examined by the central EU institution in charge ofcalculating and publishing the liquidity premium as further academic research is performed.
The selection of Ncurrency is to reflect that the liquidity premium can be applied only wherethere are sufficient illiquid instruments in the market. As a practical method, it is proposed touse the reference portfolio of assets, the Markit Iboxx indices, to determine Ncurrency.
Based on the constituents from the Markit Iboxx indices and associated bond data fromBloomberg the following charts plot the outstanding amount of bonds available in that year tomaturity. The labels denote the number of bonds. If, for QIS 5 purposes, we consider thatthe market is deep up to 99% of the outstanding amount available as captured by MarkitIboxx constituents then the time-to-maturity cut-offs are:• EUR – 24 years• GBP – 48 years• USD - 30 years
For the purposes of QIS 5, we propose that Ncurrency is 15 years for EUR and 30 years forGBP and USD.
We note that the corporate bond markets are larger than the subset of the most liquid usedfor the Markit Iboxx indices and there are other illiquid instruments available with longerterms, so the cut-off points could be longer. A potential simplification could be to set the cut-
11 Corporate bond liquidity before and after the onset of the subprime crisis, Dick-Nielsen, Feldhutter, Lando (2009)

Page 56 of 69
off points equal to the entry point used for the extrapolation of the basic risk-free interest rate.Further, it could be argued that when extrapolating the hypothetical pricing of assets beyondtraded horizons a liquidity premium should be reflected at all points.
For full Solvency II implementation, further work is required to consider the full rangeof investments available to earn the liquidity premium in financial markets for eachcurrency not just the subset of potentially more liquid assets used for the referenceportfolio of assets.
Outstanding amount of bonds available in that year to maturity for EUR Iboxxconstituents
20
150
139
174179
90
100
79
4953
1619
9613
614
012017
010132000 001 00000010000000000310000000000000000000000000000000000002
€ 0
€20,000
€40,000
€60,000
€80,000
€100,000
€120,000
€140,000
€160,000
€180,000
€200,000
1 3 5 7 9 11 13 15 17 19 21 23 25 27 29 31 33 35 37 39 41 43 45 47 49 51 53 55 57 59 61 63 65 67 69 71 73 75 77 79 81 83 85 87 89 91 93 95
Ou
tsta
nd
ing
Am
ou
nt
(mill
ion
s)
Time to maturity (years)Labels denote number of bonds

Page 57 of 69
Outstanding amount of bonds available in that year to maturity for GBP Iboxxconstituents
22
39
2828
35
29
434545
33
2324
20
25
21
11
14
9
18
6
13
10
6
10
5
8
4
109
8
422
01
0 01
00000011
0000000
4
10000000000000000000000000000000000000
£0
£2,000
£4,000
£6,000
£8,000
£10,000
£12,000
£14,000
£16,000
£18,000
£20,000
1 3 5 7 9 11 13 15 17 19 21 23 25 27 29 31 33 35 37 39 41 43 45 47 49 51 53 55 57 59 61 63 65 67 69 71 73 75 77 79 81 83 85 87 89 91 93 95
Ou
tsta
nd
ing
Am
ou
nt
(mill
ion
s)
Time to maturity (years)Labels denote number of bonds
Outstanding amount of bonds available in that year to maturity for USD Iboxxconstituents
41
180
198207
216
114
95
146
170
186
1158
32310971013
2627232232
51
83
55
42
100 100 0100000000000000057
1100000001000000000000000000110000000$0
$50,000
$100,000
$150,000
$200,000
$250,000
1 3 5 7 9 11 13 15 17 19 21 23 25 27 29 31 33 35 37 39 41 43 45 47 49 51 53 55 57 59 61 63 65 67 69 71 73 75 77 79 81 83 85 87 89 91 93 95
Ou
tsta
nd
ing
Am
ou
nt
(mill
ion
s)
Time to maturity (years)Labels denote number of bonds
Page 58 of 69
Appendix 3:
Full calculation of the liquidity premium proxy measure forEUR, GBP and USD
Methodology
The proxy calculation method for EUR, GBP and USD uses Markit Iboxx corporate bondindices. These indices quote information on the annual benchmark spread over governments.The underlying index data is not available so an adjustment for the change in benchmark atthe index level is required. Any method adjusting at this level will be approximate and ideally aspread measure (for example a z-spread) using swaps as the benchmark should beconstructed from the components of the index.
We use the annual modified duration of the index to determine which tenor swap spreadsshould be used to adjust the reported benchmark spread. Other options are available such asinterpolating using years to maturity, or by using the index yield directly.
We use linear interpolation to derive a swap spread of the same term as the duration of theindex. The calculation is:
InterpolatedSwapSpread = SSB + (SSA - SSB) * (IndDur - TenorB) / (TenorA - TenorB)
Where: IndDur – Duration of the index TenorA – Smallest tenor above IndDur at which a swap spread is quoted TenorB – Largest tenor below IndDur at which a swap spread is quoted SSA – SwapSpread at tenor TenorA SSB – SwapSpread at tenor TenorB
This gives an interpolated swap spread at this duration which we subtract from the spread:
CreditSpreadSwaps = CreditSpreadGovs – InterpolatedSwapSpread
We have proposed a relatively simple spread measure for QIS 5 purposes given thetimescales for the calibration. For full Solvency II implementation other moresophisticated measures (for example, a z-spread) would need to be investigated.
Data
The swap spread data is sourced from Bloomberg. The following tickers can be used to getthe 5 year spreads (replace the 5 to get other tenors): EUR - EUSS5 CMPL Curncy GBP - BPSS5 CMPL Curncy USD - USSS5 CMPL Curncy
For convenience, we used these swap spreads, though the spreads may differ slightly fromthe rates used in constructing the basic risk-free interest rate. However, the difference is lessthan 1bp.
Iboxx credit spreads are available from Markit. See http://indices.markit.com EUR - DE0006301161 Markit iBoxx € Corporates

Page 59 of 69
GBP - DE0005993174 Markit iBoxx £ Corporates USD -GB00B0598748 Markit iBoxx $ Corporates
Worked example for USD at 31 December 2009
We illustrate the calculation with a worked example for USD at 31 December 2009:
CreditSpreadGovs = 186.51 (iBoxx $ Corporates Annual Benchmark Spread) IndDur = 5.78 (iBoxx $ Corporates Annual Modified Duration) TenorA = 6 TenorB=5 SSA= 24.50 (USSS6 CMPL Curncy) SSB = 27.75 (USSS5 CMPL Curncy)
InterpolatedSwapSpread = 27.75 + (((24.50 – 27.75) * (5.78 - 5)) / (6 - 5)) = 25.215
CreditSpreadSwaps = 186.51 – 25.215 = 161.295
Liquidity premium proxy = 0.5*(161.295 – 40) = 60.6475 = 61 bps
It is noted that the results presented are relative to a swap curve. Consequently, 10bps is
required to be added to derive the QIS 5 liquidity premium.
Calculations for EUR, GBP and USD at 31 December 2008 and 2009
We illustrate the source data and calculations at 31 December 2008 and 2009:
Date Currency CreditSpreadGovs IndDur SSA SSB TenorA TenorB InterpolatedSwapspread CreditSpreadSwaps LP proxy
31/12/2008 EUR 470.04 3.93 89.64 111.05 4 3 91.08 378.96 169
GBP 509.11 6.05 36.25 48.25 7 6 47.65 461.46 211
USD 540.19 5.56 58.25 59.00 6 5 58.58 481.61 221
31/12/2009 EUR 170.75 4.00 50.77 45.25 5 4 45.25 125.50 43
GBP 220.90 6.77 33.25 50.25 7 6 37.16 183.74 72
USD 186.51 5.78 24.50 27.75 6 5 25.22 161.30 61
It is noted that the results presented are relative to a swap curve. Consequently, 10bps is
required to be added to derive the QIS 5 liquidity premium.

Page 60 of 69
Appendix 4:
Liquidity premium for CHF and JPY currencies
In this Appendix, we propose liquidity premium for CHF and JPY for QIS5 purposes.
Swiss Franc - CHF
Methodology
In order to derive a liquidity premium estimate for CHF we have applied the proxy method for
EUR, GBP and USD to a SIX Swiss Exchange Swiss Bond Index (SBI). Several indices are
available which categorise the bonds by term and rating. We have chosen the AAA-BBB 1-15
year index due to its broad coverage of the market.
The liquidity premium estimate is calculated as follows: MAX (0, 50% * (BondIndexYield –
InterpolatedSwapRate) – 40bps))
We use linear interpolation to derive a swap spread of the same term as the duration of theindex. The calculation is: InterpolatedSwapRate = SRB + (SRA – SRB) * (IndDur – TenorB) /(TenorA – TenorB)
Where: IndDur – Duration of the index TenorA – Smallest tenor above IndDur at which a swap rate is quoted TenorB – Largest tenor below IndDur at which a swap rate is quoted SRA – SwapRate at tenor TenorA SRB – SwapRate at tenor TenorB
The approach is similar to that for EUR, GBP and USD although there are some key
differences. For the EUR, GBP and USD, we used Iboxx indices as one of the outputs
available is the average spread to government bond yields. This is calculated at an individual
security level then averaged. We then adjusted this credit spread by the government to swap
spread to get a spread relative to swaps. For CHF, we take the average yield and subtract a
swap rate to give the spread over swaps directly. The major difference between the two
approached is for CHF we calculate the spread relative to the average yield as opposed to
the average of the individual spreads. For full Solvency II implementation, we would seek
to align the definition of the credit spread measure.
Data
We have used index redemption yield and duration and swap rates from DataStream for the
calculations.
SBI Redemption yield = SWAB115(RY)
SBI Duration = SWAB115(DU)
4 Year Swap Rate = ICCHF4Y
5 Year Swap Rate = ICCHF5Y
We have verified that the DataStream swap rates match the Bloomberg rates SFSW4 and
SWSF5. The change of source from the basic risk-free interest rate has no impact on the
calculation as at 31 December 2008 and 2009.

Page 61 of 69
Results
Date 31/12/08 31/12/09
Index yield % 2.90 2.09
Index duration 4.62 4.49
Swap 4 year % 1.73 1.47
Swap 5 year % 1.96 1.71
Interpolated swap rate % 1.87 1.59
Liquidity premium (bps) 32 5
It is noted that the results presented are relative to a swap curve. Consequently, 10bps is
required to be added to derive the QIS 5 liquidity premium. The liquidity premium is 42bps
and 15bps at end December 2008 and 2009.
-10
10
30
50
70
90
LP(B
asis
Po
ints
)
CHF Liquidity Premium
Supporting analysis of direct measures
For comparison we have also calculated the liquidity premium using the 3-5 year bond index
(which is the most densely populated index) and Swiss Pfandbriefe (a direct covered bond
method). The 3-5 year bond index provided comparable results to the 1-15 year index. The
Pfandbriefe give similar liquidity premia during the recent economic crisis but the yields
started increasing earlier than credit spreads and have yet to fall.
In the time required for QIS5, we were not able to source the required data for the negative
CDS method and the structural model results were not credible due to a lack of appropriate
input data.
-10
0
10
20
30
40
50
60
70
Liq
uid
ity
Pre
miu
m(B
asis
Po
ints
)
CHF - Additional LP estimates
3-5y Index
1-15y Index
Pfandbriefe

Page 62 of 69
Where available the direct measures support the use of the proxy method calibrated as for
EUR, GBP and USD.
Term structure of the liquidity premium
We examine a maturity analysis of the SBI 1-15year index:
Maturity Band Number of bonds
31/12/09 – 31/12/14 279
01/01/15 – 31/12/19 150
01/01/20 – 31/12/24 14
01/01/25 – 31/12/29 6
01/01/30 + 6
Given that there are relatively few bonds beyond 10 years, we propose a cut-off of 10 years.
The liquidity premium is then applied using the same method as for EUR, GBP and USD
including the 5 year linear run-off from this point.

Page 63 of 69
Japanese Yen – JPY
Methodology
In order to derive a liquidity estimate for JPY we have applied the proxy method for EUR,
GBP and USD to the Merrill Lynch Japan Corporate Bond Index. This is believed to be a
representative index for JPY. The credit spread measure applied is the same as for CHF.
We have not been able to calculate reasonable looking direct measures of the liquidity
premium due to a lack of reliable data and time constraints for QIS 5. However, it is clear that
there is a significant JPY corporate bond market to access the liquidity premium.
Data
We have used index redemption yield and swap rates from DataStream for the calculations
below assuming a constant duration of 4.4 years (value at calculation date).
ML Redemption yield = MLJPCPL(RY)
4 Year Swap Rate = ICJPY4Y
5 Year Swap Rate = ICJPY5Y
It is noted that for the end 2008 and end 2009, we have used Bloomberg swap rates JYSW4
and JYSF5 (as for the basic risk-free interest rate) and updated the duration to specific day
values using the Macaulay duration output on index JC00.
Results
Date 31/12/08 31/12/09
Index yield % 1.73 1.00
Index duration 4.53 4.38
Swap 4 year % 0.87 0.59
Swap 5 year % 0.93 0.69
Interpolated swap rate % 0.89 0.63
Liquidity premium (bps) 22 0
[-1bps floored at zero]
It is noted that the results presented are relative to the swap curve. Consequently, 10bps is
required to be added to derive the QIS 5 liquidity premium. The liquidity premium is 32bps
and 9bps at end December 2008 and 2009.
The liquidity premium appears relatively low for JRY compared to other currency. For
full Solvency II implementation, further analysis into direct measures of assessing the
liquidity premium is required. This would include the accessibility of the USD liquidity
premium as such denominated assets are commonly held by firms in Japan.

Page 64 of 69
-10
10
30
50
70
90
LP(B
asis
Po
ints
)
JPY Liquidity Premium
Term structure of the liquidity premium
We examine a maturity analysis of the Merrill Lynch Japan Corporate Bond Index:
Maturity Band Number of bonds
31/12/09 – 31/12/14 532
01/01/15 – 31/12/19 310
01/01/20 – 31/12/24 25
01/01/25 – 31/12/29 28
01/01/30 + 4
Given that there are relatively few bonds beyond 10 years, we propose a cut-off of 10 years.
The liquidity premium is then applied using the same method as for EUR, GBP and USD
including the 5 year linear run-off from this point.

Page 65 of 69
Appendix 5:
Liquidity premium for SEK, DKK and NOK currencies
In this Appendix, we propose liquidity premium for SEK, DKK and NOK for QIS5 purposes.These are initial estimates and further analysis on both the calibration and on which indices touse would need to be performed for full Solvency II implementation.
Swedish Krona – SEK
For the liquidity premium estimation for SEK an index of Swedish covered bonds is used. Theindex is currently published by the Swedish bank Handelsbanken and is available onBloomberg (HMSMDU Index). There are several reasons why this index is chosen. Firstly,this represents a significant part of the Swedish bond market and all bonds in this index areAAA rated. Moreover, covered bonds are made use of when constructing the current discountcurve for solvency purposes in Sweden. Currently, half the spread is applied. The graphbelow shows the spread and the calculated liquidity premium over time for current solvencypurposes in Sweden.
The same methodology is proposed for QIS5. However, for consistency with the methodologyproposed for EUR, GBP and USD, the full covered bond spread rather than half is used. Thecovered bond spread is taken as a spread above swap less 10bps.
Specifically, the liquidity premium is estimated to be 54bps at 31 December 2009 and84bps at 31 December 2008.
For QIS5 purposes the liquidity premium cut-off point is set to the same as the last liquid pointin the basic risk-free interest rate, notably 10 years. The liquidity premium is then appliedusing the same method as for EUR, GBP and USD including the 5 year linear run-off from thispoint.

Page 66 of 69
Danish Krone – DKK
For the liquidity premium estimation for DKK an index of Danish covered bonds is used. Theindex is currently published by the Danish bank Nykredit and is available on their webpage(www.nykredit.dk) and on Bloomberg. Covered bonds represent a significant part of theDanish bond market and this index consists mostly of AAA rated bonds (which only a few AArated). Moreover, the same covered bond index is made use of when constructing the currentdiscount curve for solvency purposes in Denmark. Currently, use is made of half the spread.The graph below shows the spread and the calculated liquidity premium over time on thisbasis.
We note that the methodology that is currently being used by the Danish regulator is moredetailed and there is a term structure of liquidity premium. For simplicity in QIS 5, this has notbeen applied. Instead a methodology similar to SEK is proposed where the full covered bondspread is used. The covered bond spread is taken as a spread above the DKK swap curveless 10bps.
Specifically, the liquidity premium is estimated to be 40bps at 31 December 2009 and62bps at 31 December 2008. The risk-free interest rate used in this assessment is theDKK local swap curve less 10bps rather than the adjusted EUR curve less 10bps asproposed in Appendix 1. Due to time constraints, it was not possible to re-perform theanalysis using the correct rates, however, this will not significant distort the liquiditypremium for QIS 5 purposes.
For QIS5 purposes the liquidity premium cut-off point is 15 year based on the constituents ofthe index. The liquidity premium is then applied using the same method as for EUR, GBP andUSD including the 5 year linear run-off from this point.
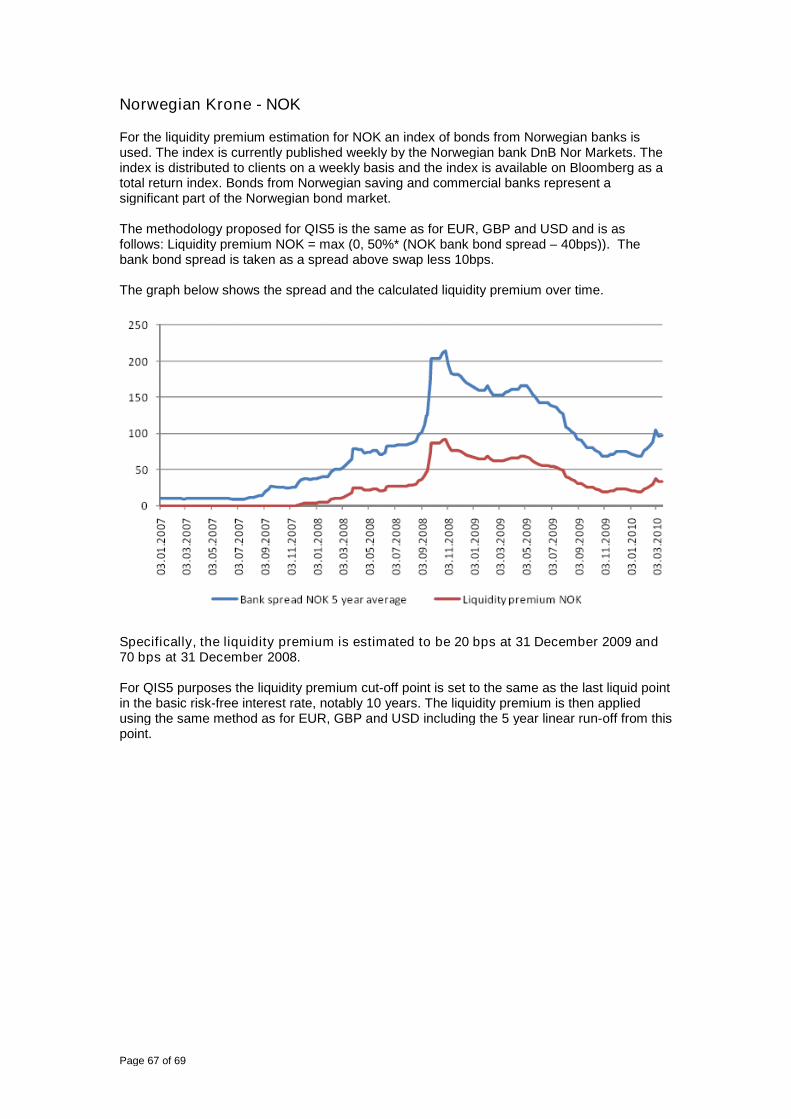
Page 67 of 69
Norwegian Krone - NOK
For the liquidity premium estimation for NOK an index of bonds from Norwegian banks isused. The index is currently published weekly by the Norwegian bank DnB Nor Markets. Theindex is distributed to clients on a weekly basis and the index is available on Bloomberg as atotal return index. Bonds from Norwegian saving and commercial banks represent asignificant part of the Norwegian bond market.
The methodology proposed for QIS5 is the same as for EUR, GBP and USD and is asfollows: Liquidity premium NOK = max (0, 50%* (NOK bank bond spread – 40bps)). Thebank bond spread is taken as a spread above swap less 10bps.
The graph below shows the spread and the calculated liquidity premium over time.
Specifically, the liquidity premium is estimated to be 20 bps at 31 December 2009 and70 bps at 31 December 2008.
For QIS5 purposes the liquidity premium cut-off point is set to the same as the last liquid pointin the basic risk-free interest rate, notably 10 years. The liquidity premium is then appliedusing the same method as for EUR, GBP and USD including the 5 year linear run-off from thispoint.

Page 68 of 69
Appendix 6:
Liquidity premium for other currencies
In this Appendix, we propose liquidity premium for the other currencies for QIS5 purposes.
Czech Koruna – CZK, Polish Zloty – PLN and Hungarian Forint – HUF
For CZK, PLN and HUF, we were able to source corporate bonds in excess of circa £1bn ineach market. However, no readily available and reliably corporate bond indices could beevidenced.
In these three currencies, the following relationship between the government bond and swapcurves is evidenced:
5 year spread of governments over swaps less 10bps in basis points
CZK PLN HUF
Credit rating** A+ A BBB
31 December 2005 7 3 26
31 December 2006 2 -1 19
31 December 2007 10 2 33
31 December 2008 82 96 121
31 December 2009 40 54 72** Standard & Poor credit rating
The pattern is similar to that observed on corporate bond spreads in the larger currencies.There is evidence of an additionally liquidity premium through the investment in localgovernment bonds. However, it is unclear the extent to which the additional spread relates toliquidity premium, credit default risk, compensation for bearing credit risk or potentially otheraspects in these markets.
As an intermediate measure for QIS 5 purpose, we propose a liquidity premium of 35%of the EUR (relative to swaps less 10bps). This represents a workable and conservativeallowance for QIS 5, but would clearly require significant further investigation for fullSolvency II implementation.
Date EUR liquidity premium
(relative to swaps less 10bps)
35% of EUR liquidity premium
(relative to swaps less 10bps)
End December 2008 179 63
End December 2009 53 19
For the liquidity premium cut-off point, we propose 15 years for CZK and PLN reflecting theentry point into the swap curve extrapolation and that the government bond market existsbeyond this point. For HUF, we propose 10 years, reflecting the shorter government bondmarket.
Romanian Lei – RON
For RON, we were not able to find corporate bond markets on Bloomberg or other readilyavailable sources for QIS 5. Further, the relationship between the swap curve andgovernment curve has not been stable over the last 5 years – that is the government spreadover swaps has sometimes been positive or negative. We propose zero liquidity premiumfor QIS 5.
Page 69 of 69
Bulgarian Lev – RON
For BGN, we were not able to find corporate bond markets on Bloomberg or other readilyavailable sources for QIS 5. Further, there is a positive swap spread over government bondsat end 2008 and 2009. We propose zero liquidity premium for QIS 5.
Turkish Lira – TRY
For TRY, we were able to source data for corporate bond markets of circa £2bn. However,very few bond issues were beyond 3 years so there is unlikely to be a liquidity premium tomaterially impact the valuation of technical provisions. Further, there is a positive swapspread over government bonds at end 2008 and 2009. We propose zero liquidity premiumfor QIS 5.
Iceland Krona – ISK
For ISK, in the absence of recent reliable government or swap data, we propose zeroliquidity premium for QIS 5.
Estonian Kroon – EEK, Latvian Lats – LVL and Lithuanian Litas – LTL
As noted in the selection of the basic risk-free interest rate, no active swap rates orgovernment bond prices could be reliably sourced and due to currency pegging the EUR risk-free curve was proposed. For the liquidity premium, we propose to use 35% of the EURliquidity premium for QIS 5. The reduction is to reflect the risk that the currency peg maybebroken in future.