qsir knowledge exchange - matt tite presentation
TRANSCRIPT

Organising for Quality and Value
Delivering Improvement Programme
Quality, Service Improvement and Redesign:
Practitioner Programme
Applying Quality Improvement to the Five
Year Forward View

Let me train you to be an Analyst….


Toss a coin….
What are the chances?
LCL
UCL
MEAN
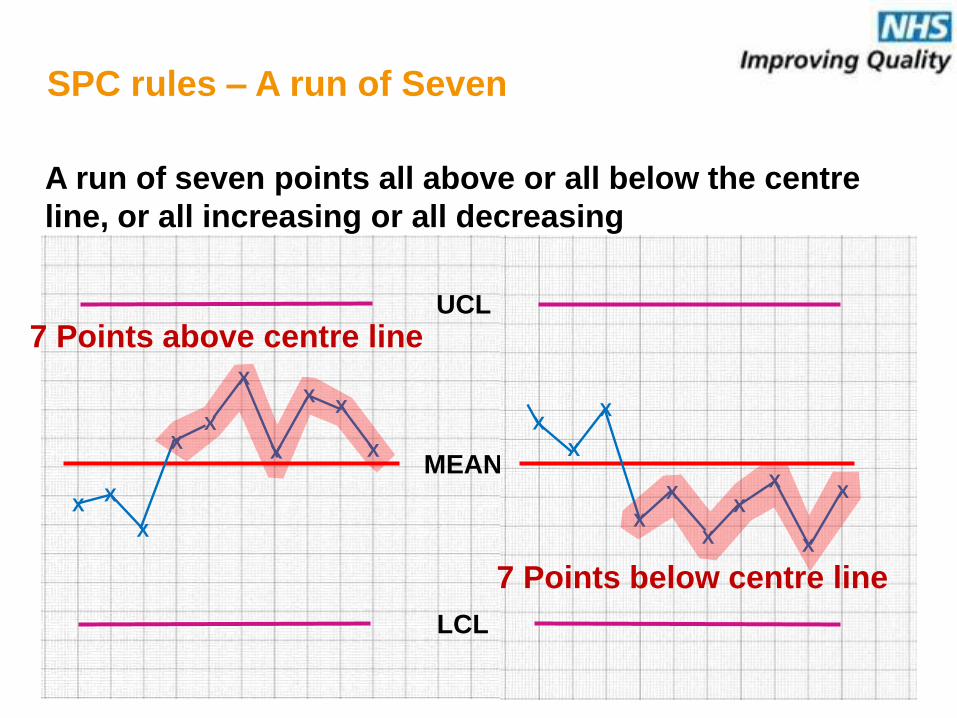
7 Points above centre line
SPC rules – A run of Seven
A run of seven points all above or all below the centre
line, or all increasing or all decreasing
XX
X
X
XX
X
XX
XX
X
X
X
XX
X
XX
X
7 Points below centre line
0
20
40
60
80
100
120
140
Falls Ulcers VTE UTI
Nu
mb
er
og
Pati
en
ts
Type of Harm
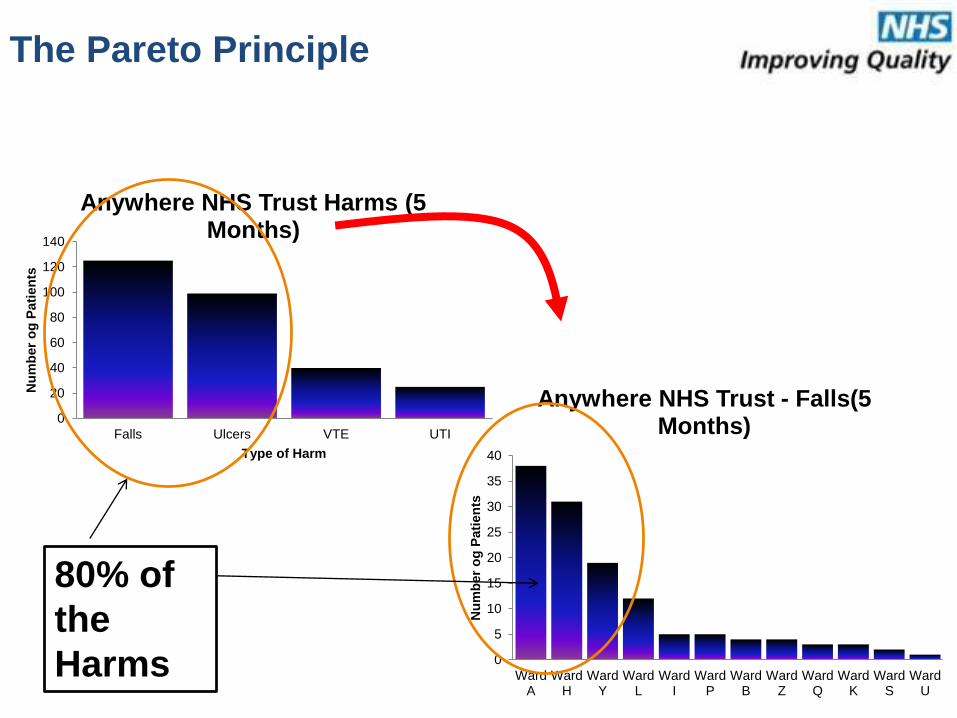
Anywhere NHS Trust Harms (5 Months)
80% of
the
Harms 0
5
10
15
20
25
30
35
40
WardA
WardH
WardY
WardL
WardI
WardP
WardB
WardZ
WardQ
WardK
WardS
WardU
Nu
mb
er
og
Pati
en
ts
Anywhere NHS Trust - Falls(5 Months)
The Pareto Principle

Combining SPC and Pareto…….

0
20
40
60
80
100
120
140
Falls Ulcers VTE UTI
Nu
mb
er
og
Pati
en
ts
Type of Harm
Anywhere NHS Trust Harms (5 Months)
80% of
the
Harms
0
5
10
15
20
25
30
35
40
WardA
WardH
WardY
WardL
WardI
WardP
WardB
WardZ
WardQ
WardK
WardS
WardU
Nu
mb
er
og
Pati
en
ts
Anywhere NHS Trust - Falls(5 Months)
Mtweek_2
Mtyear_2
1885114420105316649
20142014201320132013201220122011201120112010
60
50
40
30
20
10
0
Nu
mb
er
of
Att
en
de
rs
_X=29.05
UCL=52.83
LCL=5.27
1
1
5 COPD pathways - Spring and Winter Attenders (weekly)

The usual approach
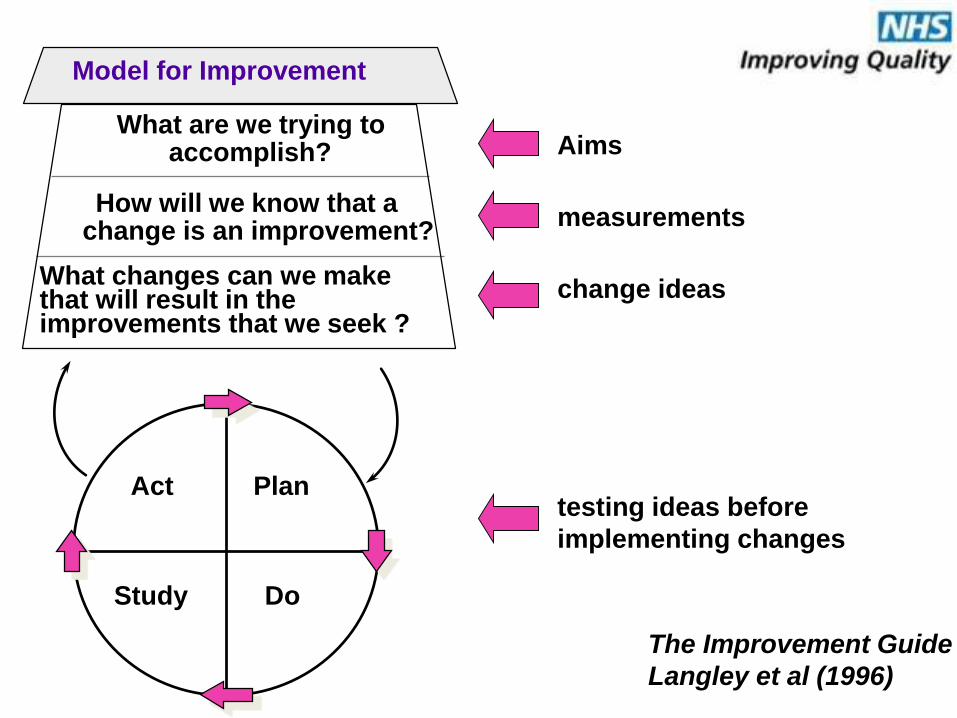
Aims
measurements
change ideas
The Improvement Guide
Langley et al (1996)
What are we trying toaccomplish?
How will we know that achange is an improvement?
What changes can we make that will result in the improvements that we seek ?
Model for Improvement
Act Plan
Study Do
testing ideas before
implementing changes
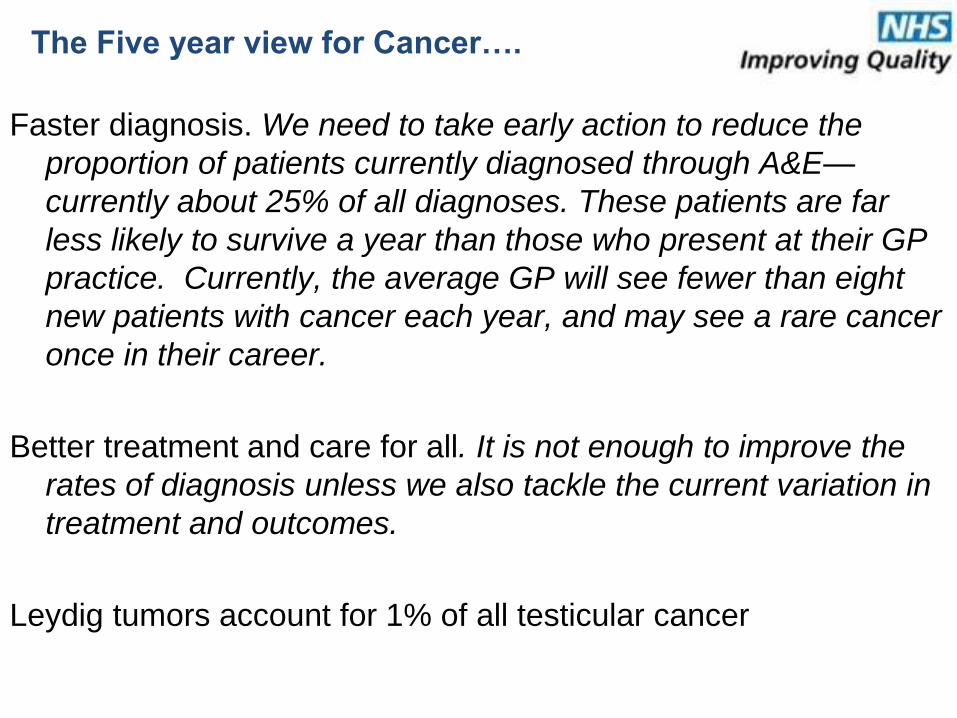
The Five year view for Cancer….
Faster diagnosis. We need to take early action to reduce the
proportion of patients currently diagnosed through A&E—
currently about 25% of all diagnoses. These patients are far
less likely to survive a year than those who present at their GP
practice. Currently, the average GP will see fewer than eight
new patients with cancer each year, and may see a rare cancer
once in their career.
Better treatment and care for all. It is not enough to improve the
rates of diagnosis unless we also tackle the current variation in
treatment and outcomes.
Leydig tumors account for 1% of all testicular cancer

Question 1
What should we do first?
A) Set some targets. Set Cancer targets that seem sensible, that
stretch, but are achievable.
B) Write a clear aims statement, which does not contain any
solutions.
C) Create SPC charts.
D) Create Pareto charts.

Question 2
What’s next? After working up the Aim, what’s the next two tool
needed?
1) Cause and effect diagrams and SBAR
2) Driver diagrams and 6 thinking hats
3) Pareto and SPC
4) Spaghetti Diagrams and Fresh Eyes
Create Pareto charts to define and understand the
problem. Use SPC charts to see the 80%’s if they have
always been the problem, are growing or shrinking.
If I had an hour to save the
world, I Would Spend 55
Minutes Defining the Problem
and then Five Minutes Solving
It
(Einstein – Misquoted)

The Five Year Forward View
Outcomes vs Processes
The Donabedian Model
Outcome
Process
Balancing Measures

Creating measures
at all levels
System
Team
Service
Balance of Health
and Social Care
Outcomes
Line of sight across
the levels of
integrated care
• Type of measure by domain
• Timeline (baseline – 1, 3, 5 and 10 years)Adapted
from AquA

How capable are your processes of achieving
targets?
How capable are your processes of achieving targets?
Example - Door to needle times
75% of heart attack patients will receive thrombolysis within 20
minutes of their arrival in hospital

Imagine this is your process - Is it capable of
achieving 75% of patients treated in 20 minutes?
Door to Needle Times
0
10
20
30
40
50
60
70
80
1 2 3 4 5 6 7 8 9 10 11 12 13 14 15 16 17 18 19 20 21 22 23 24 25
Consecutive patients
Min
ute
s
Door to needle time Average UCL LCL Target

Door to
needle
time Average UCL LCL
Moving
range
Average
MR Target
28 31 68 0 14 20
45 31 68 0 17 20
50 31 68 0 5 20
40 31 68 0 10 20
20 31 68 0 20 20
15 31 68 0 5 20
46 31 68 0 31 20
30 31 68 0 16 20
20 31 68 0 10 20
45 31 68 0 25 20
46 31 68 0 1 20
34 31 68 0 12 20
20 31 68 0 14 20
10 31 68 0 10 20
30 31 68 0 20 20
50 31 68 0 20 20
30 31 68 0 20 20
23 31 68 0 7 20
10 31 68 0 13 20
30 31 68 0 20 20
28 31 68 0 2 20
30 31 68 0 2 20
9 31 68 0 21 20
40 31 68 0 31 20
42 31 68 0 2 20

Capability = Target - Average
3 * sigma
Formula

Calculation (example)
Target 10 mins
Average 20
Sigma 18.7
10 - 20 =
3 x 18.7-0.18
TargetAverage
Sigma

Interpretation
Value Capability of Achieving Target
more than 1 100%
0-1 50-100%
less than 0 0-50%
How capable is the process of achieving the target?

Capability value % Capability Capability value % Capability
0 50 0.42 89.6
0.02 52.4 0.44 90.7
0.04 54.8 0.46 91.6
0.06 57.1 0.48 92.5
0.08 59.5 0.5 93.3
0.1 61.8 0.52 94.1
0.12 64.1 0.54 94.7
0.14 66.3 0.56 95.4
0.16 68.4 0.58 95.9
0.18 70.5 0.6 96.4
0.2 72.6 0.62 96.9
0.22 74.5 0.64 97.3
0.24 76.4 0.66 97.6
0.26 78.2 0.68 97.9
0.28 80 0.7 98.2
0.3 81.6 0.75 98.8
0.32 83.2 0.8 99.2
0.34 84.6 0.85 99.5
0.36 86 0.9 99.7
0.38 87.3 0.95 99.8
0.4 88.5 1 99.9
Table of Capability Values

Is your process Capable?
= 20 - 31 = -0.30
37The figure is negative so this process is not capable
of achieving 100% within 20 minutes.
A minus figure means more than 50% of patients will
not meet target.
The maximum this process can deliver is 18.4%and the target is 75%
Therefore, the process needs significantly
redesigning to achieve the target

Question 3
Before you can attempt capability calculations the data needs to meet
certain criteria?
A) No, You can do capability analysis on any data
B) Yes , The data needs to be “in control and stable”

Question 4
How do you know if your data is stable, predictable and in control?
A) All the points are inside of the UCL and LCL
B) There are no runs of 7 points
C) The distribution of the data is as expected
D) All of the above

Understanding GP
Capacity and Demand

252321191715131197531
20
15
10
5
0
Observation
Min
ute
s
_X=10.68
UCL=20.54
LCL=0.82
Patient Time (minutes) - GW
252321191715131197531
20
15
10
5
0
Observation
Min
ute
s
_X=9.48
UCL=20.56
LCL=-1.60
Patient Time (minutes) - SP
252321191715131197531
25
20
15
10
5
0
Observation
Min
ute
s
_X=11.36
UCL=25.43
LCL=-2.71
Patient Time (minutes) - SF
252321191715131197531
30
20
10
0
-10
Observation
Min
ute
s _X=11.64
UCL=29.70
LCL=-6.42
Patient Time (minutes) - JB
252321191715131197531
50
40
30
20
10
0
Observation
Min
ute
s
_X=16.16
UCL=38.88
LCL=-6.56
11
Patient Time (minutes) - SYA

4 are the same, one seems different…
SYAJBSPGWSF
20
18
16
14
12
10
8
Min
ute
s
Interval Plot of SF, GW, SP, JB, SYA95% CI for the Mean
SYA is
statistically
different from
the other 4

Activity, Backlog, Capacity & Demand…..
Demand:
All the requests
for a service –
from all sources
Capacity:
All that we can
do
Bottleneck:
Constraint is the
cause of the
bottleneckActivity:
What we actually
did
Backlog =
Queue =
Waiting List

Face to Face Appointments
13/0
6/20
14
11/06/
2014
09/0
6/20
14
05/06/
2014
03/0
6/20
14
30/05/
2014
28/0
5/20
14
26/05/20
14
22/0
5/20
14
20/05/20
14
16/05/
2014
14/0
5/20
14
12/05/
2014
300
250
200
150
100
50
0
Date
Nu
mb
er
of
Ap
pts
_X=129.2
UCL=267.1
LCL=-8.8
Number of face to face appts (daily)
24/1
1/20
14
04/1
1/20
14
15/1
0/20
14
25/0
9/20
14
05/09/
2014
18/08/
2014
29/07/
2014
09/07/
2014
19/06/
2014
30/05/
2014
12/05/
2014
160
140
120
100
80
60
40
20
0
Date
Nu
mb
er
of
Pa
tie
nts
_X=92.8
UCL=148.5
LCL=37.1
11
Number of Patients on triage (daily)
Patients who were Triaged

Demand for GP Triage, is it the
same each day?
65432
160
140
120
100
80
60
40
20
0
Mtday
Nu
mb
er
on
tri
ag
e
Boxplot of Number on triage
65432
160
140
120
100
80
60
40
20
0
Mtday
Nu
mb
er
on
tri
ag
e
Individual Value Plot of Number on triage vs Mtday
Monday is statistically
different from the
other days of the
week (the other 4 days
are the same as each
other)

Conclusions for planning C&D
(triage patients only)
You must plan for Mondays Separately
Tue, Wed, Thurs & Fri are the same
You cannot plan capacity for the whole year. It is affected by
seasonality (runs of 7 points on SPC charts)
– Possibly need more weeks to prove this
You should plan one system from Oct onwards (winter)
We only have data from May, so not sure when the seasonality ends
in the data) – We can guess on the weather, but the years worth of
triage data would be better

Planning C&D
Take the 80% time (1.5 sigma above the average) – Half way
between the average and the UCL. This is the time that it takes
each Doc to do an appointment:
– GW = 15 minutes
– SP = 15 minutes
– SF = 18 minutes
– JB = 20 minutes
– SYA = 27 minutes
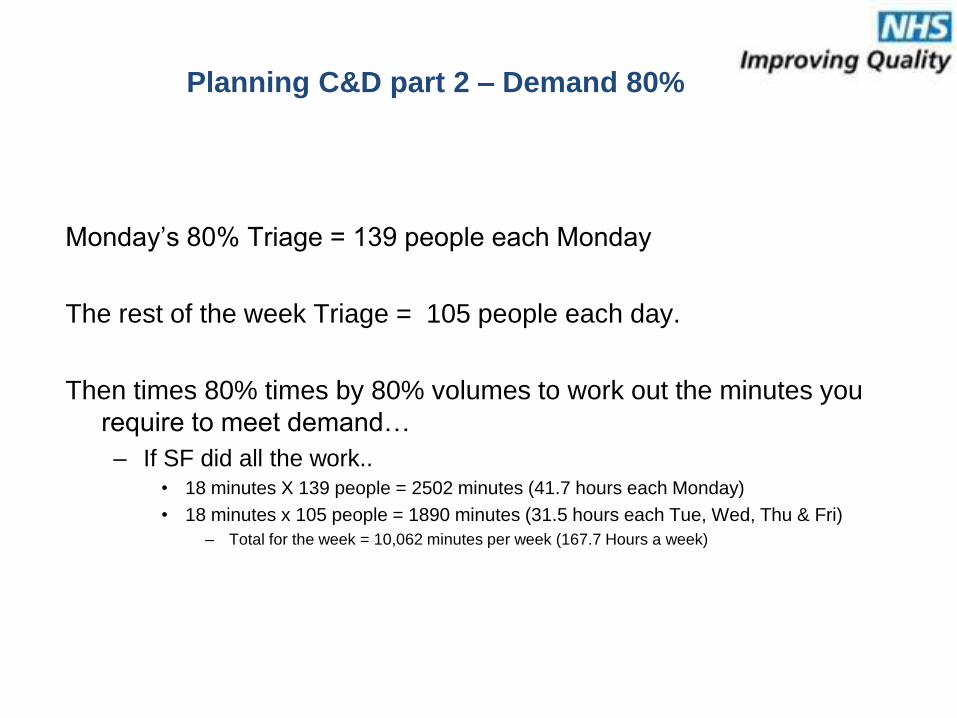
Planning C&D part 2 – Demand 80%
Monday’s 80% Triage = 139 people each Monday
The rest of the week Triage = 105 people each day.
Then times 80% times by 80% volumes to work out the minutes you
require to meet demand…
– If SF did all the work..• 18 minutes X 139 people = 2502 minutes (41.7 hours each Monday)
• 18 minutes x 105 people = 1890 minutes (31.5 hours each Tue, Wed, Thu & Fri)
– Total for the week = 10,062 minutes per week (167.7 Hours a week)

This needs additional calculations
Not all triaged work is a face to face appointment in the GP practice
Some are ‘visits’
– Take 25 timings for each GP for visits, we can adjust the proportions
accordingly.

Same Day Appts
24/11/
2014
04/11/
2014
15/10/20
14
25/0
9/20
14
05/0
9/20
14
18/08/
2014
29/07/
2014
09/07/
2014
19/0
6/20
14
30/0
5/20
14
12/05/
2014
70
60
50
40
30
20
10
0
Date
Nu
mb
er
of
Sa
me
Da
y A
pp
ts
_X=39.22
UCL=69.22
LCL=9.22
11
Same day appts (Daily)65432
70
60
50
40
30
20
10
0
Mtday
Sa
me
da
y a
pp
t
Boxplot of Same day appt
Monday and Tuesday are
peak days for requests for
Same day Appts, Wed,
thurs & Friday are about
the same. If the tails
overlap they are not
statistically different

Number of Visits
09/10/
2014
23/09/
2014
05/0
9/20
14
20/08/
2014
04/08/
2014
17/0
7/20
14
01/07/
2014
13/06/
2014
28/0
5/20
14
12/05/
2014
25
20
15
10
5
0
Date
Nu
mb
er
of
Vis
its
_X=11.9
UCL=25.60
LCL=-1.80
Number of visits (daily)
65432
25
20
15
10
5
0
Mtday
nu
mb
er
of
vis
its
Boxplot of number of visits
Monday is
statistically
higher than the
other 4 days of
the week

Question 5: Do you routinely apply
these techniques to your work?
a) No, I didn’t know the techniques existed
b) No, I know the techniques, but don’t have the time
c) Yes, to some extent
d) Yes all the time

Question 6: How many people need to be
‘experts’ in Quality Improvement in an NHS
organisation of 4000 staff?
a) 6 people
b) 63 people
c) 648 people
d) 2129 people
Calculate the square root of the total number of
people in your organisation. This is the number of QI
‘Expert’ that you need.

If I had an hour to save the world I
Would Spend 55 Minutes Defining the
Problem and then Five Minutes
Solving It
(Einstein – Misquoted)
In God we Trust, everybody else bring
data
(W Edwards Deming)