queensland museum highlight report
TRANSCRIPT

Reporting Framework
ST
RA
TE
GIC
P
RIO
RIT
IES 01 Driver analysis scorecard
02 Factors
03 Factors by division
WO
RK
PL
AC
E
CL
IMA
TE 04 Workplace climate
05 Workplace climate by division
06 Workplace climate by item
07 Most changed since 2015, by item
08 Flexible work options
09 Domestic and family violence
10 Intention to leave your organisation
11 Bullying and sexual harassment
12 Your view
AP
PE
ND
ICE
S 13 Appendix A – Strategic priorities by demographics
14 Appendix B – Strategic priorities and factors by item
15 Appendix C – How to interpret this report
16 Appendix D – Evolutions in the Working for Queensland research program
Report Content
Response Rate:
75%Returned Surveys:
241
PurposeThe Highlight Report presents key results from the 2016 Working for Queensland survey, which was conducted from mid April to early May 2016. Results reflect the respondents from your agency.
Note on the response rateThe displayed response rate was calculated using statistical workforce data (Minimum Obligatory Human Resource Information) for March 2016.
Queensland Museum Highlight Report
www.orcinternational.com.auPage 1
Queensland MuseumWorking for Queensland survey 2016

Queensland Museum | Highlight Report
Reporting Framework
Strategic priorities: driver analysis
The first type of analysis is driver analysis, which is focused on survey results at the agency level. Driver analysis is designed to provide an understanding of the key drivers of three strategic priorities for your agency – agency engagement, organisational leadership and innovation.
The purpose of this analysis is to inform strategy development and resource investment across your agency.
Workplace climate
The second type of analysis relates to the workplace climate indices, which is focused on the workgroup level. The workplace climate indices have been grouped by topic so they more closely align with the way work, roles and responsibilities are broken up across agencies.
The index scores are calculated as a per cent positive average for the items in the grouping.
The purpose of this information is to provide workgroups with insight into their strengths and weaknesses by topic, so that the information can be easily discussed and actioned at the workgroup level.
All highlight reports include two different types of analysis, each of which provides a different lens through which to understand organisational climate and workplace improvement in your agency.
www.orcinternational.com.auPage 2
Queensland MuseumWorking for Queensland survey 2016
Queensland Museum | Highlight ReportRESPONSE SCALE : POSITIVE NEUTRAL NEGATIVE
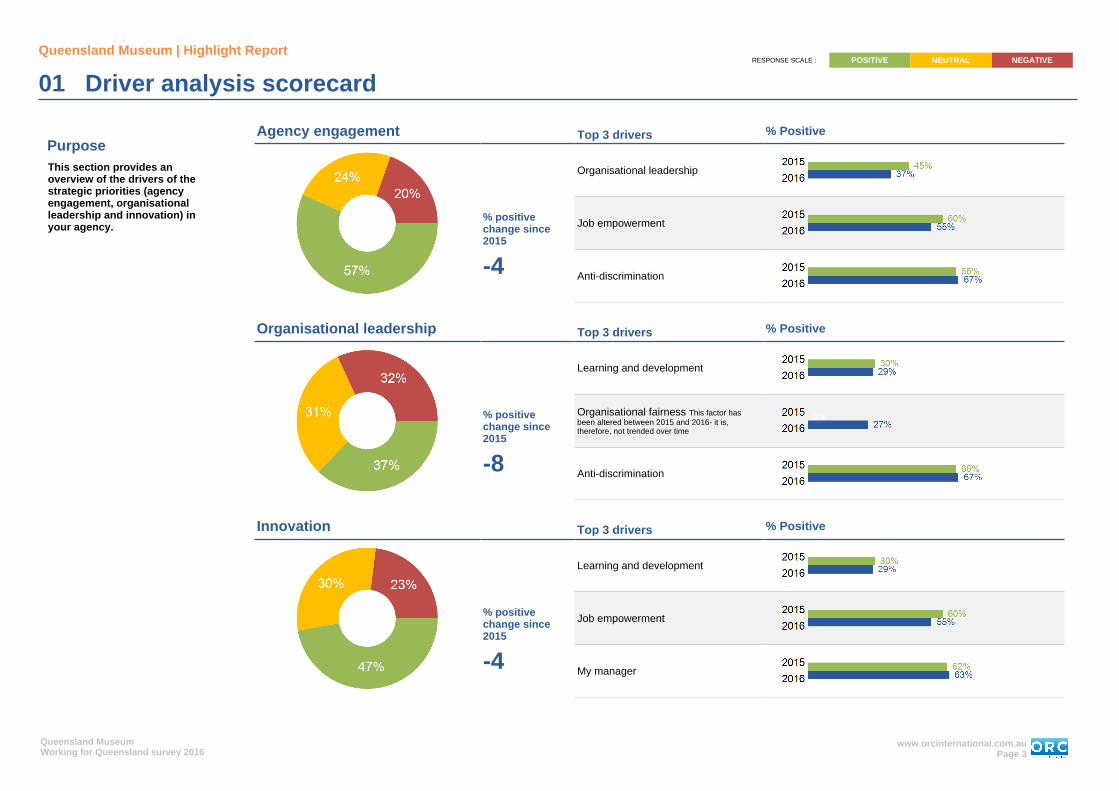
01 Driver analysis scorecard
PurposeThis section provides an overview of the drivers of the strategic priorities (agency engagement, organisational leadership and innovation) in your agency.
Agency engagement Top 3 drivers % Positive
Organisational leadership
% positive change since 2015
Job empowerment
-4 Anti-discrimination
Organisational leadership Top 3 drivers % Positive
Learning and development
% positive change since 2015
Organisational fairness This factor has been altered between 2015 and 2016- it is, therefore, not trended over time
-8 Anti-discrimination
Innovation Top 3 drivers % Positive
Learning and development
% positive change since 2015
Job empowerment
-4 My manager
www.orcinternational.com.auPage 3
Queensland MuseumWorking for Queensland survey 2016

Queensland Museum | Highlight ReportAt least 5 percent LESSAt least 5 percent GREATERCOMPARISONS:
RESPONSE SCALE : POSITIVE NEUTRAL NEGATIVE
QUINTILES: 4 & 51 & 2 302 Factors
PurposeThis section provides an overview of your agency’s 2016 strategic priorities* and factor results. This data is benchmarked against the Queensland public sector and other agency results, as well as being compared with the previous year’s results.
Understanding your agency’s data, across time and in relation to the Queensland public sector, will enable your agency to assess its progress in workplace improvement.
Response scale (%) % positive vs 2015vs Qld public sector 2016
Range of all agencies
Your agency quintile
Agency engagement* 57 24 20 57% -4 -3 41 - 81 4
Job empowerment 55 23 22 55% -5 -17 55 - 86 5
Workload and health % positive indicates those who have limited to no issues with workload and health
30 33 37 30% -8 -8 28 - 78 5
Learning and development 29 30 40 29% -1 -27 28 - 78 5
My workgroup 68 19 13 68% -1 -9 64 - 92 5
My manager 63 19 18 63% +1 -8 57 - 89 5
Organisational leadership* 37 31 32 37% -8 -16 32 - 81 5
Organisational fairness This factor has been altered between 2015 and 2016- it is, therefore, not trended over time
27 33 40 27% - -17 25 - 63 5
Anti-discrimination 67 27 6 67% +2 -3 52 - 97 4
Innovation* 47 30 23 47% -4 -14 46 - 80 5
www.orcinternational.com.auPage 4
Queensland MuseumWorking for Queensland survey 2016

Queensland Museum | Highlight ReportAt least 5 percent LESSAt least 5 percent GREATERCOMPARISONS:
03 Factors by division
PurposeThis section shows the breakdown of division and agency results for strategic priorities* and factors.
This section shows the % positive scores for divisions within the agency Que
ensl
and
Mus
eum
% p
ositi
ve
Bio
dive
rsity
and
Geo
scie
nces
Cor
pora
te S
ervi
ces
Cul
ture
s an
d H
isto
ries
Exh
ibiti
ons
Lear
ning
Ope
ratio
ns a
nd C
omm
uniti
es (
Oth
er)
Oth
er
Pub
lic E
ngag
emen
t
Vis
itor
Ser
vice
s
Number of respondents 241 32 21 20 21 16 13 24 26 50
Agency engagement* 57% 83% 56% 46% 29% 64% 51% 62% 59% 59%
Job empowerment 55% 82% 54% 53% 31% 64% 64% 60% 56% 47%
Workload and health % positive indicates those who have limited to no issues with workload and health
30% 35% 22% 14% 17% 33% 21% 19% 28% 50%
Learning and development 29% 49% 29% 36% 6% 40% 26% 27% 24% 32%
My workgroup 68% 79% 79% 60% 60% 89% 81% 79% 63% 56%
My manager 63% 83% 61% 67% 37% 72% 84% 70% 67% 52%
Organisational leadership* 37% 67% 33% 29% 23% 45% 27% 35% 35% 40%
Organisational fairness This factor has been altered between 2015 and 2016- it is, therefore, not trended over time
27% 43% 22% 15% 12% 35% 33% 25% 28% 29%
Anti-discrimination 67% 84% 66% 63% 39% 77% 55% 75% 80% 72%
Innovation* 47% 61% 52% 36% 28% 68% 46% 62% 51% 38%
www.orcinternational.com.auPage 5
Queensland MuseumWorking for Queensland survey 2016

Queensland Museum | Highlight ReportAt least 5 percent LESSAt least 5 percent GREATERCOMPARISONS:
RESPONSE SCALE : POSITIVE NEUTRAL NEGATIVE
QUINTILES: 4 & 51 & 2 304 Workplace climate
PurposeThis section provides an overview of your agency’s workplace climate index results. This data is benchmarked against the Queensland public sector and other agency results, as well as being compared with the previous year’s results.
Understanding your agency’s data, across time and in relation to the Queensland public sector, will enable your agency to assess its progress in workplace improvement.
Response scale (%) % positive vs 2015vs Qld public sector 2016
Range of all agencies
Your agency quintile
Safety, health and wellness 52 25 23 52% -5 -5 45 - 83 5
Effectiveness and innovation 47 27 26 47% -2 -11 47 - 76 5
People and relationships 67 19 14 67% -1 -10 65 - 92 5
Fairness and trust 49 29 22 49% +1 -10 43 - 77 5
Performance and development 37 28 35 37% +3 -18 37 - 73 5
Leadership and engagement 54 24 22 54% -3 -9 48 - 83 5
My job 66 19 16 66% -7 -13 60 - 87 5
www.orcinternational.com.auPage 6
Queensland MuseumWorking for Queensland survey 2016

Queensland Museum | Highlight ReportAt least 5 percent LESSAt least 5 percent GREATERCOMPARISONS:
05 Workplace climate by division
PurposeThis section shows the breakdown of division and agency results for each workplace climate index.
This section shows the % positive scores for divisions within the agency Que
ensl
and
Mus
eum
% p
ositi
ve
Bio
dive
rsity
and
Geo
scie
nces
Cor
pora
te S
ervi
ces
Cul
ture
s an
d H
isto
ries
Exh
ibiti
ons
Lear
ning
Ope
ratio
ns a
nd C
omm
uniti
es (
Oth
er)
Oth
er
Pub
lic E
ngag
emen
t
Vis
itor
Ser
vice
s
Number of respondents 241 32 21 20 21 16 13 24 26 50
Safety, health and wellness 52% 61% 46% 41% 46% 53% 54% 42% 53% 60%
Effectiveness and innovation 47% 58% 49% 43% 32% 56% 48% 54% 48% 44%
People and relationships 67% 78% 78% 59% 60% 88% 78% 77% 63% 57%
Fairness and trust 49% 66% 47% 43% 31% 59% 47% 54% 55% 49%
Performance and development 37% 54% 38% 46% 10% 47% 43% 40% 33% 36%
Leadership and engagement 54% 79% 52% 51% 31% 63% 59% 59% 57% 51%
My job 66% 91% 68% 65% 34% 73% 72% 71% 66% 59%
www.orcinternational.com.auPage 7
Queensland MuseumWorking for Queensland survey 2016

Queensland Museum | Highlight ReportAt least 5 percent LESSAt least 5 percent GREATERCOMPARISONS:
RESPONSE SCALE : POSITIVE NEUTRAL NEGATIVE
06 Workplace climate by item
PurposeThis section provides your agency’s workplace climate index results by item. This data is benchmarked against the Queensland public sector and is compared with the previous year’s results.
Safety, health and wellnessResponse scale (%) % positive vs 2015
vs Qld public
sector 2016
Q23a I am overloaded with work % positive indicates those who “strongly disagree” or “disagree” with this statement
24 30 46 24% -3 -5
Q23b I feel burned out by my work % positive indicates those who “strongly disagree” or “disagree” with this statement
33 34 33 33% -10 -9
Q23e My work has a negative impact on my health % positive indicates those who “strongly disagree” or “disagree” with this statement
34 35 31 34% -11 -11
Q24h People in my workgroup are committed to workplace safety
78 17 4 78% 0 -4
Q25b My workplace culture supports people to achieve a good work/life balance
54 24 23 54% -6 -8
Q25c There is adequate focus on workplace safety at my workplace
81 14 5 81% +2 +2
Q34e Your work-life balance % positive indicates those who responded with “very satisfied” or “satisfied”
59 24 17 59% -4 -4
www.orcinternational.com.auPage 8
Queensland MuseumWorking for Queensland survey 2016

Queensland Museum | Highlight ReportAt least 5 percent LESSAt least 5 percent GREATERCOMPARISONS:
RESPONSE SCALE : POSITIVE NEUTRAL NEGATIVE
06 Workplace climate by item (cont.)
PurposeThis section provides your agency’s workplace climate index results by item. This data is benchmarked against the Queensland public sector and is compared with the previous year’s results.
Effectiveness and innovationResponse scale (%) % positive vs 2015
vs Qld public
sector 2016
Q22b I have the tools I need to do my job effectively 49 21 29 49% 0 -22
Q22c I get the information I need to do my job well 45 25 30 45% -5 -23
Q22d I have the authority necessary to do my job effectively 47 30 23 47% -4 -23
Q23c I feel my job is secure 38 23 39 38% -3 -18
Q23dThere is too much 'red tape' in my work (e.g. Regulatory or administrative processes) % positive indicates those who “strongly disagree” or “disagree” with this statement
18 33 50 18% -5 -2
Q25d Approval processes at my workplace are excessive % positive indicates those who “strongly disagree” or “disagree” with this statement
14 37 49 14% 0 -5
Q25eDisruptions and/or noise at my workplace make it hard to get things done % positive indicates those who “strongly disagree” or “disagree” with this statement
44 26 30 44% 0 -3
Q26a My workplace has undergone significant change in the past 12 months
69 19 12 69% +14 +16
Q27a I get the opportunity to develop new and better ways of doing my job
42 31 27 42% -4 -17
www.orcinternational.com.auPage 9
Queensland MuseumWorking for Queensland survey 2016

Queensland Museum | Highlight ReportAt least 5 percent LESSAt least 5 percent GREATERCOMPARISONS:
RESPONSE SCALE : POSITIVE NEUTRAL NEGATIVE
06 Workplace climate by item (cont.)
PurposeThis section provides your agency’s workplace climate index results by item. This data is benchmarked against the Queensland public sector and is compared with the previous year’s results.
Effectiveness and innovation (cont.)Response scale (%) % positive vs 2015
vs Qld public
sector 2016
Q27b I am encouraged to make suggestions about improving work processes and/or services
58 21 21 58% -1 -10
Q27c Management is willing to act on suggestions to improve how things are done
38 33 29 38% -1 -16
Q27d My workgroup uses research and expertise to identify better practice
43 34 23 43% -7 -15
Q27e My workgroup always tries to improve its performance 58 29 13 58% -9 -15
Q27f My organisation is open to new ideas 44 31 26 44% -5 -13
Q34c Your physical working environment % positive indicates those who responded with “very satisfied” or “satisfied”
58 25 17 58% +1 -12
Q34d The location of your work % positive indicates those who responded with “very satisfied” or “satisfied”
84 12 4 84% +3 +4
Q34f Your ability to ‘make a difference’ to the community % positive indicates those who responded with “very satisfied” or “satisfied”
53 31 16 53% -7 -13
www.orcinternational.com.auPage 10
Queensland MuseumWorking for Queensland survey 2016

Queensland Museum | Highlight ReportAt least 5 percent LESSAt least 5 percent GREATERCOMPARISONS:
RESPONSE SCALE : POSITIVE NEUTRAL NEGATIVE
06 Workplace climate by item (cont.)
PurposeThis section provides your agency’s workplace climate index results by item. This data is benchmarked against the Queensland public sector and is compared with the previous year’s results.
People and relationshipsResponse scale (%) % positive vs 2015
vs Qld public
sector 2016
Q24a People in my workgroup treat each other with respect 65 15 20 65% +2 -11
Q24b I receive help and support from other people in my workgroup
72 17 11 72% 0 -12
Q24c People in my workgroup are honest, open and transparent in their dealings
56 23 21 56% -5 -12
Q24d People in my workgroup use their time and resources efficiently
55 28 17 55% -3 -12
Q24e People in my workgroup treat customers with respect 83 13 5 82% -1 -4
Q24f People in my workgroup are committed to delivering excellent service to customers
80 14 6 80% +1 -3
Q24g People in my workgroup do their jobs effectively 65 22 13 65% 0 -10
Q24iPeople in my workgroup work effectively with other workgroups in my organisation to deliver services to our customers
63 20 16 63% -5 -15
www.orcinternational.com.auPage 11
Queensland MuseumWorking for Queensland survey 2016

Queensland Museum | Highlight ReportAt least 5 percent LESSAt least 5 percent GREATERCOMPARISONS:
RESPONSE SCALE : POSITIVE NEUTRAL NEGATIVE
06 Workplace climate by item (cont.)
PurposeThis section provides your agency’s workplace climate index results by item. This data is benchmarked against the Queensland public sector and is compared with the previous year’s results.
Fairness and trustResponse scale (%) % positive vs 2015
vs Qld public
sector 2016
Q25a My workplace has an inclusive culture where diversity is valued and respected
63 27 10 63% -3 -11
Q25f Performance is assessed and rewarded fairly in my workplace
24 34 42 24% +1 -11
Q25g I am confident that poor performance will be appropriately addressed in my workplace
23 28 49 23% 0 -17
Q25h People are treated fairly and consistently in my workplace
29 33 38 29% -3 -23
Q25i People take responsibility for their decisions and actions in my workplace
33 36 31 33% +4 -21
Q30a My senior manager demonstrates honesty and integrity 55 27 18 55% -1 -12
Q31e Recruitment and promotion decisions in this organisation are fair
24 33 42 24% -3 -15
Q32a Age is not a barrier to success in my organisation 66 25 8 66% +1 -4
www.orcinternational.com.auPage 12
Queensland MuseumWorking for Queensland survey 2016

Queensland Museum | Highlight ReportAt least 5 percent LESSAt least 5 percent GREATERCOMPARISONS:
RESPONSE SCALE : POSITIVE NEUTRAL NEGATIVE
06 Workplace climate by item (cont.)
PurposeThis section provides your agency’s workplace climate index results by item. This data is benchmarked against the Queensland public sector and is compared with the previous year’s results.
Fairness and trust (cont.)Response scale (%) % positive vs 2015
vs Qld public
sector 2016
Q32b Gender is not a barrier to success in my organisation 71 23 6 71% +3 -3
Q32c Disability is not a barrier to success in my organisation 64 31 5 64% +4 +1
Q32d Cultural background is not a barrier to success in my organisation
65 29 6 65% -1 -8
Q32e Sexual orientation is not a barrier to success in my organisation
71 25 4 71% +2 -1
Q32f If I raised a complaint, I feel confident that it would be taken seriously
53 21 26 53% +11 -7
www.orcinternational.com.auPage 13
Queensland MuseumWorking for Queensland survey 2016

Queensland Museum | Highlight ReportAt least 5 percent LESSAt least 5 percent GREATERCOMPARISONS:
RESPONSE SCALE : POSITIVE NEUTRAL NEGATIVE
06 Workplace climate by item (cont.)
PurposeThis section provides your agency’s workplace climate index results by item. This data is benchmarked against the Queensland public sector and is compared with the previous year’s results.
Performance and development Response scale (%) % positive vs 2015
vs Qld public
sector 2016
Q28a I receive useful feedback on my performance 49 28 23 49% +8 -8
Q28b My performance is assessed against clear criteria 48 26 26 48% +13 -2
Q28c In my organisation, there are opportunities for me to develop my skills and knowledge
37 26 37 37% -5 -26
Q28d I am encouraged to pursue developmental opportunities in other workplaces
20 32 48 20% -2 -19
Q28e I am able to access relevant learning and development opportunities
33 31 37 33% +6 -29
Q28fLearning and development activities I have completed in the past 12 months have helped to improve my performance
29 36 35 29% -1 -31
Q28g I am satisfied with the opportunities available for career development
19 27 55 19% +7 -26
Q28h I have had productive conversations with my manager on my performance in the past 12 months
48 22 30 48% +10 -7
Q28i I develop new knowledge and skills through undertaking tasks at work
59 24 17 59% 0 -14
Q31b My organisation is committed to developing its employees
30 32 38 30% -10 -24
www.orcinternational.com.auPage 14
Queensland MuseumWorking for Queensland survey 2016

Queensland Museum | Highlight ReportAt least 5 percent LESSAt least 5 percent GREATERCOMPARISONS:
RESPONSE SCALE : POSITIVE NEUTRAL NEGATIVE
06 Workplace climate by item (cont.)
PurposeThis section provides your agency’s workplace climate index results by item. This data is benchmarked against the Queensland public sector and is compared with the previous year’s results.
Leadership and engagementResponse scale (%) % positive vs 2015
vs Qld public
sector 2016
Q29a My manager treats employees with dignity and respect 70 15 15 70% +2 -8
Q29b My manager listens to what I have to say 71 15 15 71% -1 -7
Q29c My manager keeps me informed about what’s going on 59 18 23 59% +1 -9
Q29d My manager understands my work 62 19 18 62% -2 -10
Q29e My manager creates a shared sense of purpose 60 21 19 60% 0 -8
Q29f My manager demonstrates honesty and integrity 68 18 15 68% -1 -9
Q29g My manager draws the best out of me 50 29 21 50% +7 -8
Q31a In my organisation, the leadership is of high quality 45 27 28 45% -2 -9
www.orcinternational.com.auPage 15
Queensland MuseumWorking for Queensland survey 2016

Queensland Museum | Highlight ReportAt least 5 percent LESSAt least 5 percent GREATERCOMPARISONS:
RESPONSE SCALE : POSITIVE NEUTRAL NEGATIVE
06 Workplace climate by item (cont.)
PurposeThis section provides your agency’s workplace climate index results by item. This data is benchmarked against the Queensland public sector and is compared with the previous year’s results.
Leadership and engagement (cont.)Response scale (%) % positive vs 2015
vs Qld public
sector 2016
Q31c Management model the behaviours expected of all employees
35 33 32 35% -4 -17
Q31d In my organisation, the leadership operates with a high level of integrity
38 33 30 38% -8 -17
Q31f My organisation is well managed 30 32 37 30% -17 -18
Q33a I would recommend my organisation as a great place to work
46 27 26 46% -7 -15
Q33b I am proud to tell others I work for my organisation 70 18 12 70% -8 +2
Q33c I feel strong personal attachment to my organisation 69 19 12 69% -4 +9
Q33d My organisation motivates me to help it achieve its objectives
49 28 23 49% +1 -5
Q33e My organisation inspires me to do the best in my job 48 27 25 48% -1 -7
www.orcinternational.com.auPage 16
Queensland MuseumWorking for Queensland survey 2016

Queensland Museum | Highlight ReportAt least 5 percent LESSAt least 5 percent GREATERCOMPARISONS:
RESPONSE SCALE : POSITIVE NEUTRAL NEGATIVE
06 Workplace climate by item (cont.)
PurposeThis section provides your agency’s workplace climate index results by item. This data is benchmarked against the Queensland public sector and is compared with the previous year’s results.
My jobResponse scale (%) % positive vs 2015
vs Qld public
sector 2016
Q21a I understand what is expected of me to do well in my job
78 11 10 78% 0 -12
Q21b I understand how my work contributes to my organisation's objectives
80 10 9 80% -5 -11
Q22a I have a choice in deciding how I do my work 63 18 18 63% -8 -5
Q22e My job gives me opportunities to utilise my skills 56 24 19 56% -11 -20
Q22f I enjoy the work in my current job 65 21 15 65% -5 -12
Q22g My job gives me a feeling of personal accomplishment 54 24 21 54% -11 -16
Q34a The degree to which your work is interesting/challenging % positive indicates those who responded with “very satisfied” or “satisfied”
64 20 16 64% -9 -12
Q34b Your ability to work on your own initiative % positive indicates those who responded with “very satisfied” or “satisfied”
70 17 13 70% -3 -11
Q35
All things considered, how satisfied are you with your current job? % positive indicates those who responded with “very satisfied” or “satisfied”
58 21 21 58% -8 -16
www.orcinternational.com.auPage 17
Queensland MuseumWorking for Queensland survey 2016

Queensland Museum | Highlight ReportAt least 5 percent LESSAt least 5 percent GREATERCOMPARISONS:
07 Most changed since 2015, by item
PurposeThis section identifies your agency’s areas of improvement and highlights good news stories, while also identifying areas that may need attention.
NOTE: Survey items in scope for this section were single response non-demographic questions that were asked of all respondents in 2016 as well as in 2015 and that excluded a ‘na’ option. ‘My workplace has undergone significant change in the past 12 months’ has not been included in the analysis.
The survey items with the most positive change Index % positive 2016 percentage change
My performance is assessed against clear criteria Performance and development 48% +13
If I raised a complaint, I feel confident that it would be taken seriously Fairness and trust 53% +11
I have had productive conversations with my manager on my performance in the past 12 months Performance and development 48% +10
I receive useful feedback on my performance Performance and development 49% +8
I am satisfied with the opportunities available for career development Performance and development 19% +7
The survey items with the most negative change Index % positive 2016 percentage change
My organisation is well managed Leadership and engagement 30% -17
My job gives me a feeling of personal accomplishment My job 54% -11
My work has a negative impact on my health % positive indicates those who “strongly disagree” or “disagree” with this statement i.e. limited to no issues with negative health impacts
Safety, heath and wellness 34% -11
My job gives me opportunities to utilise my skills My job 56% -11
I feel burned out by my work % positive indicates those who “strongly disagree” or “disagree” with this statement i.e. limited to no issues with burn out
Safety, heath and wellness 33% -10
www.orcinternational.com.auPage 18
Queensland MuseumWorking for Queensland survey 2016

Queensland Museum | Highlight ReportAt least 5 percent LESSAt least 5 percent GREATERCOMPARISONS:
08 Flexible work options
PurposeFlexible work arrangements are a very important element of contemporary workplaces. Well executed and managed flexible work arrangements improve employee engagement, retention and attraction. This section outlines the types of flexible work arrangements being used and highlights some potential barriers to their take-up.
NOTE: Multi-select questions may not add up to 100 per cent.
Part time work 20% +2
Part-year work/annualised hours 0% 0
Job sharing 3% +1
Compressed work hours 1% 0
Flexible work hours/shifts 28% +9
Term-time working 0% -1
Casual/on call 11% +8
Telecommuting 5% +2
Hot desks 1% -1
Purchased leave/extended leave/deferred salary schemes 0% -1
Leave at half pay 2% -2
Other, please specify 2% 0
None of the above 41% -14
Do you currently use any of the following flexible work options? Proportionvs Qld public
sector
Used no flexible work option 41% -14
Used flexible workplace option% proportion indicates those that used at least one of the 11 work place options
59% +14
www.orcinternational.com.auPage 19
Queensland MuseumWorking for Queensland survey 2016
Queensland Museum | Highlight ReportAt least 5 percent LESSAt least 5 percent GREATERCOMPARISONS:
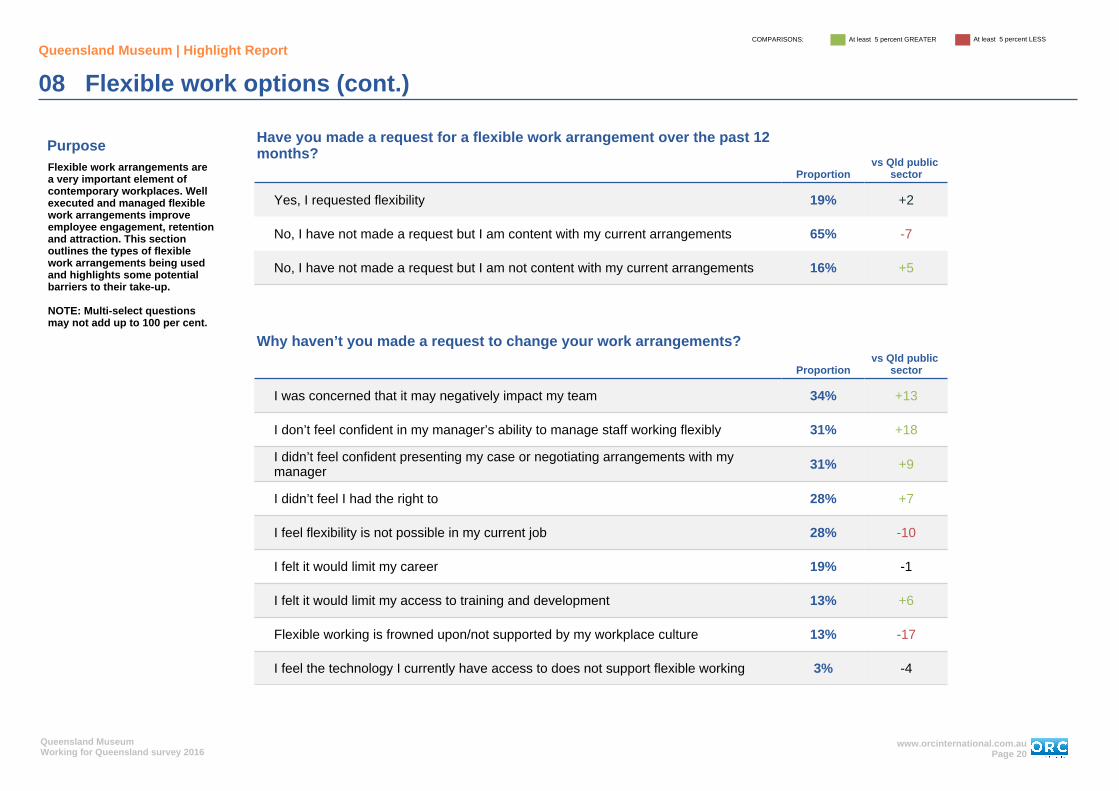
08 Flexible work options (cont.)
PurposeFlexible work arrangements are a very important element of contemporary workplaces. Well executed and managed flexible work arrangements improve employee engagement, retention and attraction. This section outlines the types of flexible work arrangements being used and highlights some potential barriers to their take-up.
NOTE: Multi-select questions may not add up to 100 per cent.
Have you made a request for a flexible work arrangement over the past 12 months?
Proportionvs Qld public
sector
Yes, I requested flexibility 19% +2
No, I have not made a request but I am content with my current arrangements 65% -7
No, I have not made a request but I am not content with my current arrangements 16% +5
Why haven’t you made a request to change your work arrangements?
Proportionvs Qld public
sector
I was concerned that it may negatively impact my team 34% +13
I don’t feel confident in my manager’s ability to manage staff working flexibly 31% +18
I didn’t feel confident presenting my case or negotiating arrangements with my manager 31% +9
I didn’t feel I had the right to 28% +7
I feel flexibility is not possible in my current job 28% -10
I felt it would limit my career 19% -1
I felt it would limit my access to training and development 13% +6
Flexible working is frowned upon/not supported by my workplace culture 13% -17
I feel the technology I currently have access to does not support flexible working 3% -4
www.orcinternational.com.auPage 20
Queensland MuseumWorking for Queensland survey 2016
Queensland Museum | Highlight ReportAt least 5 percent LESSAt least 5 percent GREATERCOMPARISONS:
RESPONSE SCALE : POSITIVE NEUTRAL NEGATIVE
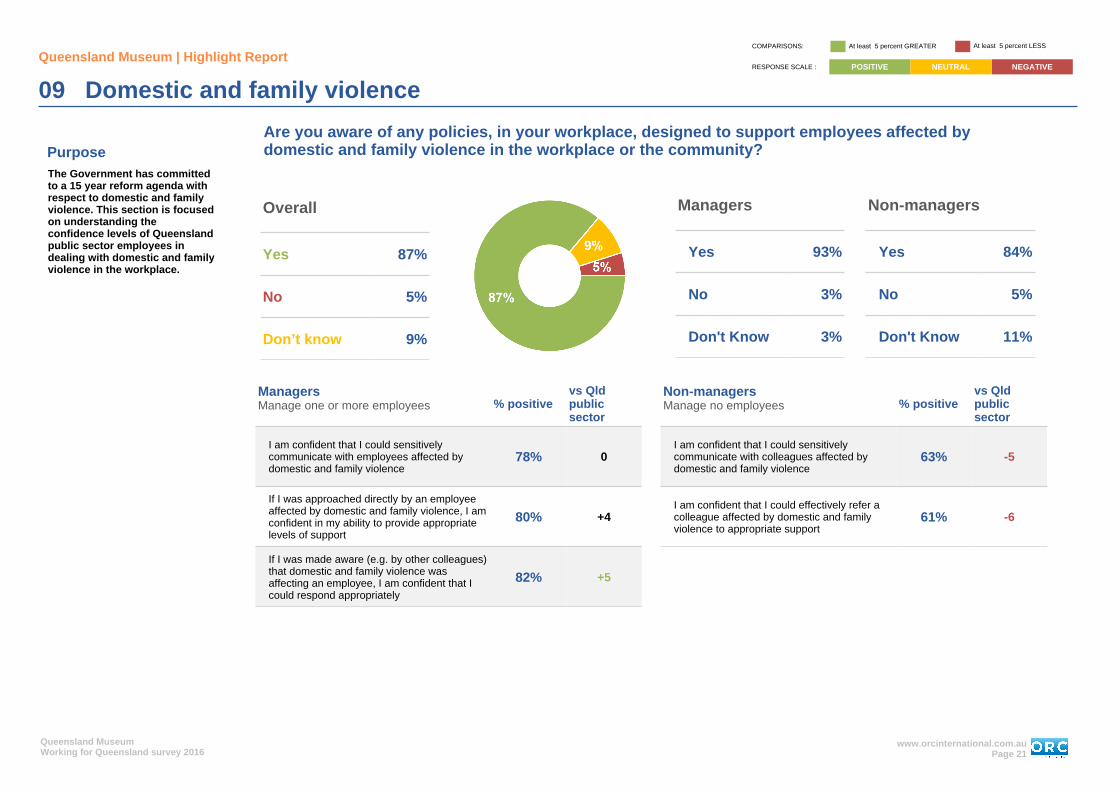
09 Domestic and family violence
PurposeThe Government has committed to a 15 year reform agenda with respect to domestic and family violence. This section is focused on understanding the confidence levels of Queensland public sector employees in dealing with domestic and family violence in the workplace.
ManagersManage one or more employees % positive
vs Qld public sector
I am confident that I could sensitively communicate with employees affected by domestic and family violence
78% 0
If I was approached directly by an employee affected by domestic and family violence, I am confident in my ability to provide appropriate levels of support
80% +4
If I was made aware (e.g. by other colleagues) that domestic and family violence was affecting an employee, I am confident that I could respond appropriately
82% +5
Non-managersManage no employees % positive
vs Qld public sector
I am confident that I could sensitively communicate with colleagues affected by domestic and family violence
63% -5
I am confident that I could effectively refer a colleague affected by domestic and family violence to appropriate support
61% -6
Non-managers
Yes 84%
No 5%
Don't Know 11%
Managers
Yes 93%
No 3%
Don't Know 3%
Overall
Yes 87%
No 5%
Don’t know 9%
Are you aware of any policies, in your workplace, designed to support employees affected by domestic and family violence in the workplace or the community?
www.orcinternational.com.auPage 21
Queensland MuseumWorking for Queensland survey 2016

Queensland Museum | Highlight ReportRESPONSE SCALE : POSITIVE NEUTRAL NEGATIVE
10 Intention to leave your organisation
PurposeThe purpose of this section is to show the intention of employees to leave the organisation and their reasons for leaving.
NOTE: Multi-select questions may not add up to 100 per cent.
% positive change since 2015
53% -4
of employees agreed with the statement:
I intend to stay in my organisation within the next 12 months.
Reasons for leaving Proportion
Career or job opportunities 67%
The workplace culture 62%
Pay and conditions 54%
Professional/personal development 46%
Your relationship with your manager 46%
Job security 44%
Stress/Health 33%
Other (please specify) 21%
Contract expiring 15%
Work hours 15%
Balancing work and life commitments 10%
Family/carer responsibilities 8%
Retirement 8%
Your relationship with your colleagues 5%
Travel plans 3%
Fit between work and your interests 3%
The location of your workplace or the time spent commuting 0%
www.orcinternational.com.auPage 22
Queensland MuseumWorking for Queensland survey 2016

Queensland Museum | Highlight ReportRESPONSE SCALE : POSITIVE NEUTRAL NEGATIVE
11 Bullying and sexual harassment
PurposeThis section is focused on understanding the prevalence and sources of bullying and sexual harassment as well as the rate of reporting and barriers to reporting such incidences.
NOTE: Multi-select questions may not add up to 100 per cent.
During the last 12 months have you witnessed bullying or sexual harassment in your workplace?
Yes 34%
No 58%
Don’t know 9%
During the last 12 months, have you been subjected to any of the following in your workplace?
Bullying 22%
Sexual Harassment 2%
No 70%
Don't Know 6%
www.orcinternational.com.auPage 23
Queensland MuseumWorking for Queensland survey 2016

Queensland Museum | Highlight Report
11 Bullying and sexual harassment (cont.)
PurposeThis section is focused on understanding the prevalence and sources of bullying and sexual harassment as well as the rate of reporting and barriers to reporting such incidences.
NOTE: Multi-select questions may not add up to 100 per cent.
Did you report the BULLYING?
Why did you not report the BULLYING? Proportion
I did not think any action would be taken 53%
I did not want to upset relationships in the workplace 47%
I did not have enough evidence 41%
Managers accepted the behaviour 38%
It could affect my career 34%
I did not think it was worth the hassle of going through the report process 22%
I did not think the bullying was serious enough 19%
Other 9%
I did not know how to report it 6%
The matter was resolved informally 6%
Who were you BULLIED by? Proportion
A fellow worker 42%
Your immediate manager/supervisor 42%
A senior manager 31%
A group of fellow workers 27%
A member of the public 13%
Prefer not to specify 8%
A client/customer 6%
A worker that reports to you 4%
A representative of another agency 2%
A consultant/service provider 0%
Other 0%
What type of BULLYING did you experience? Proportion
Verbal abuse 60%
Inappropriate and unfair application of work policies or rules 42%
Other 42%
Physical behaviour 15%
Interference with your personal property or work equipment 6%
Cyber bullying 4%
'Initiations' or pranks 0%
www.orcinternational.com.auPage 24
Queensland MuseumWorking for Queensland survey 2016
Queensland Museum | Highlight ReportAt least 5 percent LESSAt least 5 percent GREATERCOMPARISONS:
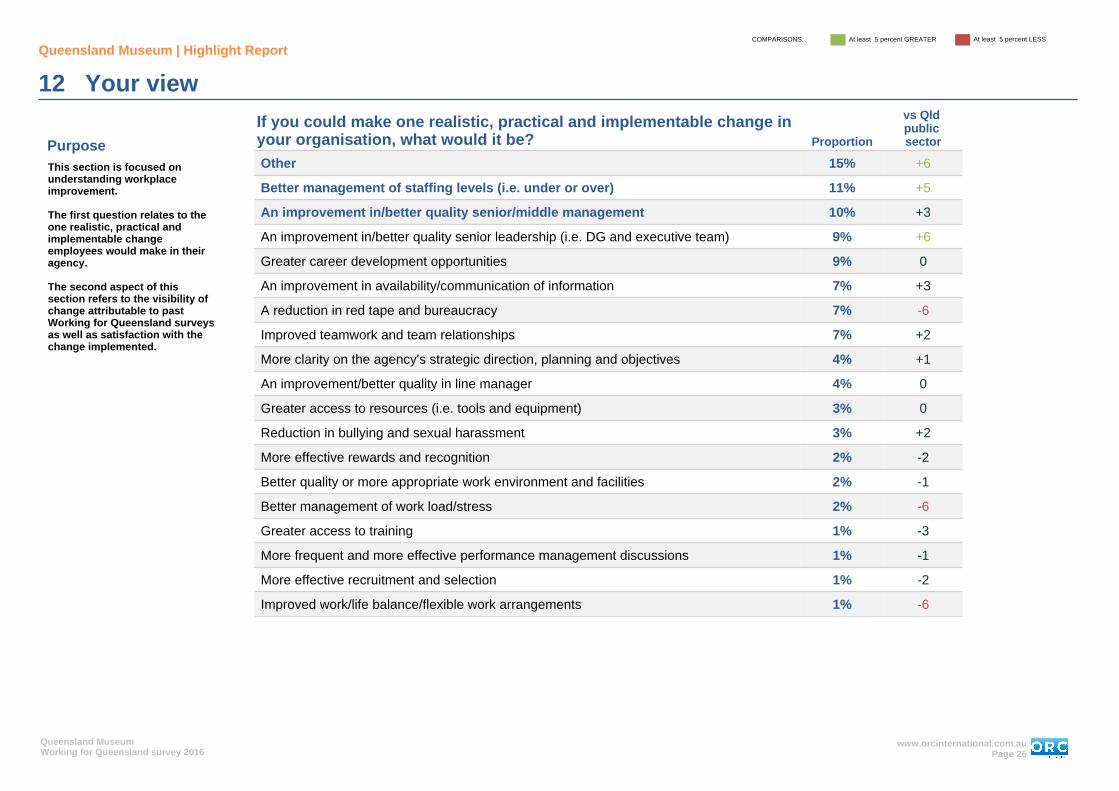
12 Your view
PurposeThis section is focused on understanding workplace improvement.
The first question relates to the one realistic, practical and implementable change employees would make in their agency.
The second aspect of this section refers to the visibility of change attributable to past Working for Queensland surveys as well as satisfaction with the change implemented.
If you could make one realistic, practical and implementable change in your organisation, what would it be? Proportion
vs Qld public sector
Other 15% +6
Better management of staffing levels (i.e. under or over) 11% +5
An improvement in/better quality senior/middle management 10% +3
An improvement in/better quality senior leadership (i.e. DG and executive team) 9% +6
Greater career development opportunities 9% 0
An improvement in availability/communication of information 7% +3
A reduction in red tape and bureaucracy 7% -6
Improved teamwork and team relationships 7% +2
More clarity on the agency's strategic direction, planning and objectives 4% +1
An improvement/better quality in line manager 4% 0
Greater access to resources (i.e. tools and equipment) 3% 0
Reduction in bullying and sexual harassment 3% +2
More effective rewards and recognition 2% -2
Better quality or more appropriate work environment and facilities 2% -1
Better management of work load/stress 2% -6
Greater access to training 1% -3
More frequent and more effective performance management discussions 1% -1
More effective recruitment and selection 1% -2
Improved work/life balance/flexible work arrangements 1% -6
www.orcinternational.com.auPage 25
Queensland MuseumWorking for Queensland survey 2016

Queensland Museum | Highlight ReportRESPONSE SCALE : POSITIVE NEUTRAL NEGATIVE
12 Your view (cont.)
PurposeThis section is focused on understanding workplace improvement.
The first question relates to the one realistic, practical and implementable change employees would make in their agency.
The second aspect of this section refers to the visibility of change attributable to past Working for Queensland surveys as well as satisfaction with the change implemented.
Have you noticed any action your organisation has taken as a result of last year’s Working for Queensland survey?
Yes 46%
No 46%
No, but I have not worked long in my organisation 8%
How satisfied are you with your organisation’s action in response to last year’s Working for Queensland survey?
Positive 50%
Neutral 38%
Negative 11%
www.orcinternational.com.auPage 26
Queensland MuseumWorking for Queensland survey 2016

Queensland Museum | Highlight ReportAt least 5 percent LESSAt least 5 percent GREATERCOMPARISONS:
13 Appendix A – Strategic priorities by demographics
PurposeThis section enables you to understand the perceptions of the varying demographic groups of your workforce for each of the strategic priorities (agency engagement, organisational leadership and innovation).
“Restricted” indicates a group with less than 10 respondentsNumber of
respondents
Agency engagement(% positive)
Organisational leadership
(% positive)Innovation
(% positive)
Queensland Museum 241 57% 37% 47%
Managerial statusManagers 62 66% 42% 58%
Non-managers 178 53% 36% 44%
Employment status Permanent 150 54% 33% 44%
Non-permanent 90 60% 44% 52%
Full-time statusFull-time basis 169 53% 34% 46%
Part-time basis 67 66% 47% 51%
FTE SalaryUnder $50,000 71 60% 36% 43%
$50,000 - $69,999 52 47% 31% 42%
$70,000 - $89,999 75 58% 38% 48%
$90,000 or over 41 63% 46% 60%
Time in agencyLess than 2 years 45 66% 52% 60%
2 to less than 6 years 72 49% 33% 42%
6 to less than 10 years 39 50% 21% 40%
10 years or more 85 62% 40% 48%
www.orcinternational.com.auPage 27
Queensland MuseumWorking for Queensland survey 2016

Queensland Museum | Highlight ReportAt least 5 percent LESSAt least 5 percent GREATERCOMPARISONS:
13 Appendix A – Strategic priorities by demographics (cont.)
PurposeThis section enables you to understand the perceptions of the varying demographic groups of your workforce for each of the strategic priorities (agency engagement, organisational leadership and innovation).
“Restricted” indicates a group with less than 10 respondentsNumber of
respondents
Agency engagement(% positive)
Organisational leadership
(% positive)Innovation
(% positive)
Queensland Museum 241 57% 37% 47%
Age34 years or younger 45 49% 35% 48%
35 to 44 years 68 52% 31% 44%
45 to 54 years 69 55% 36% 45%
55 years or older 58 69% 47% 53%
GenderFemale 147 59% 40% 50%
Male 92 52% 33% 42%
Type of workDirect service delivery 79 61% 38% 44%
Corporate services and administrative support/clerical 52 59% 32% 50%
Other 107 53% 40% 48%
www.orcinternational.com.auPage 28
Queensland MuseumWorking for Queensland survey 2016

Queensland Museum | Highlight ReportAt least 5 percent LESSAt least 5 percent GREATERCOMPARISONS:
14 Appendix B – Strategic priorities and factors by item
PurposeThis section provides detailed information for each strategic priority and factor to enable in-depth discussions, action planning and workshopping.
Strategic priorities % positive Vs 2015 % neutral Vs 2015 % negative Vs 2015
Agency engagement
Q33a I would recommend my organisation as a great place to work 46% -7 27% +2 26% +5
Q33b I am proud to tell others I work for my organisation 70% -8 18% +4 12% +4
Q33c I feel strong personal attachment to my organisation 69% -4 19% +1 12% +3
Q33d My organisation motivates me to help it achieve its objectives 49% +1 28% -3 23% +2
Q33e My organisation inspires me to do the best in my job 48% -1 27% -6 25% +7
Organisational leadership
Q31a In my organisation, the leadership is of high quality 45% -2 27% +1 28% +1
Q31c Management model the behaviours expected of all employees 35% -4 33% +5 32% -2
Q31d In my organisation, the leadership operates with a high level of integrity 38% -8 33% +6 30% +2
Q31f My organisation is well managed 30% -17 32% +2 37% +14
Innovation
Q27a I get the opportunity to develop new and better ways of doing my job 42% -4 31% +5 27% -1
Q27b I am encouraged to make suggestions about improving work processes and/or services 58% -1 21% +2 21% 0
Q27c Management is willing to act on suggestions to improve how things are done 38% -1 33% +5 29% -5
Q27d My workgroup uses research and expertise to identify better practice 43% -7 34% +6 23% 0
Q27e My workgroup always tries to improve its performance 58% -9 29% +9 13% +1
Q27f My organisation is open to new ideas 44% -5 31% +4 26% +1
www.orcinternational.com.auPage 29
Queensland MuseumWorking for Queensland survey 2016

Queensland Museum | Highlight ReportAt least 5 percent LESSAt least 5 percent GREATERCOMPARISONS:
14 Appendix B – Strategic priorities and factors by item (cont.)
PurposeThis section provides detailed information for each strategic priority and factor to enable in-depth discussions, action planning and workshopping.
Factors % positive Vs 2015 % neutral Vs 2015 % negative Vs 2015
Job empowerment
Q22a I have a choice in deciding how I do my work 63% -8 18% +7 18% +2
Q22b I have the tools I need to do my job effectively 49% 0 21% 0 29% 0
Q22c I get the information I need to do my job well 45% -5 25% -2 30% +8
Q22d I have the authority necessary to do my job effectively 47% -4 30% +8 23% -4
Q22e My job gives me opportunities to utilise my skills 56% -11 24% +9 19% +1
Q34b Your ability to work on your own initiative 70% -3 17% +6 13% -3
Workload and health
Q23a I am overloaded with work % positive indicates those who “strongly disagree” or “disagree” with this statement i.e. limited to no issues with overload 24% -3 30% -1 46% +4
Q23b I feel burned out by my work % positive indicates those who “strongly disagree” or “disagree” with this statement i.e. limited to no issues with burn out 33% -10 34% +8 33% +2
Q23e My work has a negative impact on my health % positive indicates those who “strongly disagree” or “disagree” with this statement i.e. limited to no issues with negative health impacts 34% -11 35% +7 31% +3
Learning and development
Q28c In my organisation, there are opportunities for me to develop my skills and knowledge 37% -5 26% 0 37% +5
Q28e I am able to access relevant learning and development opportunities 33% +6 31% -6 37% 0
Q28f Learning and development activities I have completed in the past 12 months have helped to improve my performance 29% -1 36% 0 35% +1
Q28g I am satisfied with the opportunities available for career development 19% +7 27% -7 55% -1
Q31b My organisation is committed to developing its employees 30% -10 32% +2 38% +8
www.orcinternational.com.auPage 30
Queensland MuseumWorking for Queensland survey 2016

Queensland Museum | Highlight ReportAt least 5 percent LESSAt least 5 percent GREATERCOMPARISONS:
14 Appendix B – Strategic priorities and factors by item (cont.)
PurposeThis section provides detailed information for each strategic priority and factor to enable in-depth discussions, action planning and workshopping.
Factors % positive Vs 2015 % neutral Vs 2015 % negative Vs 2015
My workgroup
Q24a People in my workgroup treat each other with respect 65% +2 15% +1 20% -3
Q24b I receive help and support from other people in my workgroup 72% 0 17% +3 11% -3
Q24c People in my workgroup are honest, open and transparent in their dealings 56% -5 23% +4 21% +1
Q24d People in my workgroup use their time and resources efficiently 55% -3 28% +5 17% -2
Q24e People in my workgroup treat customers with respect 83% -1 13% +2 5% 0
Q24f People in my workgroup are committed to delivering excellent service to customers 80% +1 14% +2 6% -2
Q24g People in my workgroup do their jobs effectively 65% 0 22% +2 13% -2
My manager
Q29a My manager treats employees with dignity and respect 70% +2 15% +4 15% -6
Q29b My manager listens to what I have to say 71% -1 15% +3 15% -2
Q29c My manager keeps me informed about what’s going on 59% +1 18% 0 23% 0
Q29d My manager understands my work 62% -2 19% +4 18% -2
Q29e My manager creates a shared sense of purpose 60% 0 21% +5 19% -6
Q29f My manager demonstrates honesty and integrity 68% -1 18% +2 15% -1
Q29g My manager draws the best out of me 50% +7 29% +1 21% -8
www.orcinternational.com.auPage 31
Queensland MuseumWorking for Queensland survey 2016

Queensland Museum | Highlight ReportAt least 5 percent LESSAt least 5 percent GREATERCOMPARISONS:
14 Appendix B – Strategic priorities and factors by item (cont.)
PurposeThis section provides detailed information for each strategic priority and factor to enable in-depth discussions, action planning and workshopping.
Factors % positive Vs 2015 % neutral Vs 2015 % negative Vs 2015
Organisational fairness
Q25f Performance is assessed and rewarded fairly in my workplace 24% +1 34% +3 42% -4
Q25g I am confident that poor performance will be appropriately addressed in my workplace 23% 0 28% +6 49% -6
Q25h People are treated fairly and consistently in my workplace 29% -3 33% +7 38% -4
Q25i People take responsibility for their decisions and actions in my workplace 33% +4 36% 0 31% -3
Q31e Recruitment and promotion decisions in this organisation are fair 24% -3 33% +2 42% +2
Anti-discrimination
Q32a Age is not a barrier to success in my organisation 66% +1 25% +3 8% -4
Q32b Gender is not a barrier to success in my organisation 71% +3 23% +1 6% -5
Q32c Disability is not a barrier to success in my organisation 64% +4 31% -3 5% -1
Q32d Cultural background is not a barrier to success in my organisation 65% -1 29% +1 6% 0
Q32e Sexual orientation is not a barrier to success in my organisation 71% +2 25% -2 4% 0
www.orcinternational.com.auPage 32
Queensland MuseumWorking for Queensland survey 2016

Queensland Museum | Highlight Report
15 Appendix C – How to interpret this report
% Positive, neutral and negative scores
Across Working for Queensland (WfQ) reporting, most data is expressed as % positive,% neutral or % negative.
• % positive presents the proportion of respondents who expressed a positive opinion or assessment i.e. combining ‘Strongly agree’ and ‘Agree’ responses.
• % neutral presents the proportion of respondents who expressed a neutral opinion or assessment.
• % negative presents the proportion of respondents who expressed a negative opinion or assessment i.e. combining ‘Strongly disagree’ and ‘Disagree’ responses.
Negatively Worded Questions: An example
What are negatively worded questions?Negatively worded questions are items in the questionnaire that are phrased in a negative way e.g. “Approval processes at my work are excessive”.
How are the negatively worded responses scored?When responding to a negatively worded question, “Strongly disagree” and “Disagree” responses are classified as positive i.e. it is good that you disagree that approval processes at work are excessive (this means they are not excessive!). Therefore, the “Strongly disagree” and “Disagree” responses are combined to calculate the % positive score.
What does this mean for interpreting the % positive score for negatively worded questions?The % positive score combines the negative responses as they are the “preferred”responses to this item.
EXAMPLEIn the table below the % positive score for “Approval processes at my work are excessive” is 82%. This result can be expressed by stating that:
82% disagreed that their“Approval processes at my work are excessive”
OR82% felt that the approvalprocesses at their work
are not excessive.
Conversely, the % negative score means that 8% of the employees perceive that the approval processes at their work are excessive.
How will I know if I am interpreting this correctly?To assist in the interpretation, all negatively worded questions are accompanied by an explanatory statement.
www.orcinternational.com.auPage 33
Queensland MuseumWorking for Queensland survey 2016

Queensland Museum | Highlight Report
15 Appendix C – How to interpret this report (cont.)
RoundingResults were rounded to whole numbers. Percentages may therefore not add up to 100%.
Factor scoresFactor measures combine information from multiple survey items that correlate highly with the overall factor. The factor scores are calculated as the sum of positive responses given to all questions within the factor, divided by the number of answers to all questions within the factor.
The report depicts three strategic priorities and makes use of seven factor measures.
Workplace climate index scoresWorkplace climate indices have been created by grouping together survey items by theme. Like factor scores, the climate index scores are calculated as the sum of positive responses given to all questions within the index, divided by the number of answers to all questions within the index.
% Change and division comparisonsThroughout this report the % change figure and division comparisons are frequently reported. The % change score relates to differences between:
• the 2015 and 2016 % positive, negative and neutral scores, or • the 2016 agency and Qld Public Sector % scores.
The % score is highlighted green when the 2016work area result is five or more percentage pointshigher than the 2015 score. The % score is highlighted red where the 2016 work area result is five or more percentage points lower.
The division comparisons relate to the comparisons of the % positive scores between theagency and other divisions.
QuintileIndicates the position of your agency when the 58 participating agencies are ranked against individual workplace factors and workplace outcomes.
Quintile positions 1 and 2 are indicated in greenfont, the third quintile is indicated in yellow font, and quintile positions 4 and 5 are indicated in red font.
PLEASE NOTE: While the coloured highlighting of both the % scores and the quintiles helps differentiate results, it does not necessarily indicate a statistically significant difference.
Number of respondentsThe number of respondents for sub populations (i.e. divisions, demographic groups) may not add up to the total number of respondents due tomissing demographic or division information.
DefinitionsThe following definitions were used in the survey:
Your workgroup - The group or team where you spend most of your time. If you are a manager your workgroup is the people you manage.
Your workplace - The place where you work, such as a school, hospital or office location as well as the places you visit as part of your work. Questions about your workplace concern the experiences you have in this environment.
Your organisationFor Health agencies - The Hospital and Health Service (HHS), in which you work, or the Queensland Ambulance Service or the Department of Health. For non-Health agencies - The Government department or public service office you work for in your current job (e.g. Department of Transport and Main Roads for staff employed in RoadTek, The Public Trustee for staff working for the The Public Trustee).
Your manager - The person you usually report to.
Your senior manager - The person your manager usually reports to.
Your customer(s) - The person(s) you provide advice or service to, whether internal or external to the Queensland Public Sector (e.g. students, clients, customers, stakeholders, patients, members of the community).
Sexual harassment - an unwelcome sexual advance,unwelcome request for sexual favours or other unwelcomeconduct of a sexual nature which makes a person feeloffended, humiliated or intimidated, and where that reactionis reasonable in the circumstances. Sexual harassmentdoes not need to be deliberate or repeated to be illegal.
Bullying - repeated and unreasonable behaviour directedtowards a worker or group of workers that creates a risk tohealth and safety.
www.orcinternational.com.auPage 34
Queensland MuseumWorking for Queensland survey 2016

Queensland Museum | Highlight Report
16 Appendix D – Evolutions in the Working for Queensland research program
www.orcinternational.com.auPage 35
Queensland MuseumWorking for Queensland survey 2016