rainfall variations induced by the lunar gravitational ... - rainfall... · geophysical research...
TRANSCRIPT

Geophysical Research Letters
Rainfall variations induced by the lunar gravitationalatmospheric tide and their implicationsfor the relationship between tropicalrainfall and humidity
Tsubasa Kohyama1 and John M. Wallace1
1Department of Atmospheric Sciences, University of Washington, Seattle, Washington, USA
Abstract Classical tidal theory predicts that the lunar gravitational semidiurnal tide (L2) shouldinduce perturbations in relative humidity (RH). Adiabatic expansion in divergent flow in advance of theL2 pressure minimum cools the air and reduces its saturation vapor pressure, thereby increasing the rateof condensation in saturated air parcels and causing the relative humidity (RH) of unsaturated parcels torise. Here we detect a statistically significant L2 signature in precipitation rate (P) in a 15 year, eight timesdaily, global precipitation data set acquired in the Tropical Rainfall Measuring Mission. Consistent with tidaltheory and with the notion that L2 modulates P mainly by perturbing RH, P varies out of phase withpressure, and it increases at a rate of about 10% per 1% increase in RH. These measurements thus providea measure of the sensitivity of P to planetary-scale changes in RH. Analysis of solar semidiurnal (S2) tidalstatistics yields similar results.
1. Introduction
Among the members of the large extended family of atmospheric perturbations, the lunar gravitationalsemidiurnal atmospheric tide (L2), the forced response to perturbations in the gravitational field occupies aspecial niche. It is nearly periodic and therefore easy to isolate; it is small in amplitude and therefore linear,and its forcing is simple, planetary scale, and almost perfectly known. By virtue of these special properties,the polarities and relative amplitudes of the L2 signal in different atmospheric variables shed light on moregeneral relationships between variables such as between planetary-scale relative humidity (RH) and precipi-tation rate (P) in the tropical atmosphere.
Classical tidal theory, e.g., as presented in Lindzen and Chapman [1969] predicts the existence of a linear rela-tionship between perturbations in pressure and RH. Chapman [1951] showed that the L2 cycles in pressureand temperature are in phase, from which he deduced that the tidal temperature perturbations are inducedby adiabatic compression and expansion of air parcels. In accordance with the Clausius-Clapeyron equation,saturation vapor pressure should vary in phase with temperature. Therefore, if we assume that specific humid-ity remains constant to first order on the semidiurnal time scale, RH should vary out of phase with temperatureand pressure. The temperature perturbations affect P both directly, by cooling saturated air during the expan-sion phase 1/4 cycle in advance of low tide, and indirectly, by making conditions favorable for heavier P atthe time of low tide, when the ambient, planetary-scale RH is highest. The phase of the P signature providesan indication of whether the direct or indirect effect is dominant. To the extent that the indirect effect domi-nates, the relative amplitude of the RH and P tidal signals is an indicator of the sensitivity of P, on a planetaryscale, to changes in ambient, column-integrated RH.
Until recently, studies of atmospheric tides have been based exclusively on a sparse network of station data[e.g., Haurwitz and Cowley, 1969; Goulter, 2005], and a robust L2 signal has been identified only in pressureand, to a more limited extent, in temperature. In Kohyama and Wallace [2014] (hereafter KW14), we detecteda robust lower atmospheric L2 signal in the ERA-Interim reanalysis. Our analysis was focused on the geopo-tential height field, but the procedure that we used could be applied to any atmospheric variable. A limitationof this approach is that estimates of ratios of L2 amplitudes in different variables are, at least to some degree,model dependent. An estimate of the sensitivity of P to ambient RH would be more convincing if the L2signal in P could be derived independently of the ERA-Interim. Accordingly, we examine the 15 year record
RESEARCH LETTER10.1002/2015GL067342
Key Points:• The lunar gravitational semidiurnal
tide (L2) is detected in the TRMMrainfall data
• The observed phase relationshipbetween pressure and rainfall is inaccord with linear theory
• Adiabatic expansion due to L2increases rainfall rate by 10% per 1%increase in relative humidity
Supporting Information:• Figure S1
Correspondence to:T. Kohyama,[email protected]
Citation:Kohyama, T., and J. M. Wallace (2016),Rainfall variations induced by the lunargravitational atmospheric tide andtheir implications for the relationshipbetween tropical rainfall andhumidity, Geophys. Res. Lett., 43,918–923, doi:10.1002/2015GL067342.
Received 8 DEC 2015
Accepted 4 JAN 2016
Accepted article online 7 JAN 2016
Published online 30 JAN 2016
©2016. The Authors.This is an open access article under theterms of the Creative CommonsAttribution-NonCommercial-NoDerivsLicense, which permits use anddistribution in any medium, providedthe original work is properly cited, theuse is non-commercial and nomodifications or adaptations are made.
KOHYAMA AND WALLACE RAINFALL ASSOCIATED WITH LUNAR TIDE 918

Geophysical Research Letters 10.1002/2015GL067342
of eight times daily data derived from Tropical Rainfall Measurement Mission (TRMM). As described in thispaper, we detect a statistically significant L2 signal with the highest P at the time of the lowest pressure, inaccordance with classical tidal theory and with the notion that the L2 signal in P is mainly a response to theRH perturbations. Hence, we are justified in using estimates of the tidal amplitudes to infer the sensitivity ofP to planetary-scale perturbations in RH.
The paper is structured as follows. Data and methods used in this study are described in section 2. In section 3,we isolate L2 signals from the TRMM rainfall data. Then, in section 4, we discuss some implications for therelationship between tropical RH and P. Some concluding remarks are presented in section 5.
2. Data and Methods2.1. DataThe P data are from TRMM Multisatellite Precipitation Analysis data [Huffman et al., 2007]. This data set is aug-mented by including observational data from other satellite-borne microwave imagers and infrared sensors.The latitude range of the data set is 50∘S to 50∘N. The original horizontal resolution is 0.25∘ in both longitu-dinal and latitudinal directions, but we have regridded the data at 4∘ resolution for computational efficiency.The time span analyzed in this study is from 1998 to 2012 for P.
The geopotential, temperature, and horizontal divergence fields are from the four times daily ERA-Interimreanalysis produced by the European Centre for Medium-Range Weather Forecasts [Dee et al., 2011]. The dataare generated by a multivariate data assimilation scheme in which gridded forecast fields produced by anumerical weather prediction model are continually being updated with satellite and in situ observationaldata. The resulting gridded fields are reanalyzed for research use. The horizontal resolution analyzed in thisstudy is 4.5∘ in both longitude and latitude for geopotential and temperature and 3.0∘ for horizontal diver-gence. The time span of the analysis is 1979–2011 for geopotential height and 1979–2014 for temperatureand horizontal divergence. Geopotential height is calculated by dividing geopotential by standard gravity.These variables are analyzed after calculating the mass-weighted vertical mean for 100–1000 hPa pressurelayer. Taking the mass-weighted vertical mean is justified because KW14 showed that the tidal amplitudeincreases linearly with height in the tropical troposphere, and only by less than 20% from the Earth’s surfaceto the 100 hPa level.
As noted in KW14, the model used in assimilating the data lacks the forcing for the tide. Hence, the assim-ilation process could conceivably lead to a damping of the tidal signal in the global analyses. However, webelieve that the error associated with this damping effect cannot be too large, because KW14 showed thatthe detected L2 pressure tidal signals are generally consistent with the L2 signals estimated by station datain earlier studies. In addition, a recent work by Schindelegger and Dobslaw [2016] has confirmed that the L2 inthe ERA-Interim reanalysis shows a remarkably close agreement with the global ground truth view of the L2estimated from land barometers and moored buoys.
2.2. MethodsTo isolate the L2 signal from an arbitrary meteorological variable x, we first prepare for four separate dailytime series x00, x06, x12, and x18 by extracting data for each of the four analysis times (00, 06, 12, and 18 UTC,respectively) at each grid point. Then, we construct the regression maps (The formula given by KW14 is wrongby a factor of
√2.):
Ai(𝜆, 𝜙) = 2 x′i (𝜆, 𝜙, t) cos
(2𝜋Ts
t
)(1)
Bi(𝜆, 𝜙) = 2 x′i (𝜆, 𝜙, t) sin
(2𝜋Ts
t
)(2)
where i = 00, 06, 12, and 18, 𝜆 is longitude, 𝜙 is latitude, t is time, and Ts is half the lunar synodic period(14.765294 days). Overbars and primes denote time means and departures from them, respectively. Thisregression procedure is based on the fact that when repeatedly observed at a particular mean solar time eachday, the Moon revolves eastward and completes a full circuit around the Earth during a full lunar synodiccycle. The reference time (t = 0) is defined as the time of one of the full or new moons within the time span of
KOHYAMA AND WALLACE RAINFALL ASSOCIATED WITH LUNAR TIDE 919
Geophysical Research Letters 10.1002/2015GL067342
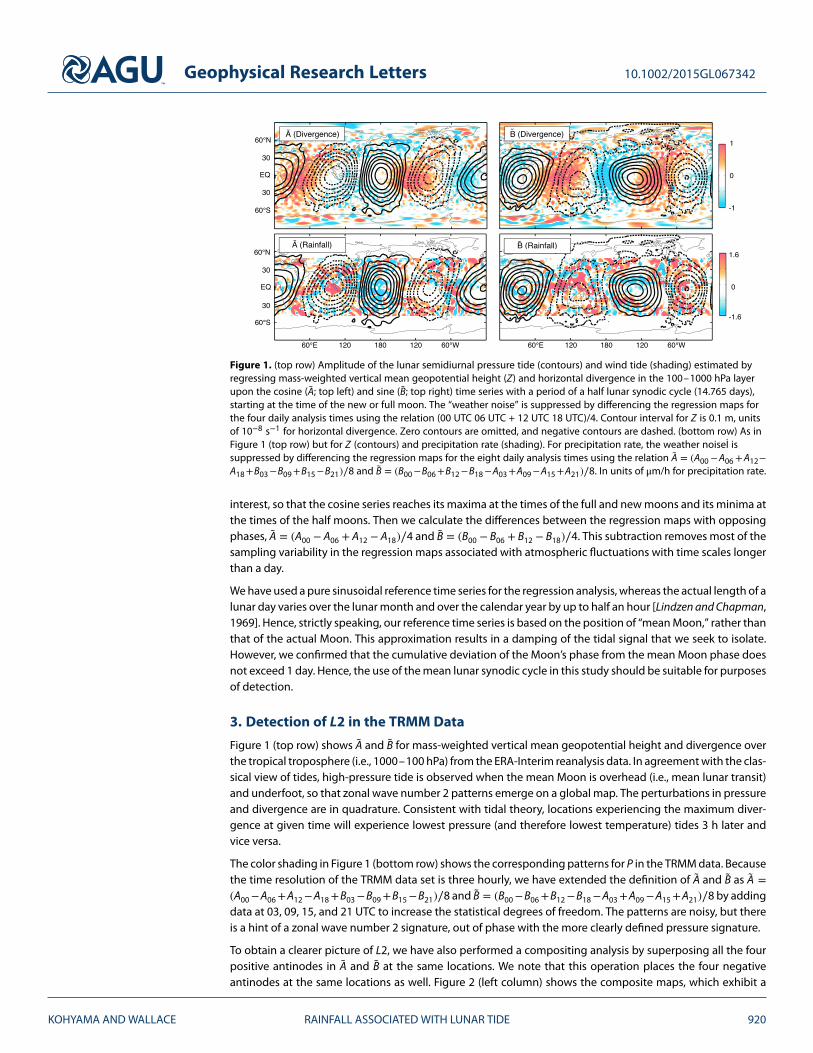
Figure 1. (top row) Amplitude of the lunar semidiurnal pressure tide (contours) and wind tide (shading) estimated byregressing mass-weighted vertical mean geopotential height (Z) and horizontal divergence in the 100–1000 hPa layerupon the cosine (A; top left) and sine (B; top right) time series with a period of a half lunar synodic cycle (14.765 days),starting at the time of the new or full moon. The “weather noise” is suppressed by differencing the regression maps forthe four daily analysis times using the relation (00 UTC 06 UTC + 12 UTC 18 UTC)/4. Contour interval for Z is 0.1 m, unitsof 10−8 s−1 for horizontal divergence. Zero contours are omitted, and negative contours are dashed. (bottom row) As inFigure 1 (top row) but for Z (contours) and precipitation rate (shading). For precipitation rate, the weather noiseI issuppressed by differencing the regression maps for the eight daily analysis times using the relation A = (A00 −A06 +A12−A18+B03−B09+B15−B21)∕8 and B = (B00−B06+B12−B18−A03+A09−A15+A21)∕8. In units of μm/h for precipitation rate.
interest, so that the cosine series reaches its maxima at the times of the full and new moons and its minima atthe times of the half moons. Then we calculate the differences between the regression maps with opposingphases, A = (A00 − A06 + A12 − A18)∕4 and B = (B00 − B06 + B12 − B18)∕4. This subtraction removes most of thesampling variability in the regression maps associated with atmospheric fluctuations with time scales longerthan a day.
We have used a pure sinusoidal reference time series for the regression analysis, whereas the actual length of alunar day varies over the lunar month and over the calendar year by up to half an hour [Lindzen and Chapman,1969]. Hence, strictly speaking, our reference time series is based on the position of “mean Moon,” rather thanthat of the actual Moon. This approximation results in a damping of the tidal signal that we seek to isolate.However, we confirmed that the cumulative deviation of the Moon’s phase from the mean Moon phase doesnot exceed 1 day. Hence, the use of the mean lunar synodic cycle in this study should be suitable for purposesof detection.
3. Detection of L2 in the TRMM Data
Figure 1 (top row) shows A and B for mass-weighted vertical mean geopotential height and divergence overthe tropical troposphere (i.e., 1000–100 hPa) from the ERA-Interim reanalysis data. In agreement with the clas-sical view of tides, high-pressure tide is observed when the mean Moon is overhead (i.e., mean lunar transit)and underfoot, so that zonal wave number 2 patterns emerge on a global map. The perturbations in pressureand divergence are in quadrature. Consistent with tidal theory, locations experiencing the maximum diver-gence at given time will experience lowest pressure (and therefore lowest temperature) tides 3 h later andvice versa.
The color shading in Figure 1 (bottom row) shows the corresponding patterns for P in the TRMM data. Becausethe time resolution of the TRMM data set is three hourly, we have extended the definition of A and B as A =(A00−A06+A12−A18+B03−B09+B15−B21)∕8 and B = (B00−B06+B12−B18−A03+A09−A15+A21)∕8 by addingdata at 03, 09, 15, and 21 UTC to increase the statistical degrees of freedom. The patterns are noisy, but thereis a hint of a zonal wave number 2 signature, out of phase with the more clearly defined pressure signature.
To obtain a clearer picture of L2, we have also performed a compositing analysis by superposing all the fourpositive antinodes in A and B at the same locations. We note that this operation places the four negativeantinodes at the same locations as well. Figure 2 (left column) shows the composite maps, which exhibit a
KOHYAMA AND WALLACE RAINFALL ASSOCIATED WITH LUNAR TIDE 920

Geophysical Research Letters 10.1002/2015GL067342
Figure 2. (left column) As in Figure 1 (left column) but composited so that all the four positive antinodes in A and Bare superimposed at the same location. Maps are repeated once in the longitudinal direction. The coastlines arefor the time when the Moon is above the Greenwich Meridian. (right column) As in Figure 2 (left column) but for thesolar semidiurnal tide estimated by compositing the fields for each time of day and then subtracting as (00 UTC06 UTC + 12 UTC 18 UTC)/4. Contour interval 2 m.
clearer correspondence between pressure and P than the patterns shown in Figure 1. As suggested in previousstudies [Haurwitz and Cowley, 1969; Lindzen and Chapman, 1969], the phase of L2 in pressure and divergencefield is slightly earlier in Southern Hemisphere.
For comparison, we also show the patterns of solar semidiurnal tide (S2) (Figure 2, right column). Theclimatology of S2 at each time of day is calculated as the average of each xi over the full time span of thedata, rather than as a regression coefficient based on a sinusoidal reference time series. As in L2, horizontaldivergence is quadrature with pressure, and “high tide” (defined in terms of pressure or geopotential height)corresponds to reduced P and vice versa.
Figure 3. As in Figure 2 but scatterplots showing the data at each grid point from 10∘S to 10∘N by binning by 4.5∘longitude increments. Also shown are sinusoidal least squares best fit curves for zonal wave number 2. Amplitudes ofthe curves are indicated at the top left of each panel.
KOHYAMA AND WALLACE RAINFALL ASSOCIATED WITH LUNAR TIDE 921
Geophysical Research Letters 10.1002/2015GL067342
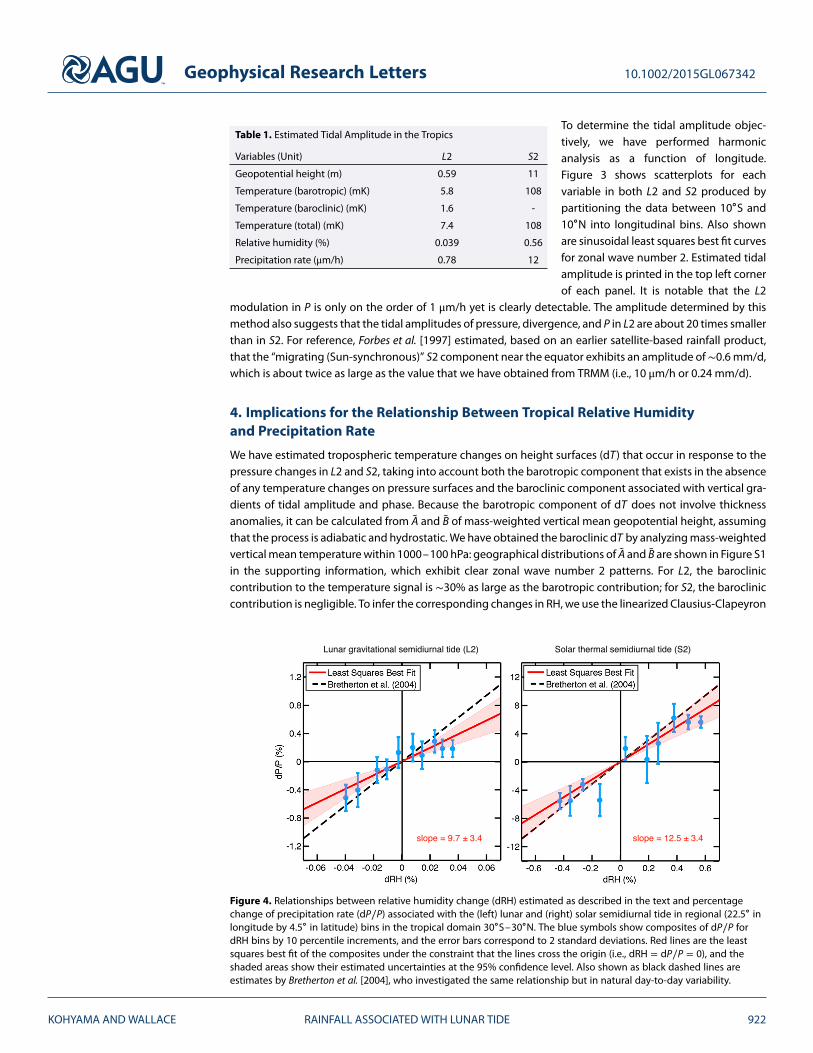
Table 1. Estimated Tidal Amplitude in the Tropics
Variables (Unit) L2 S2
Geopotential height (m) 0.59 11
Temperature (barotropic) (mK) 5.8 108
Temperature (baroclinic) (mK) 1.6 -
Temperature (total) (mK) 7.4 108
Relative humidity (%) 0.039 0.56
Precipitation rate (μm/h) 0.78 12
To determine the tidal amplitude objec-tively, we have performed harmonicanalysis as a function of longitude.Figure 3 shows scatterplots for eachvariable in both L2 and S2 produced bypartitioning the data between 10∘S and10∘N into longitudinal bins. Also shownare sinusoidal least squares best fit curvesfor zonal wave number 2. Estimated tidalamplitude is printed in the top left cornerof each panel. It is notable that the L2
modulation in P is only on the order of 1 μm/h yet is clearly detectable. The amplitude determined by thismethod also suggests that the tidal amplitudes of pressure, divergence, and P in L2 are about 20 times smallerthan in S2. For reference, Forbes et al. [1997] estimated, based on an earlier satellite-based rainfall product,that the “migrating (Sun-synchronous)” S2 component near the equator exhibits an amplitude of ∼0.6 mm/d,which is about twice as large as the value that we have obtained from TRMM (i.e., 10 μm/h or 0.24 mm/d).
4. Implications for the Relationship Between Tropical Relative Humidityand Precipitation Rate
We have estimated tropospheric temperature changes on height surfaces (dT) that occur in response to thepressure changes in L2 and S2, taking into account both the barotropic component that exists in the absenceof any temperature changes on pressure surfaces and the baroclinic component associated with vertical gra-dients of tidal amplitude and phase. Because the barotropic component of dT does not involve thicknessanomalies, it can be calculated from A and B of mass-weighted vertical mean geopotential height, assumingthat the process is adiabatic and hydrostatic. We have obtained the baroclinic dT by analyzing mass-weightedvertical mean temperature within 1000–100 hPa: geographical distributions of A and B are shown in Figure S1in the supporting information, which exhibit clear zonal wave number 2 patterns. For L2, the barocliniccontribution to the temperature signal is ∼30% as large as the barotropic contribution; for S2, the barocliniccontribution is negligible. To infer the corresponding changes in RH, we use the linearized Clausius-Clapeyron
Figure 4. Relationships between relative humidity change (dRH) estimated as described in the text and percentagechange of precipitation rate (dP∕P) associated with the (left) lunar and (right) solar semidiurnal tide in regional (22.5∘ inlongitude by 4.5∘ in latitude) bins in the tropical domain 30∘S–30∘N. The blue symbols show composites of dP∕P fordRH bins by 10 percentile increments, and the error bars correspond to 2 standard deviations. Red lines are the leastsquares best fit of the composites under the constraint that the lines cross the origin (i.e., dRH = dP∕P = 0), and theshaded areas show their estimated uncertainties at the 95% confidence level. Also shown as black dashed lines areestimates by Bretherton et al. [2004], who investigated the same relationship but in natural day-to-day variability.
KOHYAMA AND WALLACE RAINFALL ASSOCIATED WITH LUNAR TIDE 922

Geophysical Research Letters 10.1002/2015GL067342
equation, i.e., des∕es = (0.074∕K)dT , where es is the saturation vapor pressure. Assuming that the specifichumidity change is negligible on the semidiurnal time scale, dRH∕RH = −des∕es. Then, to calculate dRH, weassume that the effective vertically averaged RH is 70%. Typical tidal amplitudes in the tropics are summarizedin Table 1.
Figure 4 shows the relationship between dRH and logarithmic changes in P, i.e., dP∕P, induced by L2 and S2.Our results indicate that a 1% increase in RH causes P to increase by ∼10% in L2 and ∼12% in S2. Also shownis an estimate by Bretherton et al. [2004] who investigated the same relationship between P and column RHin natural day-to-day variability. They obtained the column RH by dividing the observed water vapor pathbased on satellite measurements by the corresponding saturation water vapor path at each grid point andperformed a nonlinear least squares analysis for oceanic basin-wide regional bins. They estimated an ∼16%P increase for a 1% RH increase. Those values obtained using these different approaches agree as well as theydo support the notion that P is highly sensitive to small changes in the ambient RH under the current tropicalclimate condition.
5. Concluding Remarks
In both KW14 and the present study, we have analyzed the S2 as well as the L2 tidal signals. We have placedgreater emphasis on findings related to L2 in these papers because of their greater novelty and becausethe L2 forcing is purely adiabatic. The S2 forcing involves diabatic heating, in the ozone layer and at theEarth’s surface. That the S2 pressure tide shown in Figure 2 exhibits a tropically focused zonal wave number2 signature indicates that it is forced mainly by ozone heating. That the tropospheric signal is almost purebarotropic (KW14, Figure 3) confirms that it is a passive response to diabatic heating at much higher levels ofthe atmosphere. In contrast to the L2 pressure signature, which may be distorted by irregular features of theoceanic tide [Schindelegger and Dobslaw, 2016], the S2 pressure signature is much closer to a pure, equatoriallysymmetric, zonal wave number 2 pattern.
In agreement with previous studies, we find that the amplitude of the S2 pressure signature induced by ozoneheating is about 20 times as large as that of the L2 signature induced by perturbations in the gravitationalfield. We have shown that this scaling applies to P as well. Hence, for some sensitivity studies such as thepresent one, the S2 and L2 signatures can be used interchangeably. However, it is evident from Figure 2 thatthe S2 signature in P exhibits pronounced, boundary-forced land-sea contrasts. The S2 temperature signature(not shown) exhibits even more substantial departures from the zonal wave number 2 pattern predicted byclassical tidal theory. These features complicate the interpretation of relationships derived exclusively fromthe S2 signal.
The analysis of the relationship between relative humidity and dP∕P in section 4 serves as a concrete illustra-tion of how the quantitative documentation of the observed structure of atmospheric tides can be used tomake inferences about atmospheric processes. It can also serve as a test bed for evaluating and comparingthe performance of models.
ReferencesBretherton, C. S., M. E. Peters, and L. E. Back (2004), Relationships between water vapor path and precipitation over the tropical oceans,
J. Clim., 17, 1517–1528, doi:10.1175/1520-0442(2004)017<1517:RBWVPA>2.0.CO;2.Chapman, S. (1951), Atmospheric tides and oscillations, in Compendium of Meteorology, edited by T. F. Malone, pp. 262–274, Am. Meteorol.
Soc., Boston, Calif.Dee, D. P., et al. (2011), The ERA-Interim reanalysis: Configuration and performance of the data assimilation system, Q. J. R. Meteorol. Soc.,
137, 553–597, doi:10.1002/qj.828.Forbes, J. M., M. E. Hagan, X. Zhang, and K. Hamilton (1997), Upper atmosphere tidal oscillations due to latent heat release in the tropical
troposphere, Ann. Geophys., 15(9), 1165–1175, doi:10.1007/s00585-997-1165-0.Goulter, S. W. (2005), The structure of the lunar semi-diurnal pressure tide L2, Q. J. R. Meteorol. Soc., 131, 723–758,
doi:10.1256/qj.03.234.Haurwitz, B., and A. D. Cowley (1969), The lunar barometric tide, its global distribution and annual variation, Pure Appl. Geophys., 75, 1–29,
doi:10.1007/BF00876008.Huffman, G. J., D. T. Bolvin, E. J. Nelkin, D. B. Wolff, R. F. Adler, G. Gu, Y. Hong, K. P. Bowman, and E. F. Stocker (2007), The TRMM multi-satellite
precipitation analysis: Quasi-global, multi-year, combined-sensor precipitation estimates at fine scale, J. Hydrometeorol., 8(1), 38–55,doi:10.1175/JHM560.1.
Kohyama, T., and J. M. Wallace (2014), Lunar gravitational atmospheric tide, surface to 50 km in a global, gridded data set, Geophys. Res. Lett.,41, 8660–8665, doi:10.1002/2014GL060818.
Lindzen, R. S., and S. Chapman (1969), Atmospheric tides, Space Sci. Rev., 10, 3–188.Schindelegger, M., and H. Dobslaw (2016), A global ground truth view of the lunar air pressure tide L2, J. Geophys. Res. Atmos., 120,
doi:10.1002/2015JD024243.
AcknowledgmentsThis study is based on the TRMMdata set available online athttp://pmm.nasa.gov/data-access/downloads/trmm and theERA-Interim data set available athttp://apps.ecmwf.int/datasets/data/interim-full-daily. The work wassupported by the National ScienceFoundation (NSF) under grantAGS-1122989, and the first author’sgraduate work is supported byTakenaka Ikueikai Scholarship Society,Iizuka Takeshi Scholarship Foundation,and the NSF under grantAGS-0960497. We would like to thankKatrina Virts for preprocessing theTRMM data. We would also like tothank Christopher Bretherton, MichaelSchindelegger, Kevin Hamilton, andone anonymous reviewer for theirhelpful comments and suggestions.
KOHYAMA AND WALLACE RAINFALL ASSOCIATED WITH LUNAR TIDE 923