rare species and the use of indicator groups for...
TRANSCRIPT

875
Conservation Biology, Pages 875–882Volume 17, No. 3, June 2003
Rare Species and the Use of Indicator Groups for Conservation Planning
JOSHUA J. LAWLER,*§ DENIS WHITE,* JEAN C. SIFNEOS,†AND LAWRENCE L. MASTER‡
*U.S. Environmental Protection Agency, 200 SW 35th Street, Corvallis, OR 97333, U.S.A.†Department of Geosciences, Oregon State University, Corvallis, OR 97331, U.S.A.‡NatureServe, 11 Avenue de Lafayette, Boston, MA 02111, U.S.A.
Abstract:
Indicators of biodiversity have been proposed as a potential tool for selecting areas for conserva-tion when information about species distributions is scarce. Although tests of the concept have produced var-ied results, sites selected to address indicator groups can include a high proportion of other species. We testedthe hypothesis that species at risk of extinction are not likely to be included in sites selected to protect indica-tor groups. Using a reserve-selection approach, we compared the ability of seven indicator groups—freshwa-ter fish, birds, mammals, freshwater mussels, reptiles, amphibians, and at-risk species of those six taxa—toprovide protection for other species in general and at-risk species in particular in the Middle Atlantic regionof the United States. Although sites selected with single taxonomic indicator groups provided protection forbetween 61% and 82% of all other species, no taxonomic group provided protection for more than 58% of allother at-risk species. The failure to cover at-risk species is likely linked to their rarity. By examining the rela-tionship between a species’ probability of coverage by each indicator group and the extent of its geographicrange within the study area, we found that species with more restricted ranges were less likely to be protectedthan more widespread species. Furthermore, we found that although sites selected with indicator groups com-posed primarily of terrestrial species (birds and mammals) included relatively high percentages of those spe-cies (82–85%) they included smaller percentages of strictly aquatic species (27–55%). Finally, of both impor-tance and possible utility, we found that at-risk species themselves performed well as an indicator group,covering an average of 84% of all other species.
Especies Raras y el Uso de Grupos Indicadores para la Planeación de la Conservación
Resumen:
Los indicadores de la biodiversidad han sido propuestos como una herramienta potencial en laselección de áreas para conservación cuando la información sobre la distribución de algunas especies es es-casa. A pesar de que algunas evaluaciones de este concepto han producido resultados variados, los sitios se-leccionados para evaluar grupos indicadores pueden incluir una alta proporción de otras especies. Evalua-mos la hipótesis de que las especies en riesgo de extinción probablemente no se incluyan en sitiosseleccionados para proteger grupos indicadores. Usando la metodología de selección de reserva, comparamosla capacidad de siete grupos indicadores (peces de agua dulce, aves, mamíferos, almejas de agua dulce, rep-tiles, anfibios y especies en riesgo de estos seis taxones) para proveer protección a otras especies en general yespecies en riesgo, en particular, en la región del Atlántico Medio de los Estados Unidos. A pesar de que los si-tios con un solo grupo indicador proporcionaron protección para el 61% al 82% de todas las otras especies,ningún grupo taxonómico proporcionó protección para más del 58% de todas las otras especies en riesgo. Laincapacidad de proteger especies en riesgo posiblemente se vincule con su rareza. Al examinar la relación en-tre la probabilidad de cobertura de una especie para cada grupo indicador y la extensión de su rangogeográfico dentro del área de estudio, encontramos que las especies con rangos más restringidos teníanmenor probabilidad de ser protegidas que las especies de distribución más amplia. Además, encontramosque, a pesar de que los sitios seleccionados con grupos indicadores compuestos principalmente por especies
§
email [email protected] submitted December 27, 2001; revised manuscript accepted July 12, 2002.

876
Indicators for Reserve Selection Lawler et al.
Conservation BiologyVolume 17, No. 3, June 2003
Introduction
Conservation planning must often be conducted in theabsence of even the most basic information about spe-cies distributions. Indicators of biodiversity have beenproposed as one possible tool for addressing this prob-lem (Kremen 1992; Raven & Wilson 1992; Flather et al.1997 ). In the context of selecting areas for conserva-tion, the indicator concept is based on the assumptionthat areas selected to address members of an indicatorgroup also capture a broad range of other organisms orconservation targets. Potential indicator groups thathave received attention include well-known taxa, spe-cies of conservation concern, and landscape features orvegetation types (Prendergast et al. 1993; Wessels et al.1999 ). Tests of the performance of these indicatorgroups have yielded mixed results (Howard et al. 1998;Ricketts et al. 1999; Andelman & Fagan 2000).
Sites selected to include members of an indicatorgroup have the potential to cover a large percentage oforganisms outside the group if the distributions of themembers of the group are representative of a larger setof organisms. Simple tests of taxonomic indicators haveoften failed to show a strong coincidence of cross-taxonpatterns of species richness and hotspots of richness orrarity hotspots (Prendergast et al. 1993; Dobson et al.1997). Furthermore, the congruence of cross-taxon pat-terns of diversity and rarity tend to vary across scalesand in different areas (Flather et al. 1997). Despite thislack of coincidence, taxonomic indicators perform wellwhen tested with the concept of complementarity,which is the idea that areas selected to cover all speciesof an indicator group often include a high proportion ofother species as well (Howard et al. 1998). Again, how-ever, the results of similar tests have varied dependingon the composition of the indicator group and the scaleof the study (Flather et al. 1997).
In the absence of cross-taxon patterns in species distri-butions, the success of a taxonomic indicator group de-rives, in part, from its ability to effectively sample a widerange of environmental conditions (Kremen 1992; Mar-gules et al. 1994; Faith & Walker 1996). Thus, indicatorgroups work by increasing the probability of includingany given nonindicator species by sampling distinct re-gions of the environmental space. Species with differentdistributions will likely be differentially covered by thissampling. In general, widely distributed species aremore likely to be covered by sites selected to cover an
indicator group. Unless there is a strong congruence ofcross-taxon patterns of the distributions of species atrisk of extinction, these species should be poorly cov-ered by indicators. To date, such congruence has notbeen demonstrated (Lombard 1995; Dobson et al. 1997;Kerr 1997). Because rare species are often those mostlikely to be lost if they are not protected, it is crucial thatwe understand the degree to which they are included inselected sites if indicator groups are to be used as a con-servation tool.
We investigated the ability of indicator groups to pro-vide coverage for at-risk species. We used seven differ-ent indicator groups composed of, respectively, fresh-water fish, birds, mammals, freshwater mussels, reptiles,amphibians, and at-risk species from those six taxa.First, we examined the ability of indicator groups toprovide protection for all species and more specificallyfor species at risk of extinction. We conducted theseanalyses by selecting sites that included all members ofan indicator group. We then tallied the number of spe-cies and at-risk species that were included in those setsof selected sites. To investigate potential explanationsof indicator performance, we examined cross-taxon dis-tribution patterns of at-risk species and the relationshipbetween the geographic range of species and their like-lihood of protection by different indicator groups.
Methods
The study encompassed an area of the eastern UnitedStates including the states of Delaware, Maryland, Penn-sylvania, West Virginia, and Virginia. We used a hexago-nal grid with 487 cells of approximately 650 km
2
each todelineate the sites from which all selections were made(White et al. 1992). Species-occurrence records for 772species from six taxonomic groups were compiled forthe 487 sites (Table 1). The research, compilation, digi-tization, and quality control of the species-occurrencedata were carried out by the Natural Heritage programsin each state as directed and assisted by staff of The Na-ture Conservancy (Master 1996). The data included allnative species with confirmed or probable status in each650-km
2
hexagon. Status was derived from the litera-ture, museum records, experts, and digital databases.Only species known to be native to a site were includedin the site’s species-occurrence list. The database was re-
terrestres (aves y mamíferos) incluyeron porcentajes relativamente altos de estas especies (82%–85%), éstosincluyeron porcentajes más bajos de especies estrictamente acuáticas (27%–55%). Finalmente, de importan-cia y posible utilidad, encontramos que las especies en riesgo, por si mismas, funcionaron bien como grupo
indicador, abarcando, en promedio, el 84% de todas las otras especies.
Conservation BiologyVolume 17, No. 3, June 2003
Lawler et al. Indicators for Reserve Selection
877
viewed by selected groups of experts for each of the sixtaxonomic groups.
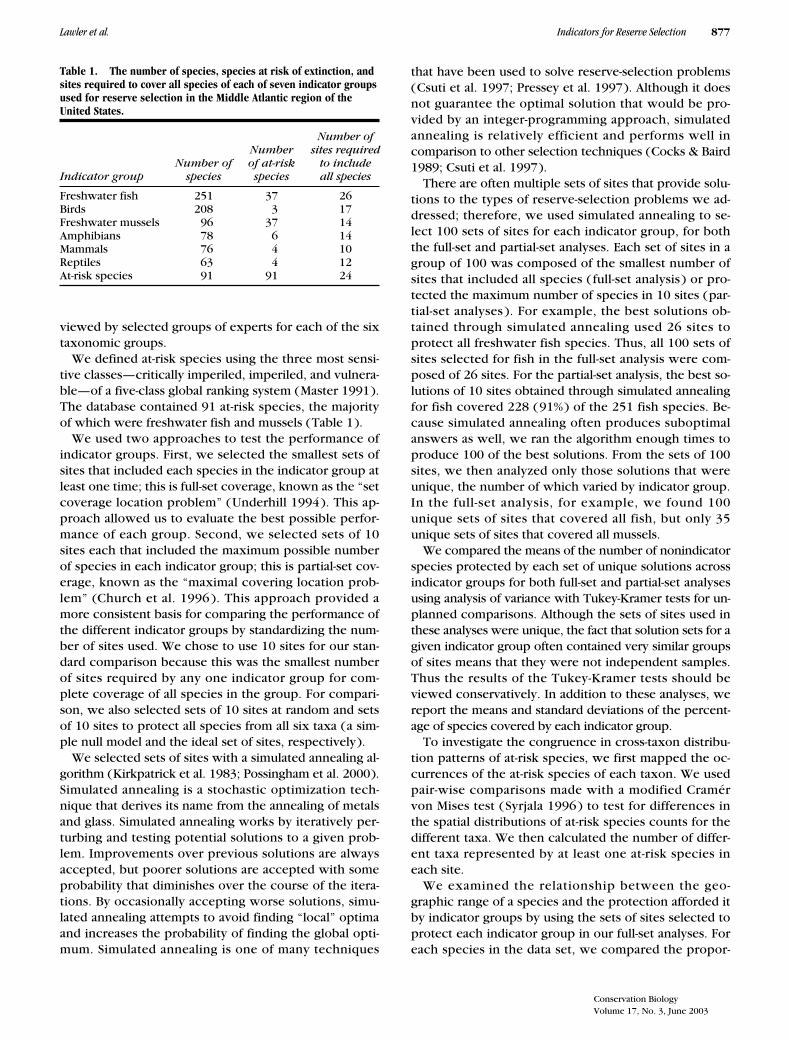
We defined at-risk species using the three most sensi-tive classes—critically imperiled, imperiled, and vulnera-ble—of a five-class global ranking system (Master 1991).The database contained 91 at-risk species, the majorityof which were freshwater fish and mussels (Table 1).
We used two approaches to test the performance ofindicator groups. First, we selected the smallest sets ofsites that included each species in the indicator group atleast one time; this is full-set coverage, known as the “setcoverage location problem” (Underhill 1994). This ap-proach allowed us to evaluate the best possible perfor-mance of each group. Second, we selected sets of 10sites each that included the maximum possible numberof species in each indicator group; this is partial-set cov-erage, known as the “maximal covering location prob-lem” (Church et al. 1996 ). This approach provided amore consistent basis for comparing the performance ofthe different indicator groups by standardizing the num-ber of sites used. We chose to use 10 sites for our stan-dard comparison because this was the smallest numberof sites required by any one indicator group for com-plete coverage of all species in the group. For compari-son, we also selected sets of 10 sites at random and setsof 10 sites to protect all species from all six taxa (a sim-ple null model and the ideal set of sites, respectively).
We selected sets of sites with a simulated annealing al-gorithm (Kirkpatrick et al. 1983; Possingham et al. 2000).Simulated annealing is a stochastic optimization tech-nique that derives its name from the annealing of metalsand glass. Simulated annealing works by iteratively per-turbing and testing potential solutions to a given prob-lem. Improvements over previous solutions are alwaysaccepted, but poorer solutions are accepted with someprobability that diminishes over the course of the itera-tions. By occasionally accepting worse solutions, simu-lated annealing attempts to avoid finding “local” optimaand increases the probability of finding the global opti-mum. Simulated annealing is one of many techniques
that have been used to solve reserve-selection problems(Csuti et al. 1997; Pressey et al. 1997). Although it doesnot guarantee the optimal solution that would be pro-vided by an integer-programming approach, simulatedannealing is relatively efficient and performs well incomparison to other selection techniques (Cocks & Baird1989; Csuti et al. 1997).
There are often multiple sets of sites that provide solu-tions to the types of reserve-selection problems we ad-dressed; therefore, we used simulated annealing to se-lect 100 sets of sites for each indicator group, for boththe full-set and partial-set analyses. Each set of sites in agroup of 100 was composed of the smallest number ofsites that included all species ( full-set analysis ) or pro-tected the maximum number of species in 10 sites (par-tial-set analyses ). For example, the best solutions ob-tained through simulated annealing used 26 sites toprotect all freshwater fish species. Thus, all 100 sets ofsites selected for fish in the full-set analysis were com-posed of 26 sites. For the partial-set analysis, the best so-lutions of 10 sites obtained through simulated annealingfor fish covered 228 (91%) of the 251 fish species. Be-cause simulated annealing often produces suboptimalanswers as well, we ran the algorithm enough times toproduce 100 of the best solutions. From the sets of 100sites, we then analyzed only those solutions that wereunique, the number of which varied by indicator group.In the full-set analysis, for example, we found 100unique sets of sites that covered all fish, but only 35unique sets of sites that covered all mussels.
We compared the means of the number of nonindicatorspecies protected by each set of unique solutions acrossindicator groups for both full-set and partial-set analysesusing analysis of variance with Tukey-Kramer tests for un-planned comparisons. Although the sets of sites used inthese analyses were unique, the fact that solution sets for agiven indicator group often contained very similar groupsof sites means that they were not independent samples.Thus the results of the Tukey-Kramer tests should beviewed conservatively. In addition to these analyses, wereport the means and standard deviations of the percent-age of species covered by each indicator group.
To investigate the congruence in cross-taxon distribu-tion patterns of at-risk species, we first mapped the oc-currences of the at-risk species of each taxon. We usedpair-wise comparisons made with a modified Cramérvon Mises test ( Syrjala 1996) to test for differences inthe spatial distributions of at-risk species counts for thedifferent taxa. We then calculated the number of differ-ent taxa represented by at least one at-risk species ineach site.
We examined the relationship between the geo-graphic range of a species and the protection afforded itby indicator groups by using the sets of sites selected toprotect each indicator group in our full-set analyses. Foreach species in the data set, we compared the propor-
Table 1. The number of species, species at risk of extinction, and sites required to cover all species of each of seven indicator groups used for reserve selection in the Middle Atlantic region of the United States.
Indicator groupNumber of
species
Numberof at-riskspecies
Number ofsites required
to includeall species
Freshwater fish 251 37 26Birds 208 3 17Freshwater mussels 96 37 14Amphibians 78 6 14Mammals 76 4 10Reptiles 63 4 12At-risk species 91 91 24

878
Indicators for Reserve Selection Lawler et al.
Conservation BiologyVolume 17, No. 3, June 2003
tion of the study area over which the species occurredand the proportion of sets of sites in which that specieswas protected.
Results
Sites selected for full coverage of indicator taxa in-cluded, on average, between 61
�
3% and 82
�
1% of allother species (Fig. 1a). The number of sites required forfull coverage ranged from 10 for mammals to 26 for fish(Table 1). The sets of 10 sites from our partial-set analy-ses included fewer species but in general showed similarpatterns of relative indicator performance (Fig. 1b). Al-though all indicator groups provided better coverage forother species than did sets of randomly selected sites(
p
�
0.05), the performance of mammals and birds asindicators were only slightly better than the perfor-mance of randomly selected sites. Sites selected to cover
mammals and birds included a high percentage of thespecies in those groups ( 82
�
2% and 85
�
2% ), butthey included relatively few strictly aquatic species (fishand mussels ) ( 27
�
5% to 55
�
2% ) ( Table 2 ). Con-versely, sites selected to cover fish and mussels includeda relatively large proportion of each of the six taxa (62
�
2% to 83
�
1%).Although indicator groups protected a relatively large
percentage of all other species, they protected ratherlow percentages of at-risk species (Fig. 1). Even whenfull coverage of the indicator groups was required, thebest-performing indicator, fish, only included 58
�
3%of all other at-risk species. Mammals provided the worstcoverage of at-risk species, 17
�
5%. Despite this overallpoor performance, some indicator groups provided bet-ter protection for the at-risk species of certain taxa thanfor those of others (Table 2). For example, sets of 10 sitesselected to protect birds included an average of 80
�
10%of the four reptile species, amphibians provided protec-tion for 74%
�
18% of the four mammal species, andmussels protected 67%
�
0% of the three bird species.Although the indicator groups generally did not provideprotection for most at-risk species, we found that at-riskspecies used as an indicator group outperformed each ofthe taxonomic groups (Fig. 1, Table 2).
With the exception of fish and mussels, the six taxashowed rather disparate distributions of at-risk species(Fig. 2a–2f). All 15 pairs of taxa had different spatial dis-tributions of at-risk species (
p
�
0.003 ). Of the 487sites, 180 (37%) contained at least one at-risk speciesfrom one of the six taxa, 101 (21%) had at-risk speciesfrom two taxa, 27 (6%) from three taxa, and 3 (
�
1%)from four taxa (Fig. 2g). No sites contained at-risk spe-cies from more than four of the six taxa.
Individual at-risk species occurred in
�
1% to 17% ofthe sites in the study region (
�
2
�
3%). The propor-tion of sites occupied by a species was positively relatedto the probability of inclusion in sites selected to coverindicator groups (Fig. 3). In general, species occurringin at least 20% of the sites in the study region were al-ways included in selected sets of sites, but the probabil-ity of inclusion was variable for species that occupied
�
20% of the sites in the region. This potential thresholdappeared to be lower ( between 10% and 20% of thestudy region ) for fish and bird indicators and higher(from 25% to 50% of the study region) for the other fourtaxa.
Discussion
Our results indicate that sites selected with taxonomicindicator groups can include a large percentage of otherspecies (Fig. 1). Although other researchers have reachedsimilar conclusions, many have found that indicatorgroups fail to outperform randomly selected sites or that
x
Figure 1. The percentage of all nonindicator group species and all nonindicator at-risk species included in (a) sets of sites selected to cover all members of indica-tor groups and (b) sets of 10 sites selected to maxi-mize the number of indicator group species covered. Each set of bars represents the mean percentage of spe-cies included in multiple unique sets of sites selected for each indicator group. The numbers of unique sets of sites for the full-set analyses were 100 for fish, am-phibians, birds, and reptiles; 99 for mammals; 98 for at-risk species; and 35 for mussels. The number of unique sets compared in the 10-site analysis are listed in Table 2. Error bars represent � SD.
Conservation BiologyVolume 17, No. 3, June 2003
Lawler et al. Indicators for Reserve Selection
879
fish—fit these criteria well. The range of indicatorgroups we tested, however, was limited by the availabil-ity of data in our study region. It is possible that groupsof other species, such as insects, that generally respondto more fine-grained differences in habitat would per-form better as indicator groups. Furthermore, indicatorgroups composed of species from diverse taxonomicgroups might be expected to perform well as indicatorsif species in those groups respond differently to environ-mental gradients (Pearson 1994; Ricketts et al. 1999). Insupport of this prediction, we found that at-risk species,a taxonomically diverse group in our study, was thebest-performing indicator group overall.
Researchers testing indicators of biodiversity have of-ten come to rather different conclusions (e.g., Prender-gast et al. 1993; Howard et al. 1998; van Jaarsveld et al.1998). The variation in the results of these and otherstudies is driven in part by the differences in the indica-tor groups tested, the scales of the analyses, the meth-ods used to test the indicators, and the areas in whichthe studies were conducted. For example, the differ-ences between the results of our analyses and those ofAndelman and Fagan (2000) result largely from the dif-ferent ways in which indicator performance was evalu-ated in the two studies. Andelman and Fagan ( 2000 )demonstrated the relatively poor performance of smallgroups of at-risk species when they were used to selectsites for other at-risk species. They found that fewgroups performed better than sites selected at random,and those that did required the selection of large per-centages of the study areas. We evaluated the performanceof at-risk species as a whole on all other (not-at-risk) spe-cies and came to the conclusion that they performedwell as an indicator group. The difference in the resultscan be explained largely by the different groups of spe-cies used to measure indicator performance (other at-risk species vs. other species in general ). In concor-
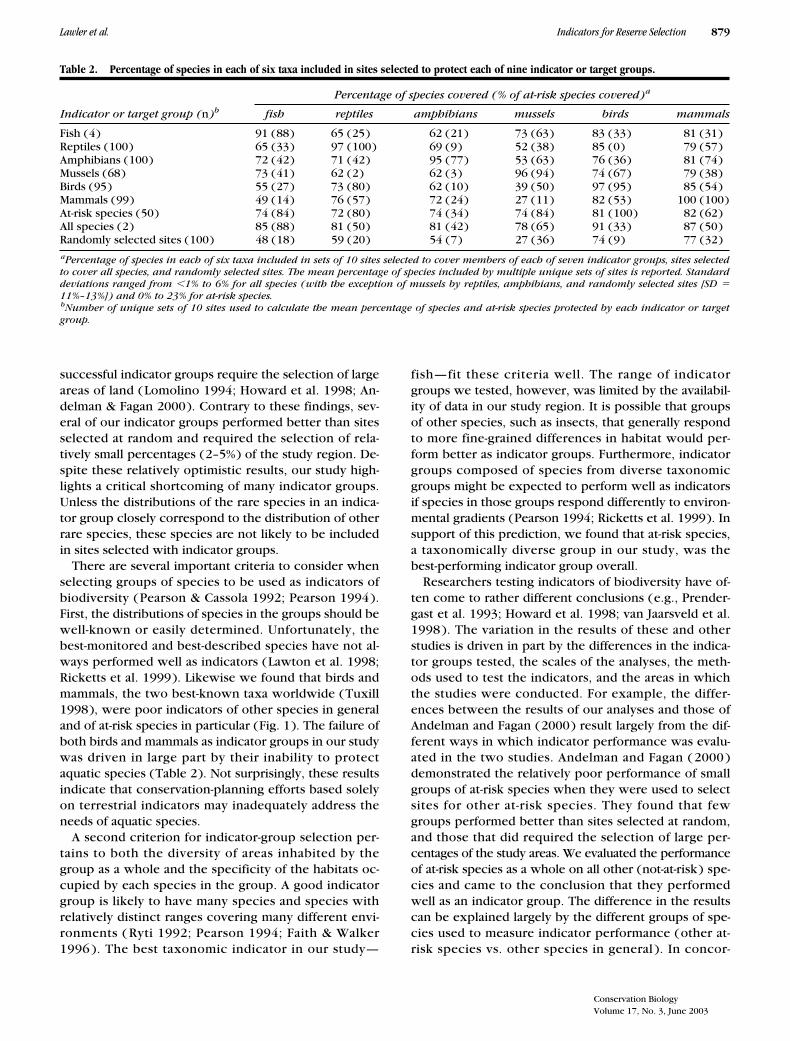
Table 2. Percentage of species in each of six taxa included in sites selected to protect each of nine indicator or target groups.
Percentage of species covered (% of at-risk species covered)
a
Indicator or target group (
n
)
b
fish reptiles amphibians mussels birds mammals
Fish (4) 91 (88) 65 (25) 62 (21) 73 (63) 83 (33) 81 (31)Reptiles (100) 65 (33) 97 (100) 69 (9) 52 (38) 85 (0) 79 (57)Amphibians (100) 72 (42) 71 (42) 95 (77) 53 (63) 76 (36) 81 (74)Mussels (68) 73 (41) 62 (2) 62 (3) 96 (94) 74 (67) 79 (38)Birds (95) 55 (27) 73 (80) 62 (10) 39 (50) 97 (95) 85 (54)Mammals (99) 49 (14) 76 (57) 72 (24) 27 (11) 82 (53) 100 (100)At-risk species (50) 74 (84) 72 (80) 74 (34) 74 (84) 81 (100) 82 (62)All species (2) 85 (88) 81 (50) 81 (42) 78 (65) 91 (33) 87 (50)Randomly selected sites (100) 48 (18) 59 (20) 54 (7) 27 (36) 74 (9) 77 (32)
a
Percentage of species in each of six taxa included in sets of 10 sites selected to cover members of each of seven indicator groups, sites selectedto cover all species, and randomly selected sites. The mean percentage of species included by multiple unique sets of sites is reported. Standarddeviations ranged from
�
1% to 6% for all species (with the exception of mussels by reptiles, amphibians, and randomly selected sites [SD
�
11%–13%]) and 0% to 23% for at-risk species.
b
Number of unique sets of 10 sites used to calculate the mean percentage of species and at-risk species protected by each indicator or targetgroup.
successful indicator groups require the selection of largeareas of land (Lomolino 1994; Howard et al. 1998; An-delman & Fagan 2000). Contrary to these findings, sev-eral of our indicator groups performed better than sitesselected at random and required the selection of rela-tively small percentages (2–5%) of the study region. De-spite these relatively optimistic results, our study high-lights a critical shortcoming of many indicator groups.Unless the distributions of the rare species in an indica-tor group closely correspond to the distribution of otherrare species, these species are not likely to be includedin sites selected with indicator groups.
There are several important criteria to consider whenselecting groups of species to be used as indicators ofbiodiversity (Pearson & Cassola 1992; Pearson 1994).First, the distributions of species in the groups should bewell-known or easily determined. Unfortunately, thebest-monitored and best-described species have not al-ways performed well as indicators (Lawton et al. 1998;Ricketts et al. 1999). Likewise we found that birds andmammals, the two best-known taxa worldwide (Tuxill1998), were poor indicators of other species in generaland of at-risk species in particular (Fig. 1). The failure ofboth birds and mammals as indicator groups in our studywas driven in large part by their inability to protectaquatic species (Table 2). Not surprisingly, these resultsindicate that conservation-planning efforts based solelyon terrestrial indicators may inadequately address theneeds of aquatic species.
A second criterion for indicator-group selection per-tains to both the diversity of areas inhabited by thegroup as a whole and the specificity of the habitats oc-cupied by each species in the group. A good indicatorgroup is likely to have many species and species withrelatively distinct ranges covering many different envi-ronments ( Ryti 1992; Pearson 1994; Faith & Walker1996 ). The best taxonomic indicator in our study—

880
Indicators for Reserve Selection Lawler et al.
Conservation BiologyVolume 17, No. 3, June 2003
dance with Andelman and Fagan (2000), we would pre-dict the failure of subsets of the at-risk species in ourstudy to protect other at-risk species as a result of thelack of congruence in distributions of at-risk species inthe Middle Atlantic region (Fig. 2).
Several additional issues should be considered whenevaluating indicator performance. Indicators are likelyto perform differently in different areas, based on re-gional patterns of species distributions (Ryti 1992; Rick-etts et al. 1999). Thus, the ranking of the performanceof the indicator taxa in our study are likely to hold else-
where only if similar relationships between the patternsof species distributions exist.
The scale of analysis is also likely to affect the conclu-sions drawn about indicator performance. Conservationplanners generally use smaller sites than those in ourstudy. Because at-risk species usually have relativelysmall ranges and occur in restricted habitats, using largesites is likely to artificially increase the ranges of rarespecies relative to those of more common species. Thus,although our estimates of the performance of both taxo-nomic indicators with at-risk species and of at-risk spe-cies indicators with all species may be higher than onewould expect at finer scales, the latter is likely to be af-fected to a lesser degree. Therefore, if our analyses hadbeen conducted using smaller sites, we would probablyhave concluded that indicator taxa provided even lesscoverage for rare species.
Although the at-risk species in our study performedrelatively well as an indicator group, their use in otherregions of the world is likely to be more problematicgiven the inherent difficulty in obtaining informationabout their distributions. In many temperate areaswhere the distributions of rare species are best known,larger groups of these species from diverse taxonomicgroups may serve as successful indicators of more gen-eral patterns of species diversity. Unfortunately, whereindictors are most needed, as in much of the tropics, theexistence, much less the distribution, of many rare spe-cies remains unknown (Groombridge 1992).
Conservation planning is a complex process that mustoften be carried out with limited and heterogeneousknowledge. Although indicator groups may provide a use-ful tool with which to deal with these difficulties, they arenot always likely to be successful. Our results show thatconservation areas selected with terrestrial indicator taxamay provide poor coverage for many aquatic species. Inaddition, if information on the distributions of at-risk spe-cies is not explicitly incorporated into the site-selectionprocess, these species are not likely to be included inconservation areas selected on the basis of indicator taxa.Such a failure to protect at-risk species is likely to result inan accelerated loss of biodiversity (Terborgh & Winter1980). Our results also suggest, however, that in those ar-eas where data on distributions of at-risk species are avail-able, these species are good candidate indicators for se-lecting sites to preserve species diversity.
Acknowledgments
We thank D. Guerry, D. Pearson, D. Stoms, J. Van Sickle,and one anonymous reviewer for providing thoughtfulcomments that greatly improved the manuscript. In ad-dition, we thank B. Smith and the U.S. EnvironmentalProtection Agency’s Regional Vulnerability Assessmentprogram (ReVA) for funding this research. This work
Figure 2. Distributions of at-risk species for six ani-mal taxa: (a–f) the number of at-risk species recorded in each of 487 hexagonal sample units in the Middle Atlantic region of the United States and (g) the num-ber of taxa with at least one at-risk species occurring in each hexagon.

Conservation BiologyVolume 17, No. 3, June 2003
Lawler et al. Indicators for Reserve Selection
881
was performed while J. L. was a research associate of theNational Research Council at the U.S. EnvironmentalProtection Agency (EPA) in Corvallis, Oregon (U.S.A.).It has been funded wholly by the EPA, subjected to re-view by the National Health and Environmental EffectsResearch Laboratory’s Western Ecology Division, and ap-proved for publication. Approval does not signify thatthe contents reflect the views of the agency, and themention of trade names or commercial products doesnot constitute endorsement or recommendation for use.
Literature Cited
Andelman, S. J., and W. F. Fagan. 2000. Umbrellas and flagships: effec-tive conservation surrogates or expensive mistakes? Proceedings ofthe National Academy of Science of the United States of America
97:
5954–5959.Church, R. L., D. M. Stoms, and F. W. Davis. 1996. Reserve selection as
a maximal covering location problem. Biological Conservation
76:
105–112.Cocks, K. D., and I. A. Baird. 1989. Using mathematical programming
to address the multiple reserve selection problem: an examplefrom the Eyre Peninsula, South Africa. Biological Conservation
49:
113–130.
Csuti, B., S. Polasky, P. H. Williams, R. L. Pressey, J. D. Camm, M. Ker-shaw, A. R. Kiester, B. Downs, R. Hamilton, M. Huso, and K. Sahr.1997. A comparison of reserve selection algorithms using data onterrestrial vertebrates in Oregon. Biological Conservation
80:
83–97.Dobson, A. P., J. P. Rodriguez, W. M. Roberts, and D. S. Wilcove. 1997.
Geographic distribution of endangered species in the UnitedStates. Science
2275:
550–553.Faith, D. P., and P. A. Walker. 1996. How do indicator groups provide
information about the relative biodiversity of different sets of ar-eas?: On hotspots, complementarity and pattern-based approaches.Biodiversity Letters
3:
18–25.Flather, C. H., K. R. Wilson, D. J. Dean, and W. C. McComb. 1997. Iden-
tifying gaps in conservation networks: of indicators and uncertaintyin geographic-based analyses. Ecological Applications
7:
531–542.Groombridge, B. 1992. Global biodiversity
.
Chapman and Hall, London.Howard, P. C., P. Viskanic, T. R. B. Davenport, F. W. Kigenyi, M. Baltzer,
C. J. Dickinson, J. S. Lwanga, R. A. Matthews, and A. Balmford.1998. Complementarity and the use of indicator groups for reserveselection in Uganda. Nature
394:
472–475.Kerr, J. T. 1997. Species richness, endemism, and the choice of areas
for conservation. Conservation Biology
11:
1094–1100.Kirkpatrick, S., C. D. Gelatt, and M. P. Vecchi. 1983. Optimization by
simulated annealing. Science
220:
671–680.Kremen, C. 1992. Assessing the indicator properties of species assem-
blages for natural areas monitoring. Ecological Applications
2:
203–217.Lawton, J. H., D. E. Bignell, B. Bolton, G. F. Bloemers, P. Eggleton,
P. M. Hammond, M. Hodda, R. D. Holt, T. B. Larsen, N. A. Mawds-
Figure 3. (a–f) The relationship between the probability of inclusion in a set of sites selected to cover each of six indicator groups and the extent of a species’ range within the study area. Each point represents one species. Be-cause nonindicator species were used in each analysis, the number of species (n) is different for each indicator group. The probability of inclusion is represented by the proportion of sets of sites, selected to cover all members of each of the six taxonomic indicator groups, that contained the species.
882
Indicators for Reserve Selection Lawler et al.
Conservation BiologyVolume 17, No. 3, June 2003
ley, N. E. Stork, D. S. Srivastava, and A. D. Watt. 1998. Biodiversityinventories, indicator taxa and effects of habitat modification intropical forest. Nature
391:
72–76.Lombard, A. T. 1995. The problems with multi-species conservation:
do hotspots, ideal reserves, and existing reserves coincide? SouthAfrican Journal of Zoology
30:
145–163.Lomolino, M. V. 1994. An evaluation of alternative strategies for building
networks of nature reserves. Biological Conservation
69:
243–249.Margules, C. R., I. D. Cresswell, and A. O. Nicholls. 1994. A scientific basis
for establishing networks of protected areas. Pages 327–350 in P. L.Forey, C. J. Humphries, and R. I. Vane-Wright, editors. Systematics andconservation evaluation. Clarendon Press, Oxford, United Kingdom.
Master, L. L. 1991. Assessing threats and setting priorities for conserva-tion. Conservation Biology
5:
559–563.Master, L. L. 1996. Predicting distributions of vertebrate species: some
observations. Pages 171–176 in J. M. Scott, T. H. Tear, and F. W.Davis, editors. Gap analysis: a landscape approach to biodiversityplanning. American Society for Photogrammetry and Remote Sens-ing, Bethesda, Maryland.
Pearson, D. L. 1994. Selecting indicator taxa for the quantitative assess-ment of biodiversity. Philosophical Transactions of the Royal Soci-ety of London B
345:
75–79.Pearson, D. L., and F. Cassola. 1992. World-wide species richness patterns
of tiger beetles (Coleoptera: Cicindelidae): indicator taxon for biodi-versity and conservation studies. Conservation Biology
6:
376–391.Possingham, H., I. Ball, and S. Andelman. 2000. Mathematical methods
for identifying representative reserve networks. Pages 291–305 inS. Ferson and M. Burgman, editors. Quantitative methods for con-servation biology. Springer-Verlag, New York.
Prendergast, J. R., R. M. Quinn, J. H. Lawton, B. C. Eversham, andD. W. Gibbons. 1993. Rare Species, the coincidence of diversityhotspots and conservation strategies. Nature
365:
335–337.
Pressey, R. L., H. R. Possingham, and J. R. Day. 1997. Effectiveness ofalternative heuristic algorithms for identifying indicative minimumrequirements for conservation reserves. Biological Conservation
80:
207–219.Raven, P. H., and E. O. Wilson. 1992. A fifty-year plan for biodiversity
surveys. Science
258:
1099–1100.Ricketts, T. H., E. Dinerstein, D. M. Olson, and C. Loucks. 1999. Who’s
where in North America. BioScience
49:
369–381.Ryti, R. T. 1992. Effect of the focal taxon on the selection of nature re-
serves. Ecological Applications
2:
404–410.Syrjala, S. E. 1996. A statistical test for a difference between the spatial
distributions of two populations. Ecology
77:
75–80.Terborgh, J., and B. Winter. 1980. Some causes of extinction. Pages
119–133 in M. Soulé and B. Wilcox, editors. Conservation biology:an evolutionary-ecological perspective
.
Sinauer, Sunderland, Massa-chusetts.
Tuxill, J. 1998. Losing strands in the web of life: vertebrate declinesand the conservation of biological diversity. World Watch paper141. World Watch Institute, Washington, D.C.
Underhill, L. G. 1994. Optimal and suboptimal reserve selection algo-rithms. Biological Conservation
70:
85–87.van Jaarsveld, A. S., S. Freitag, S. L. Chown, C. Muller, S. Koch, H. Hull,
C. Bellamy, M. Krüger, S. Endrödy-Younga, M. W. Mansell, andC. H. Scholtz. 1998. Biodiversity assessment and conservation strat-egies. Science
279:
2106–2108.Wessels, K. J., S. Freitag, and A. S. van Jaarsveld. 1999. The use of land
facets as biodiversity surrogates during reserve selection at a localscale. Biological Conservation
89:
21–38.White, D., A. J. Kimerling, and W. S. Overton. 1992. Cartographic and
geometric components of a global sampling design for environ-mental monitoring. Cartography and Geographic Information Sys-tems
19:
5–12.